After another busy week of earnings, equities continue to look strong in their “Go” trend. With about half of U.S. companies having reported with the vast majority beating estimates, there are certainly reasons to be bullish on the economy. However, it is May 1st, and there is that old adage “sell in May and go away”. Many believe that stocks will underperform May through October. I’ll leave you to look up whether that is statistically accurate. We still see strong “Go” trends in Equities and Commodities and “NoGo” trends in Treasuries and the Dollar. No change on that front.
“Anyone can hold the helm when the sea is calm.”
 - Publilius Syrus
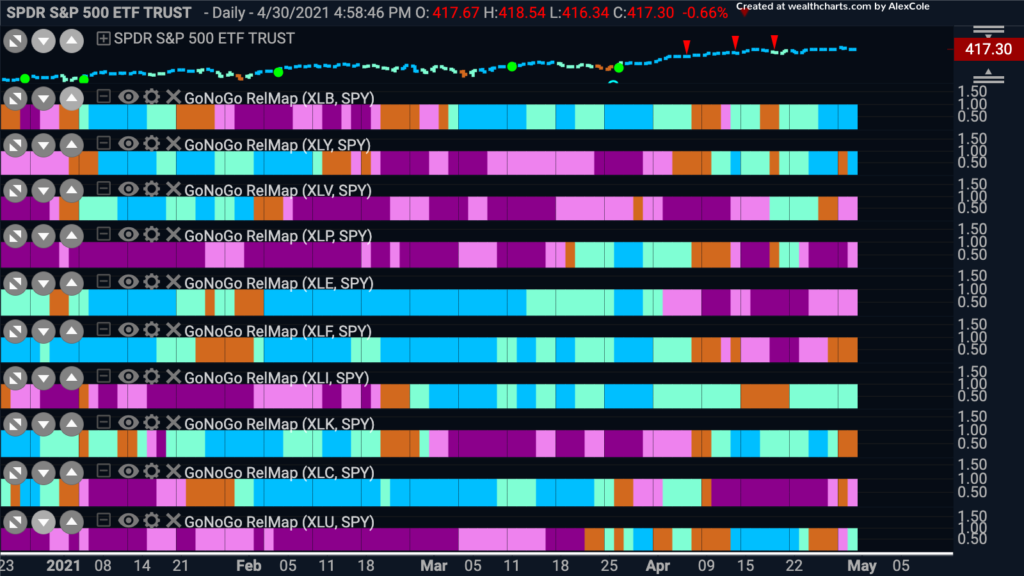
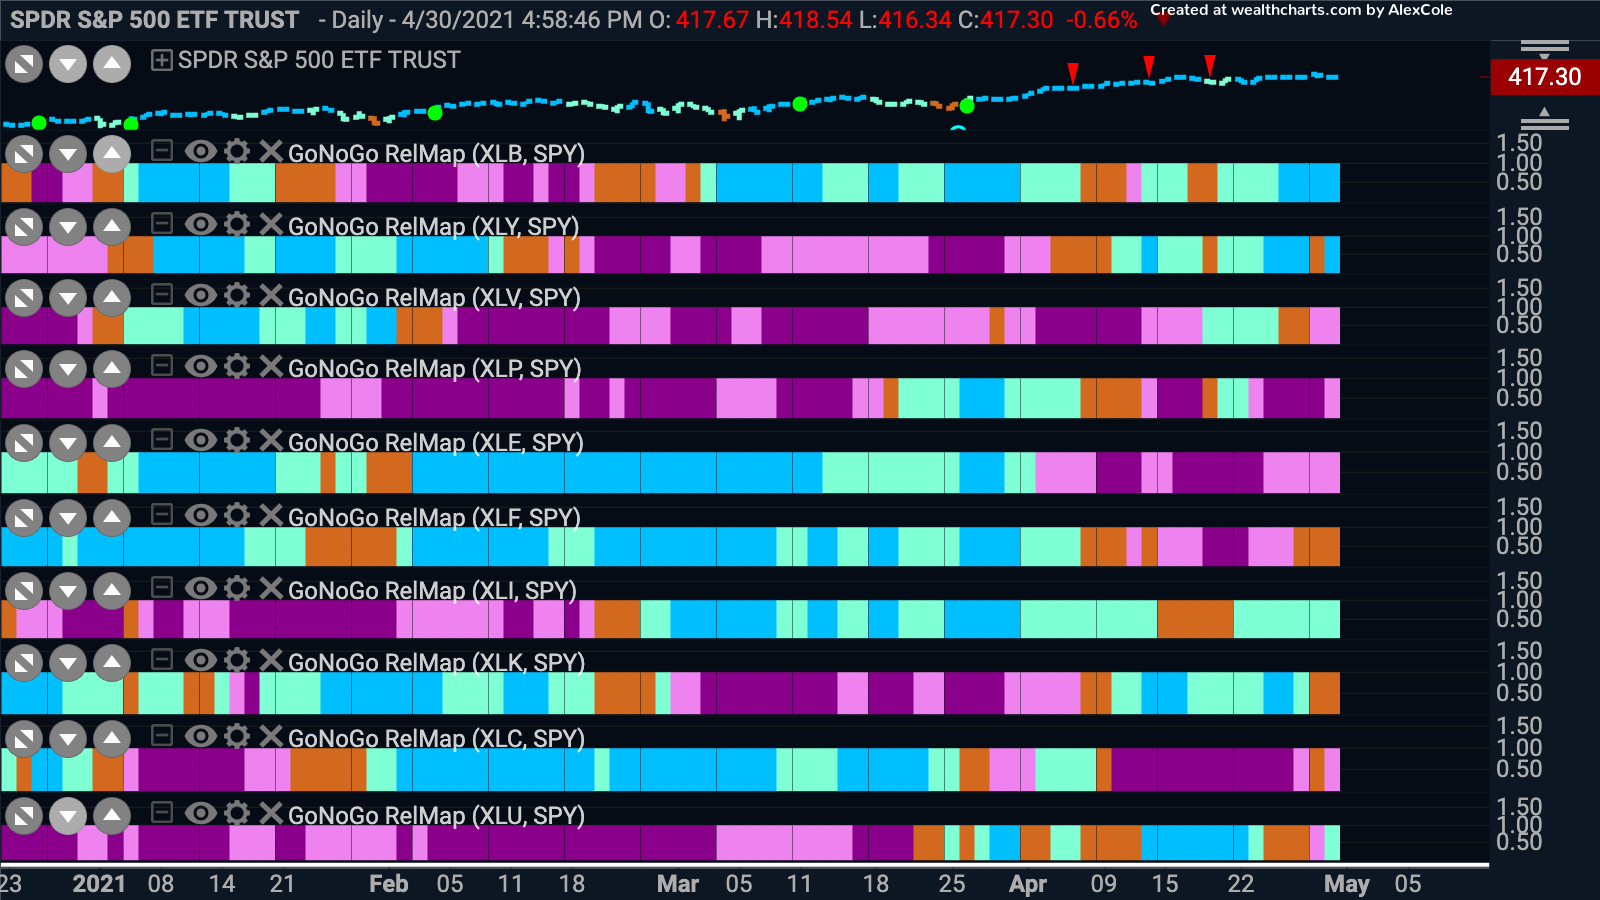
The GoNoGo Sector RelMap shows that within equities there are relative trends to be found. Materials and Industrials remain in “Go” trends as we anticipate continued re-opening of the economy.

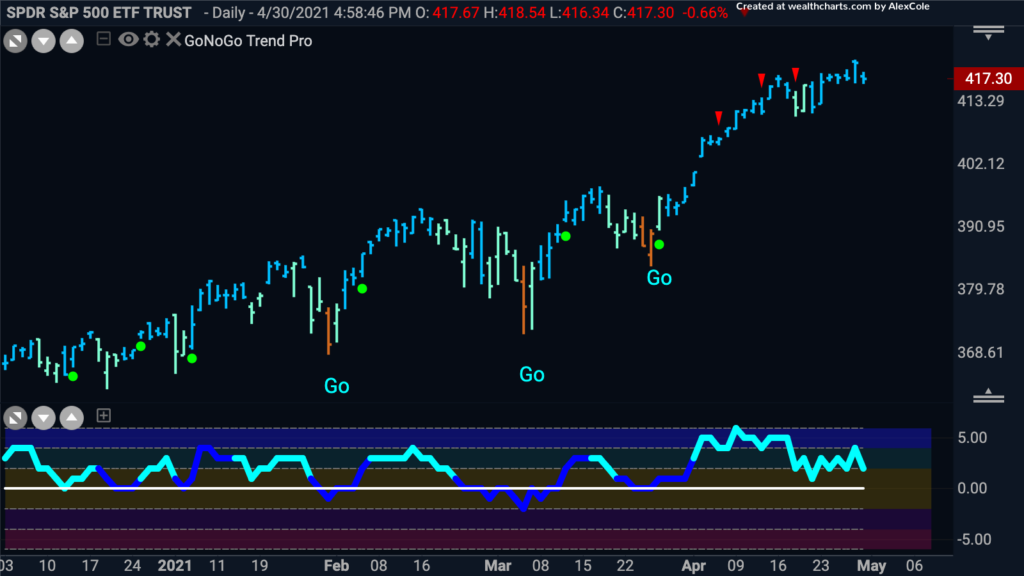
The chart below shows the GoNoGo Trend and Oscillator applied to the $SPY. It was another strong week as prices were able to maintain levels at or above prior high. The Oscillator is in positive territory but not overbought.

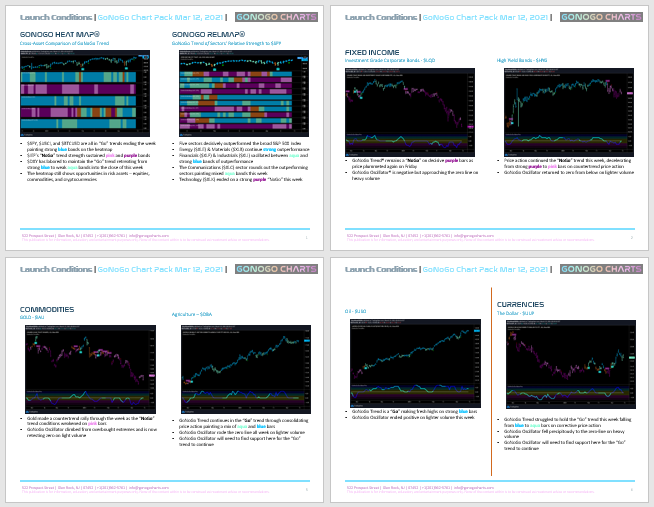
This is your weekly review of market trends across global indices and all asset classes. We hope you take a minute this weekend to flip through all 16 charts to get a sense of the bigger picture before getting back to another hectic trading week.
Click here to open your Launch Conditions Chart Pack.


