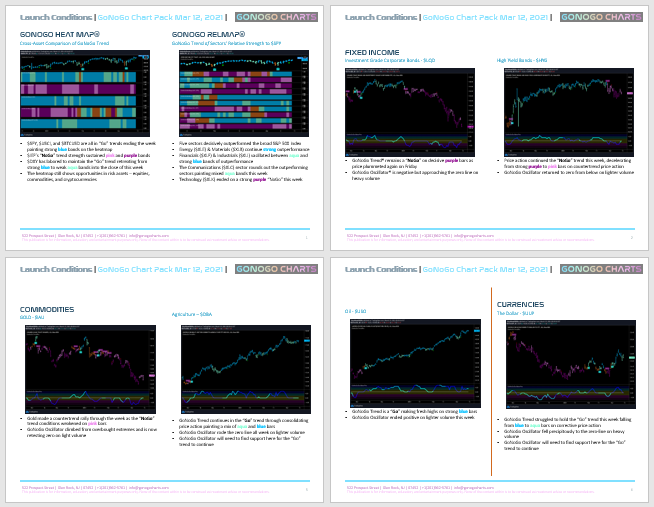
An early rally last week gave way to selling pressure which resulted in large-cap US equity indices ending the week negative. The S&P 500 and Nasdaq composite both lost around 2%. Within your chart pack below, a GoNoGo HeatMap® highlights that commodities are the asset class leader. Interestingly, Bitcoin is finally striking “Go” conditions on the daily timeframe as well. Welcome to your weekend edition of Launch Conditions from GoNoGo Research.
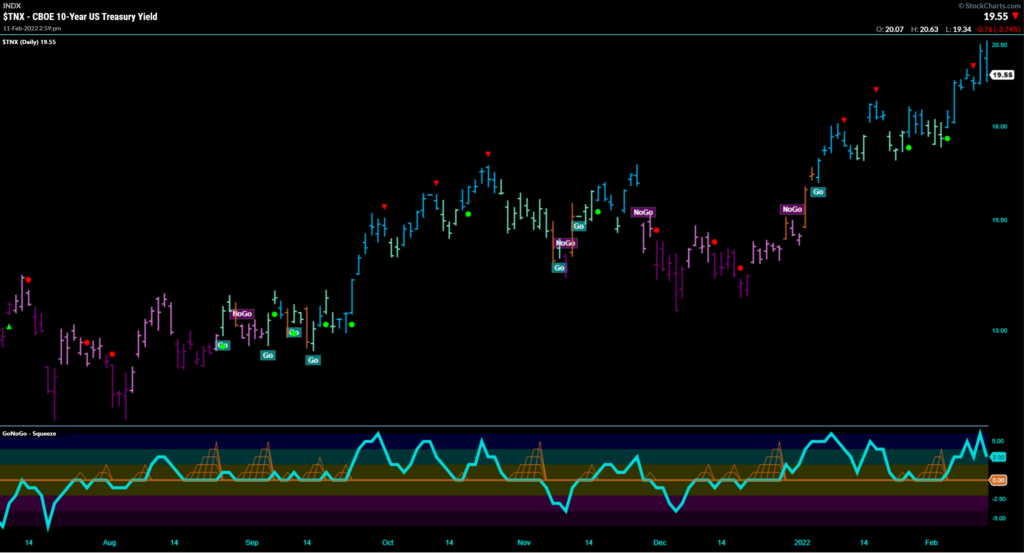
Thursday morning Feb 10, 2022, markets reacted sharply to CPI data reporting that inflation jumped 7.5% yr/yr. This was more than economists expected, represented the largest gain in 40 yrs, as well as acceleration from the 7.0% year-over-year increase seen in December. The $TLT chart shows the continued selloff in government treasuries that drive an (inverse) rally in the yields. Notably, ten-year yields broke out above 2% as the $TNX paints strong “Go” trend conditions (see chart below).

Stay tuned Monday for Flight Path where GoNoGo Charts will look through the Financials and Energy sectors as well as the specific areas of the commodities arena showing strong relative and absolute Go trends in this rising rate environment.
It goes without saying, we know less than nothing about geopolitical turmoil or the chatter behind closed doors between Fed Governors, but charts?! Charts can help us make sense of a nonsensical world. Rather than fall prey to the manic and sensational narrative of financial media’s 24 hr news cycle, the chart pack below will provide perspective on the trends across asset classes and global markets. Take a minute to review your Launch Conditions chart pack- GoNoGo LC 021322 – to see the bigger picture trends:


