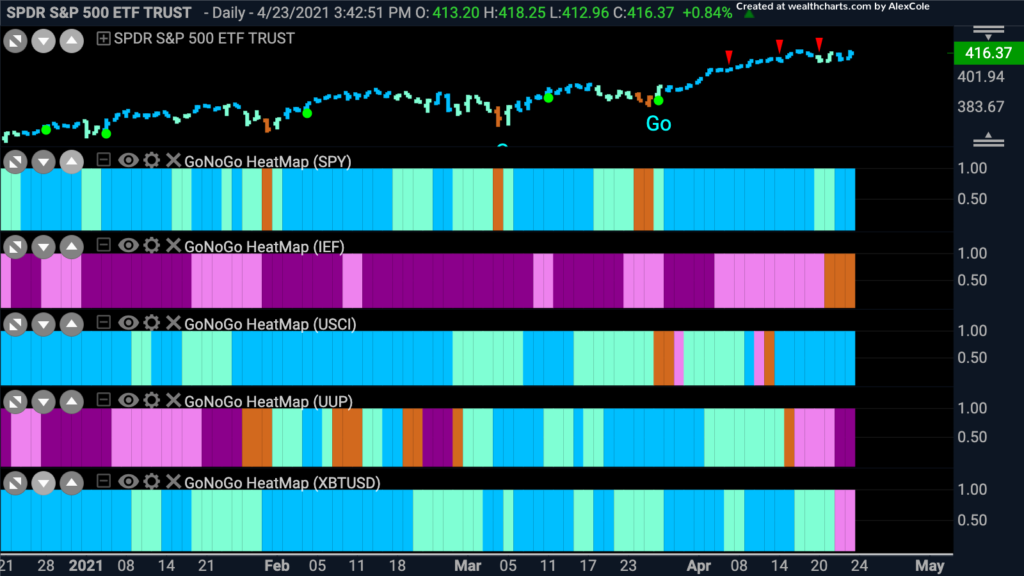
Another week, continued “Go” trend in equity prices. At the end of yesterday, 20% of U.S. companies had reported earnings with strong performance year over year. EPS estimates were also generally beaten and so things look good for the economy as a whole. Was this priced into stock prices already as there was no new high this week? We almost come to expect weekly all-time highs! Commodities continued to show strong “Go” trend conditions and perhaps that is to be expected with the weakening of the dollar we saw this week as it rolled into a “NoGo”. Did I mention Bitcoin dropped out of a “Go” trend into a “NoGo” this week? This is the first crack in the armor of the crypto behemoth that we’ve seen since last fall. As we suggested last week though, other digital asses such as Ethereum are outperforming Bitcoin on a relative basis.
“ultimately, it is the dollar-weighted collective opinion of all market
participants that determines whether a stock goes up or down.
This consensus is revealed by analyzing price.”
 - Mark Abraham
The GoNoGo Cross Asset Map below shows the above mentioned moves in the major asset classes. The last panel shows Bitcoin’s move into a “NoGo” trend.

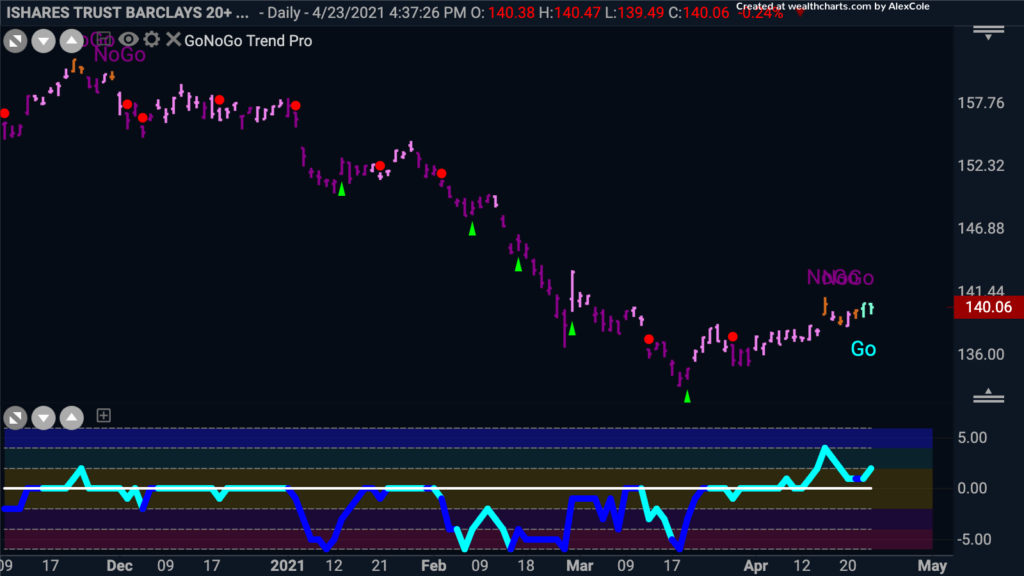
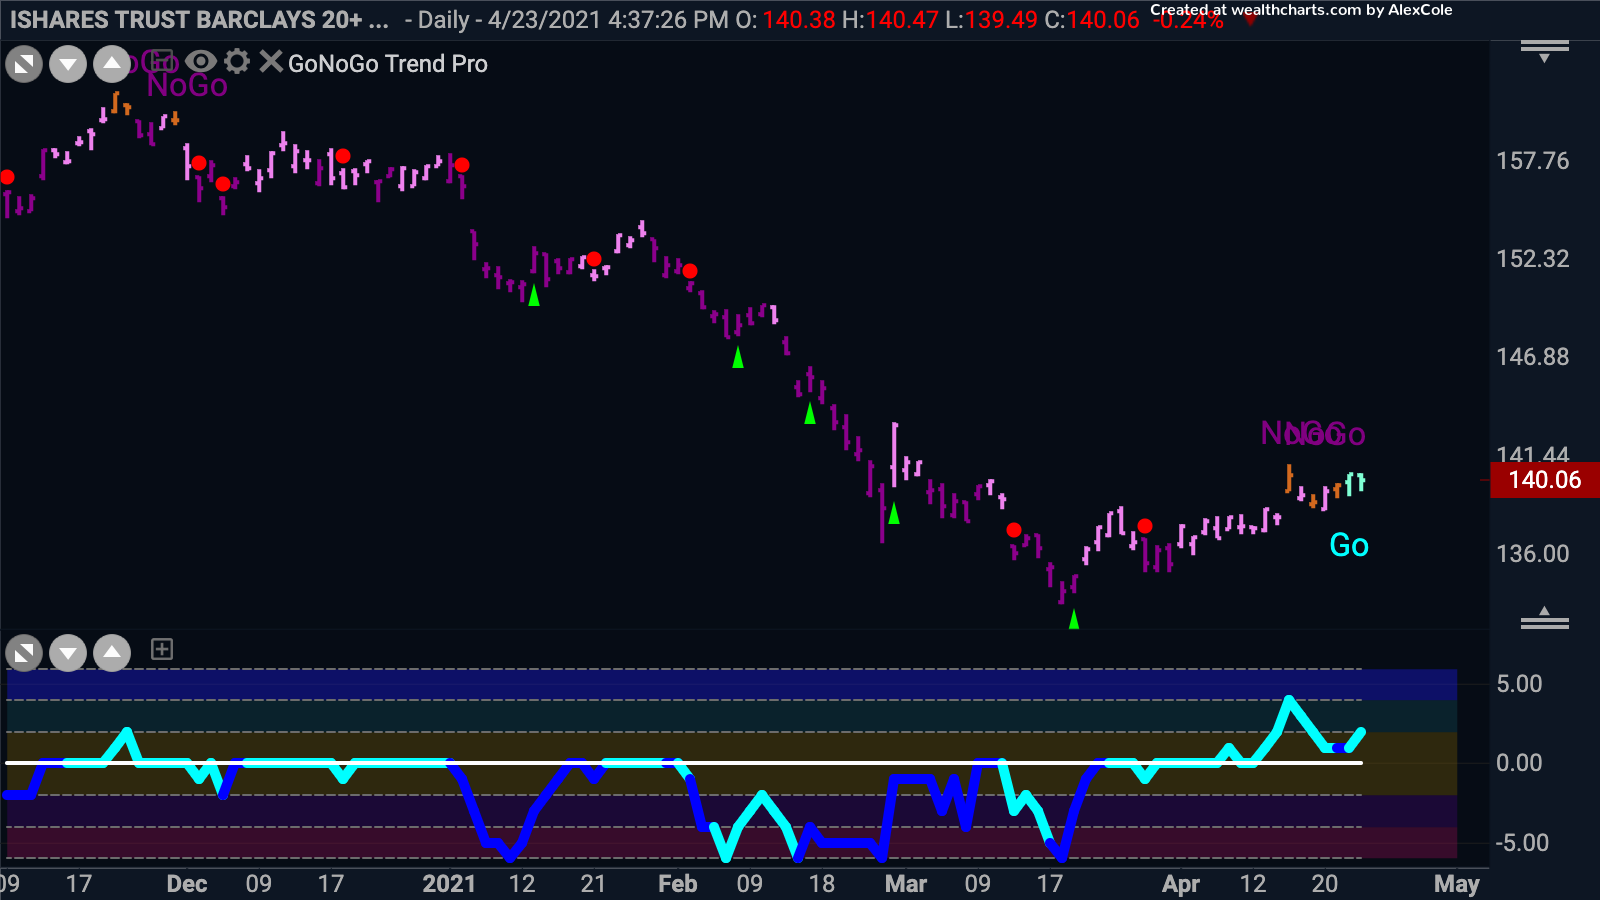
Investment grade bonds, Treasuries and Gold all this week showed budding new “Go” trends that we will watch to see if they can turn into fully fledged moves higher. Does this represent some investor concern and a potential flight to safety? The chart below is the GoNoGo Daily Chart of $TLT.

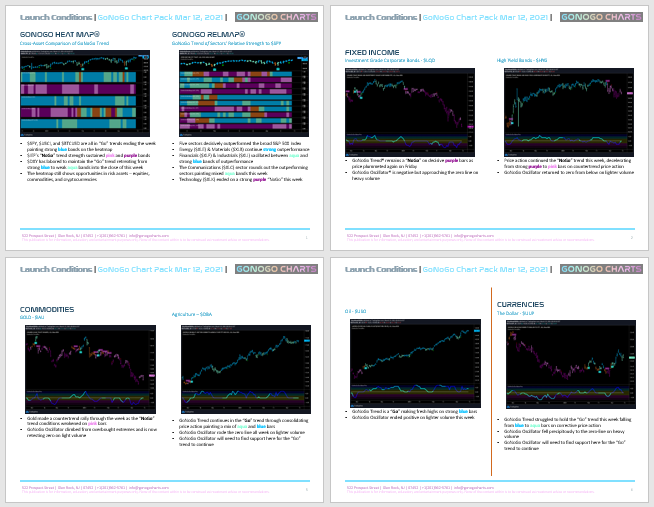
This is your weekly review of market trends across global indices and all asset classes. We hope you take a minute this weekend to flip through all 16 charts to get a sense of the bigger picture before getting back to another hectic trading week.
Click here to open your Launch Conditions Chart Pack.


