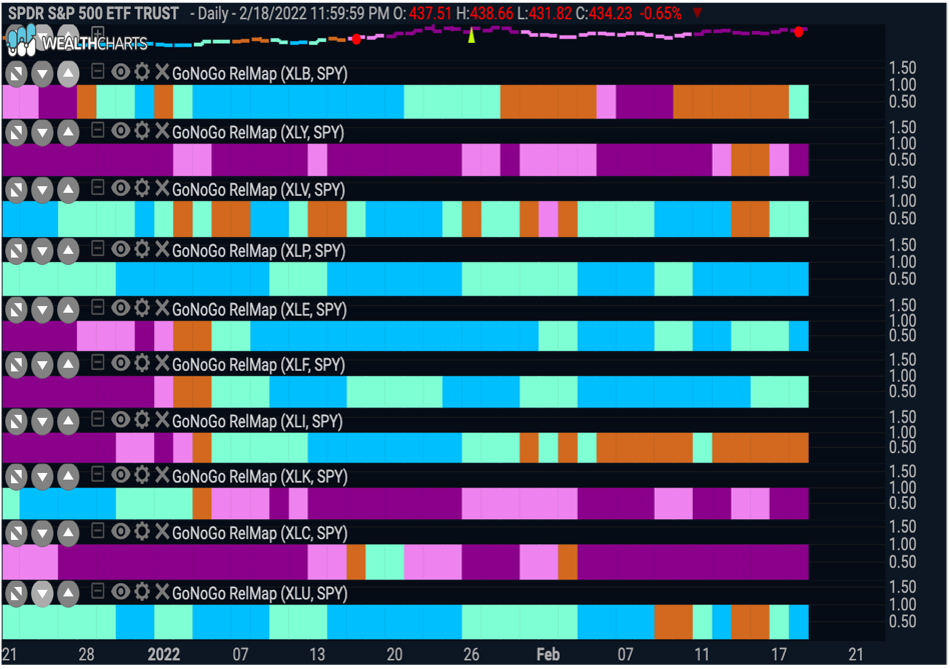
Welcome to your weekly GoNoGo Launch Conditions Chart Pack. We take a look at the major market trends across all asset classes to give an overall, technical view of market conditions. The U.S. domestic markets have struggled again this week after a promising rally off the January 24th lows. The GoNoGo Sector RelMap below shows the relative performance of the S&P sectors against the base index with the GoNoGo Trend applied to that ratio and then visualized using colored panels. There is relative outperformance here and it is still being driven by the cyclical, defensive sectors. We see materials coming back into an aqua “Go” trend, to join healthcare, staples, energy, financials and utilities. Dragging the index lower are the discretionary, technology and communications sectors, all in strong “NoGo” trends on a relative basis.
To access this week’s Launch Conditions click here
It’s important to take a step back and assess whether the stories match the price trends. The GoNoGo Trend and Oscillator are applied across the major asset classes to give a complete technical picture of trend and momentum. Click here
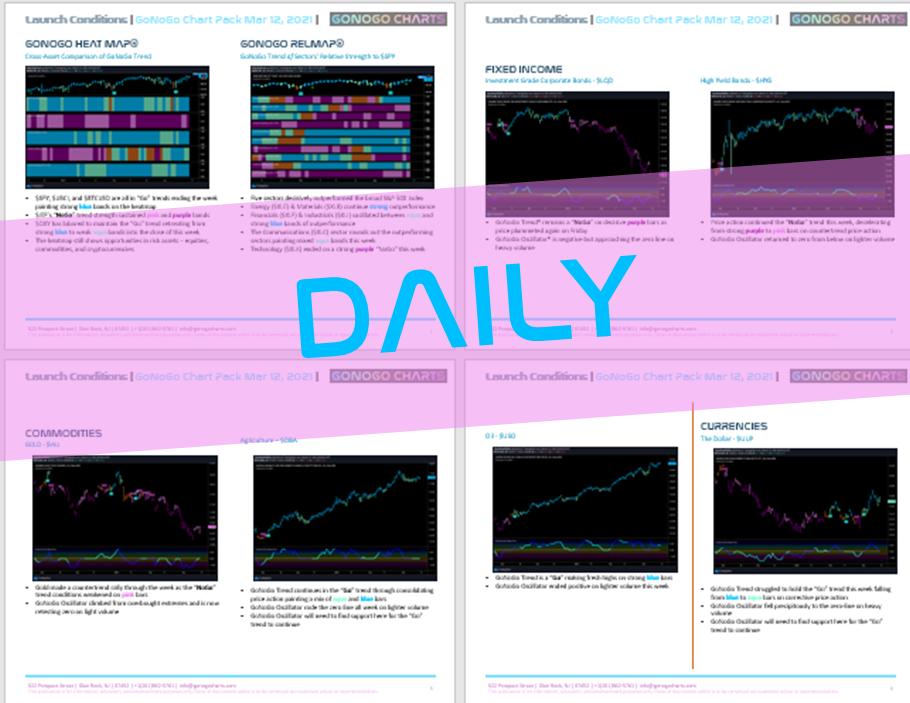
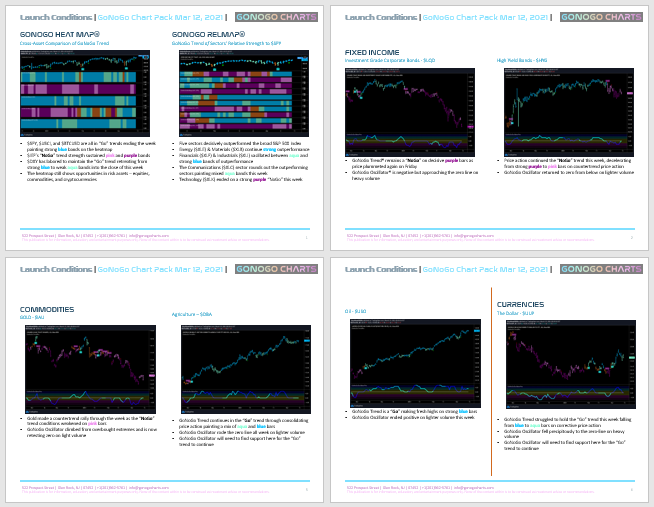
Flip through your weekly Launch Conditions chart pack below


