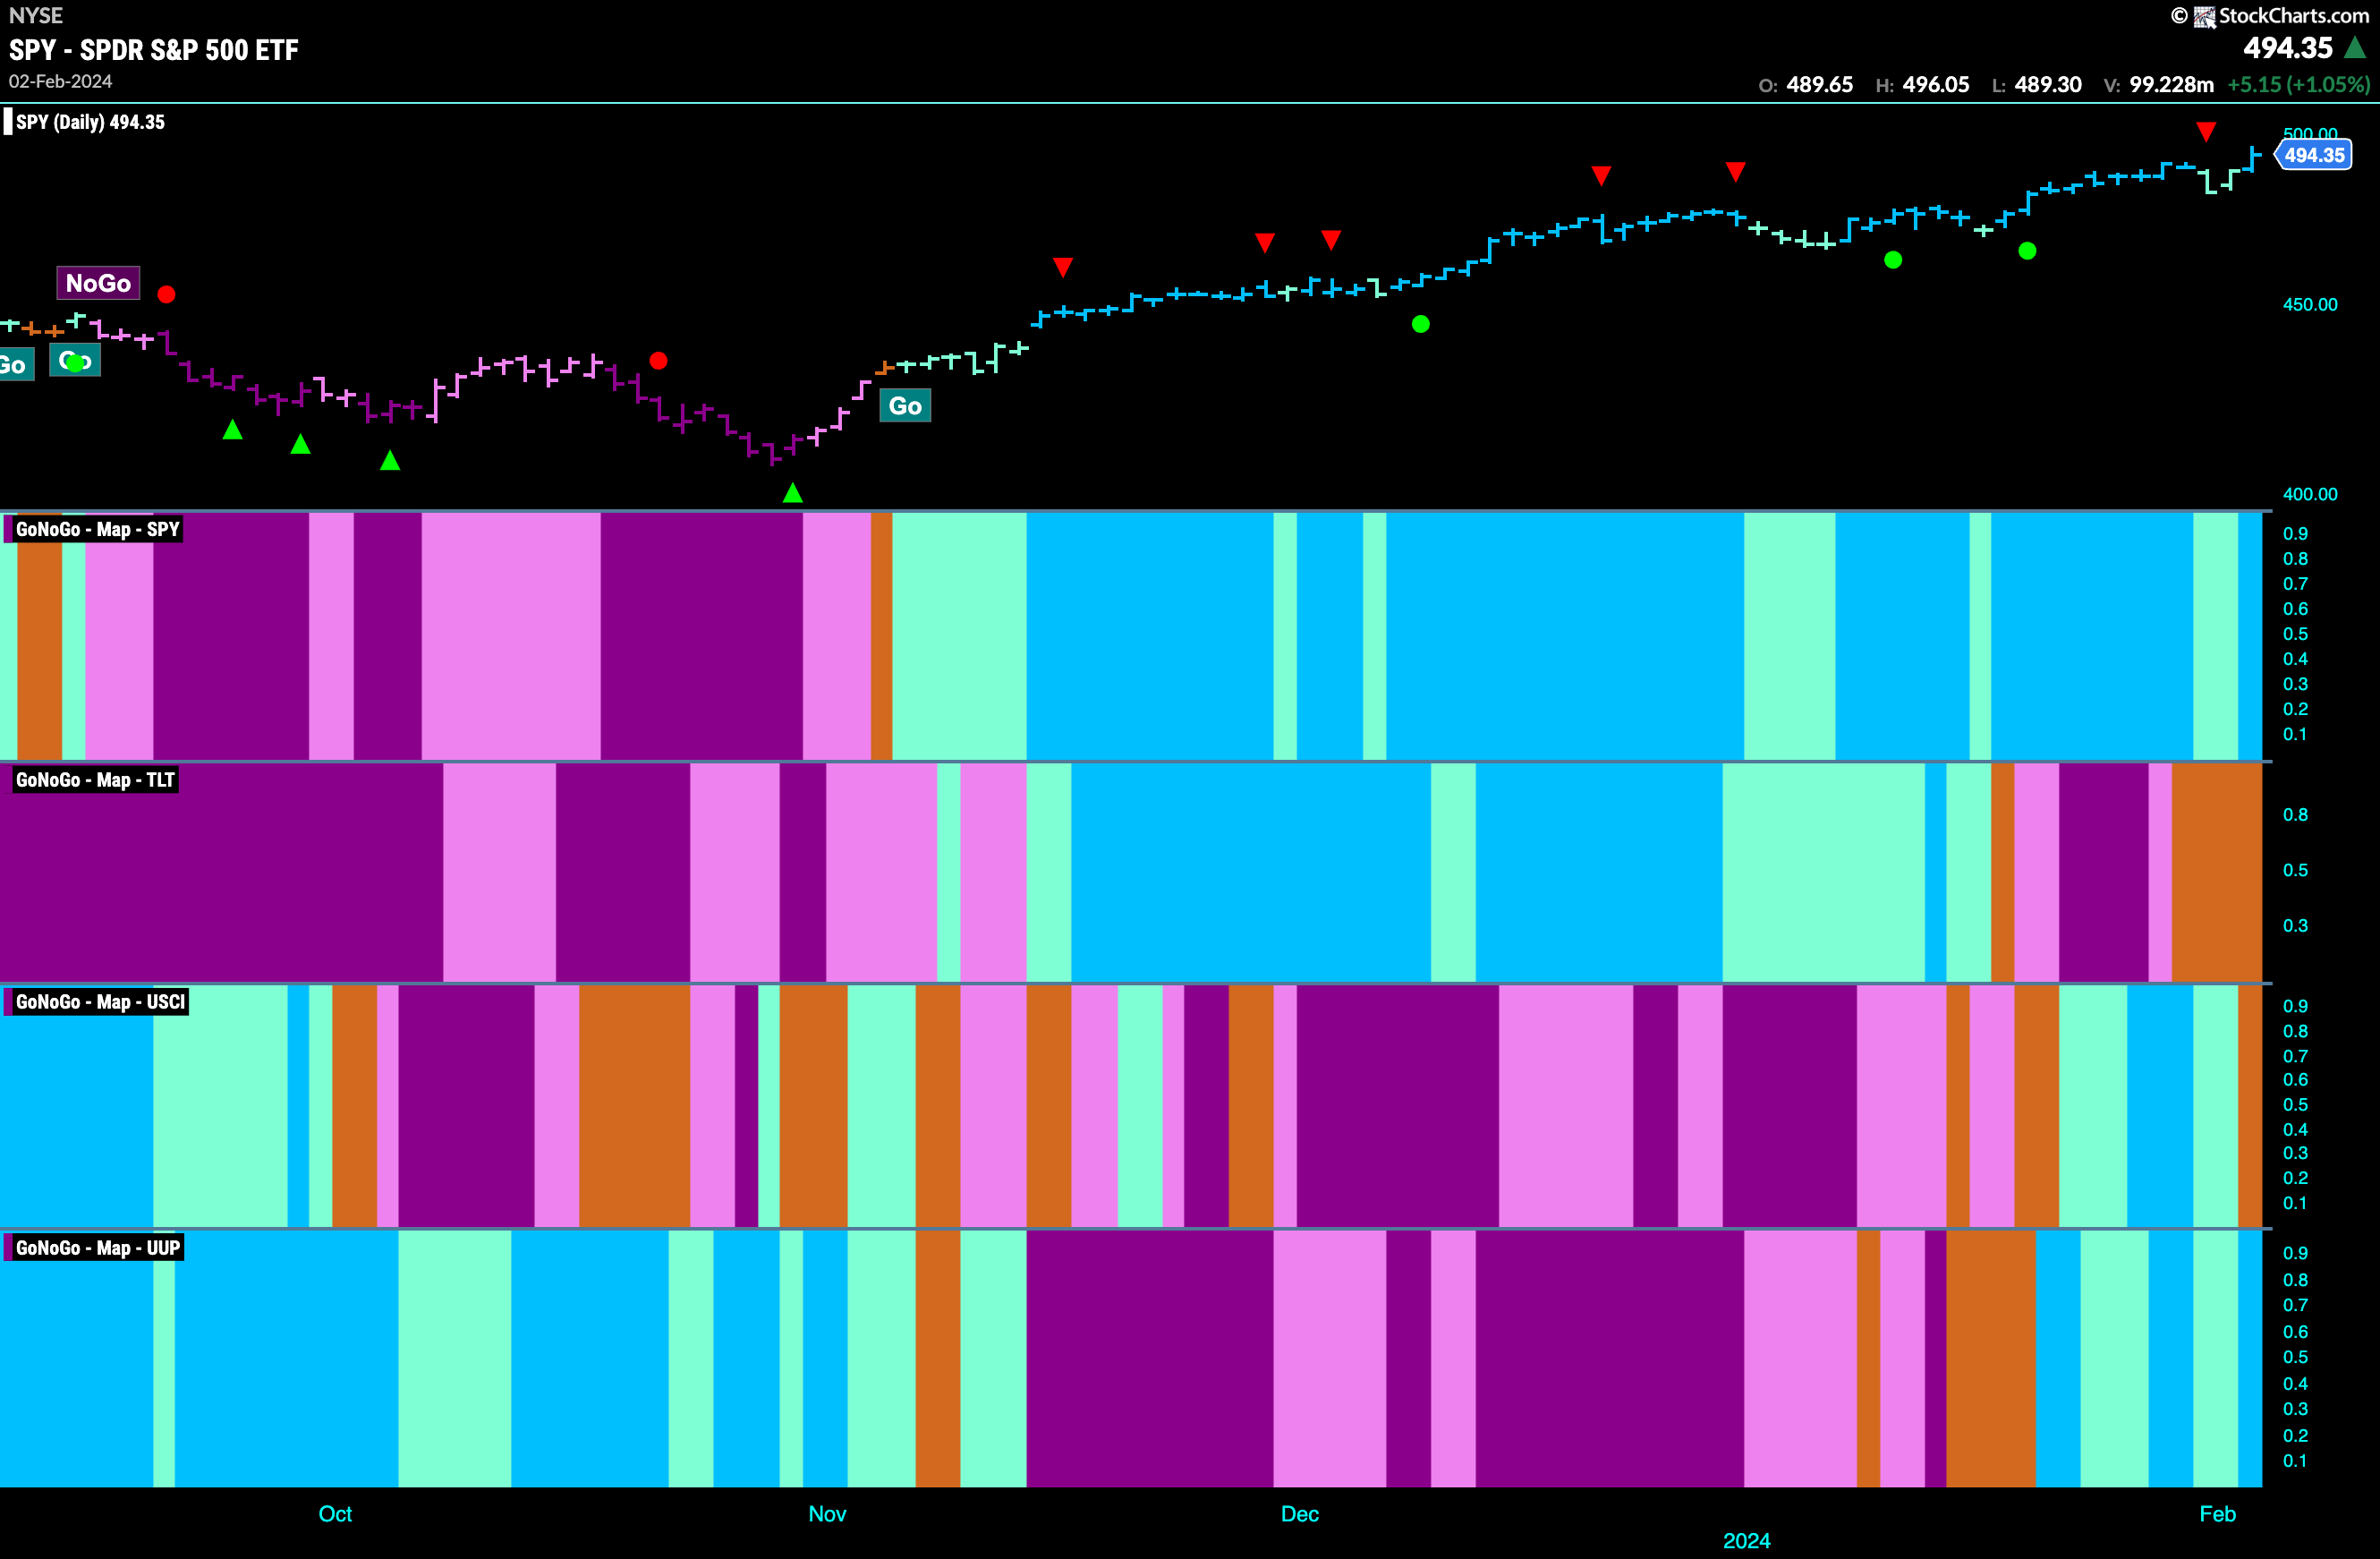
Good morning and welcome to this week’s Flight Path. Equities weakened a little mid week but then found strength on Friday as GoNoGo Trend painted a strong blue “Go” bar. Treasury bond prices continued to show uncertainty as we saw almost a whole week of amber “Go Fish” bars. The U.S. commodity index fell out of its new “Go” trend as well with an amber bar. We will watch to see if this is temporary or if a return to the “NoGo” is imminent. The dollar, in the lowest panel, saw the “Go” trend persist this week and ended with a strong blue “Go” bar.
U.S. Equities Powers Higher
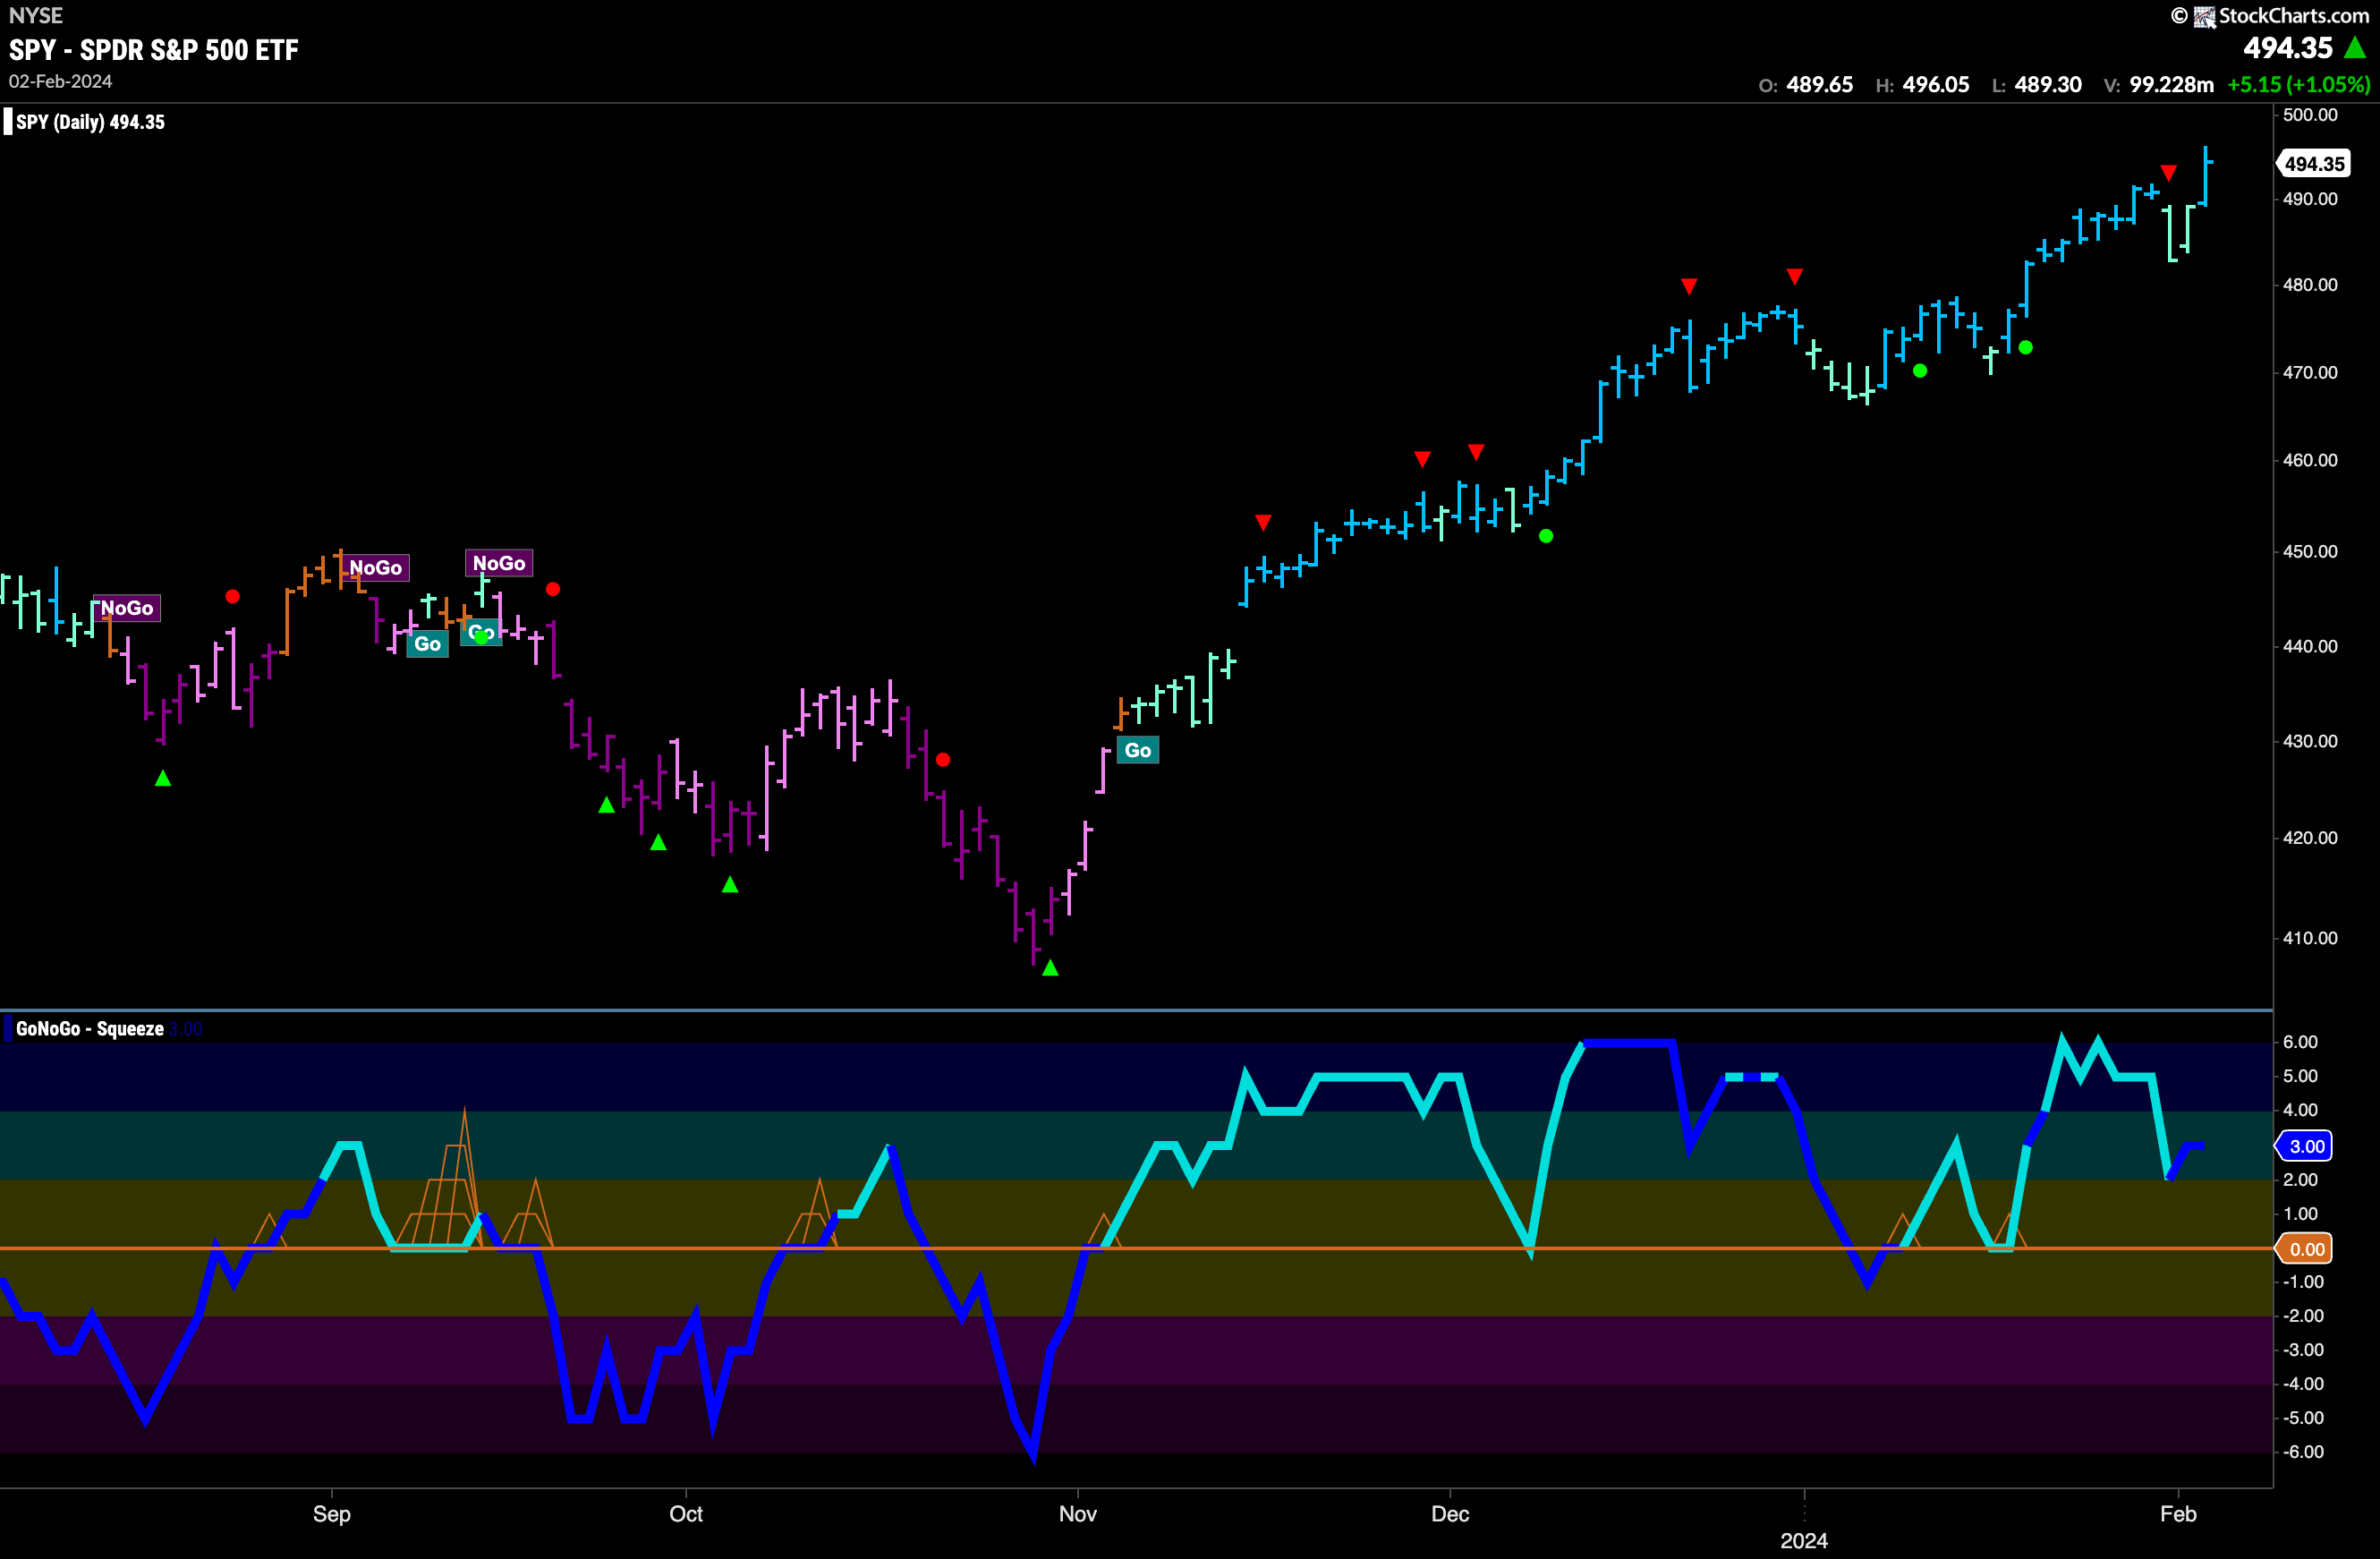
After a mid week wobble we saw the bulls come back in force on Friday. Two weaker aqua bars were followed by a strong blue “Go” bar that ended the week at another new higher high. We can see that GoNoGo Oscillator halted its fall toward the zero line as well and is now at a value of 3 and volume is heavy. We will look to see if price can consolidate at this new high this week or if it pulls back from here. If it does, we will turn our eyes to the Oscillator and watch for support at the zero line.
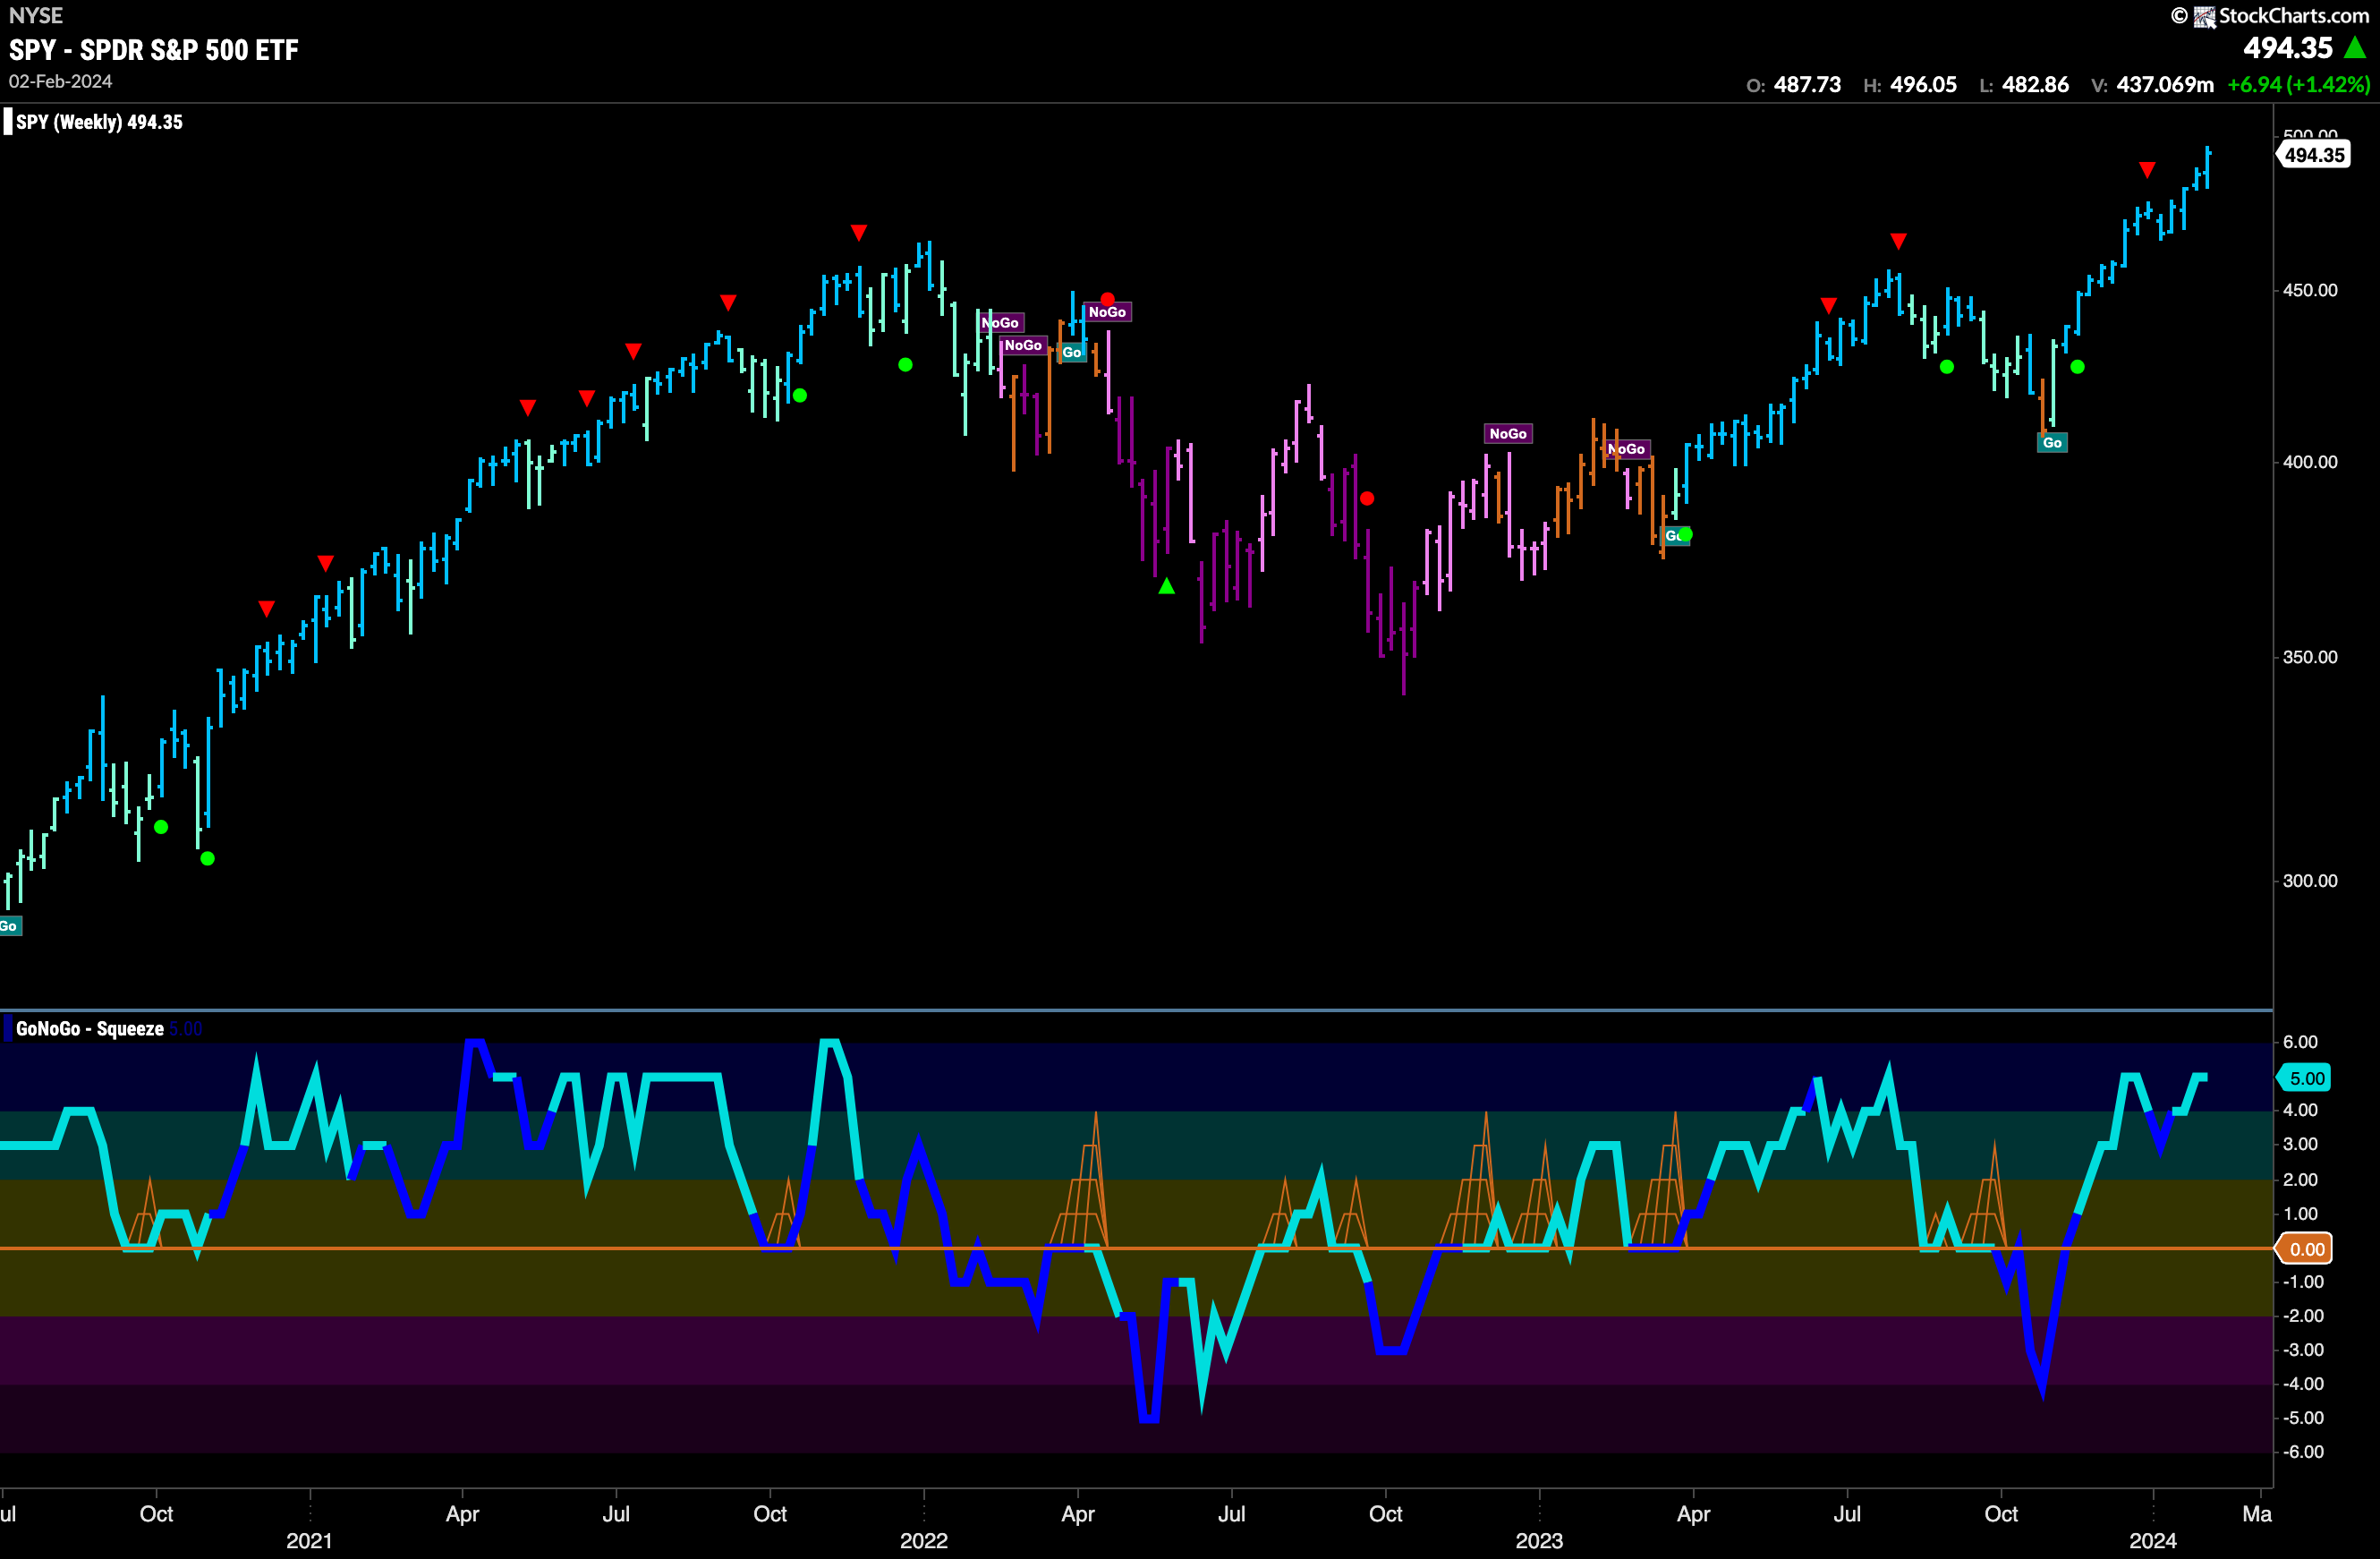
The weekly chart continues to show nothing but strength. With another strong blue “Go” bar at all time highs, and GoNoGo Oscillator back into overbought territory we are seeing market enthusiasm for the broad U.S. index. We will look later at where the strength is coming from and if it is healthily distributed across sectors when we take a look at the GoNoGo Sector RelMap.
New “Go” Fails Fast and “NoGo” Returns
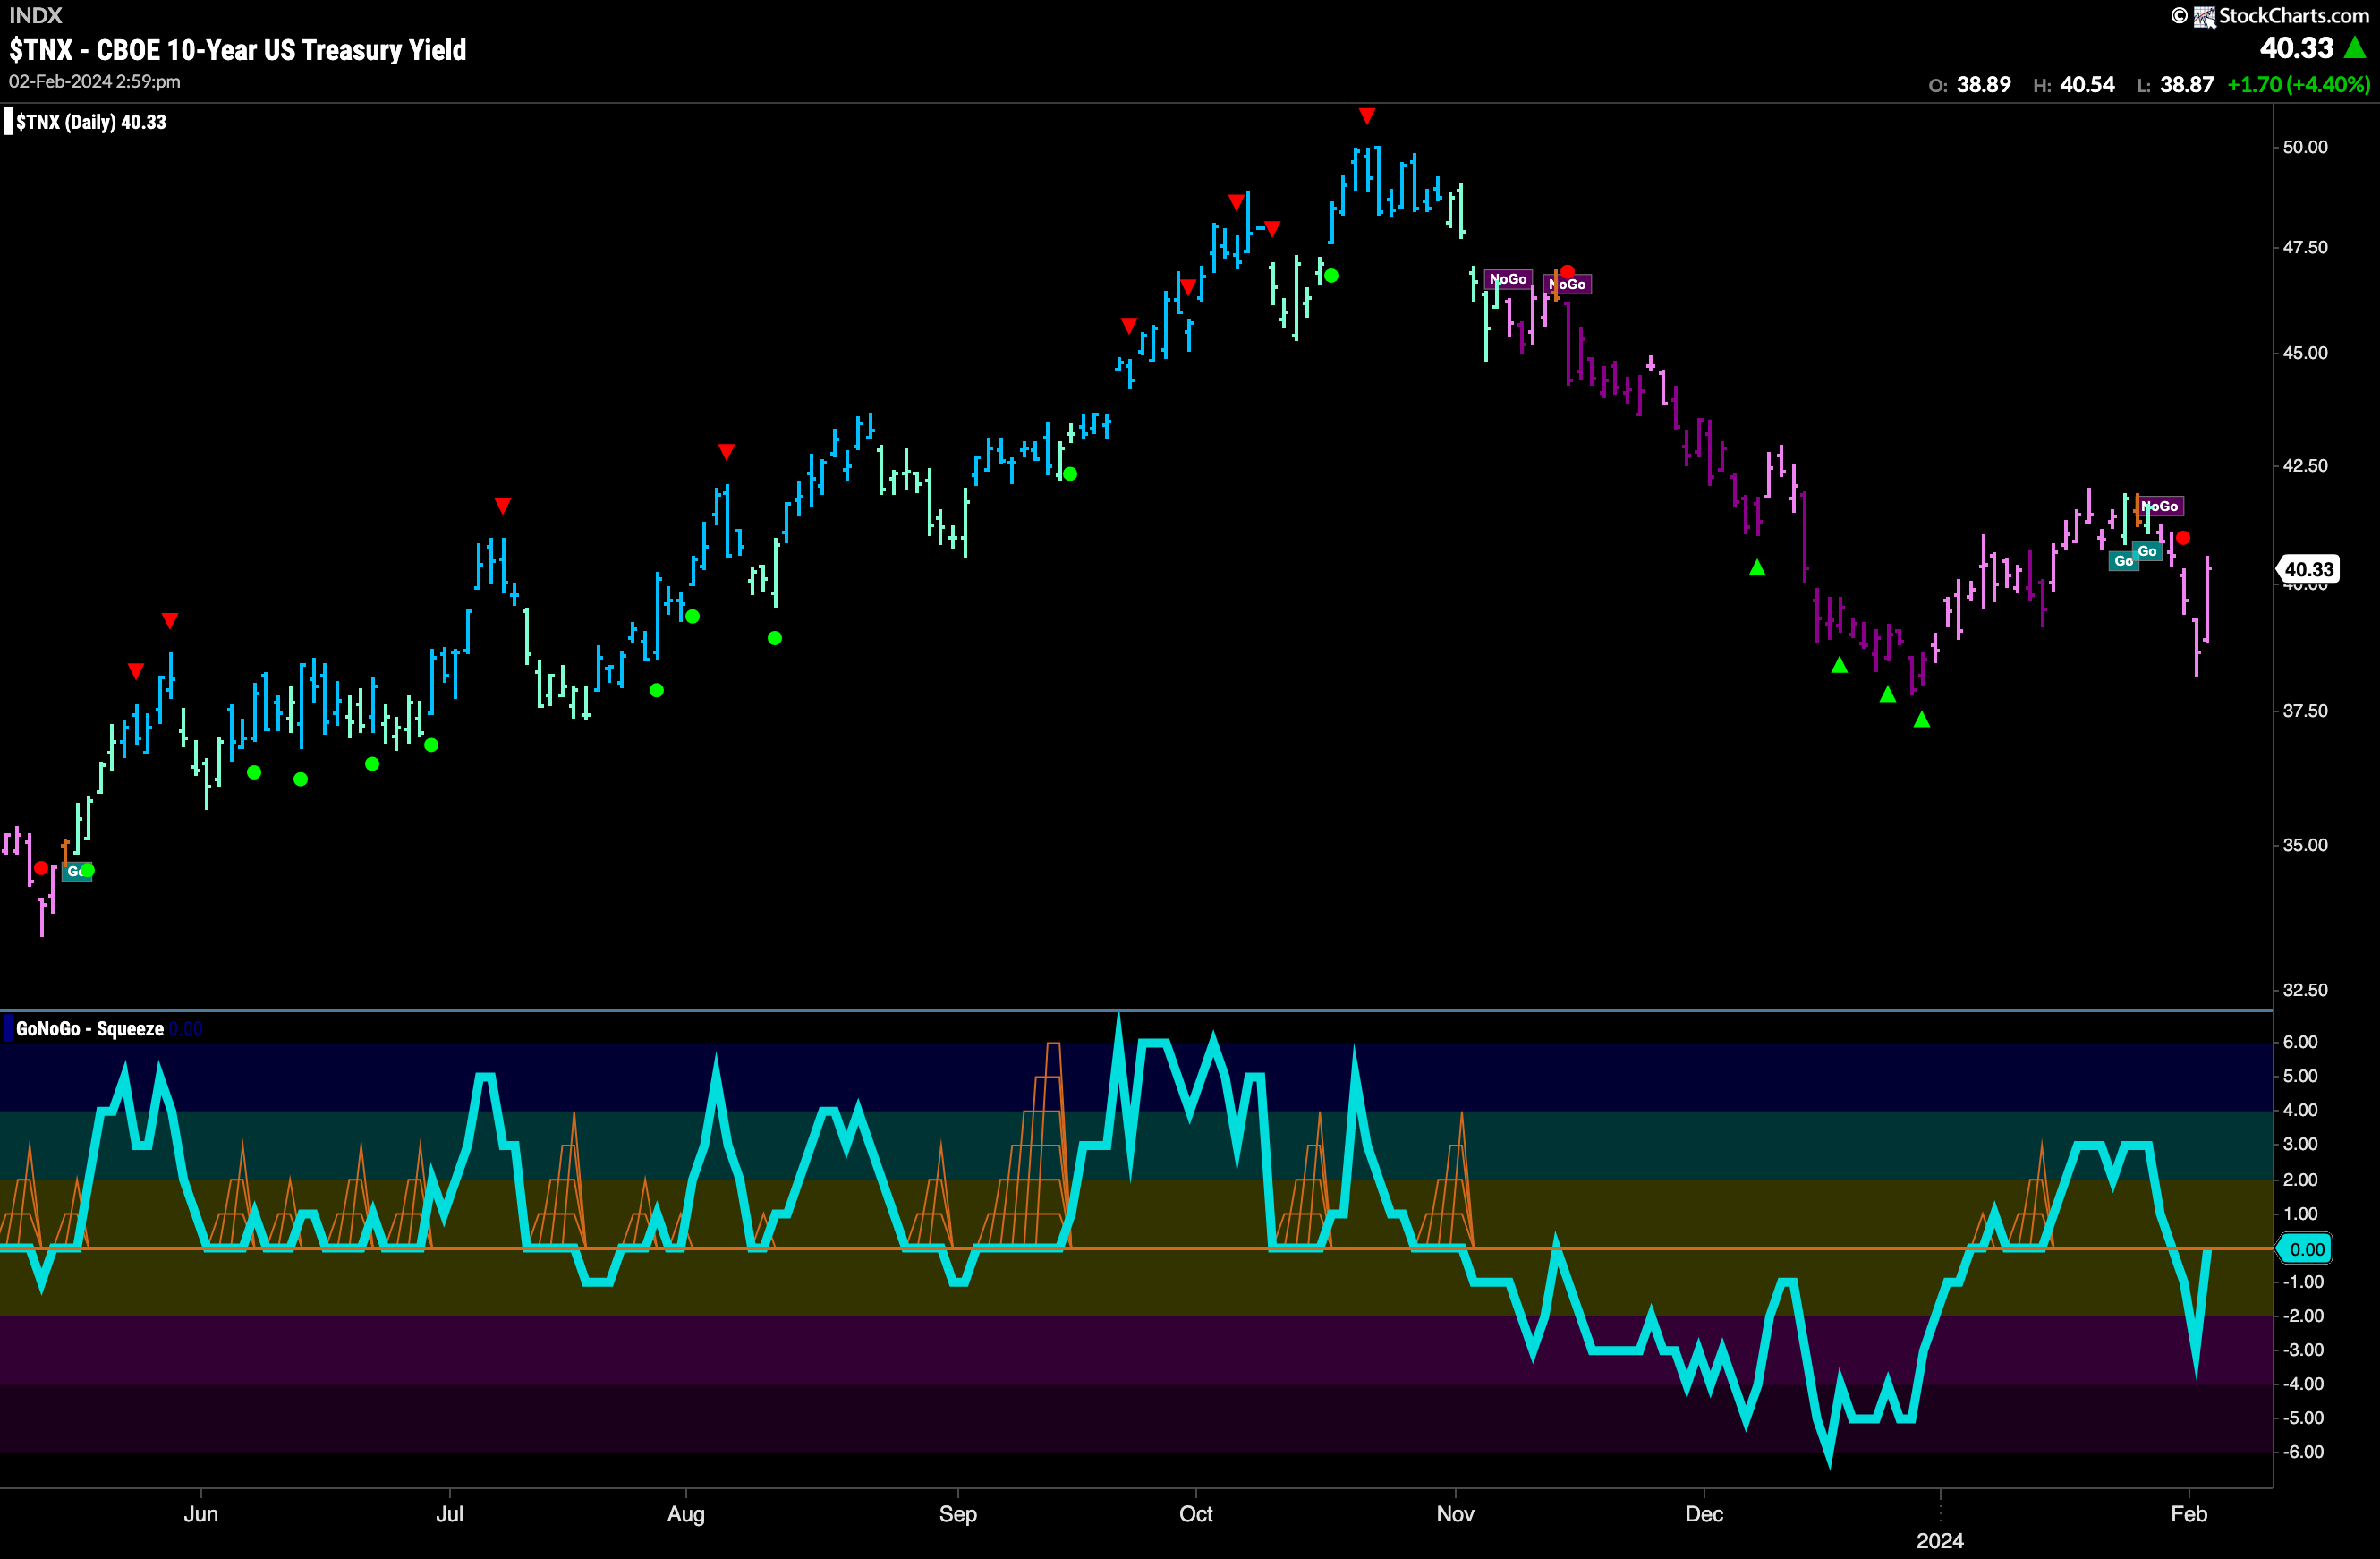
Last week we spotted a new “Go” trend emerging for treasury rates. That trend did not take hold this week and we say an immediate return to “NoGo” colors. While they remained the weaker pink, the “NoGo” was in place the entire week. This move back to a bearish environment saw the GoNoGo Oscillator fall through the zero line as well. now, with a “NoGo” in place, the oscillator is testing the zero line from below and we will look to see if it finds resistance at this level.
The Dollar “Go” Trend Strengthens
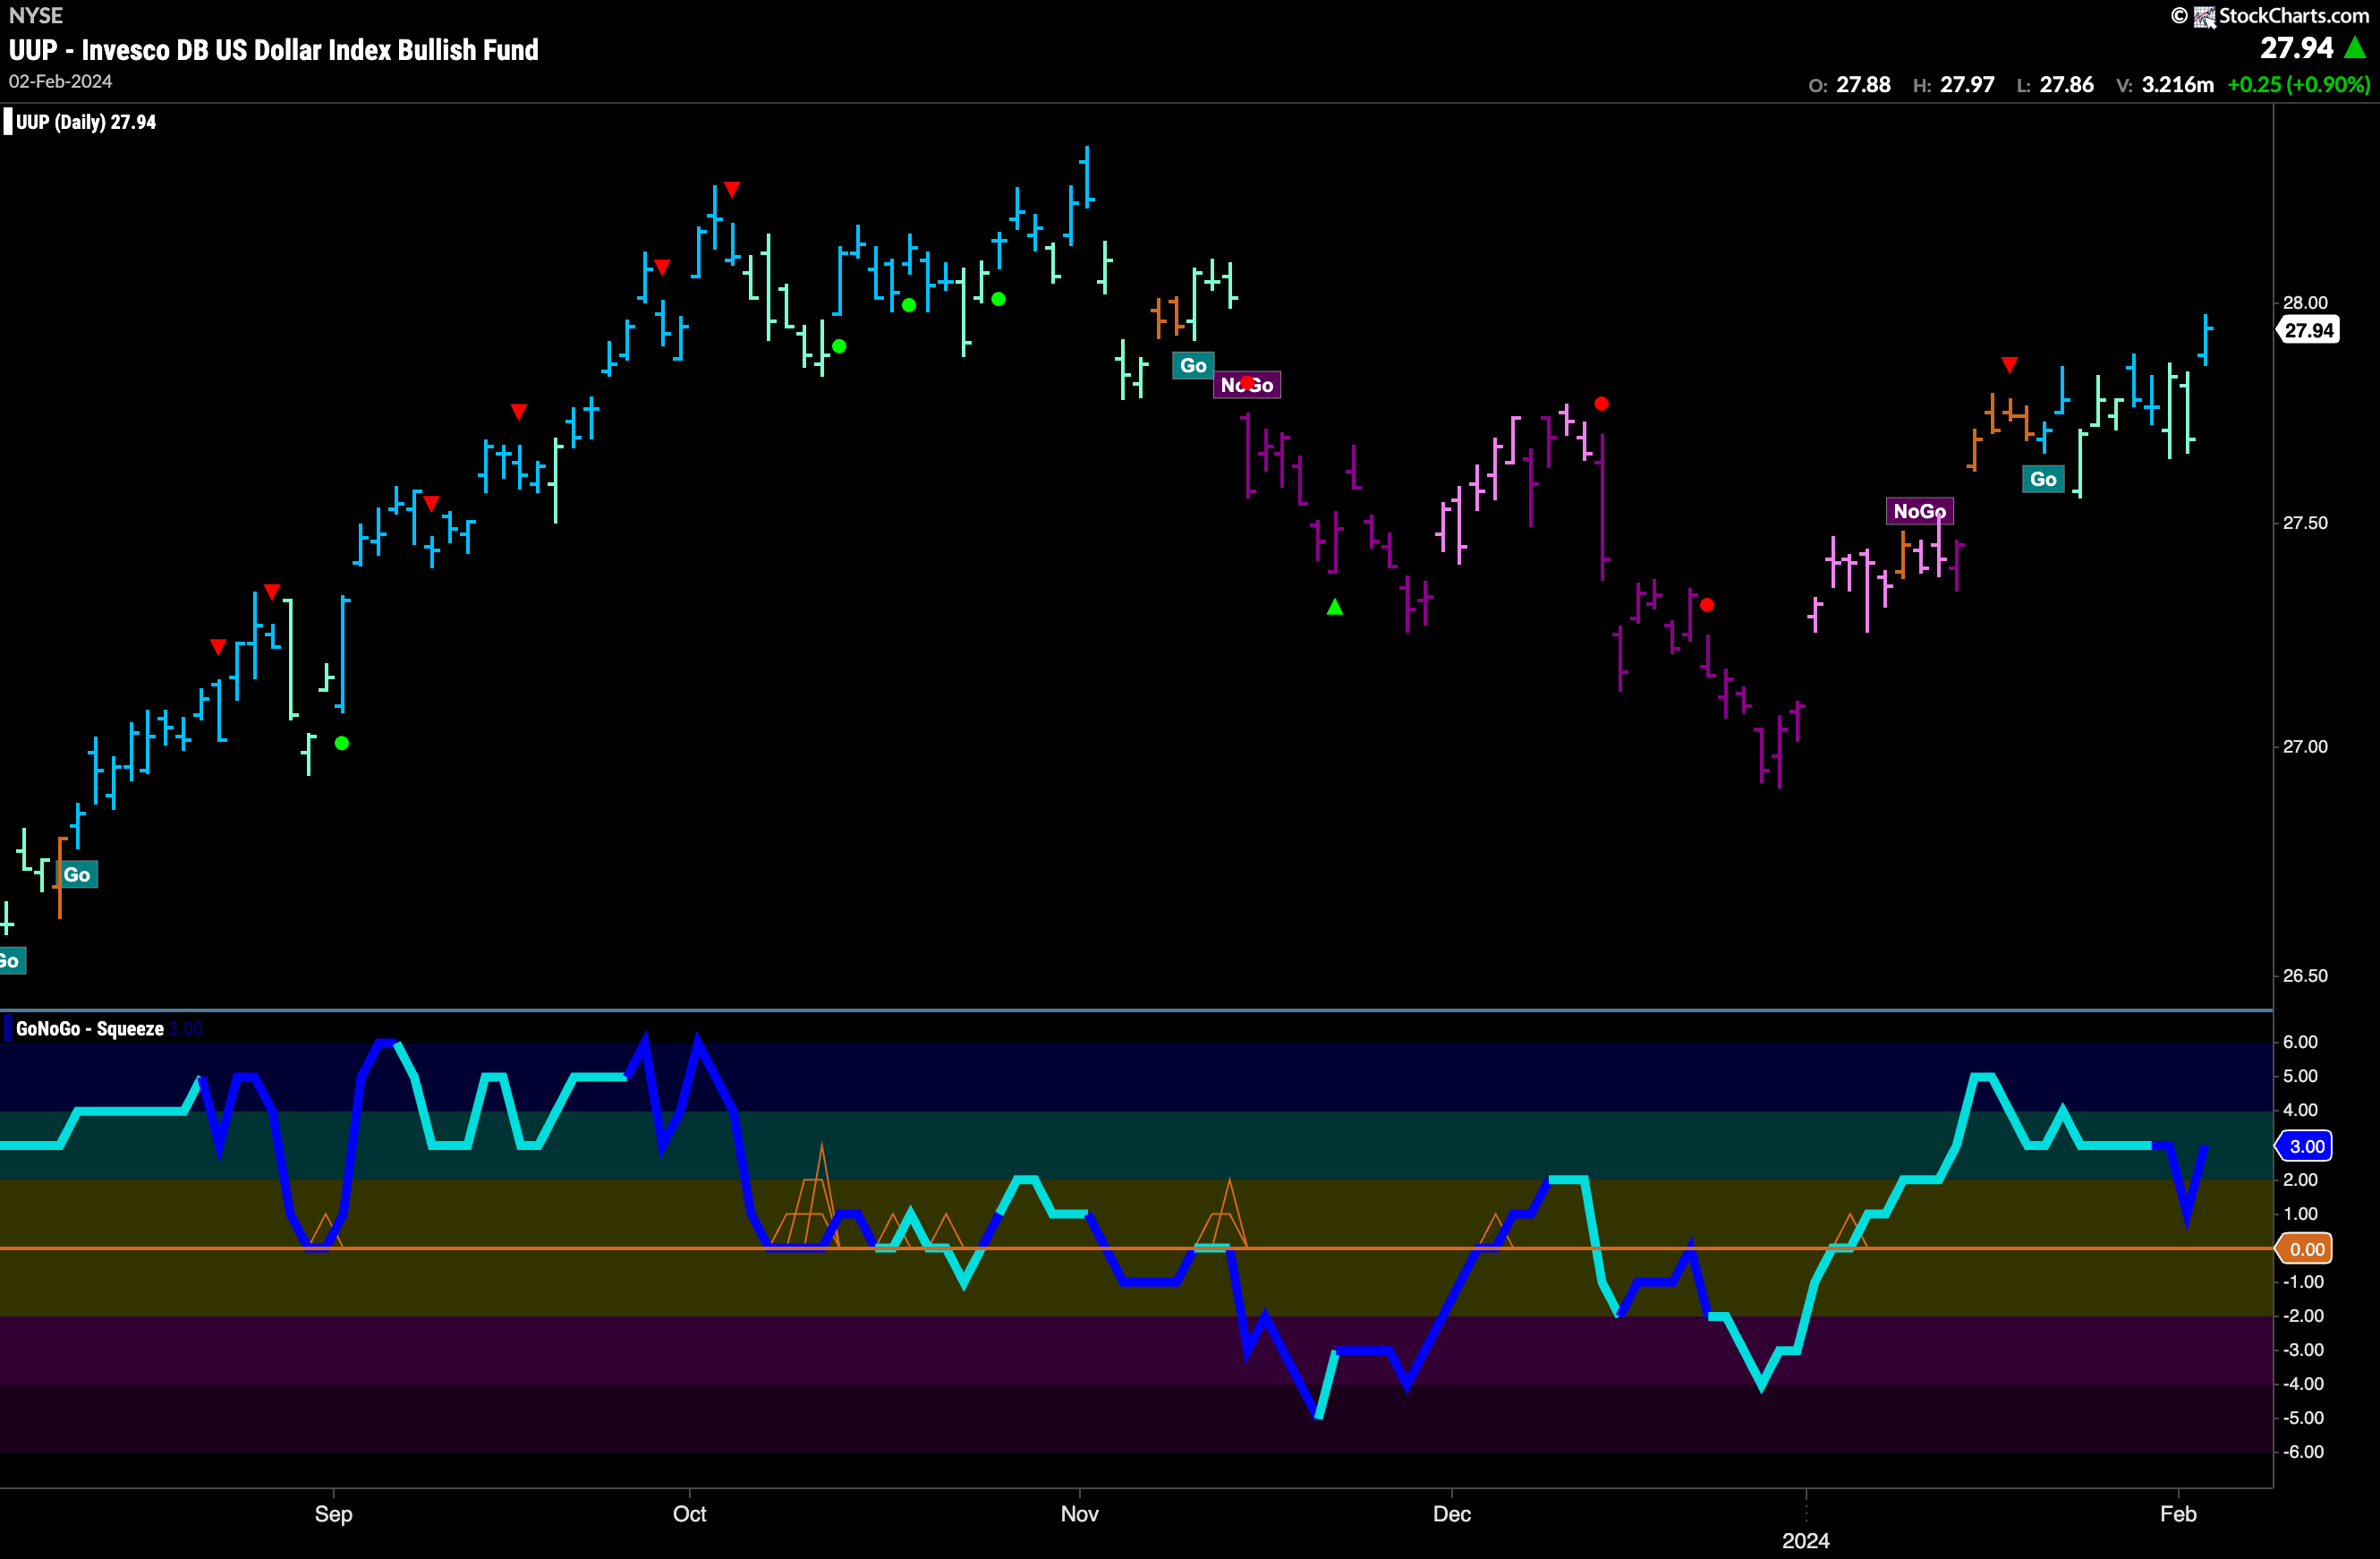
The chart below shows that the “Go” trend took a leap higher at the end of the week. Closing at a new high, we can see that the “Go” trend is strengthening in the U.S. dollar. GoNoGo Oscillator has also turned up from a value of 1 and so we know that momentum is in the direction of the “Go” trend. The darker blue of the Oscillator also tells us that volume is heavy. With a strengthening “Go” trend and rising momentum on heavy volume, this is a healthy bullish picture for $UUP.
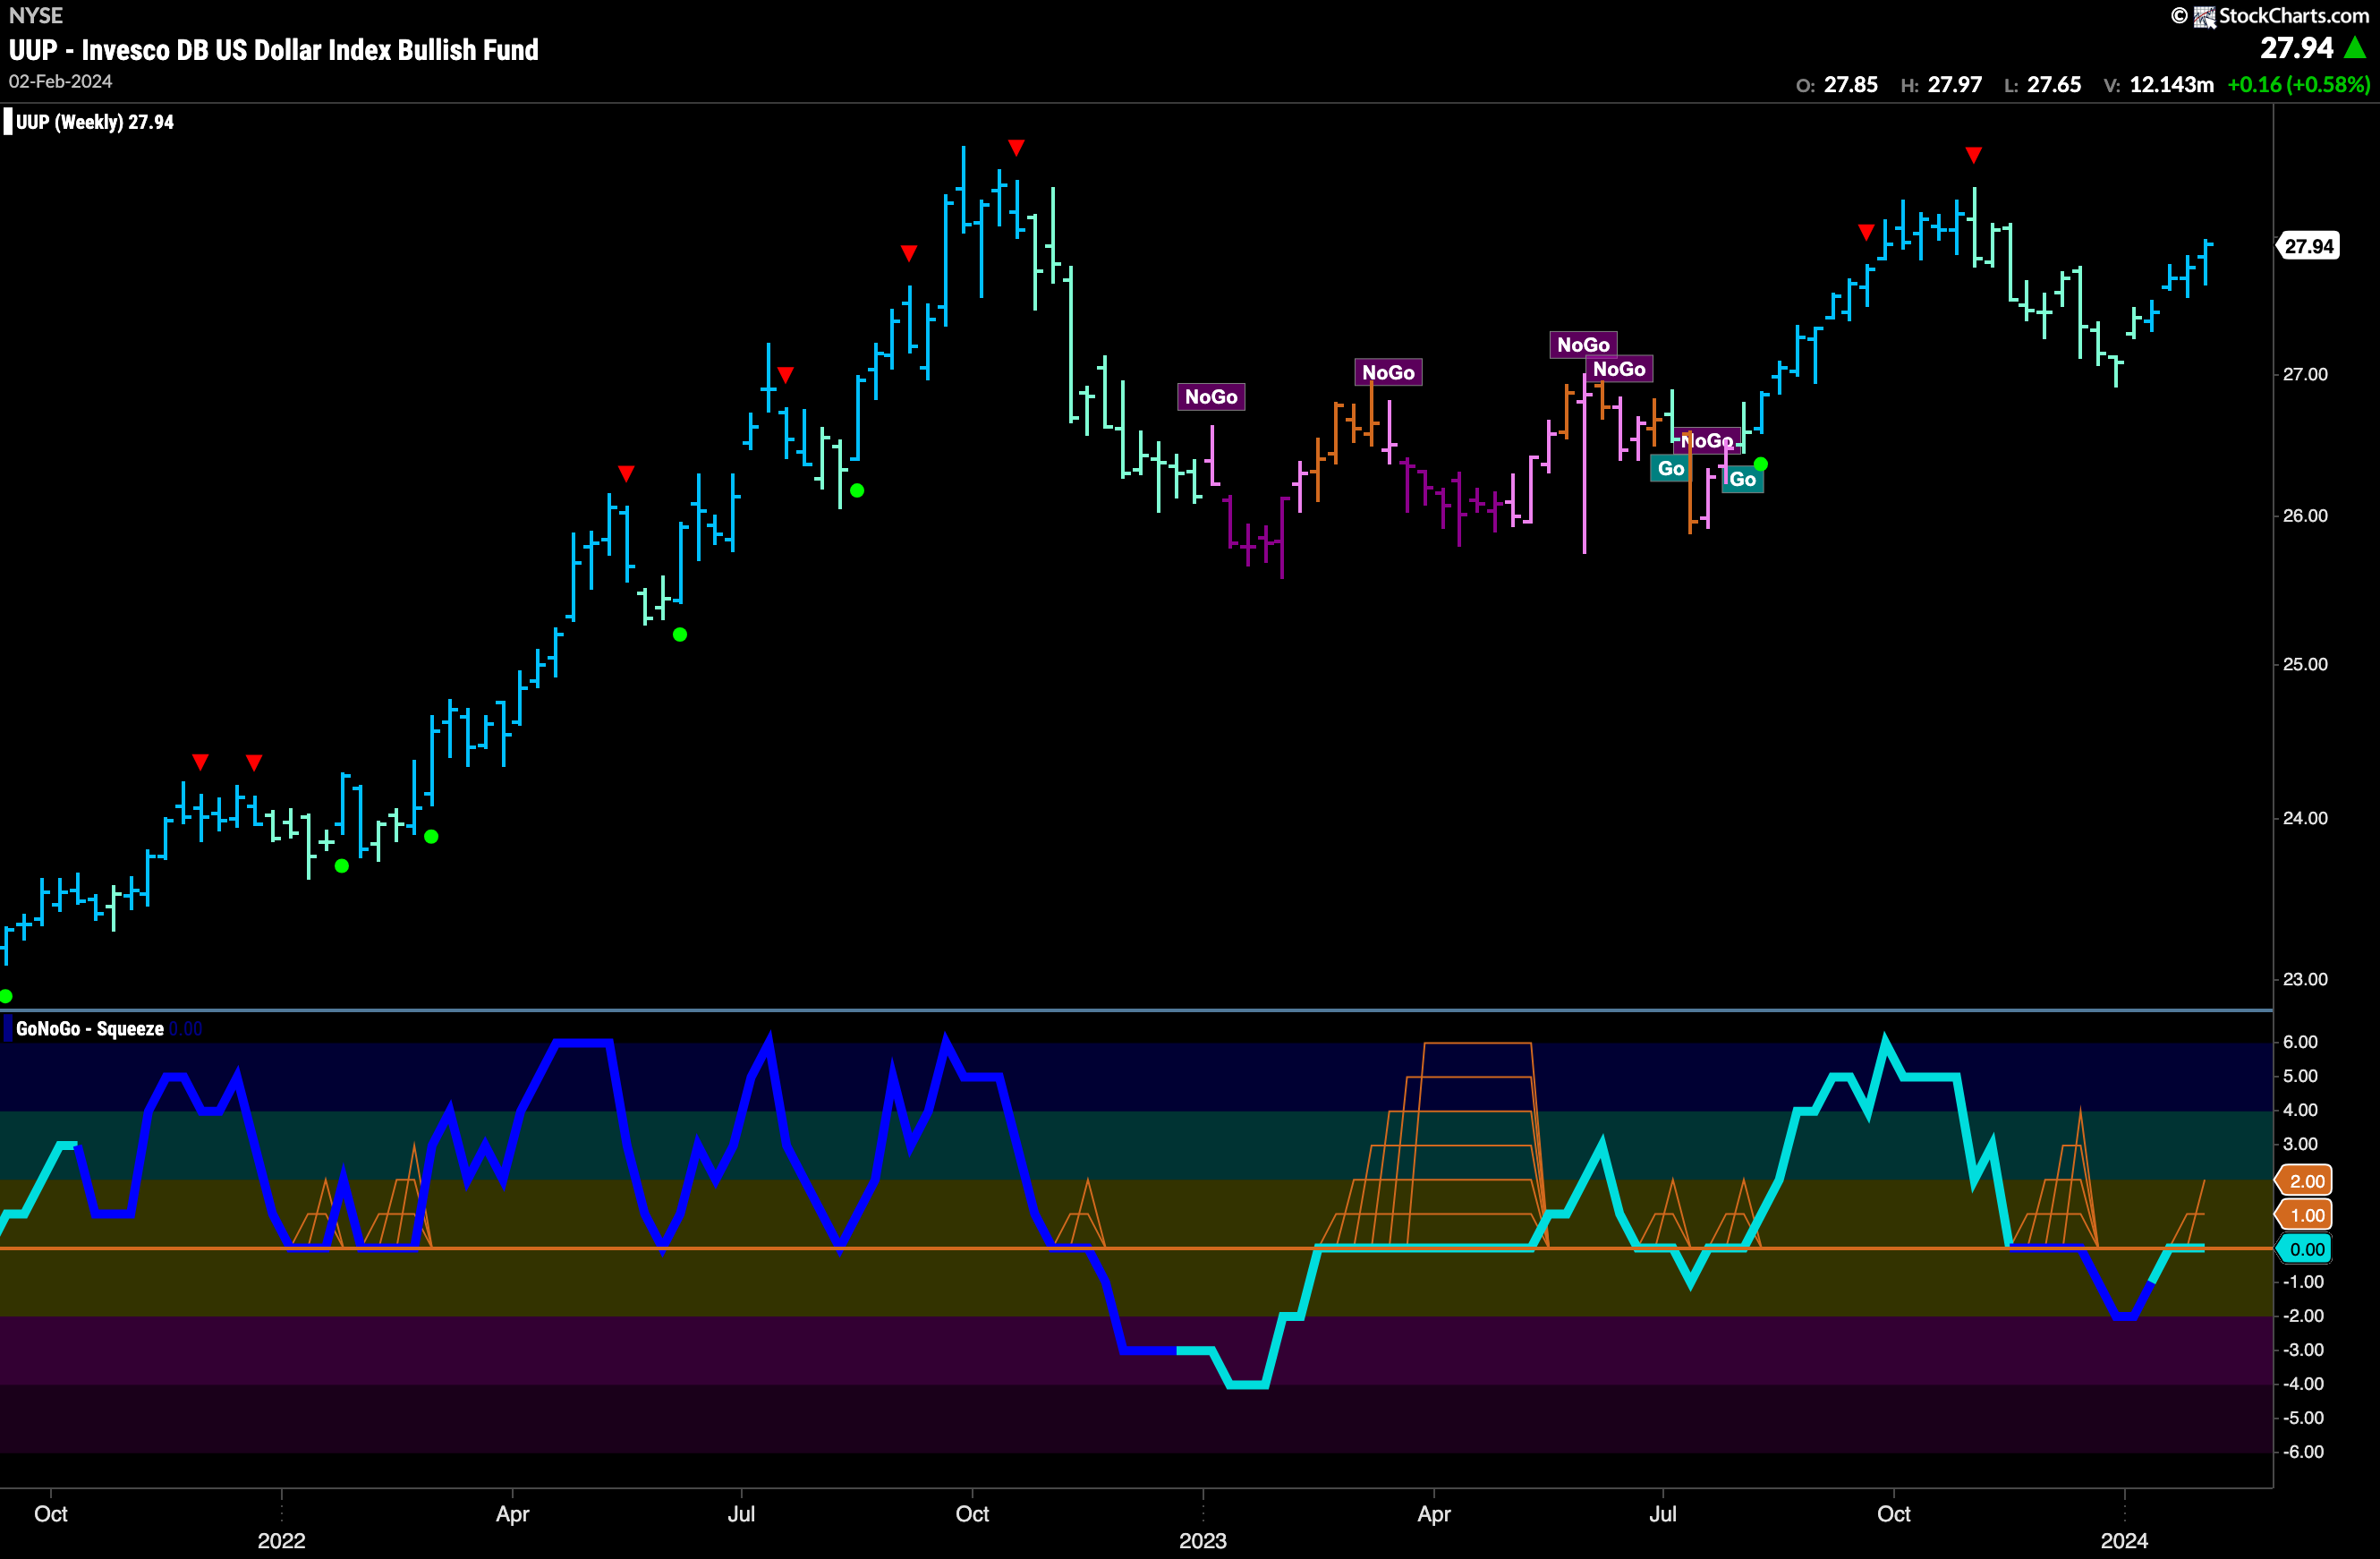
The weekly chart shows that GoNoGo Trend has painted a 4th consecutive strong blue bar after the low at the end of last year. This is a new higher low and we will now have to see if price can put in a corresponding higher high. Of note, GoNoGo Oscillator is at the zero line for a second week in a row. We will need to watch for the break of the new and building GoNoGo Squeeze. If the Oscillator rallies back into positive territory that would be a strong positive for the “Go” trend.
Oil “Go” Trend Falters
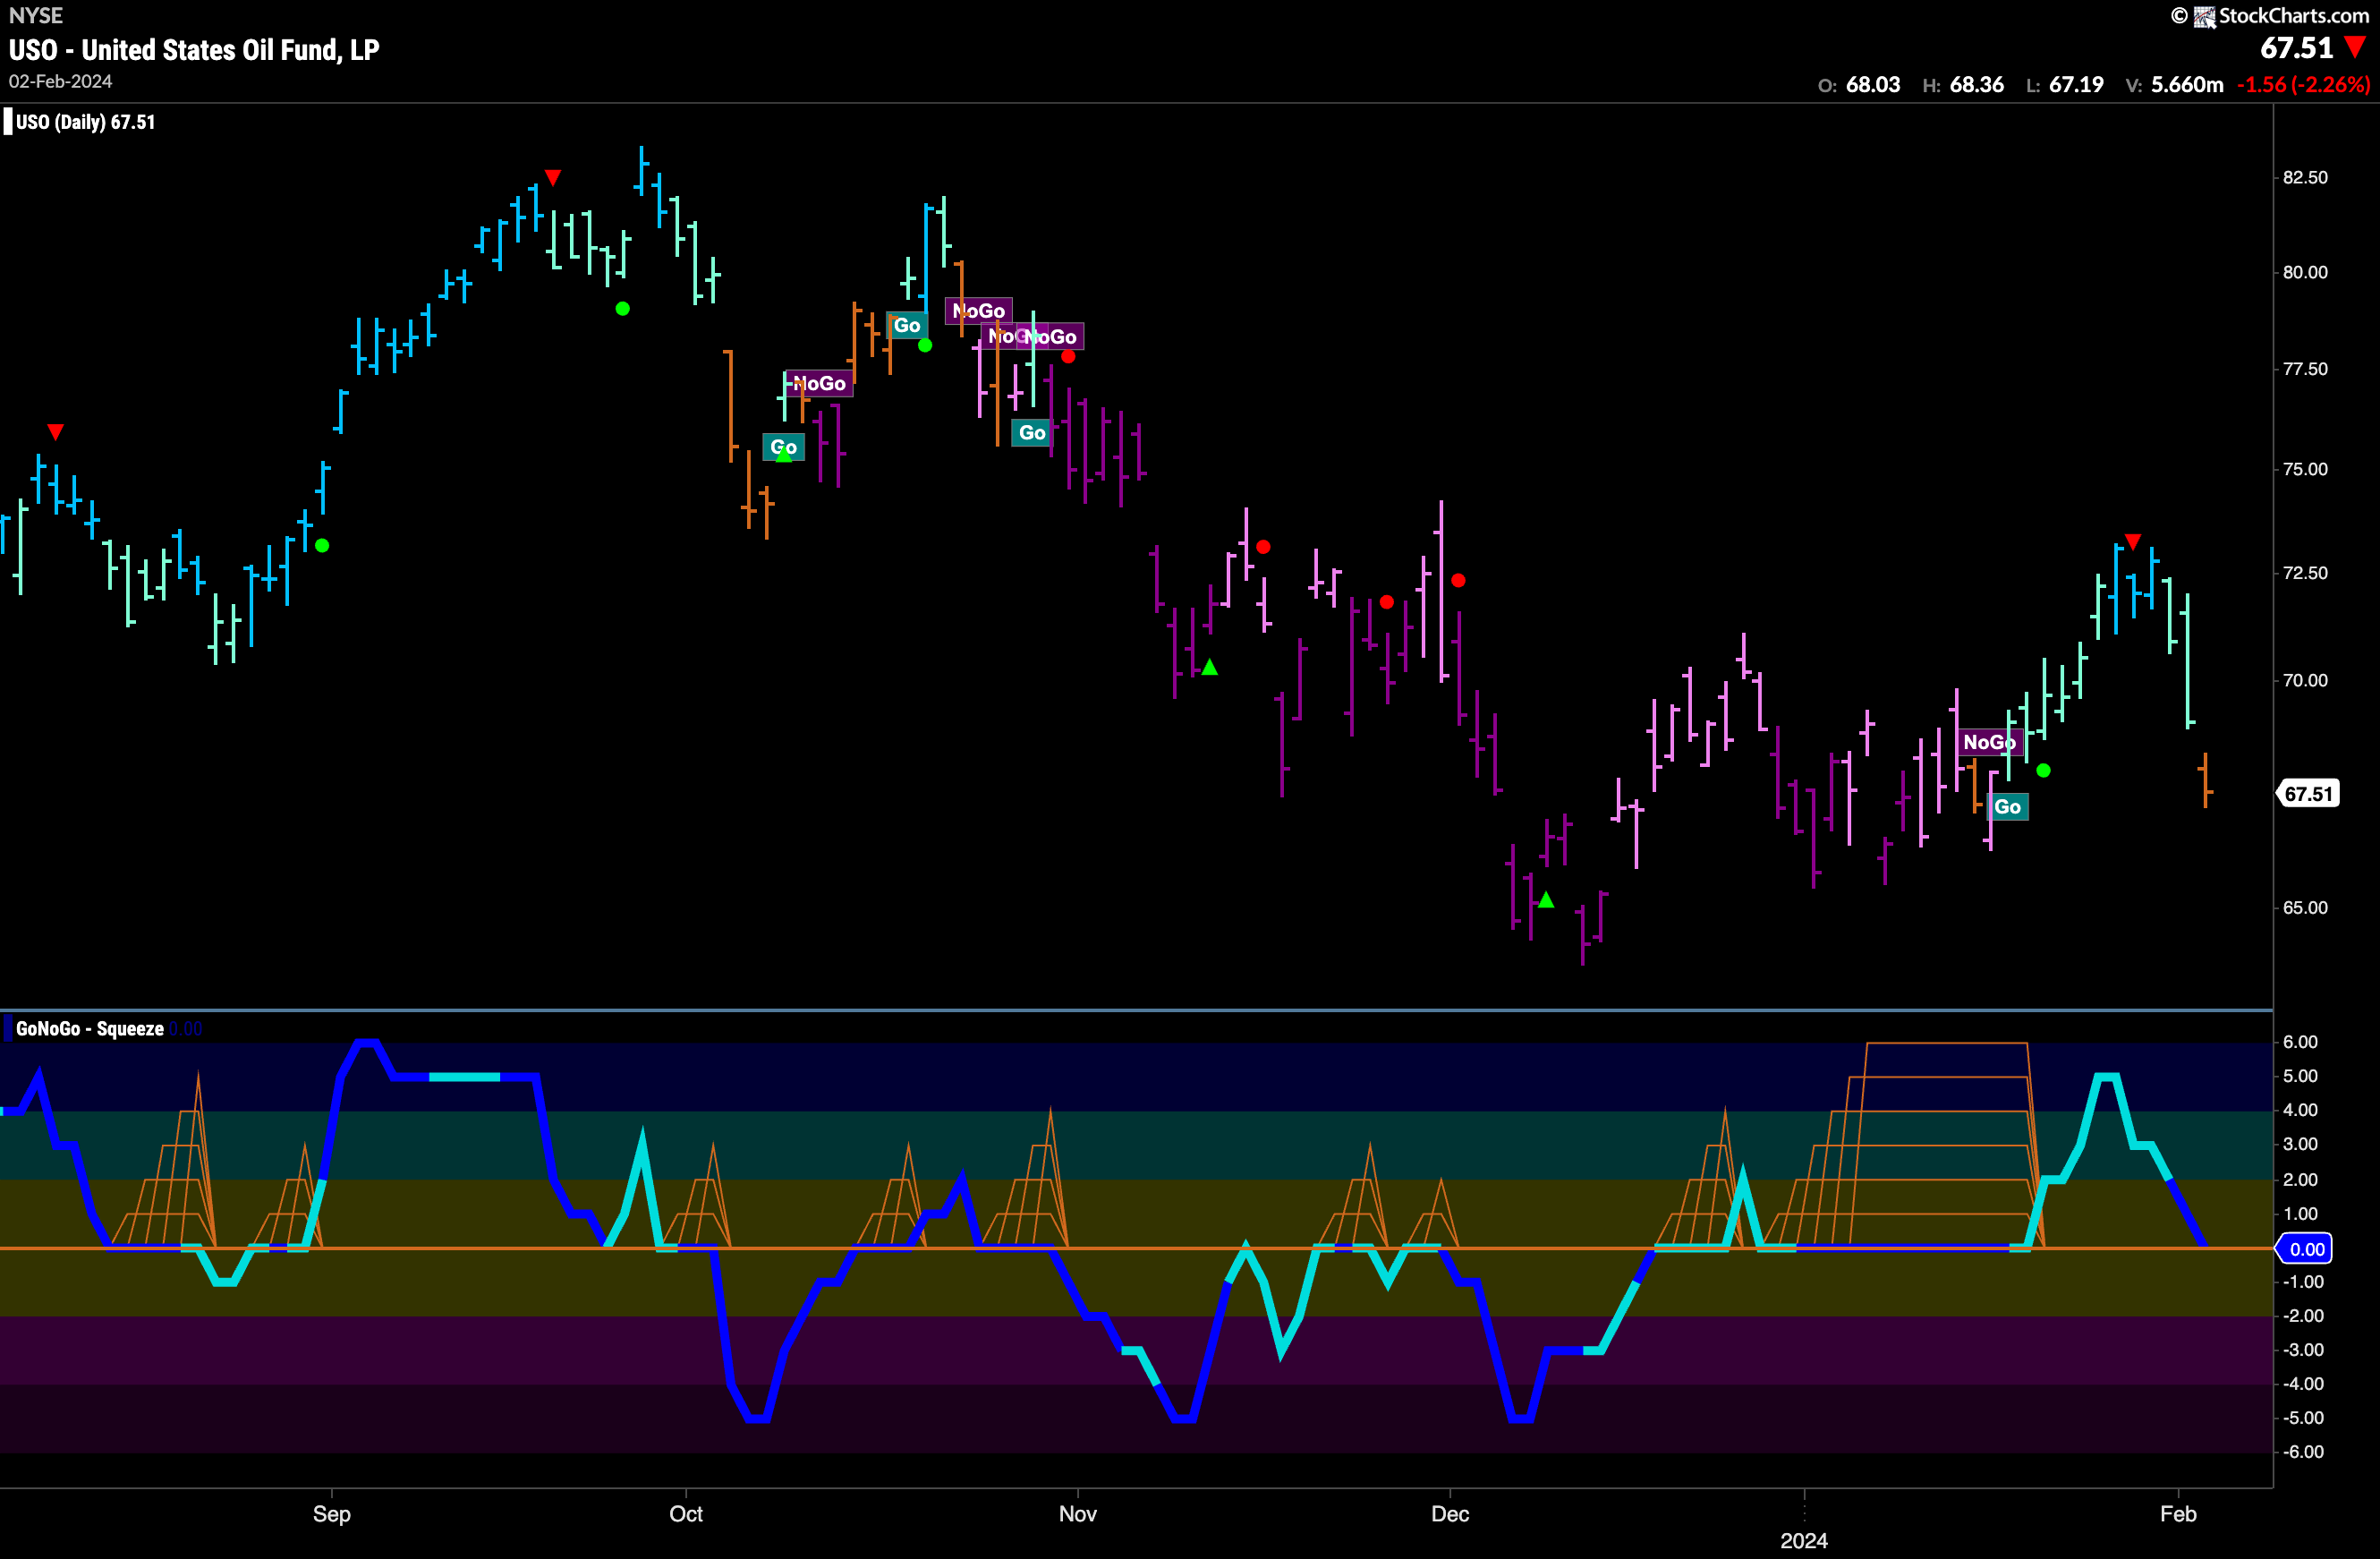
GoNoGo Trend painted an amber “Go Fish” bar on the final bar of the week after a fast and damaging drop in prices since Wednesday morning. GoNoGo Oscillator fell from overbought territory all the way to the zero line where it is now. We will look to see if this level provides support and if it does that would give GoNoGo Trend the chance to resume a “Go” trend. If GoNoGo Oscillator falls through zero into negative territory that could lead to a change in trend to a “NoGo”.
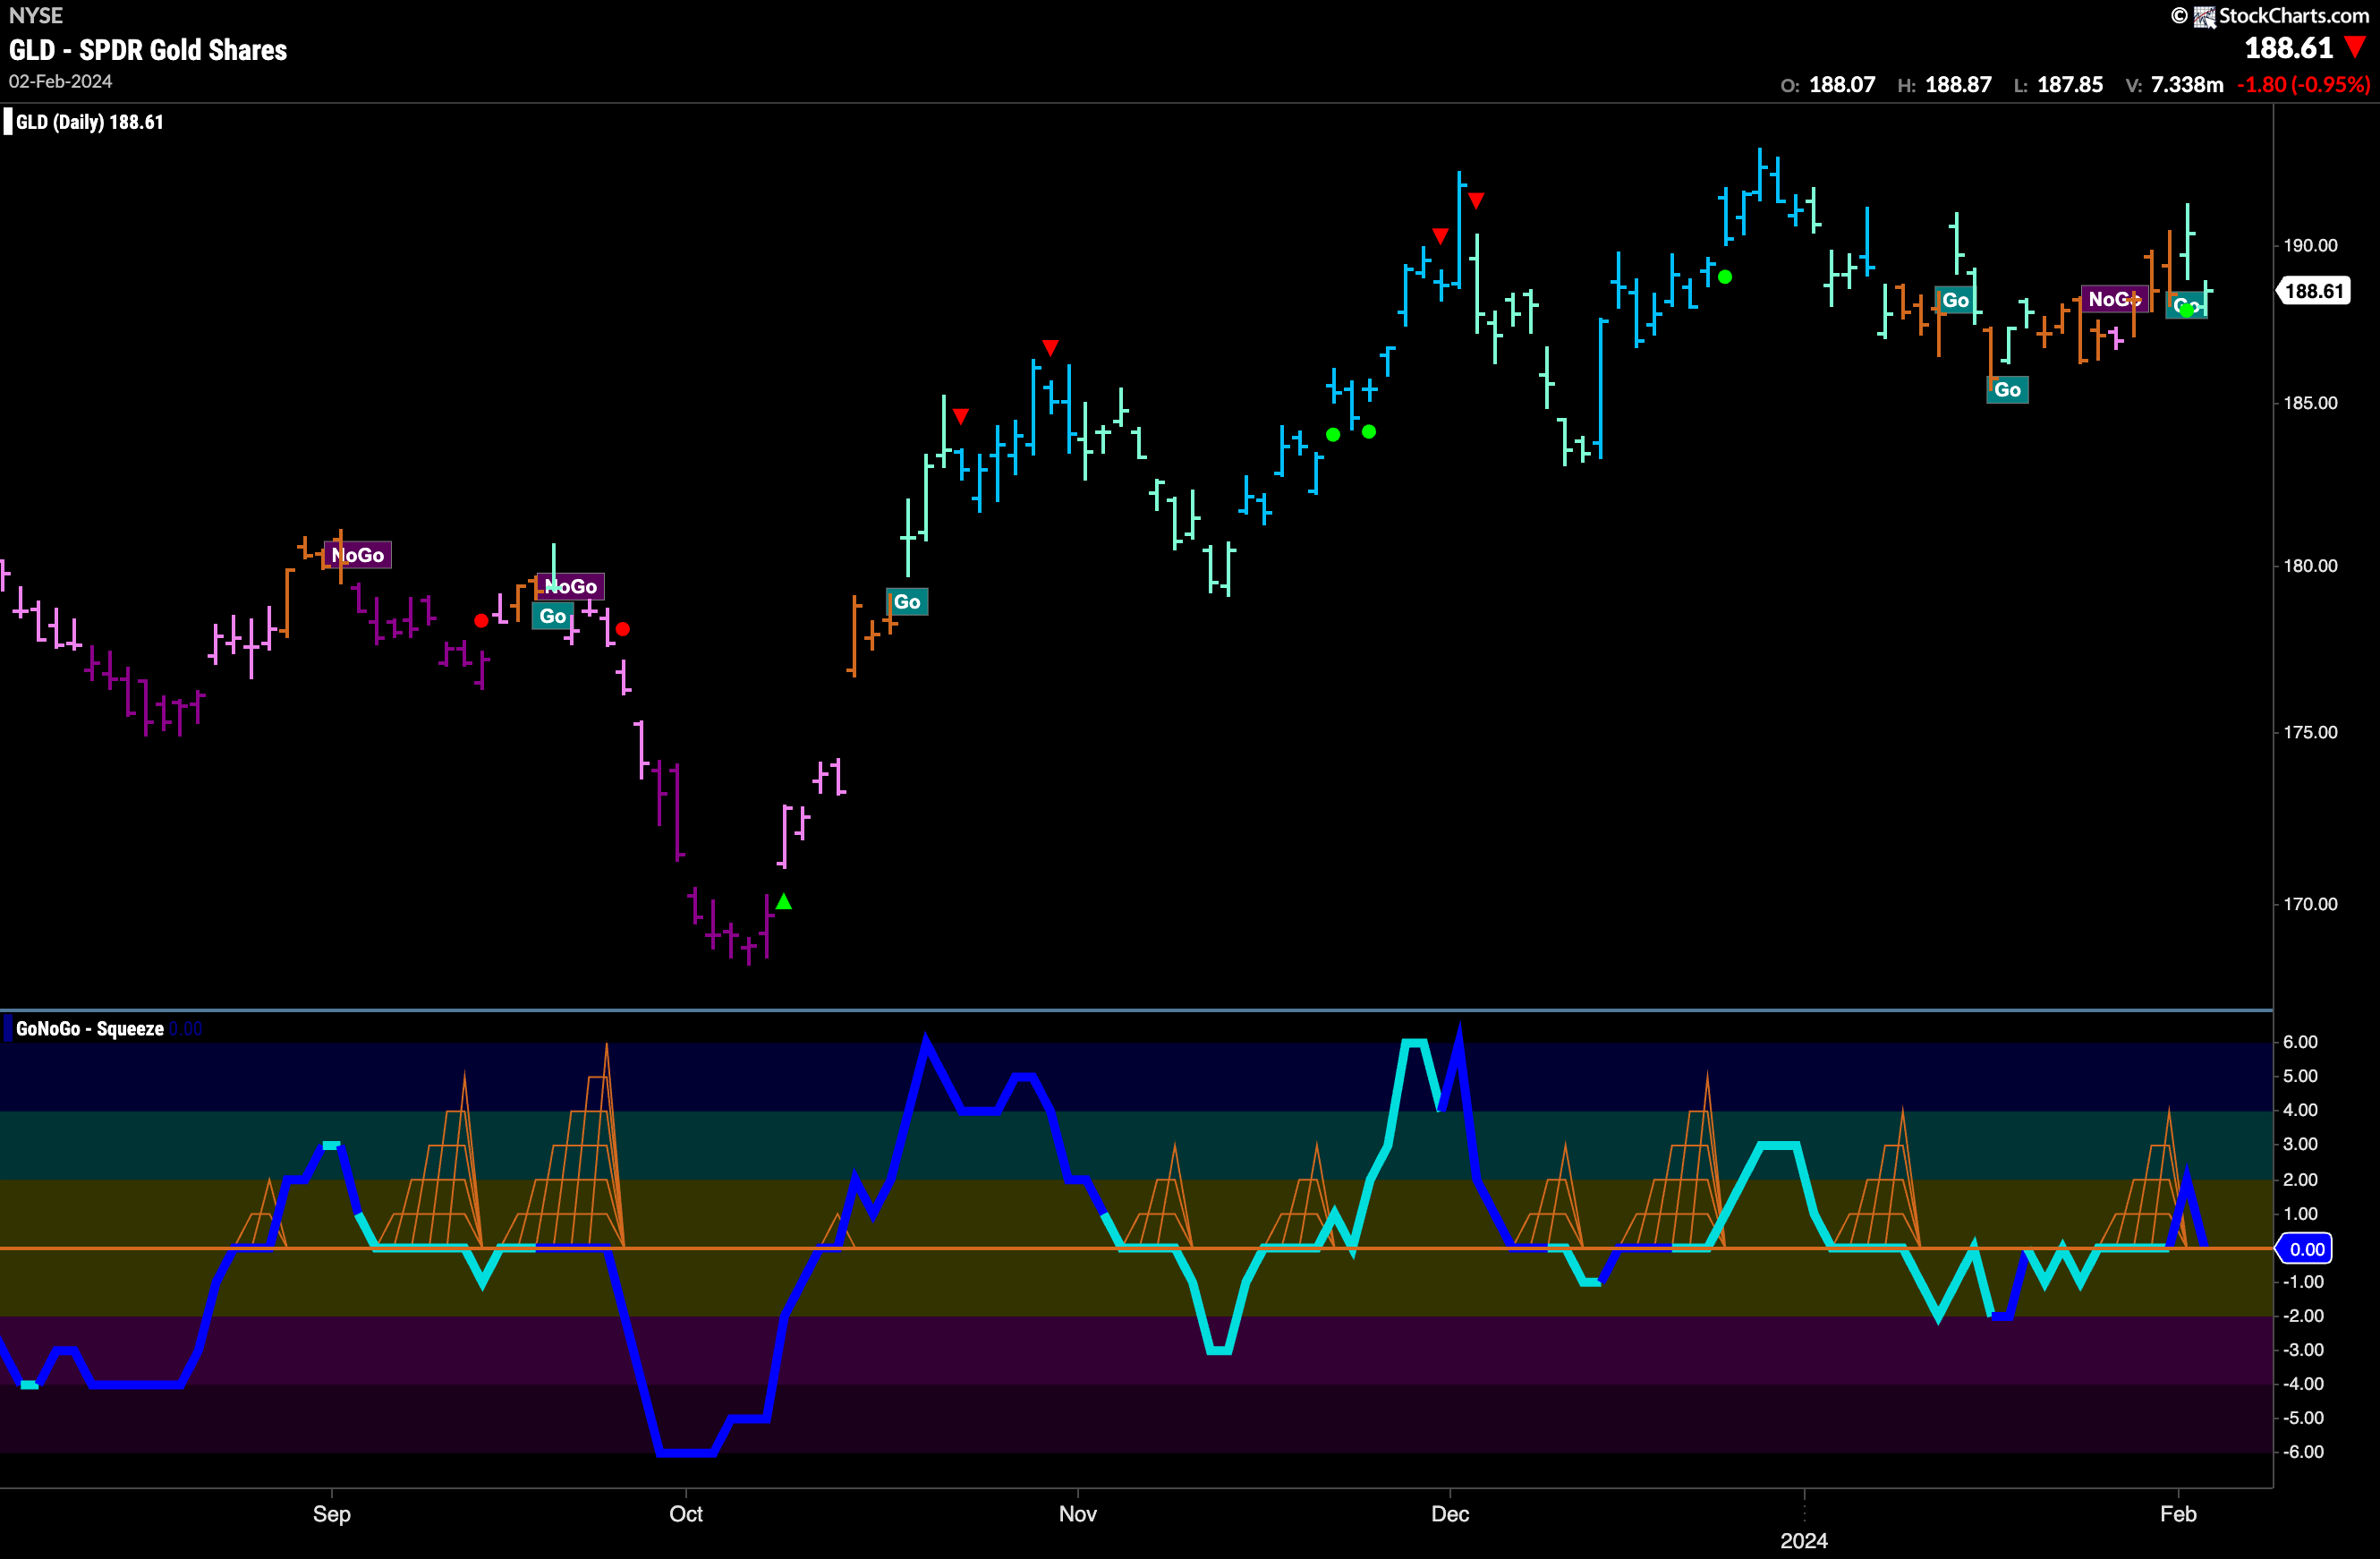
Gold Gets A for Effort
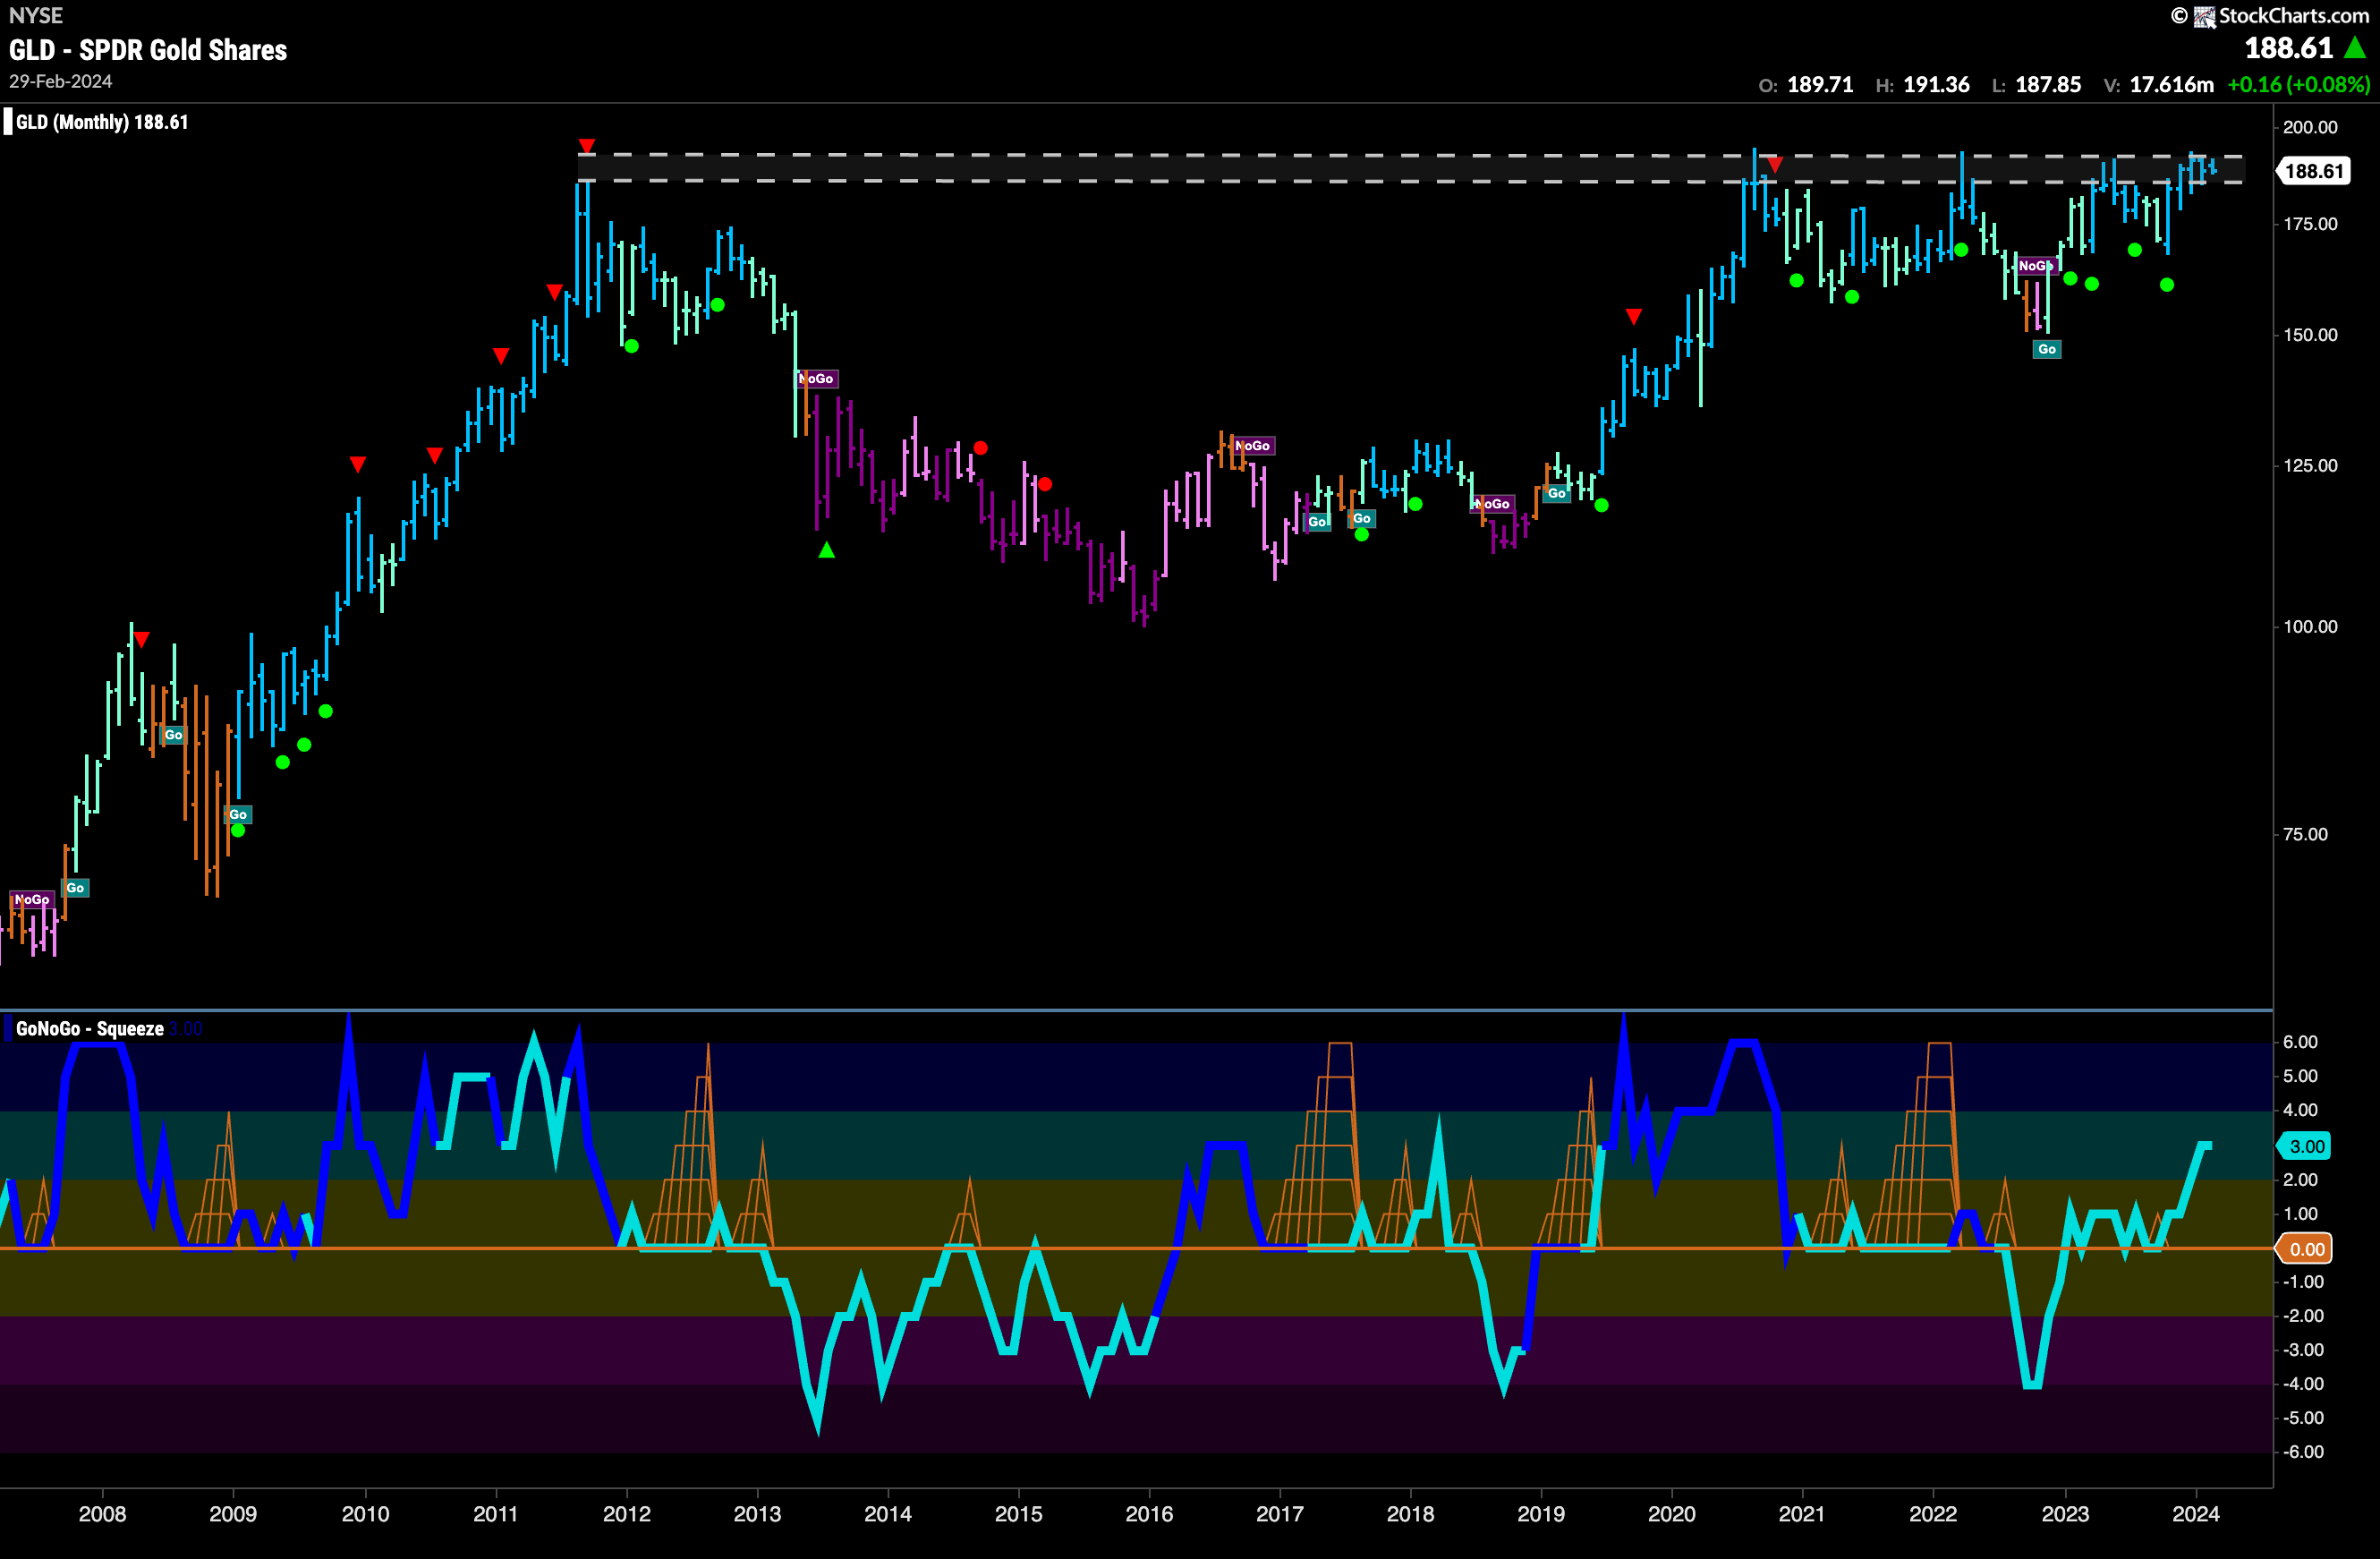
GoNoGo Trend saw “Go” bars return at the end of the week after more amber “Go Fish” bars of uncertainty. We will watch to see if the trend can hold this week and whether or not there is an attack on those prior highs. GoNoGo Oscillator has broken into positive territory on heavy volume and is now retesting that level. If it finds support here that could help price push higher.
No comment ….
Sector RelMap
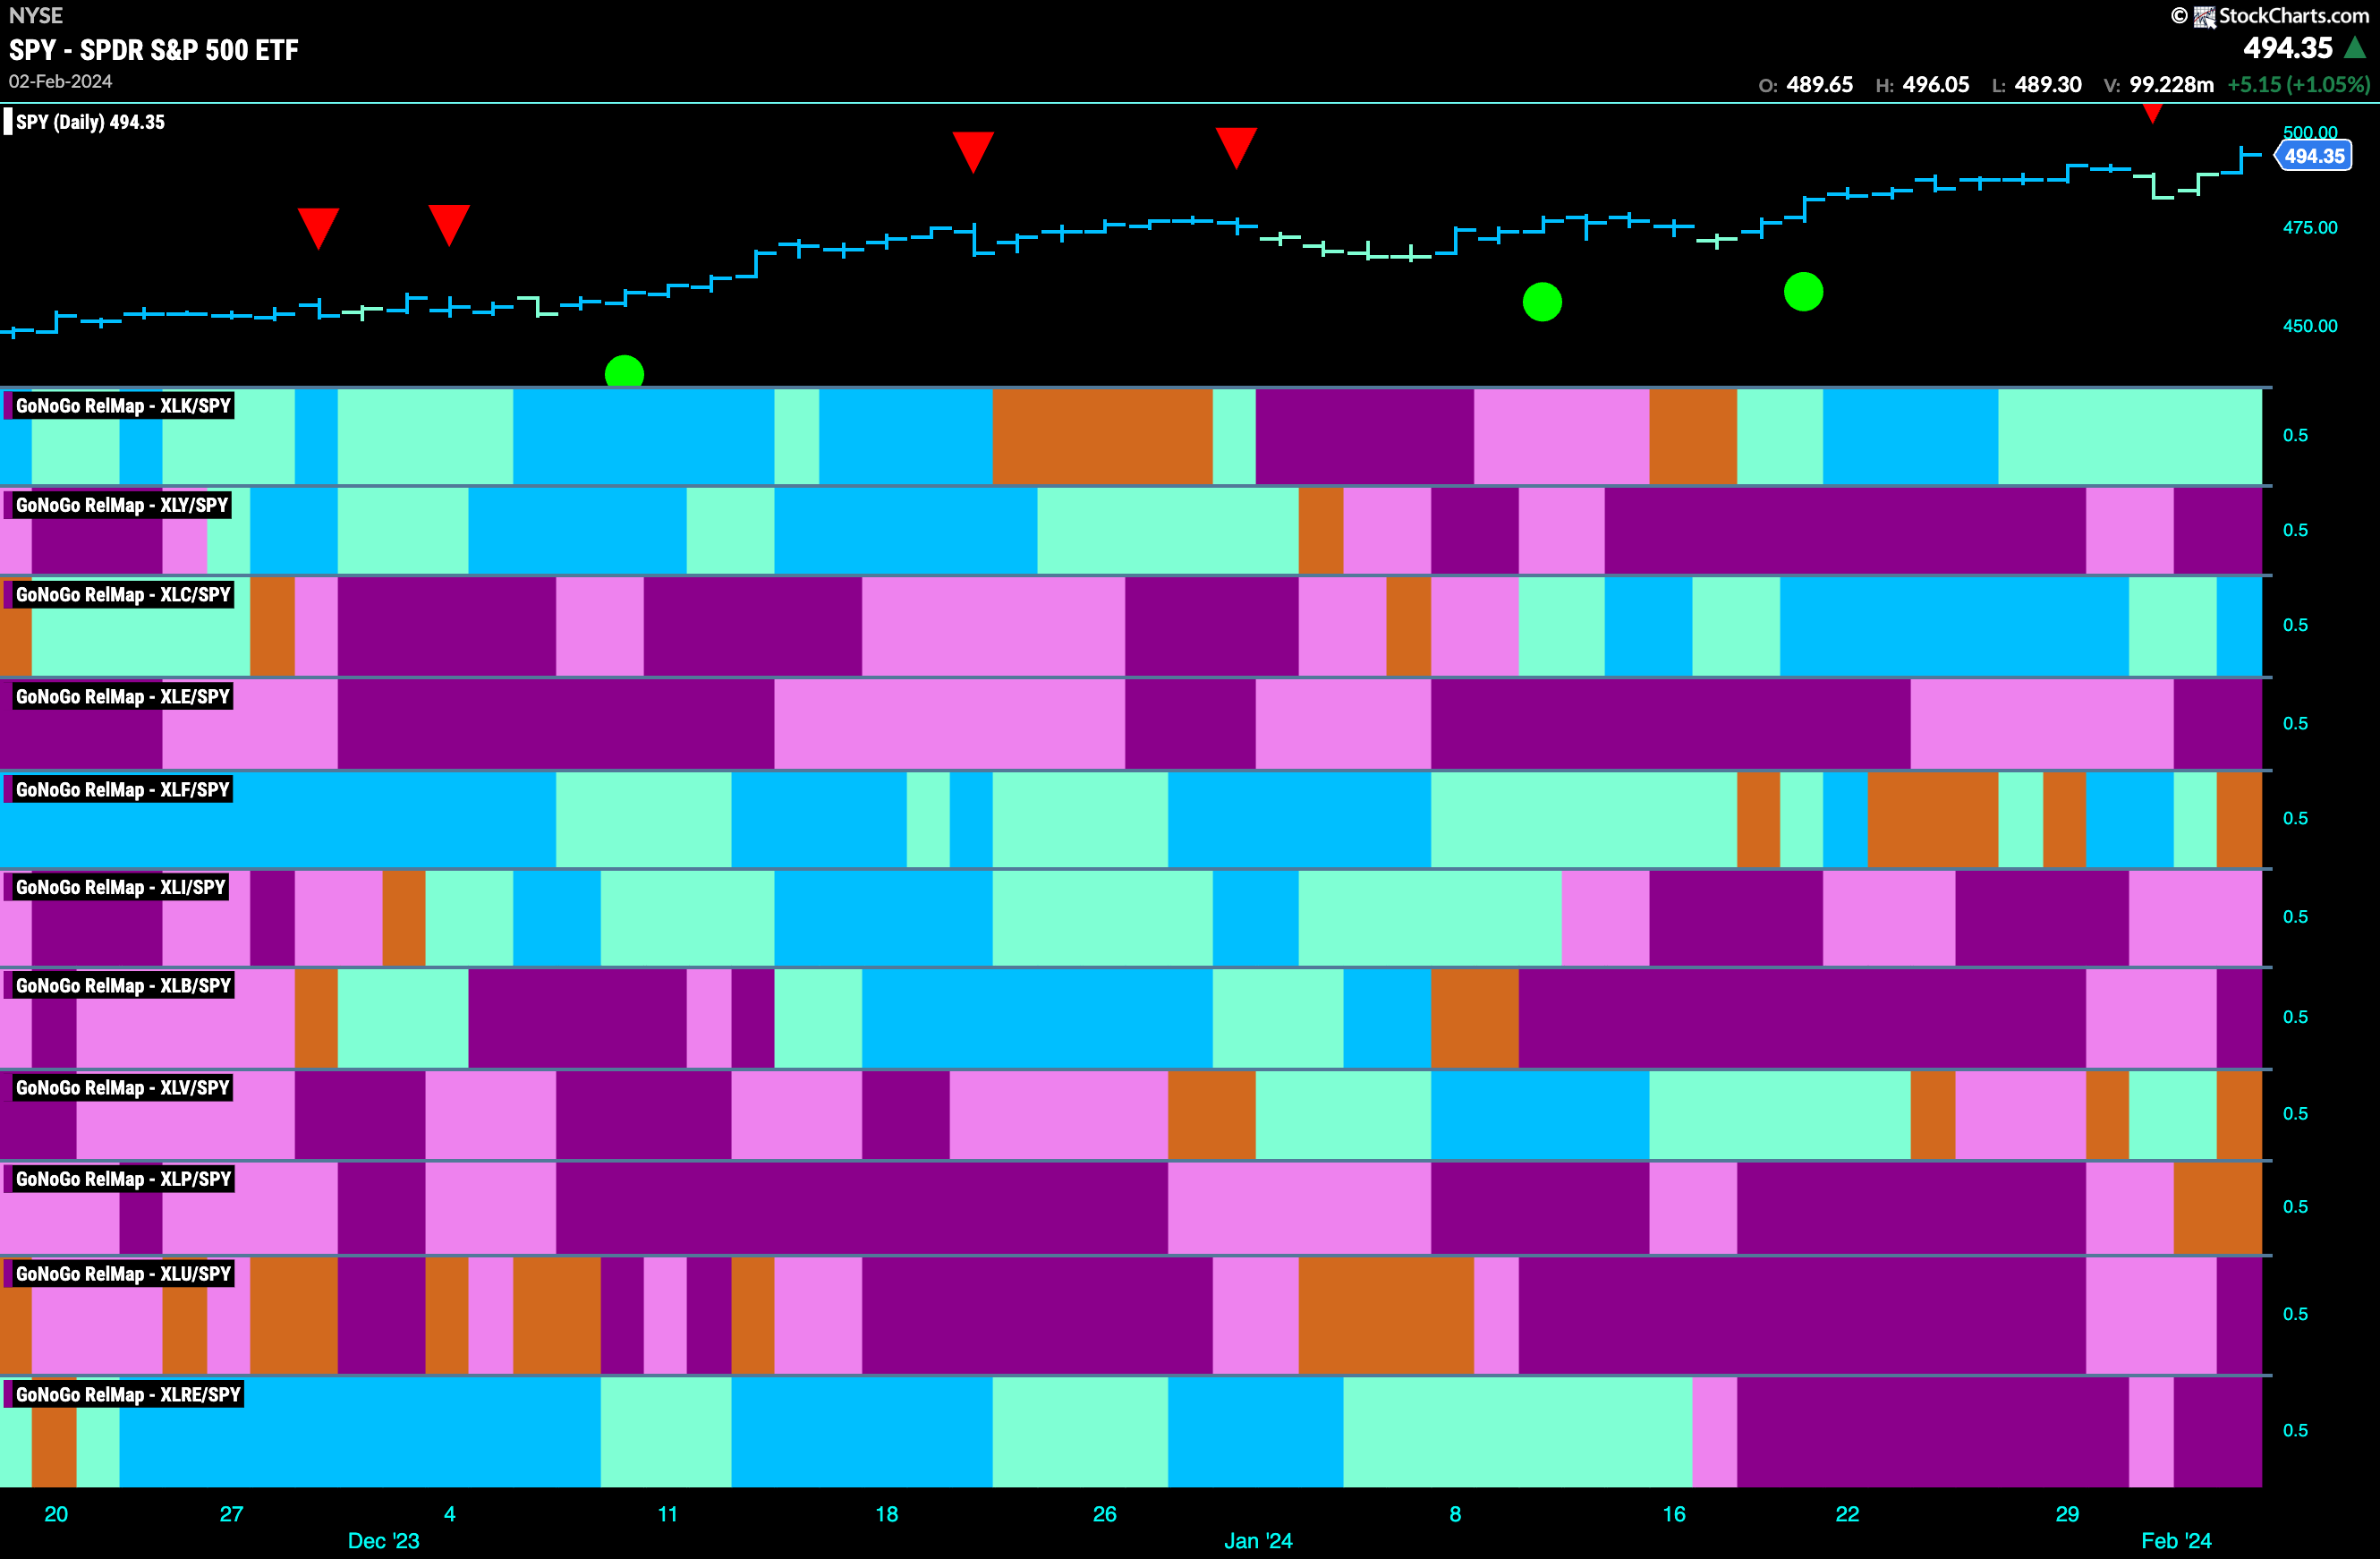
Below is the GoNoGo Sector RelMap. This GoNoGo RelMap applies the GoNoGo Trend to the relative strength ratios of the sectors to the base index. Looking at this map, we can quickly see where the relative outperformance is coming from as well as which sectors are lagging on a relative basis. 2 sectors are outperforming the base index this week. $XLK, and $XLC, are painting “Go” bars.
Technology Sub-Group RelMap
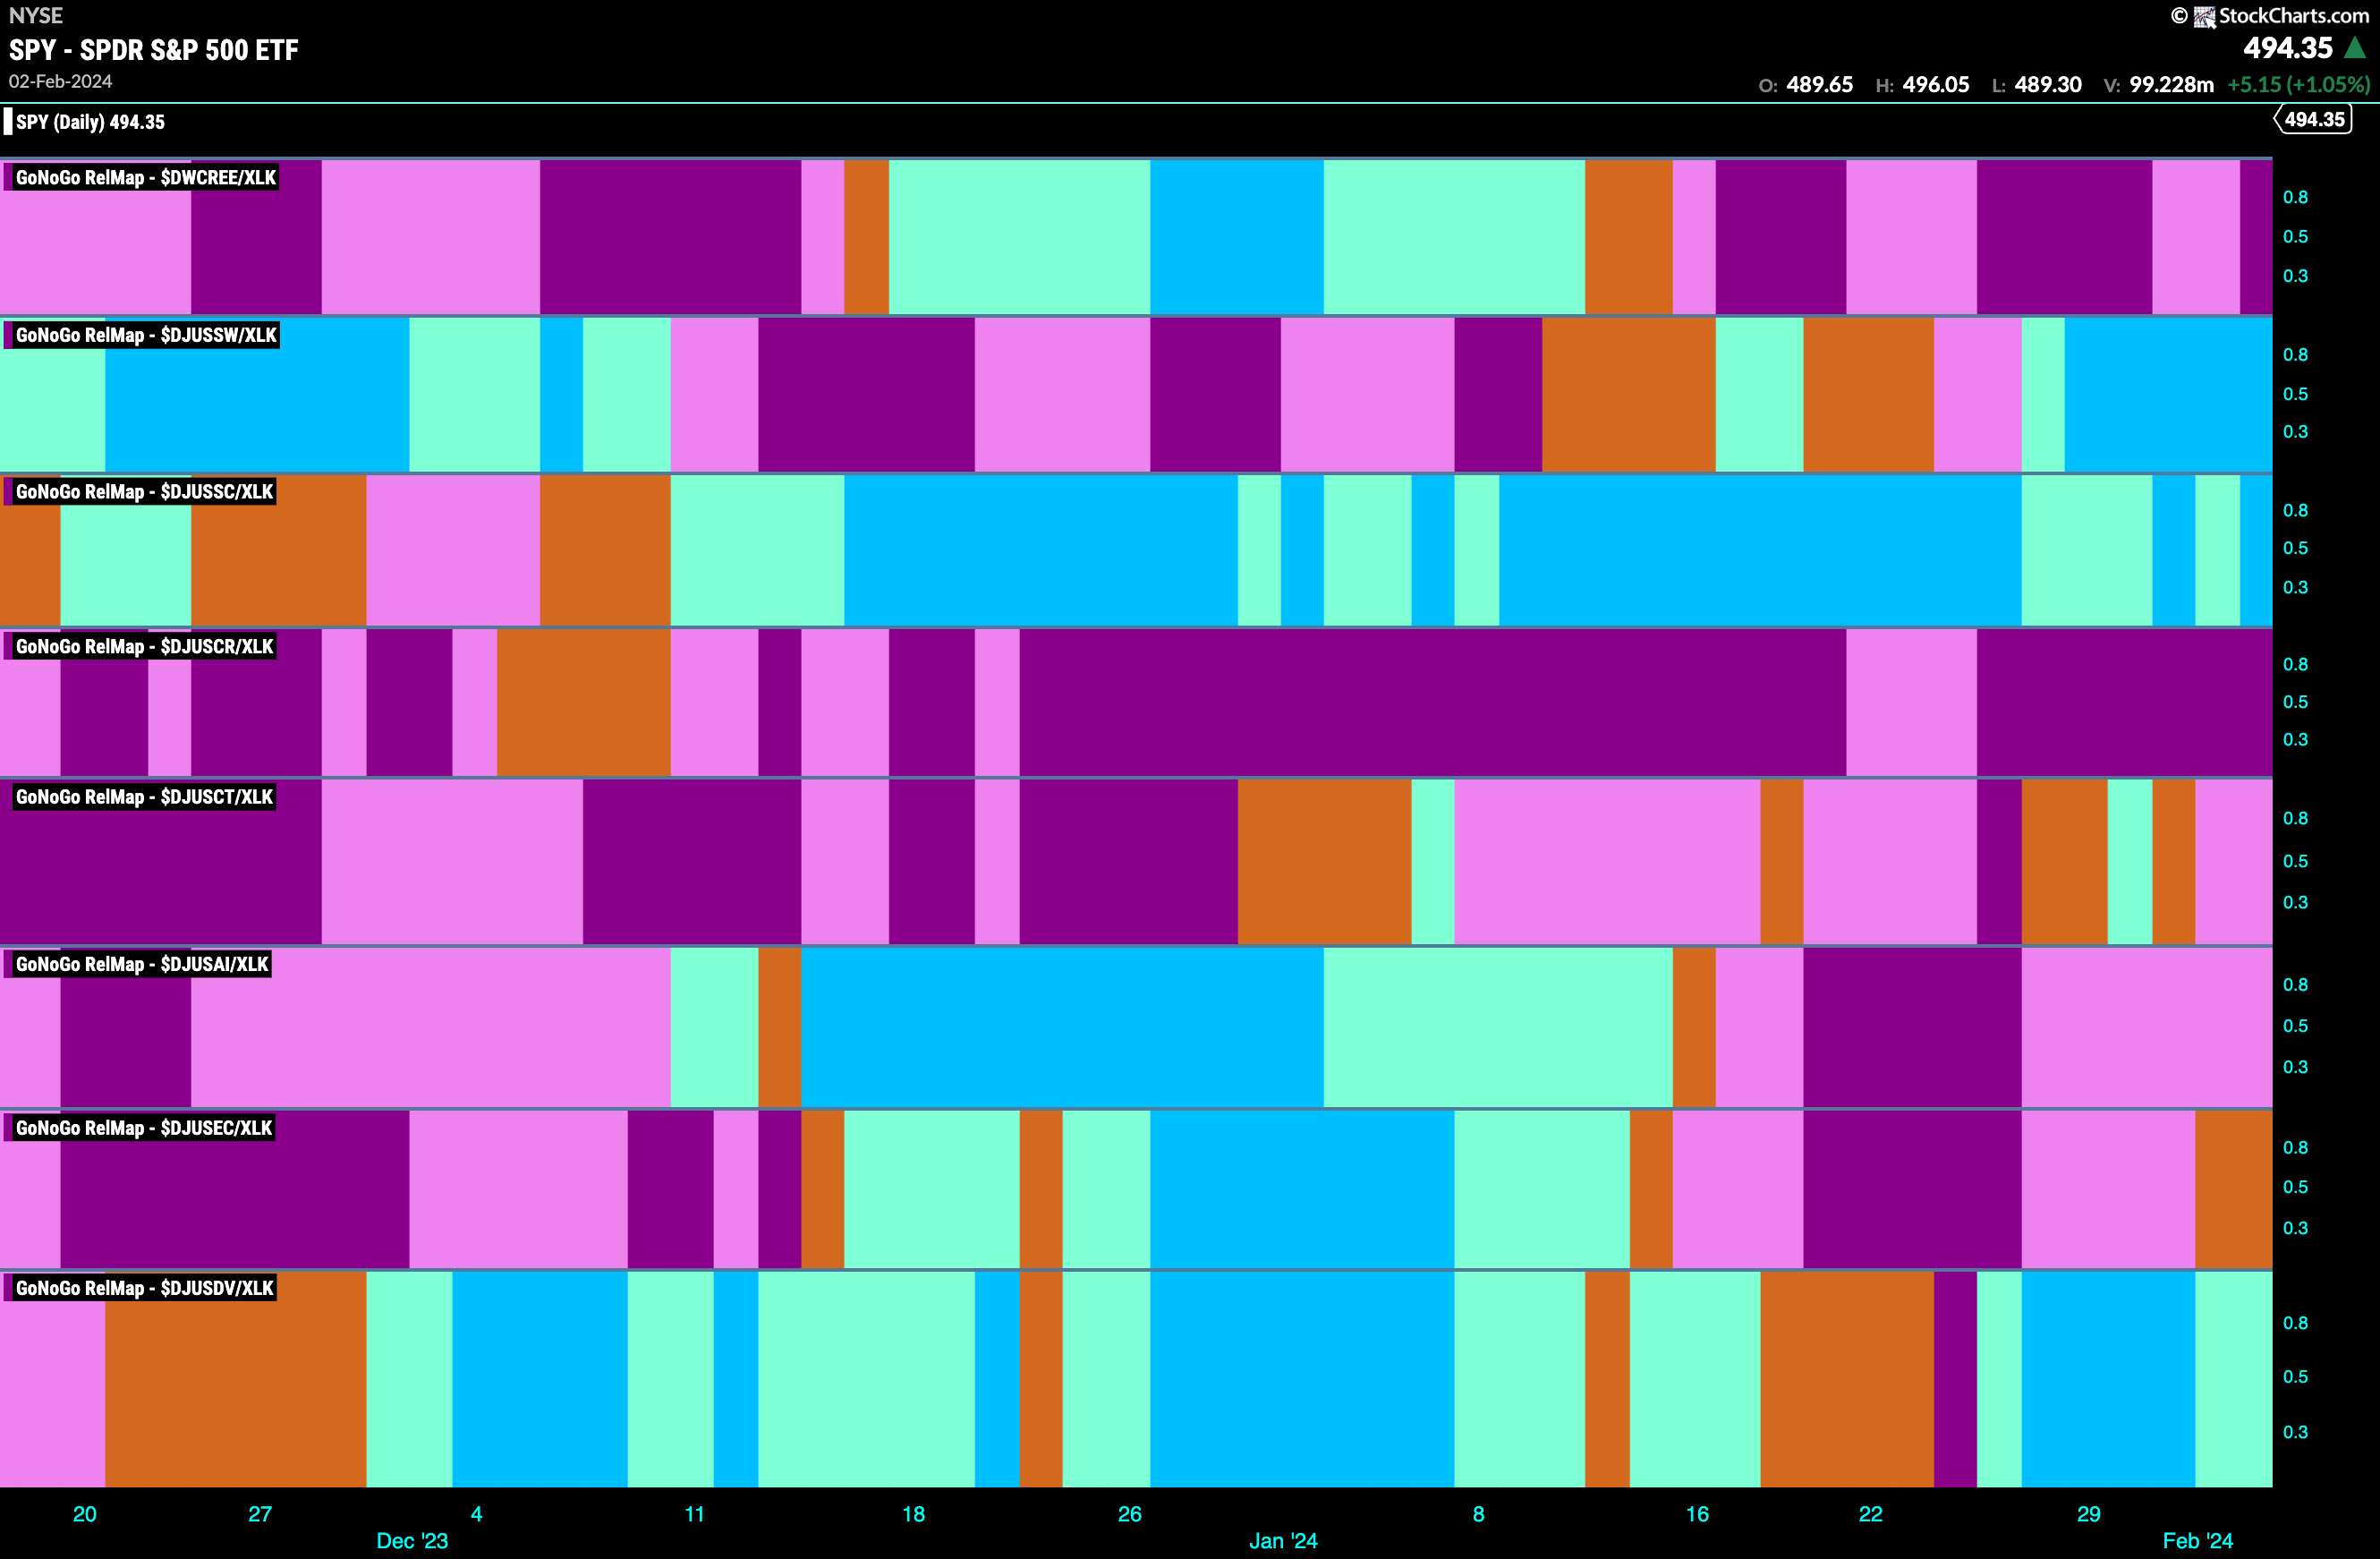
The GoNoGo Sector RelMap above shows that the communications sector continues to outperform on a relative basis for another week. Below, we see the individual groups of the sector relative to the sector itself. We apply the GoNoGo Trend to those ratios and see that the software index painted a week of strong blue “Go” bars in the second panel.
$FOUR Tests Zero Four Times!
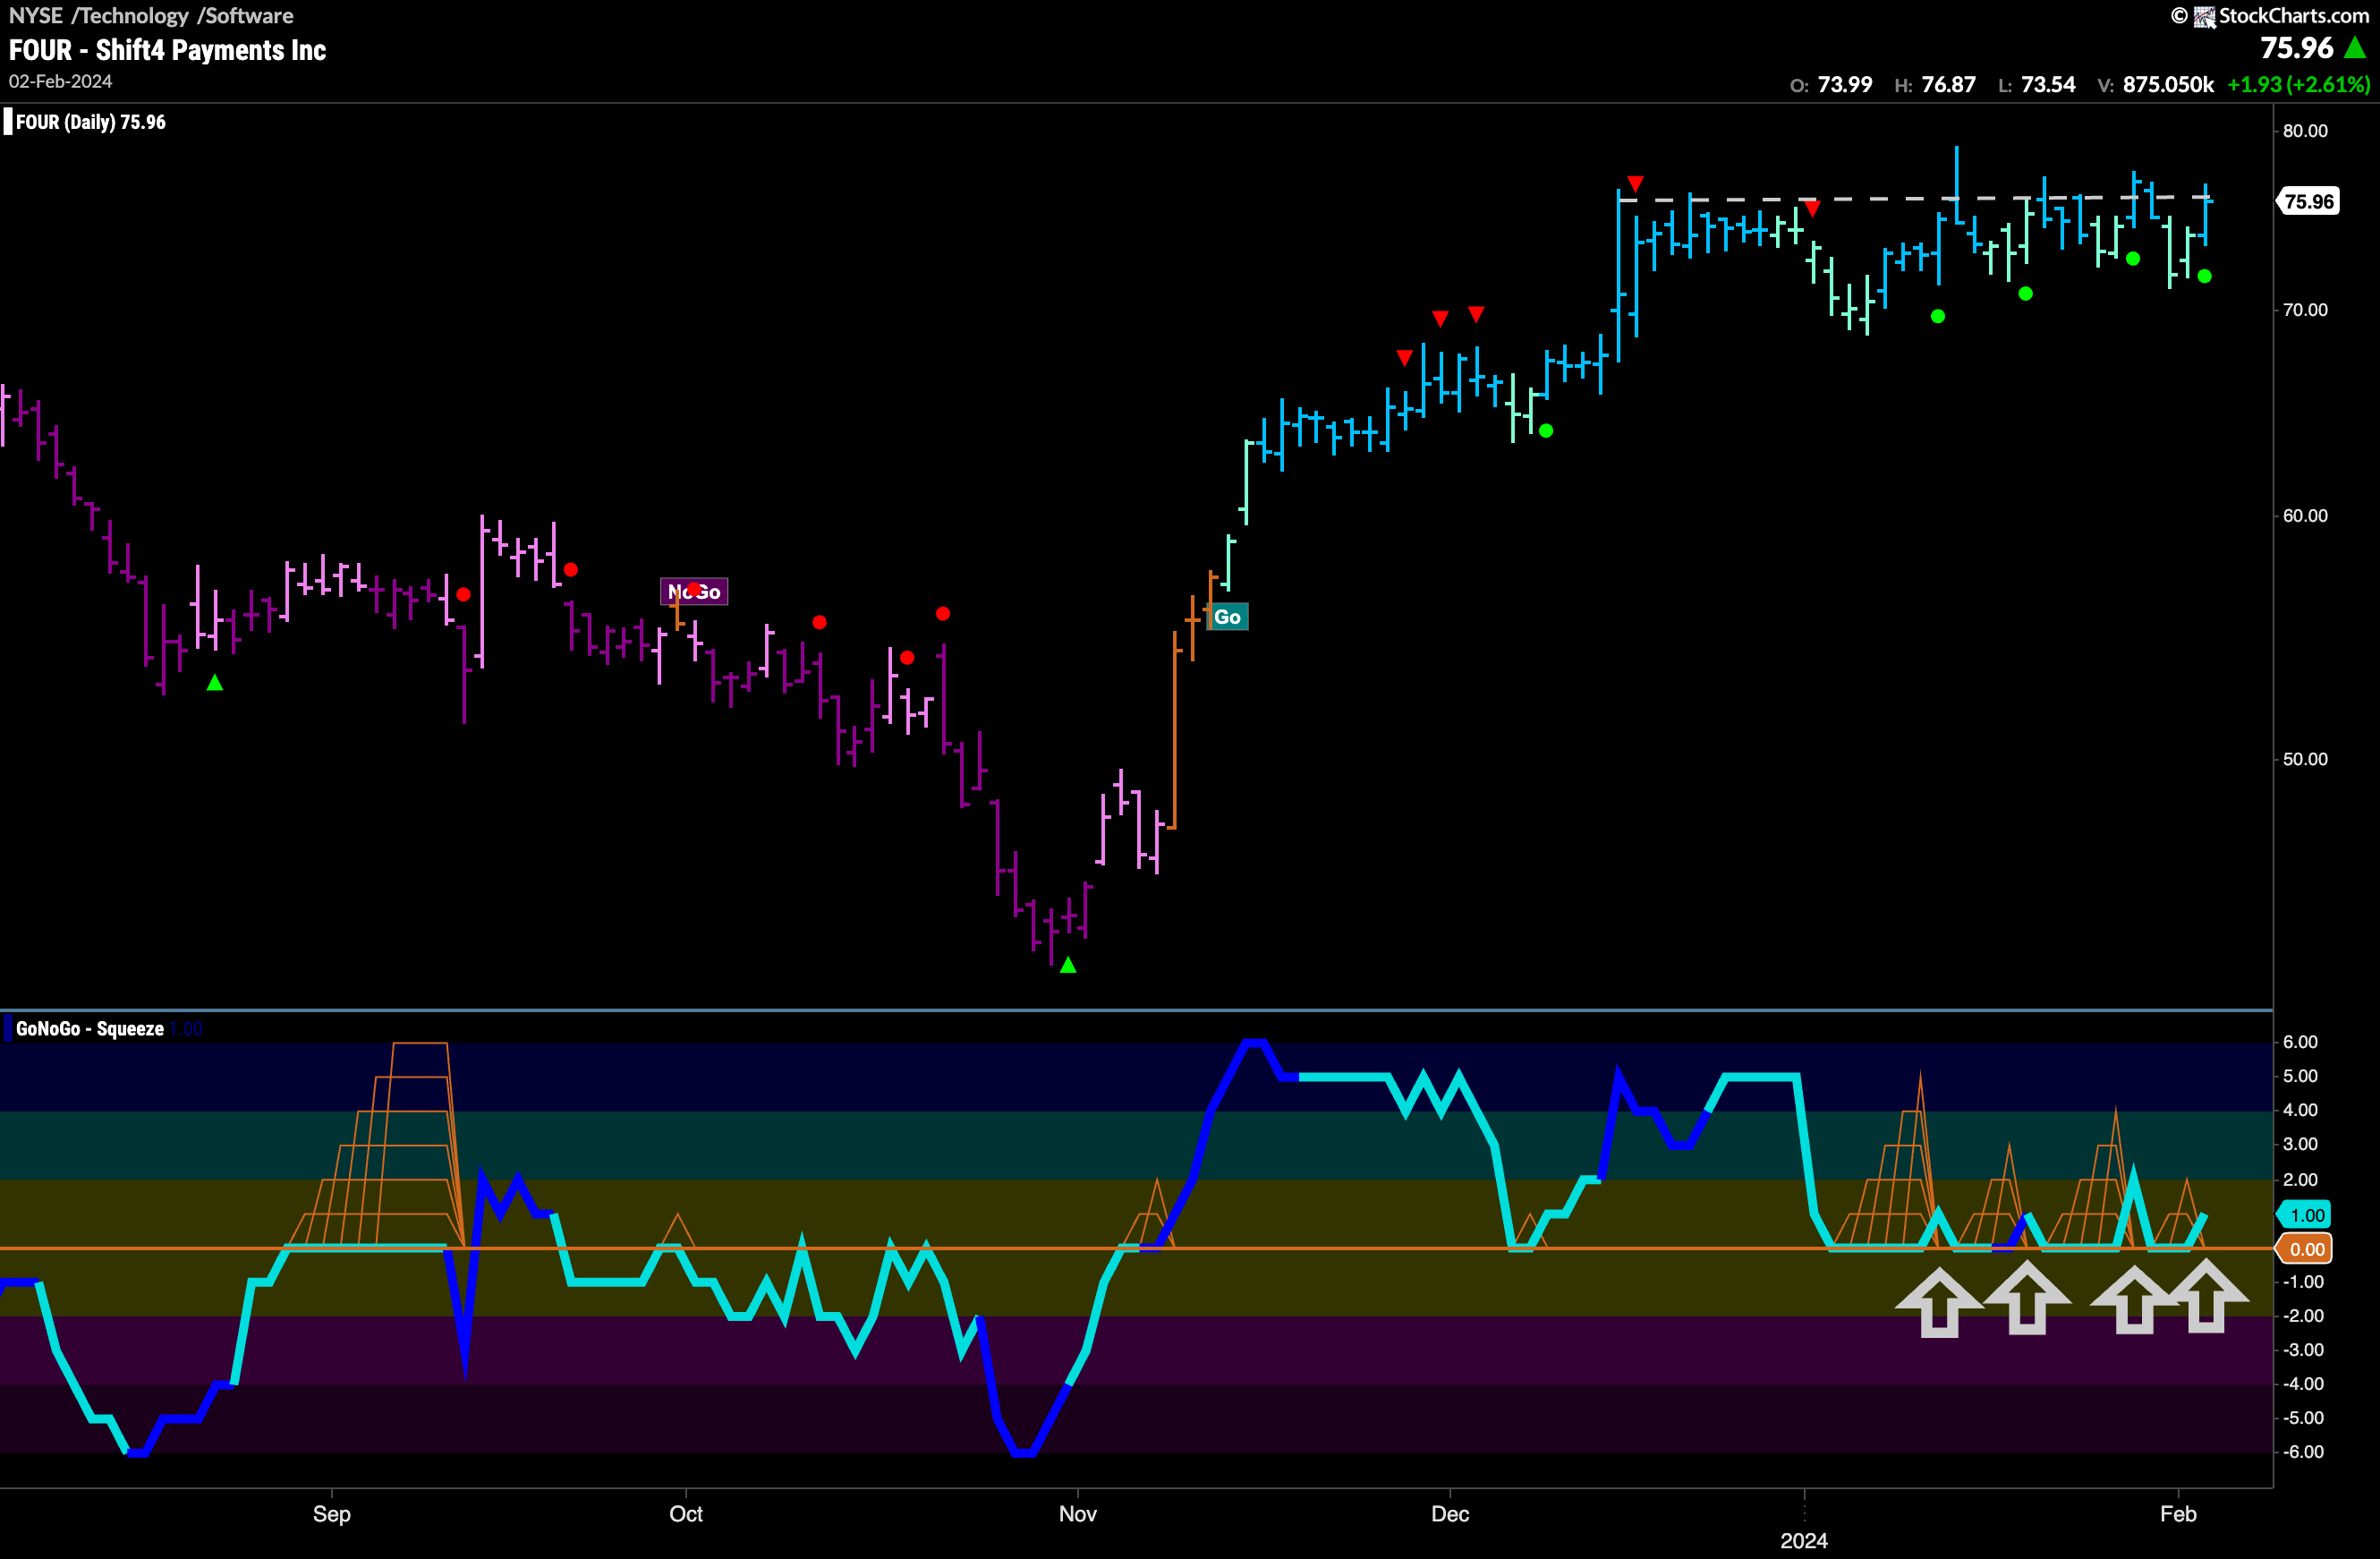
$FOUR is in a “Go” trend that has climbed since November of last year. However, after Go Countertrend Correction Icons in December and early January price has moved mostly sideways. We have seen weaker aqua “Go” bars interspersed with the stronger blue bars this entire time and GoNoGo Oscillator fell to test the zero line. During the price consolidation, the oscillator has found support at the zero line 4 times! With this clustering of Go Trend Continuation Icons we will watch to see if this momentum support can give price the push it needs to break to new highs.
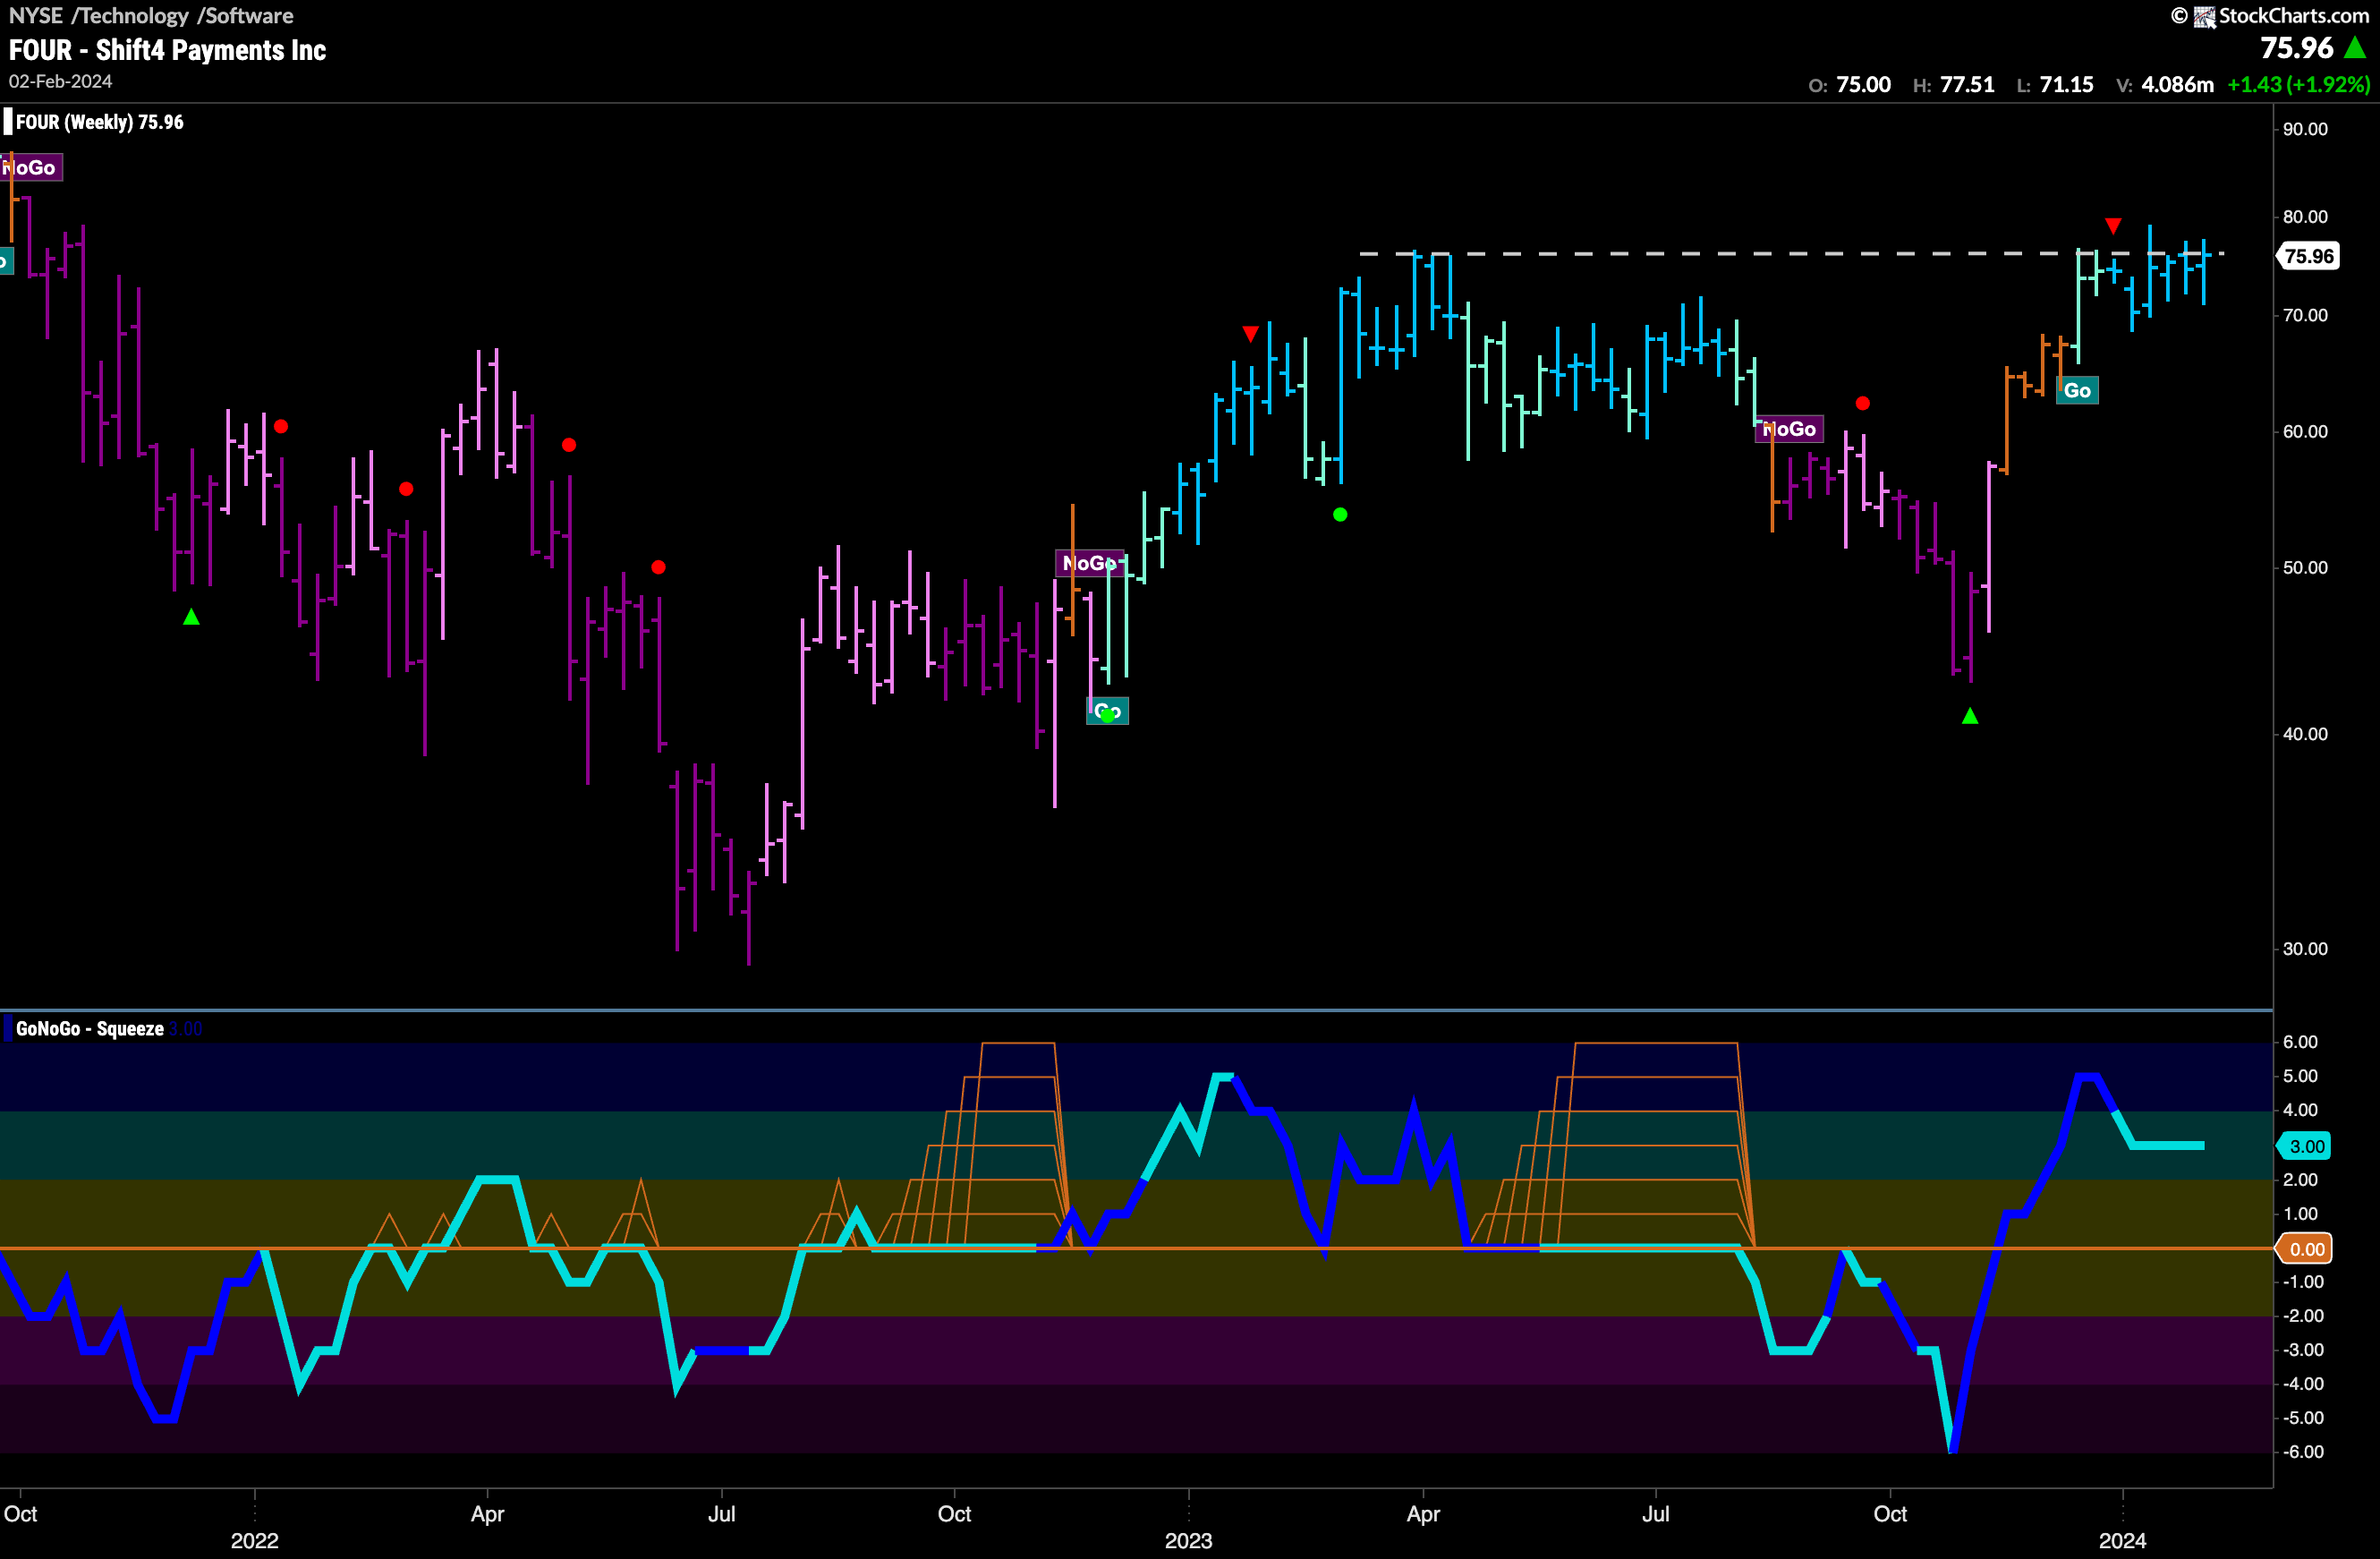
The weekly chart shows that this resistance is coming from prior highs that were hit in the first half of 2023. If price can eclipse these levels then we could see a real move higher. Currently, GoNoGo Trend is painting strong blue “Go” bars and GoNoGo Oscillator is in positive territory but not overbought at a value of 3.
$DDOG ALso Looking to Set Higher High
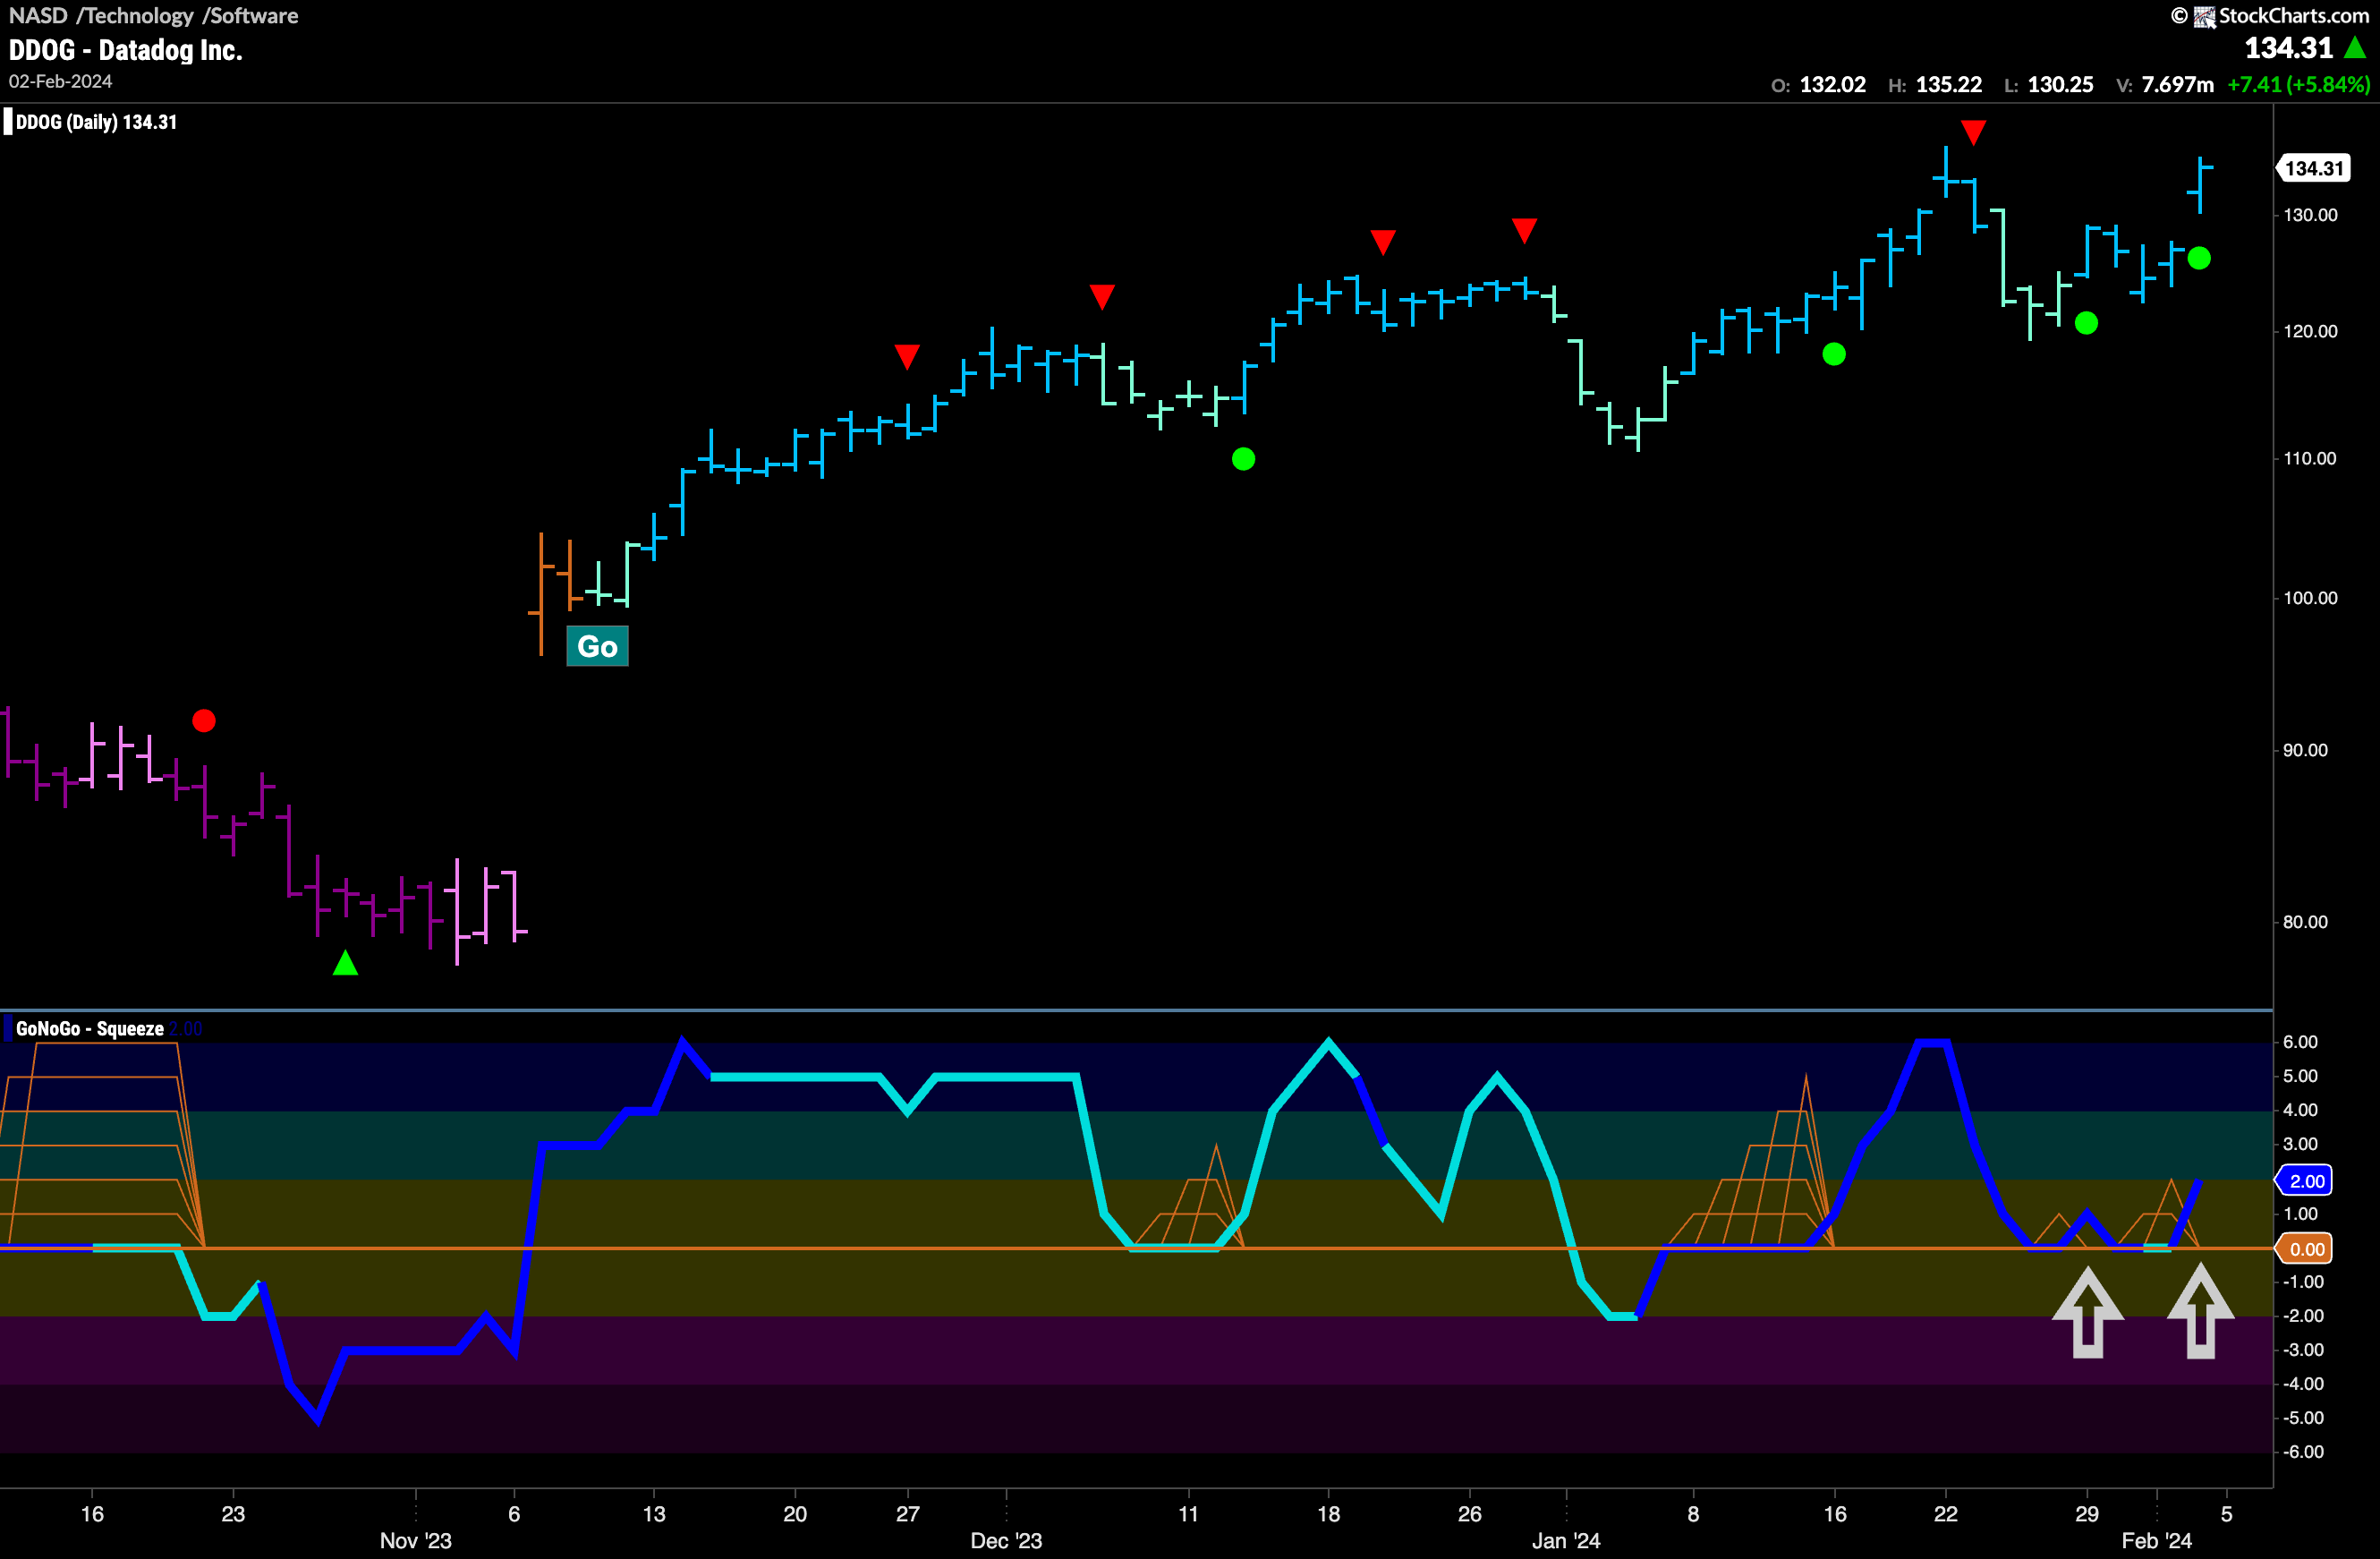
$DDOG has likewise been in a “Go” trend since November of last year and the “Go” trend has been inching higher with a series of higher highs and higher lows. We are in need of another higher high in order for us to know this “Go” trend is still healthy. We see that GoNoGo Trend is painting strong blue “Go” bars and GoNoGo Oscillator is finding support at the zero line on heavy volume. With momentum resurgent in the direction of the trend, we can look for trend continuation and price to make an attempt to move to a new high.
