Investors have physics envy. We want a simple equation that explains the complex ecosystem of irrational hordes buying and selling the ever-growing list of securities and their derivatives. Not so much an elegant theorem as caveman speak, but go ahead and put this on a post-it note and stick it on your monitor:
$ ⇓ = β ⇑ ...meaning: "Dollar Down, Beta Up."
There is a powerful inverse correlation between the US Dollar index and many risk assets around the world including equities from emerging markets, commodities, and even cryptocurrencies. In this issue of Flight Path, GoNoGo Research will focus some attention outside the US Equity space to see where important market trends may accelerate in the context of the falling dollar. In this difficult second year of the bull market, many investors have been stymied by persistent rotation away from the darlings of the 2020 rally and into cyclical names. Those trends continue, and a weaker US Dollar may be the accelerant needed to help price breakout above some key resistance zones for many indices and global securities.
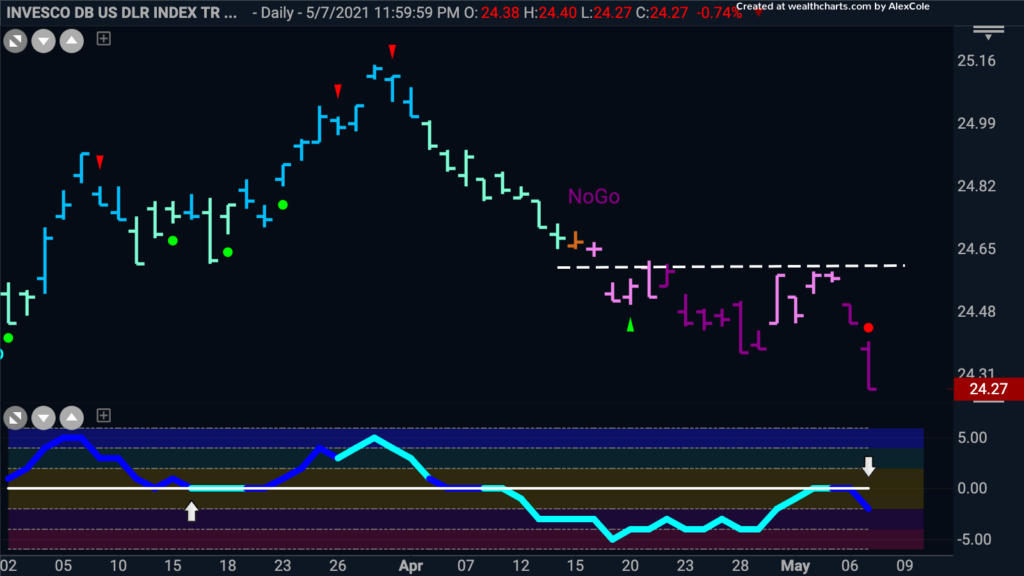
US Dollar Resumes “NoGo” After Countertrend Rally
Following the remarkably strong “NoGo” trend for the US Dollar index last year, 2021 has largely been a story of countertrend rally or mean reversion. As $DXY was plodding higher, it challenged some of the prominent trends of 2020. This week those correlation questions were silenced by the sharpest decline in the dollar index in 6-months. GoNoGo Charts show a fully confirmed resumption of the “NoGo” trend and a test of the January lows is a logical next target. Further weakness from the US Dollar could restore tailwinds for risk assets across the board including, Stocks, Commodities, and even Cryptocurrencies.
Emerging Markets Stocks Could See Resurgence of 2020 Trends
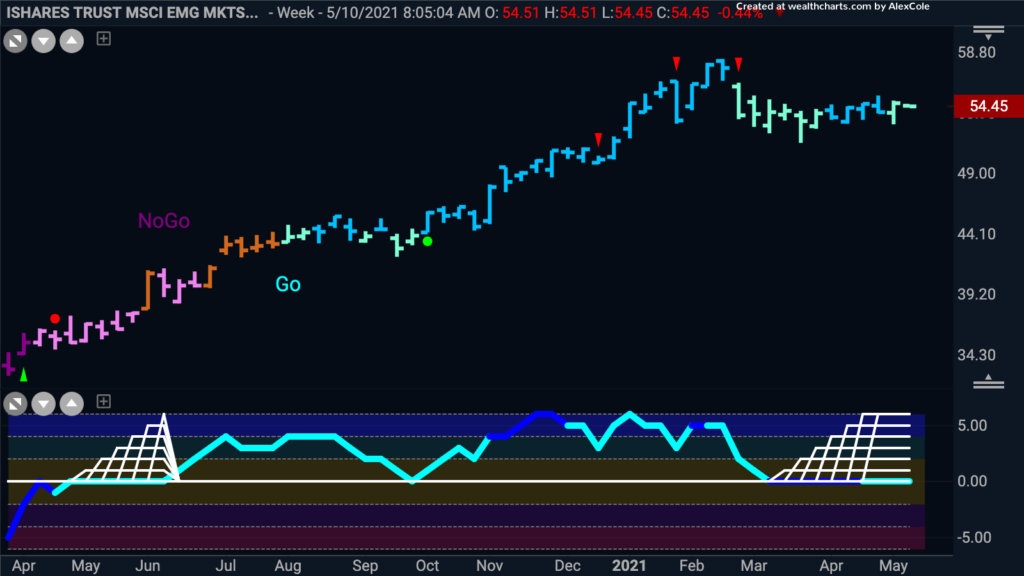
High beta assets led the rally off the March lows in 2020. As the weekly GoNoGo Trend® chart below shows, after a fully confirmed high-momentum rally through the end of 2020, $EEM has been consolidating since February. Price remains in a “Go” trend condition painting aqua and blue bars after signaling a countertrend correction with the red arrows. GoNoGo Oscillator® has been riding the zero line for multiple weeks leading to a max reading of the GoNoGo Squeeze®. If the weaker US dollar indeed provides the necessary thrust to breakout, we could see a sizeable move in the direction of the underlying trend.
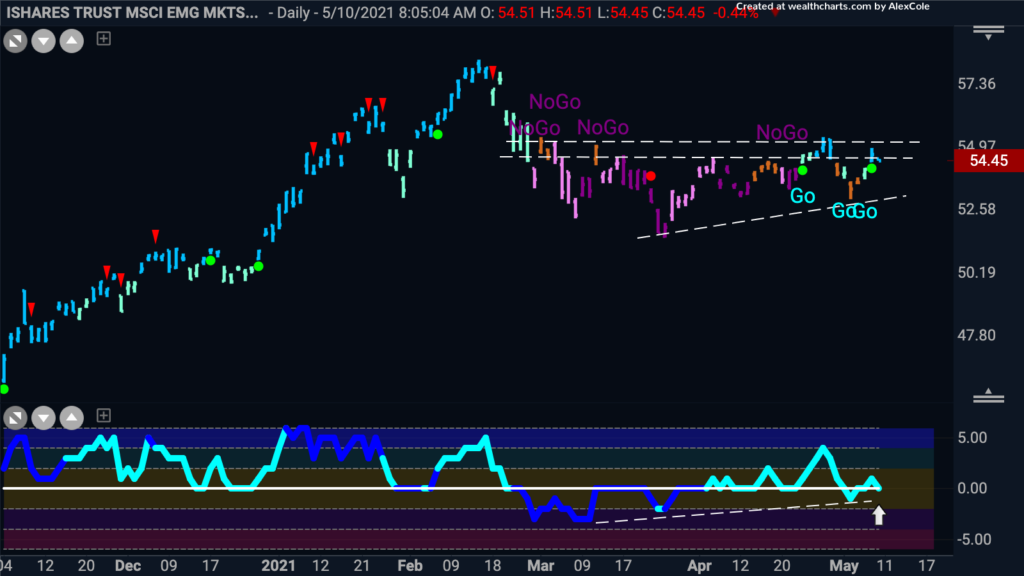
Drilling down to a daily period for the $EEM, we can see several classical technical elements which add further conviction to the idea that the path of least resistance is higher for emerging markets stocks.
Concentrating on Leadership within Emerging Markets
As discussed for weeks in GoNoGo Research, investors have seen a rotation to cyclical sectors of the S&P 500 such as energy and financials, materials, and industrials. Within the emerging markets, we see many countries with higher natural resource exposure but have also seen humanitarian crises with respect to the Covid pandemic’s second and third waves of infection and the need for reinforced lockdown measures. Nowhere has the population been at less risk and the economy been more heavily driven by financial services than Singapore. Just look at the clarity of the “Go” trend for the MSCI Singapore ETF below:
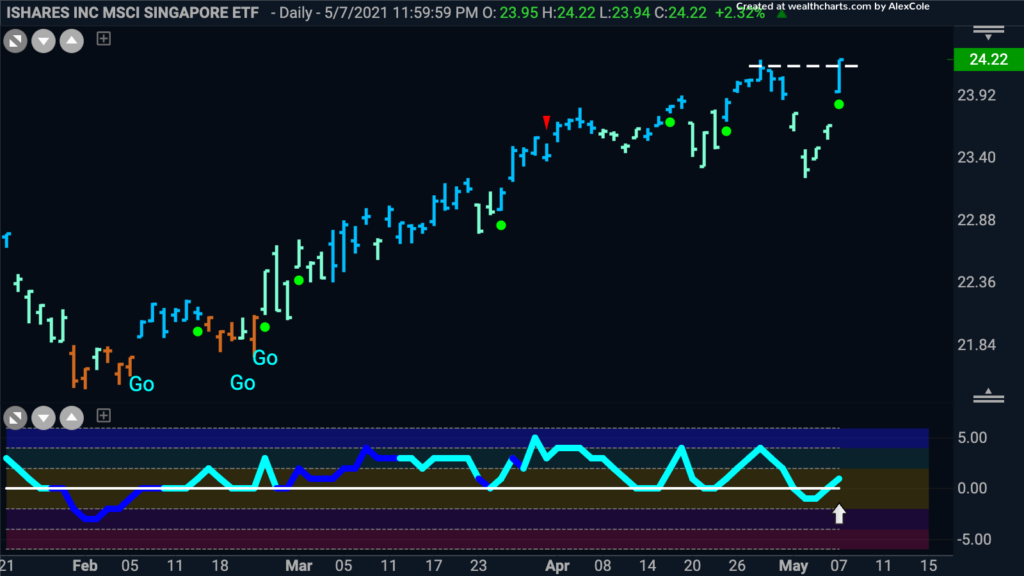
Most importantly, the Price gapped up on Friday with a return to positive momentum to close at all-time highs. That is a recipe for many institutional investors to take a very bullish position towards Singaporean equities.
Commodities in the Context of Cheap $USD
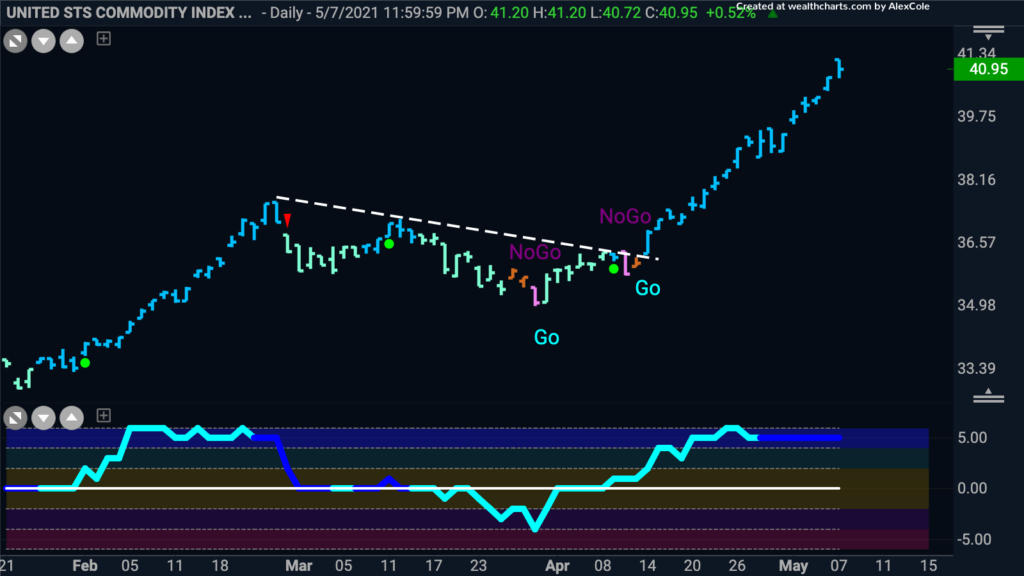
Another risk asset that is likely to be buoyed by weakness in the dollar index is the commodities index.
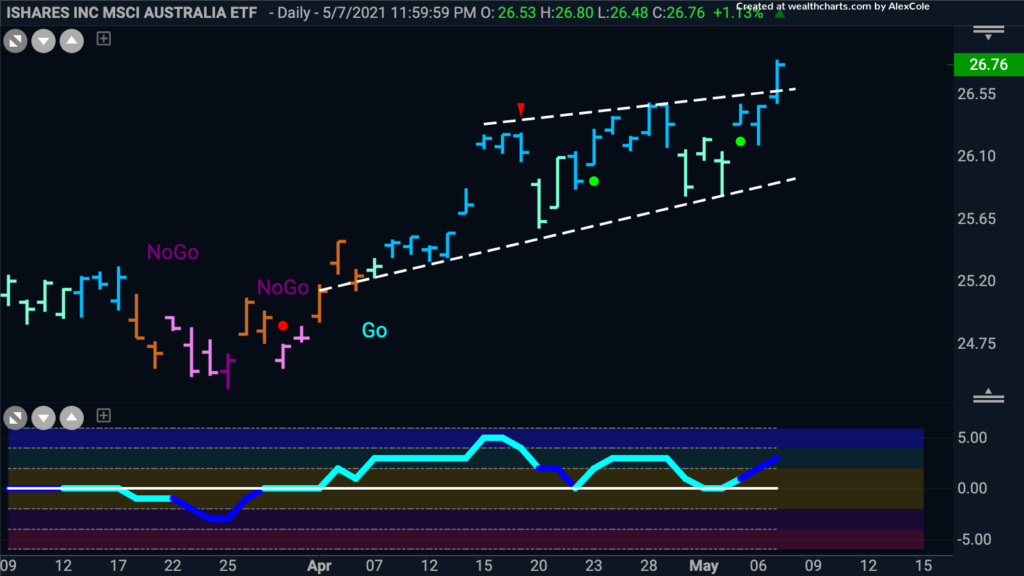
One country with enormous exposure to natural resources including mining and metals is Australia. In addition to natural gas and petroleum reserves, Australia is the world’s leading producer of bauxite, ilmenite, rutile, iron ore, and zircon, the second-largest producer of alumina, gold, lead, lithium, manganese ore, and zinc, the third-largest producer of uranium, and the world’s fourth-largest producer of black coal, nickel, and silver. The GoNoGo Trend chart below shows a strong “Go” trend represented by bright blue bars with the GoNoGo Oscillator confirming by moving higher with heavy volume.
Copper continuing to climb
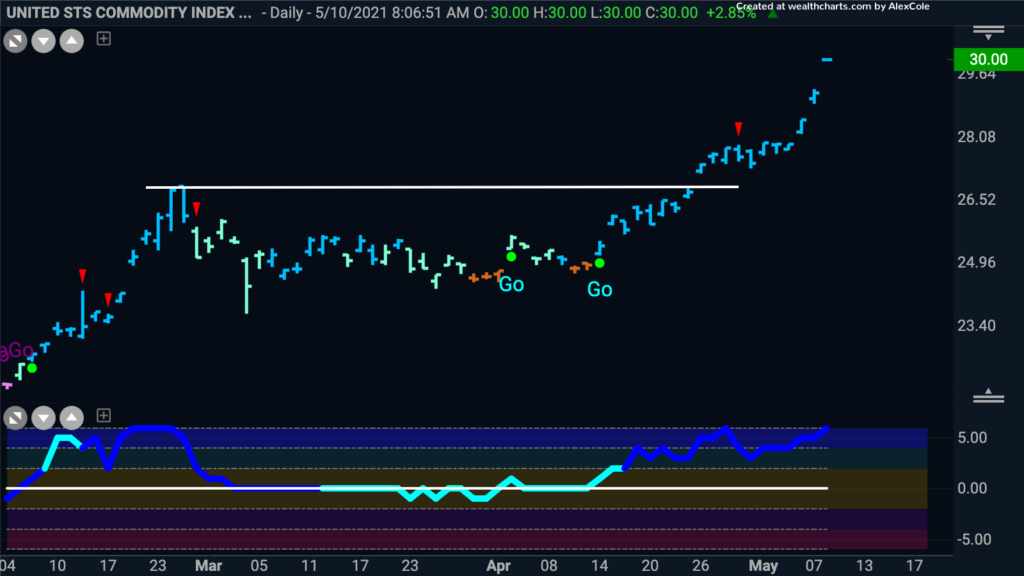
The Chart below shows the GoNoGo daily chart of $CPER, the United States Copper Index Fund. Over the past several weeks we have noted the trend in this metal, as it thrives in the current economic environment that is favoring a re-opening of the economy here in the U.S. After gapping higher to break above the prior high from the end of February, price consolidated at those levels before climbing incredibly sharply to end last week. Pre market trading shows still higher prices this morning. The GoNoGo Oscillator is at extremes, indicating overbought conditions. We will watch to see if it remains elevated or returns to neutral which would suggest a pause in this rally.
Loving Lowe’s in this Market
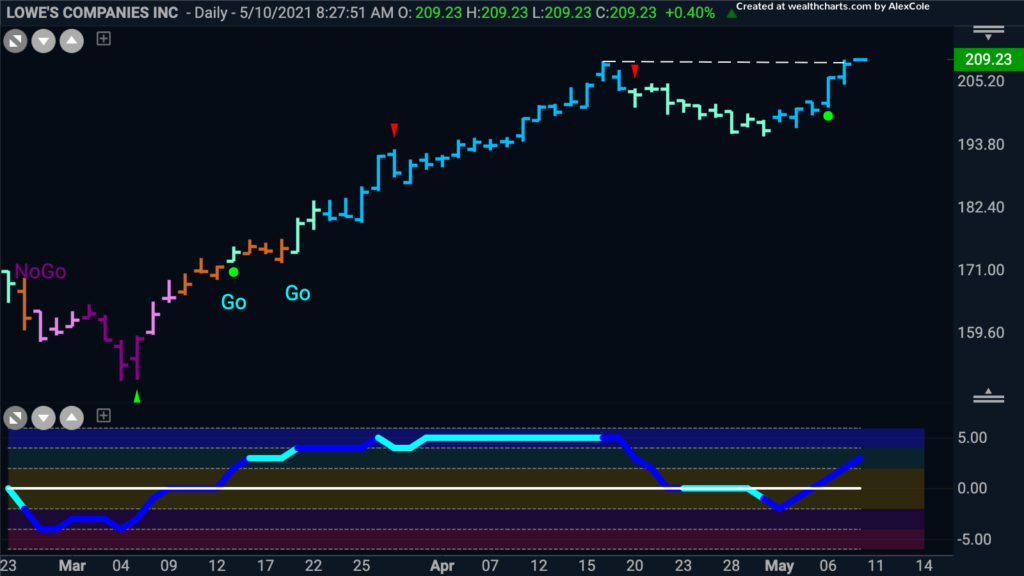
As we have noted in recent months, the trends are in materials and industrials and other areas of industry that are well positioned to continue to see strength going forward. Home improvement is certainly one of those! It seems as though you cannot drive a whole block without seeing major house renovations or rebuilds. So we’ll end this Flight Path with a look at $LOW. The chart below is a daily GoNoGo Chart of $LOW and we can see that we are bumping up against recent high from mid April. The GoNoGo Oscillator has crossed back into positive territory and on heavy volume. If the recent trends continue, look for price to get above that high. Perhaps everyone was out doing work around the house for Mother’s day yesterday!