Selling pressure for US equities was dominant last week. September was unfavorable for trends in risk assets, however the long-term “Go” trends for many sectors and indices remain intact. A jump in interest rates reflected inflation concerns and expectations for the Fed to begin tapering this year. The return of rising-rate anxiety spurred the first 5% market pullback since September of 2020.
Choppy markets left the NASDAQ down more than 3%, the S&P 500 shedding more than 2%, and the Dow losing just over 1% in a week defined by style and sector rotation. U.S. large-cap value stocks outperformed their growth counterparts by a wide margin. Last week’s tape restores value’s performance lead over the growth equity style on a year-to-date basis.
Rates Drive Rotation (Again)
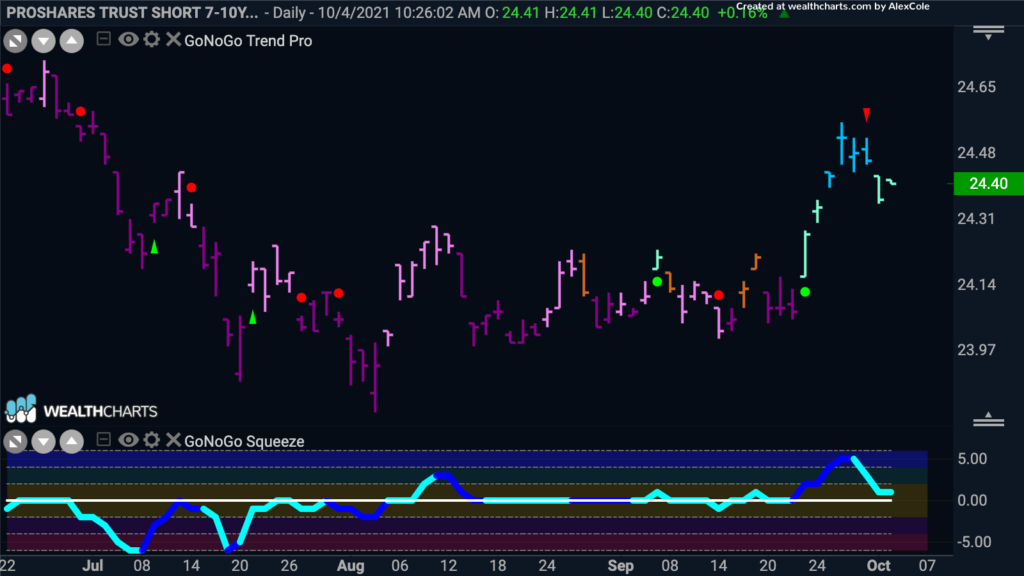
The rise in rates has hit growth and technology stocks hardest. The Treasury market was a major source of discomfort, as the 10-yr yield hit 1.56% early in the week amid expectations for sustained inflation pressures and eventual Fed tapering. Considering the 10-yr yield flirted with 1.30% last week, this rate of change didn’t sit well for the elevated valuations of the growth stocks. See the GoNoGo Chart of $TBX Pro Shares Short 7-10 ETF designed as a vehicle to capture bearish treasury price moves, rising yields.
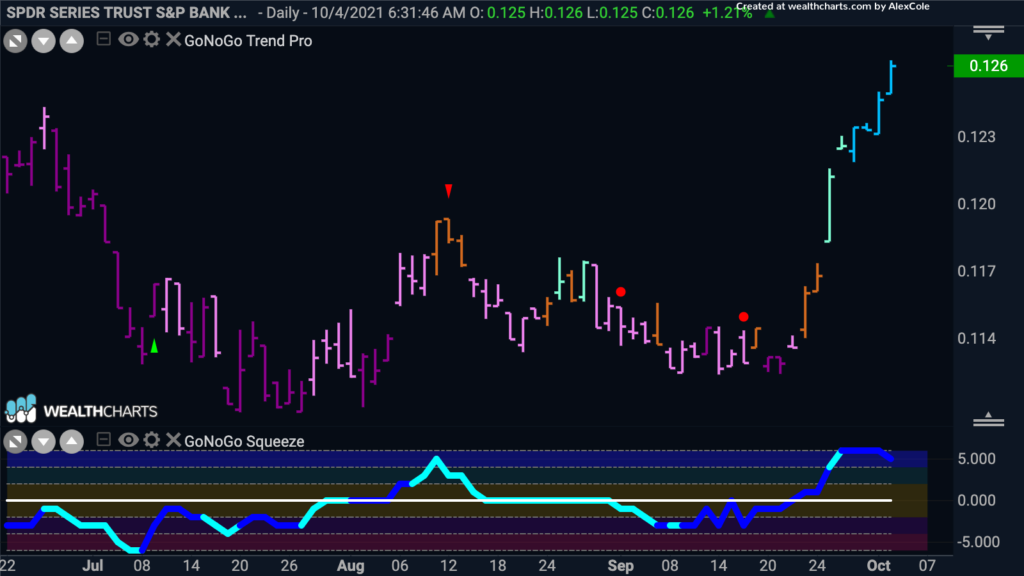
As we know from prior cycles, a steepening yield curve is a strong tailwind for the Financials sector. Most specifically bank stocks which profit from favorable lending conditions have a striking outperformance in this market environment. Consider the $KBE an ETF comprised solely of bank stocks. The GoNoGO Chart below illustrates the powerful momentum driving these shares higher on a relative basis:
Mega-cap tech names such as Apple, Amazon, Google, Microsoft and Facebook account for roughly one-fifth of the S&P 500. Concentration within the indices was a factor in last week’s volatility.
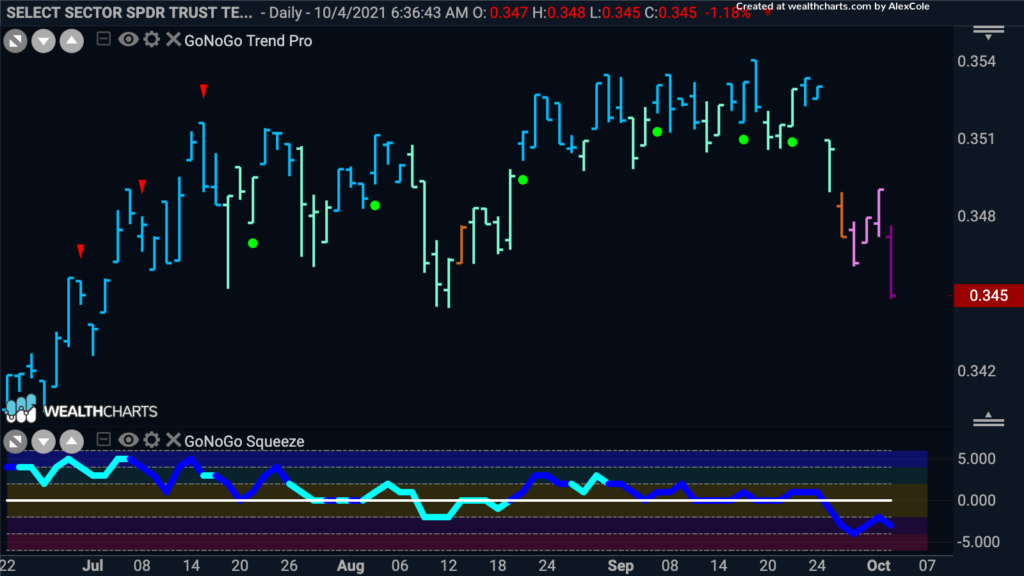
See the relative ratio GoNoGo Trend Chart of the technology sector ETF to the benchmark S&P 500 $XLK/SPX below which declined precipitously last week from Amber neutral and into a “NoGo” trend:
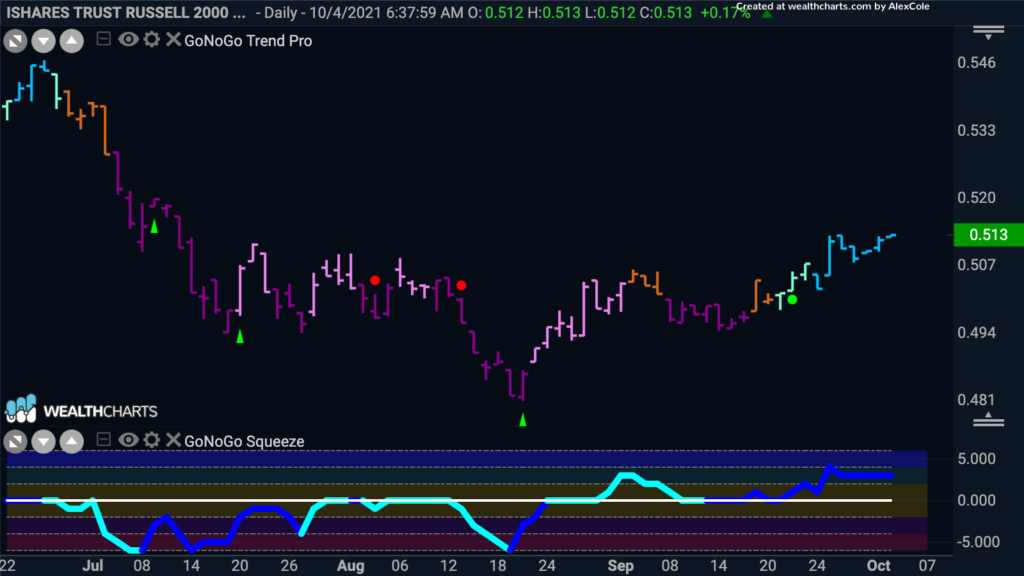
Although it also posted a weekly decline, a benchmark of U.S. small-cap stocks outperformed its large-cap peer by a wide margin. After rallying on Monday and Tuesday, the Russell 2000 Index fell just 0.3% for the week, while its large-cap counterpart dropped 2.3%. See the ratio chart below of the Russell 2000 to the S&P 500 $IWM/SPX which entered a strong “Go” trend last week:
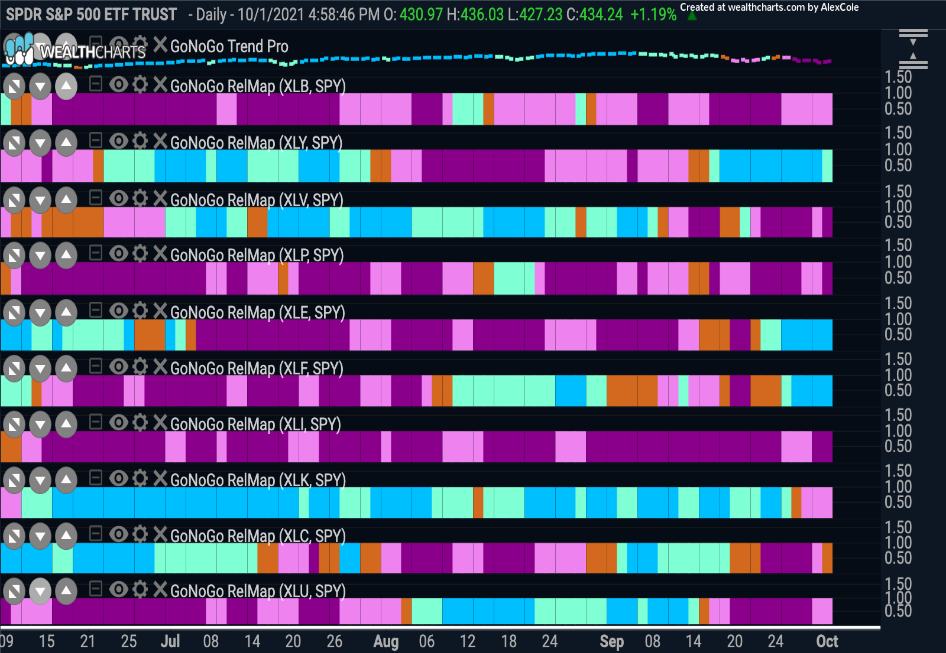
On a sector basis, consumer discretionary $XLY, Financials $XLF and Energy shares $XLE outperformed the index as a rotation back to cyclical sectors and value stocks emerged just as it did early in 2021. See the daily GoNoGo RelMap of each equity sector ETF compared to the benchmark below:
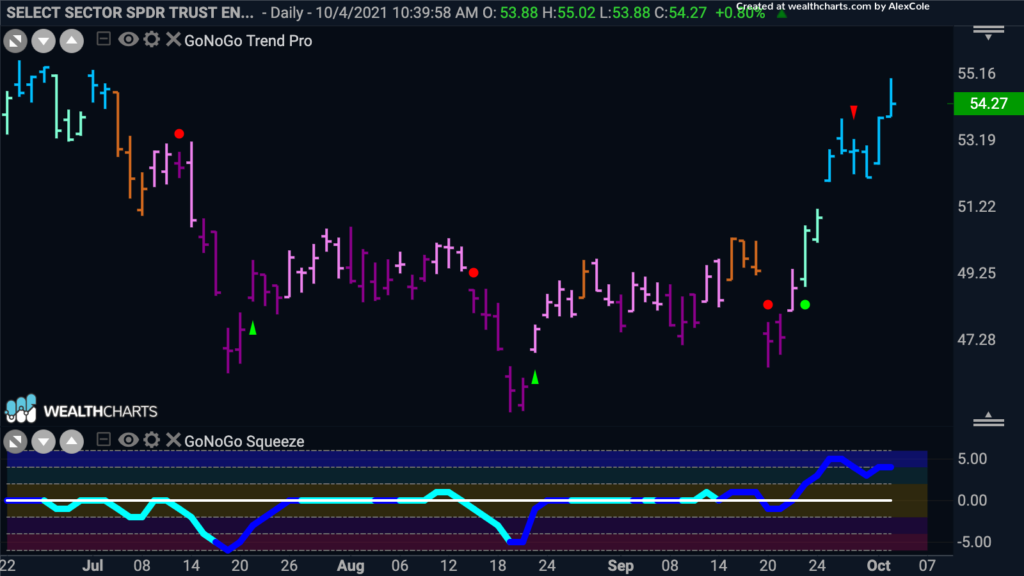
Last week ended on a high note, as new money got put to work on the first day of October, but the damage was already done. The S&P 500 information technology (-3.3%) and health care (-3.5%) sectors dropped more than 3.0%, while the energy sector (+5.8%) was the only group that closed higher — and it rallied 6%. Positive momentum in energy prices fed into the inflation narrative, as reports discussed fuel shortages in the UK and an energy crunch in China. WTI crude futures rose 2.5% to $75.87/bbl.See the chart below of the $XLE:
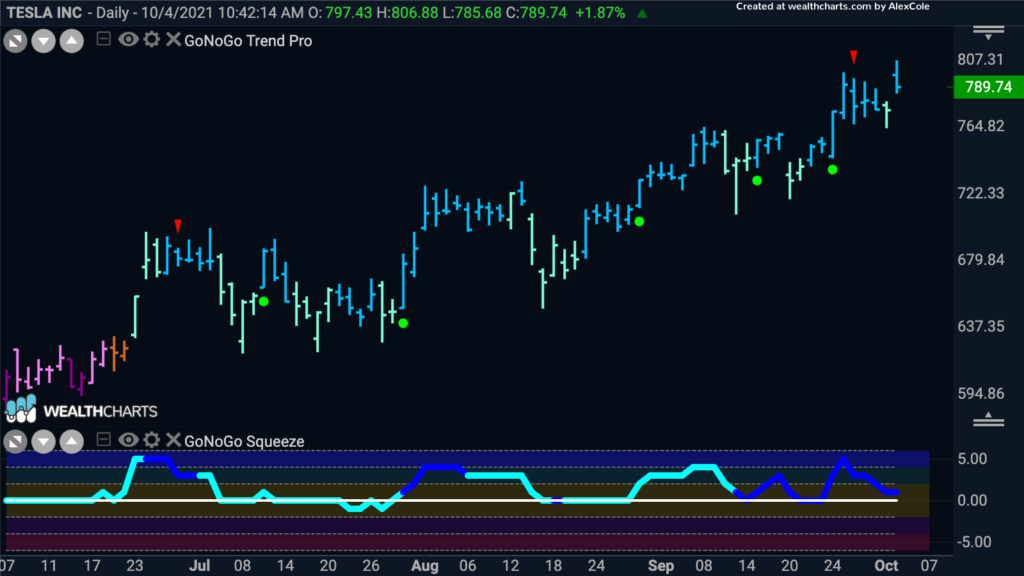
The concentration of cap-weighted sector ETFs contributed to the relative performance of the $XLY. Tesla remains the largest constituent of the sector and $TSLA’s durable “Go” trend buoyed the relative performance of the sector. See the GoNoGo Chart of $TSLA:
Monthly Picture in View:
The S&P 500 saw its string of seven consecutive monthly gains snapped, as the index fell 4.8% in September—its biggest monthly decline since March 2020. Despite the pullback, the S&P 500 finished the third quarter with a small overall gain of 0.2% after rising 2.3% in July and 2.9% in August. See the monthly GoNoGo Chart of the $SPY below:
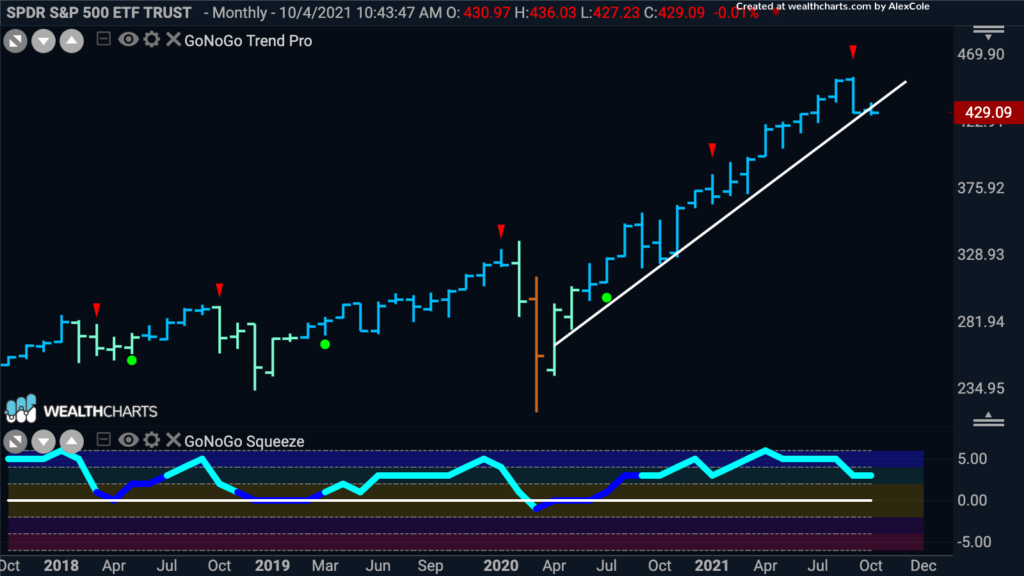
While breaking the upward trend line, the trend conditions – the blend of technical information for the index remains strong and could be setting up for a potential buying opportunity into the 4th quarter.
Consider the weekly timeframe and look specifically at GoNoGO Oscillator which is now riding the zero line. If support is found while the weaker aqua trend is held, a snap back into the trend channel could be possible:
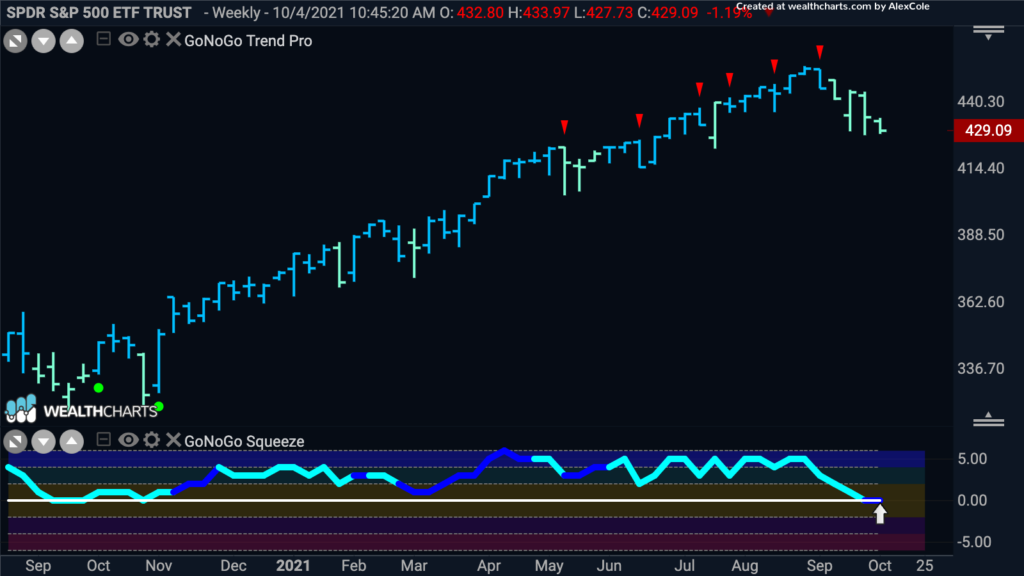
September has historically been the weakest month of the year for the stock market. This trend appears to have held, with the S&P finishing September with a 4.8% decline, just the second monthly loss of 2021 and the worst month since March 2020. Although an upcoming shift by the Fed to start withdrawing stimulus (“tapering”) would be a catalyst for increased market volatility, the blended technical indicators paint a picture of long-term durability amidst sharp countertrend corrections.


