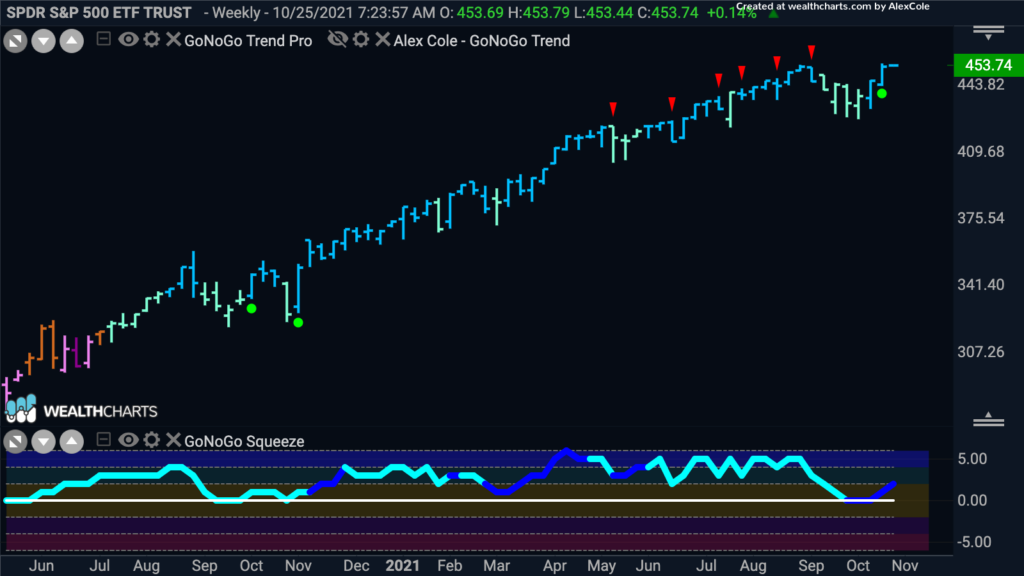
The major U.S. stock indexes climbed 1% to 2% for the week as the S&P 500 and the Dow set records, eclipsing previous highs that they set about two months earlier. See the weekly GoNoGo Chart below of the $SPY showing a strong blue “Go” trend with a resurgence of momentum in the direction of the trend on heavy volume:
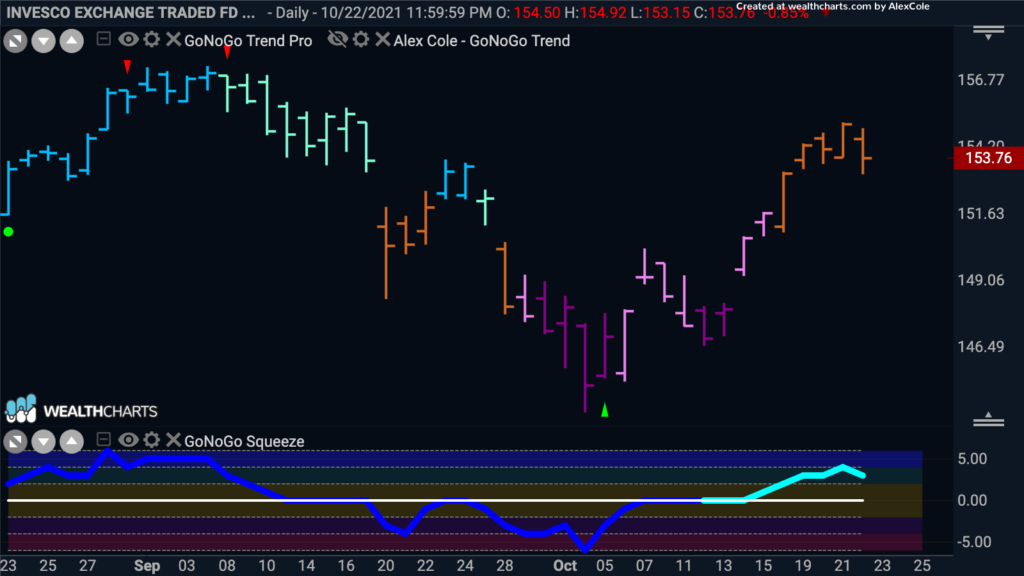
The NASDAQ finished the week less than 2% below a record that it set in early September. The Nasdaq ETF has been rallying out of the “NoGo” correction and has painted a series of amber “Go Fish” bars as price continues higher since the October 4th low. See the daily GoNoGo Chart below of the $QQQM:
The S&P 500 notched a seven-day winning streak, the longest since July to reach the all-time highs. While still too early to draw conclusions from corporate earnings results, the third-quarter earnings season is off to a solid start, helping lift sentiment. US equities have gained almost 6% this month, fully recovering from last month’s losses.
Bonds for Sale
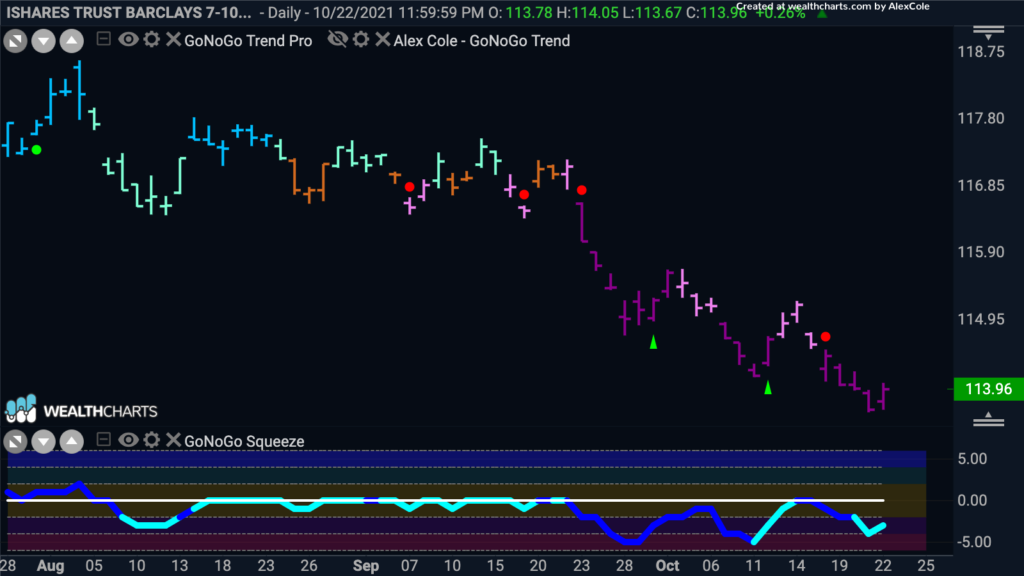
In the Treasury market, maturities across the curve sold off amid expectations for the Fed to hike rates sooner than expected amid persisting inflation pressures. Government bond yields continued to rise, and the yield of the 10-year U.S. Treasury bond reached as high as 1.69% on Friday morning—the highest in more than five months. See the strong “NoGo” trend in $IEF below. Yields slipped Friday afternoon following public comments from Federal Reserve Chair Jerome Powell.
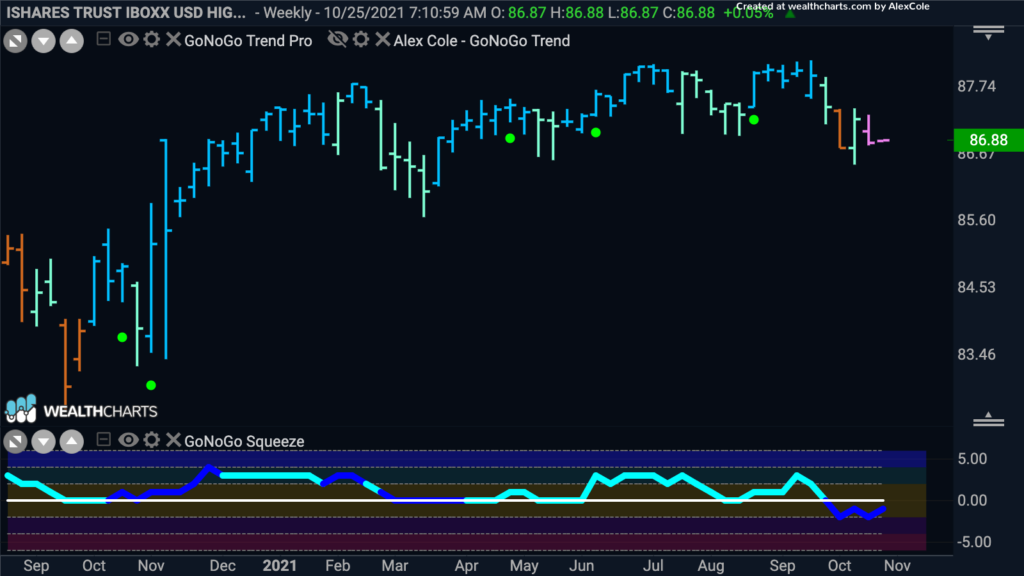
Below is a weekly GoNoGo Chart of High Yield bonds which entered a “NoGo” trend for the first time since August of last year (on a weekly basis). GoNoGo Oscillator shows negative momentum on heavy volume:
Feeling Inflation at the Pump
Inflation pressures are vivid in the in higher oil prices ($83.77/bbl, +1.51, +1.8%). The price of U.S. crude oil rose for the tenth week in a row, eclipsing $84 per barrel on Friday. This rise in oil prices has helped the Energy sector outperform over the past month. See the daily GoNoGo Chart below of $USO which has maintained a strong Go trend since mid-September:
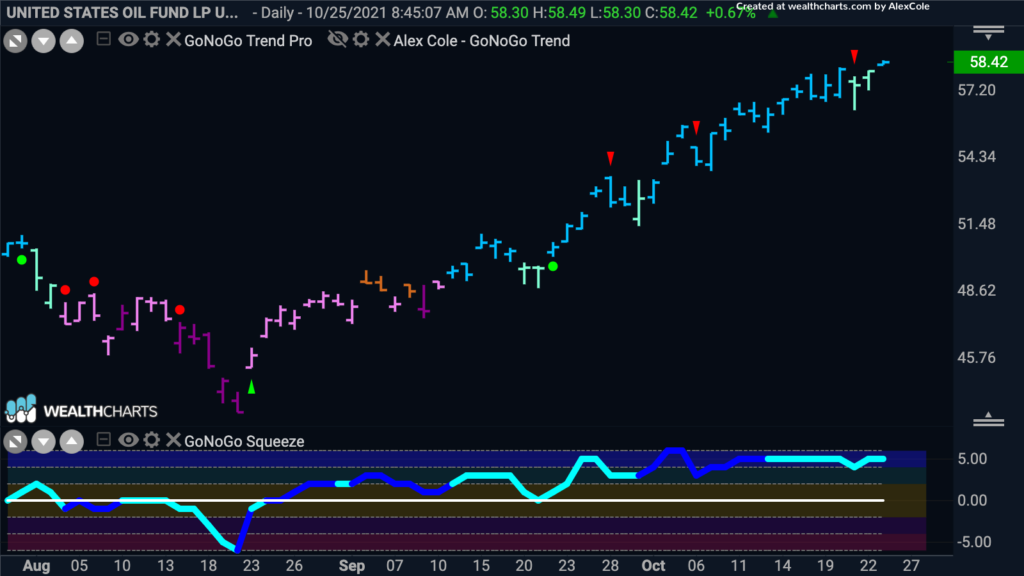
The recent surge in oil prices began in mid-August and has pushed the price of oil to its highest level in about seven years. Federal Reserve Chair Jerome Powell said on Friday that the U.S. central bank was on track to begin reducing its asset purchases soon. However, he said it’s not yet time to raise interest rates because employment levels are still too low. He expects inflation is likely to ease next year as pandemic-related pressures fade.
Oh SNAP!
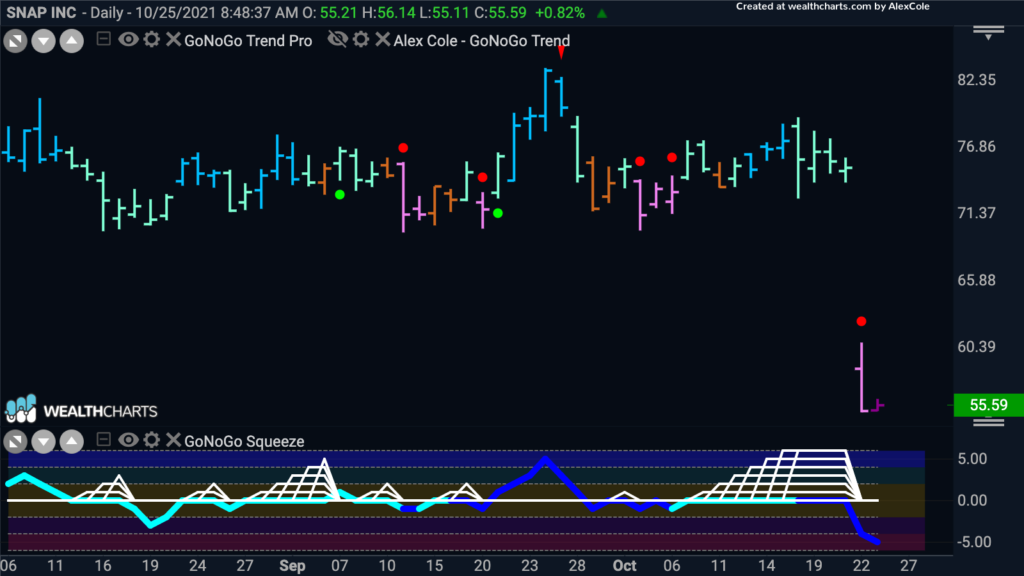
After Snap Inc’s disappointing release on Thursday, the stock plunged more than 20% pulling down the performance of the entire Communications sector for the week after four days of gains. Facebook and Twitter also lost ground over investors’ new understanding of privacy policy restrictions impacting their ad revenues. See the GoNoGo Chart of $SNAP below breaking out of a max squeeze on heavy volume as the stock gapped down:
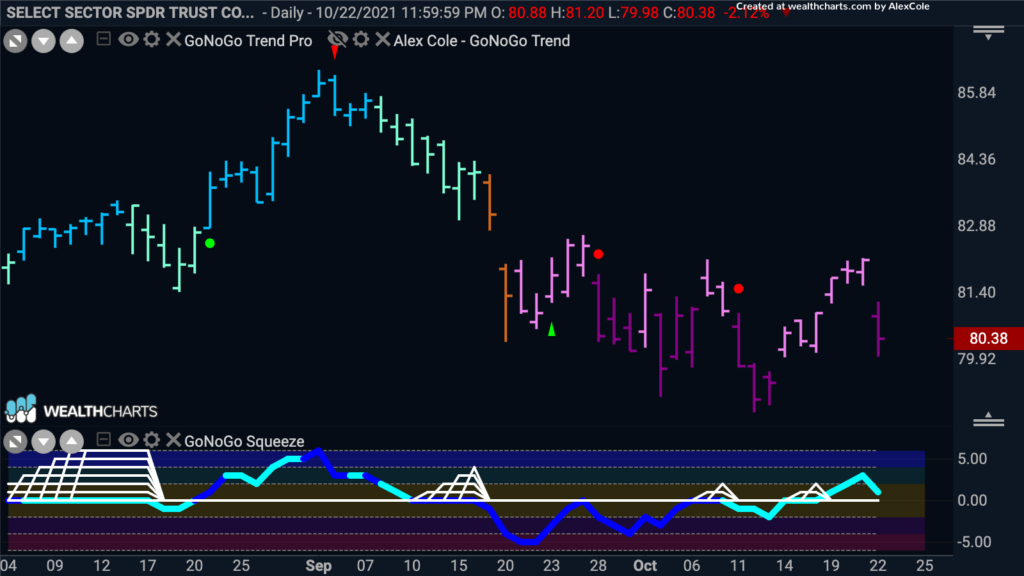
See the NoGo trend for the $XLC:
OUTPERFORMERS are still Outperforming
Rising rates generally present a headwind to growth equities. We’ve seen the technology sector $XLK struggle on a relative basis to the overall equity market in recent weeks. However, it is a market of stocks after all, and when we look under the hood at certain growth equities, some companies continue to outperform. Those durable “Go” trends are driven by strong fundamentals, as is the case with several of the companies highlighted below.
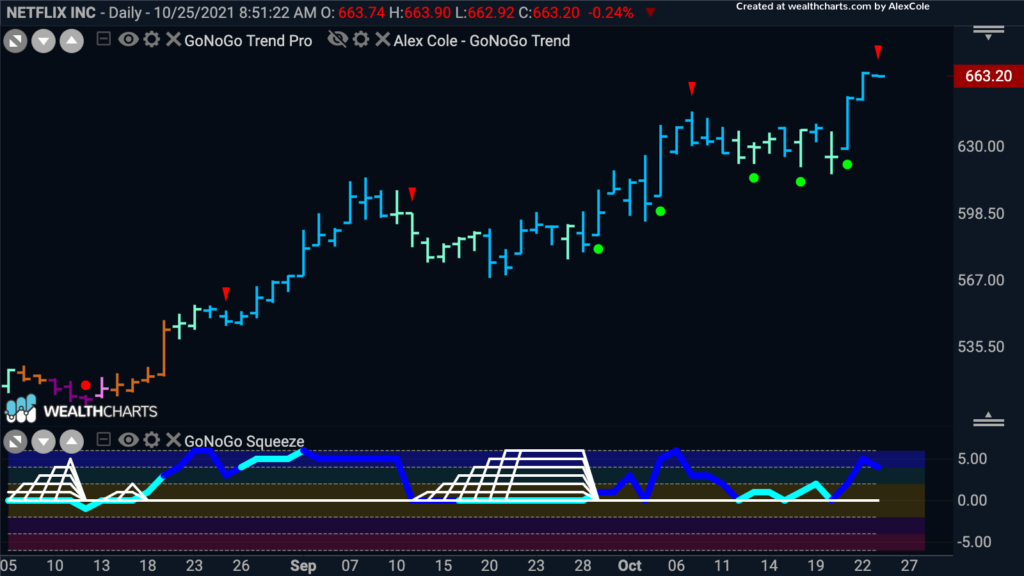
Netflix showed a resurgence of positive momentum in the direction of the underlying “Go” trend this week. See the GoNoGo Oscillator rally off the zero line on heavy volume as prices surged to new all-time highs:
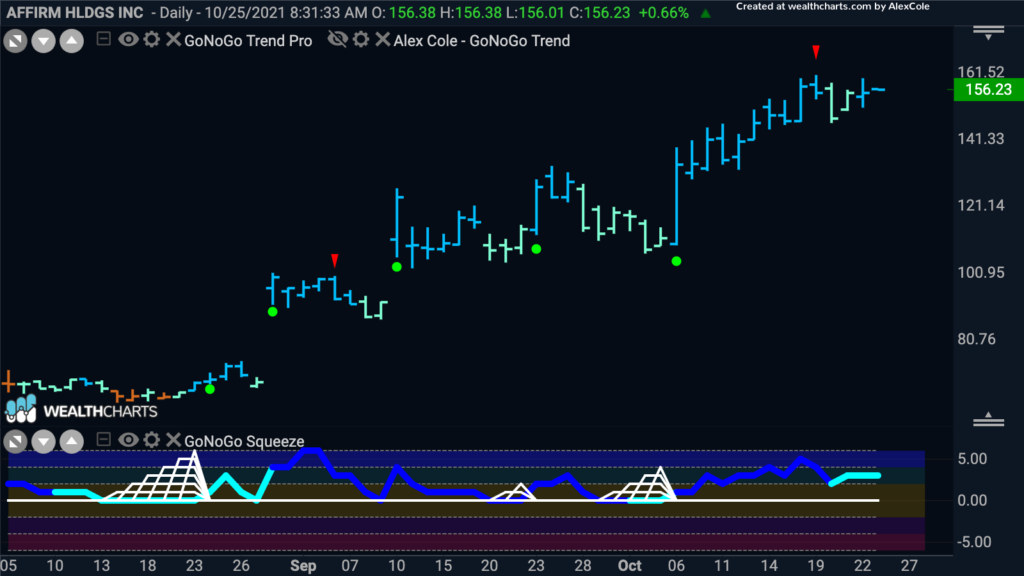
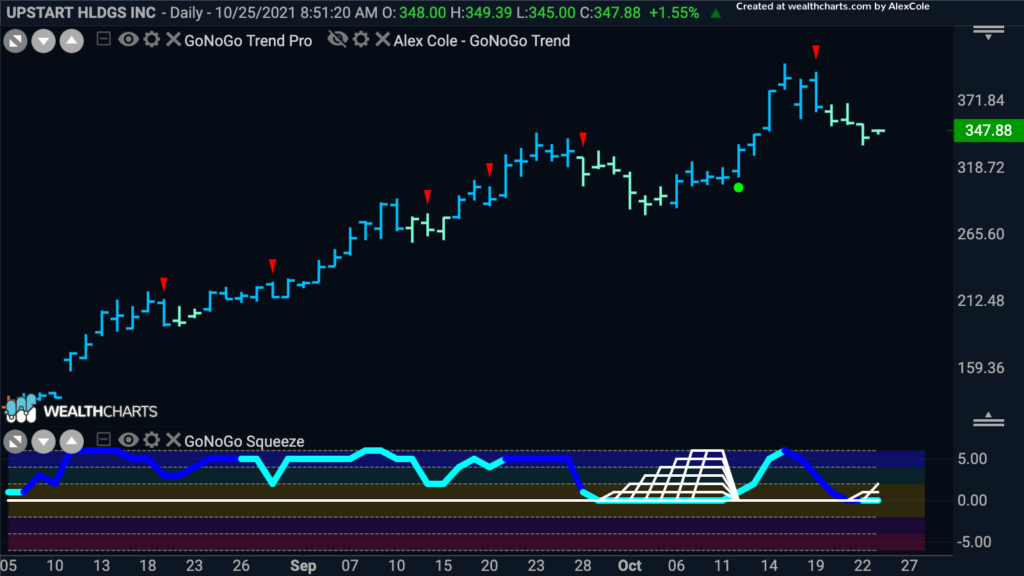
Two other NASDAQ listed companies that have continued to shine through the recent equity selloff are Affirm Holdings and Upstart Holdings. See the GoNoGo Charts below:
