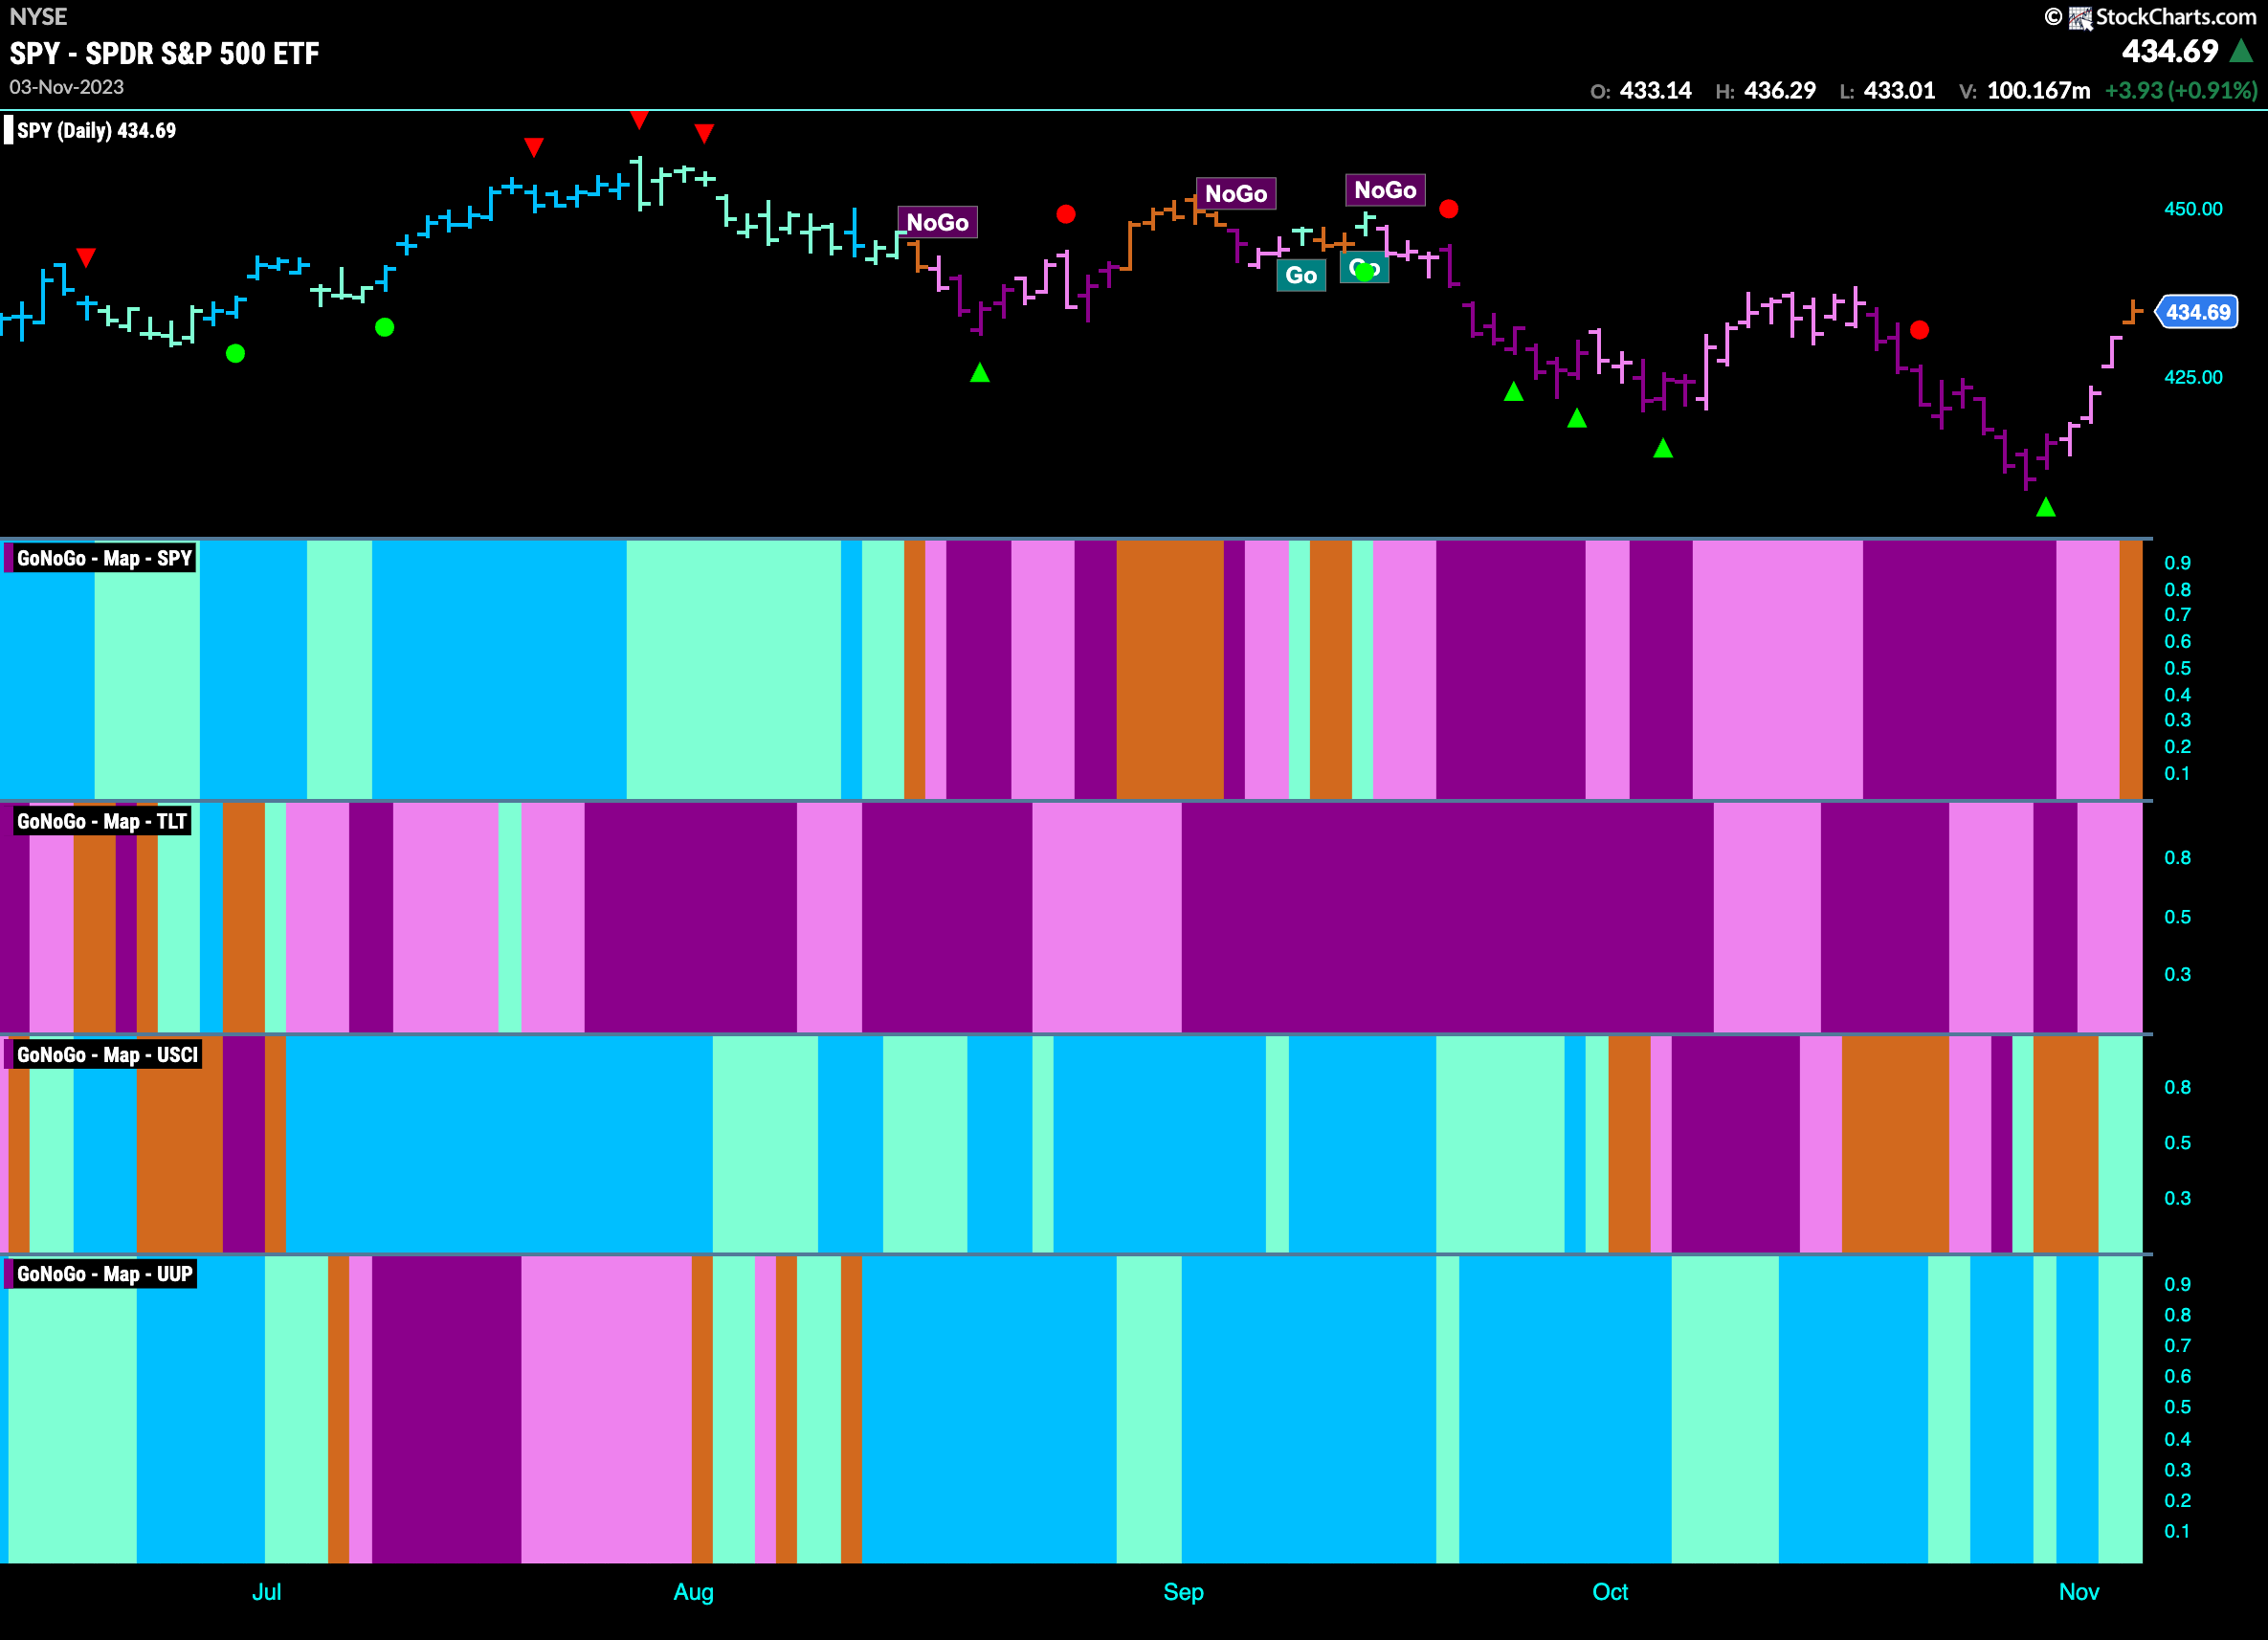
Good morning and welcome to this week’s Flight Path. Well, that was a bit better. We saw U.S. equity price rally strongly off last week’s lows. So much so that GoNoGo Trend painted a few weaker pink bars followed by an amber “Go Fish” bar to end the week. We will watch to see if this week there is follow through and a new “Go” trend. Elsewhere, the trends remained but we saw weakness in the “NoGo” of treasury bond prices. We also saw the dollar weaken but so far hold on to its “Go” trend as it fights against resistance in the form of overhead supply. Commodities, the third panel continue to chop around but end the weak painting aqua “Go” bars.
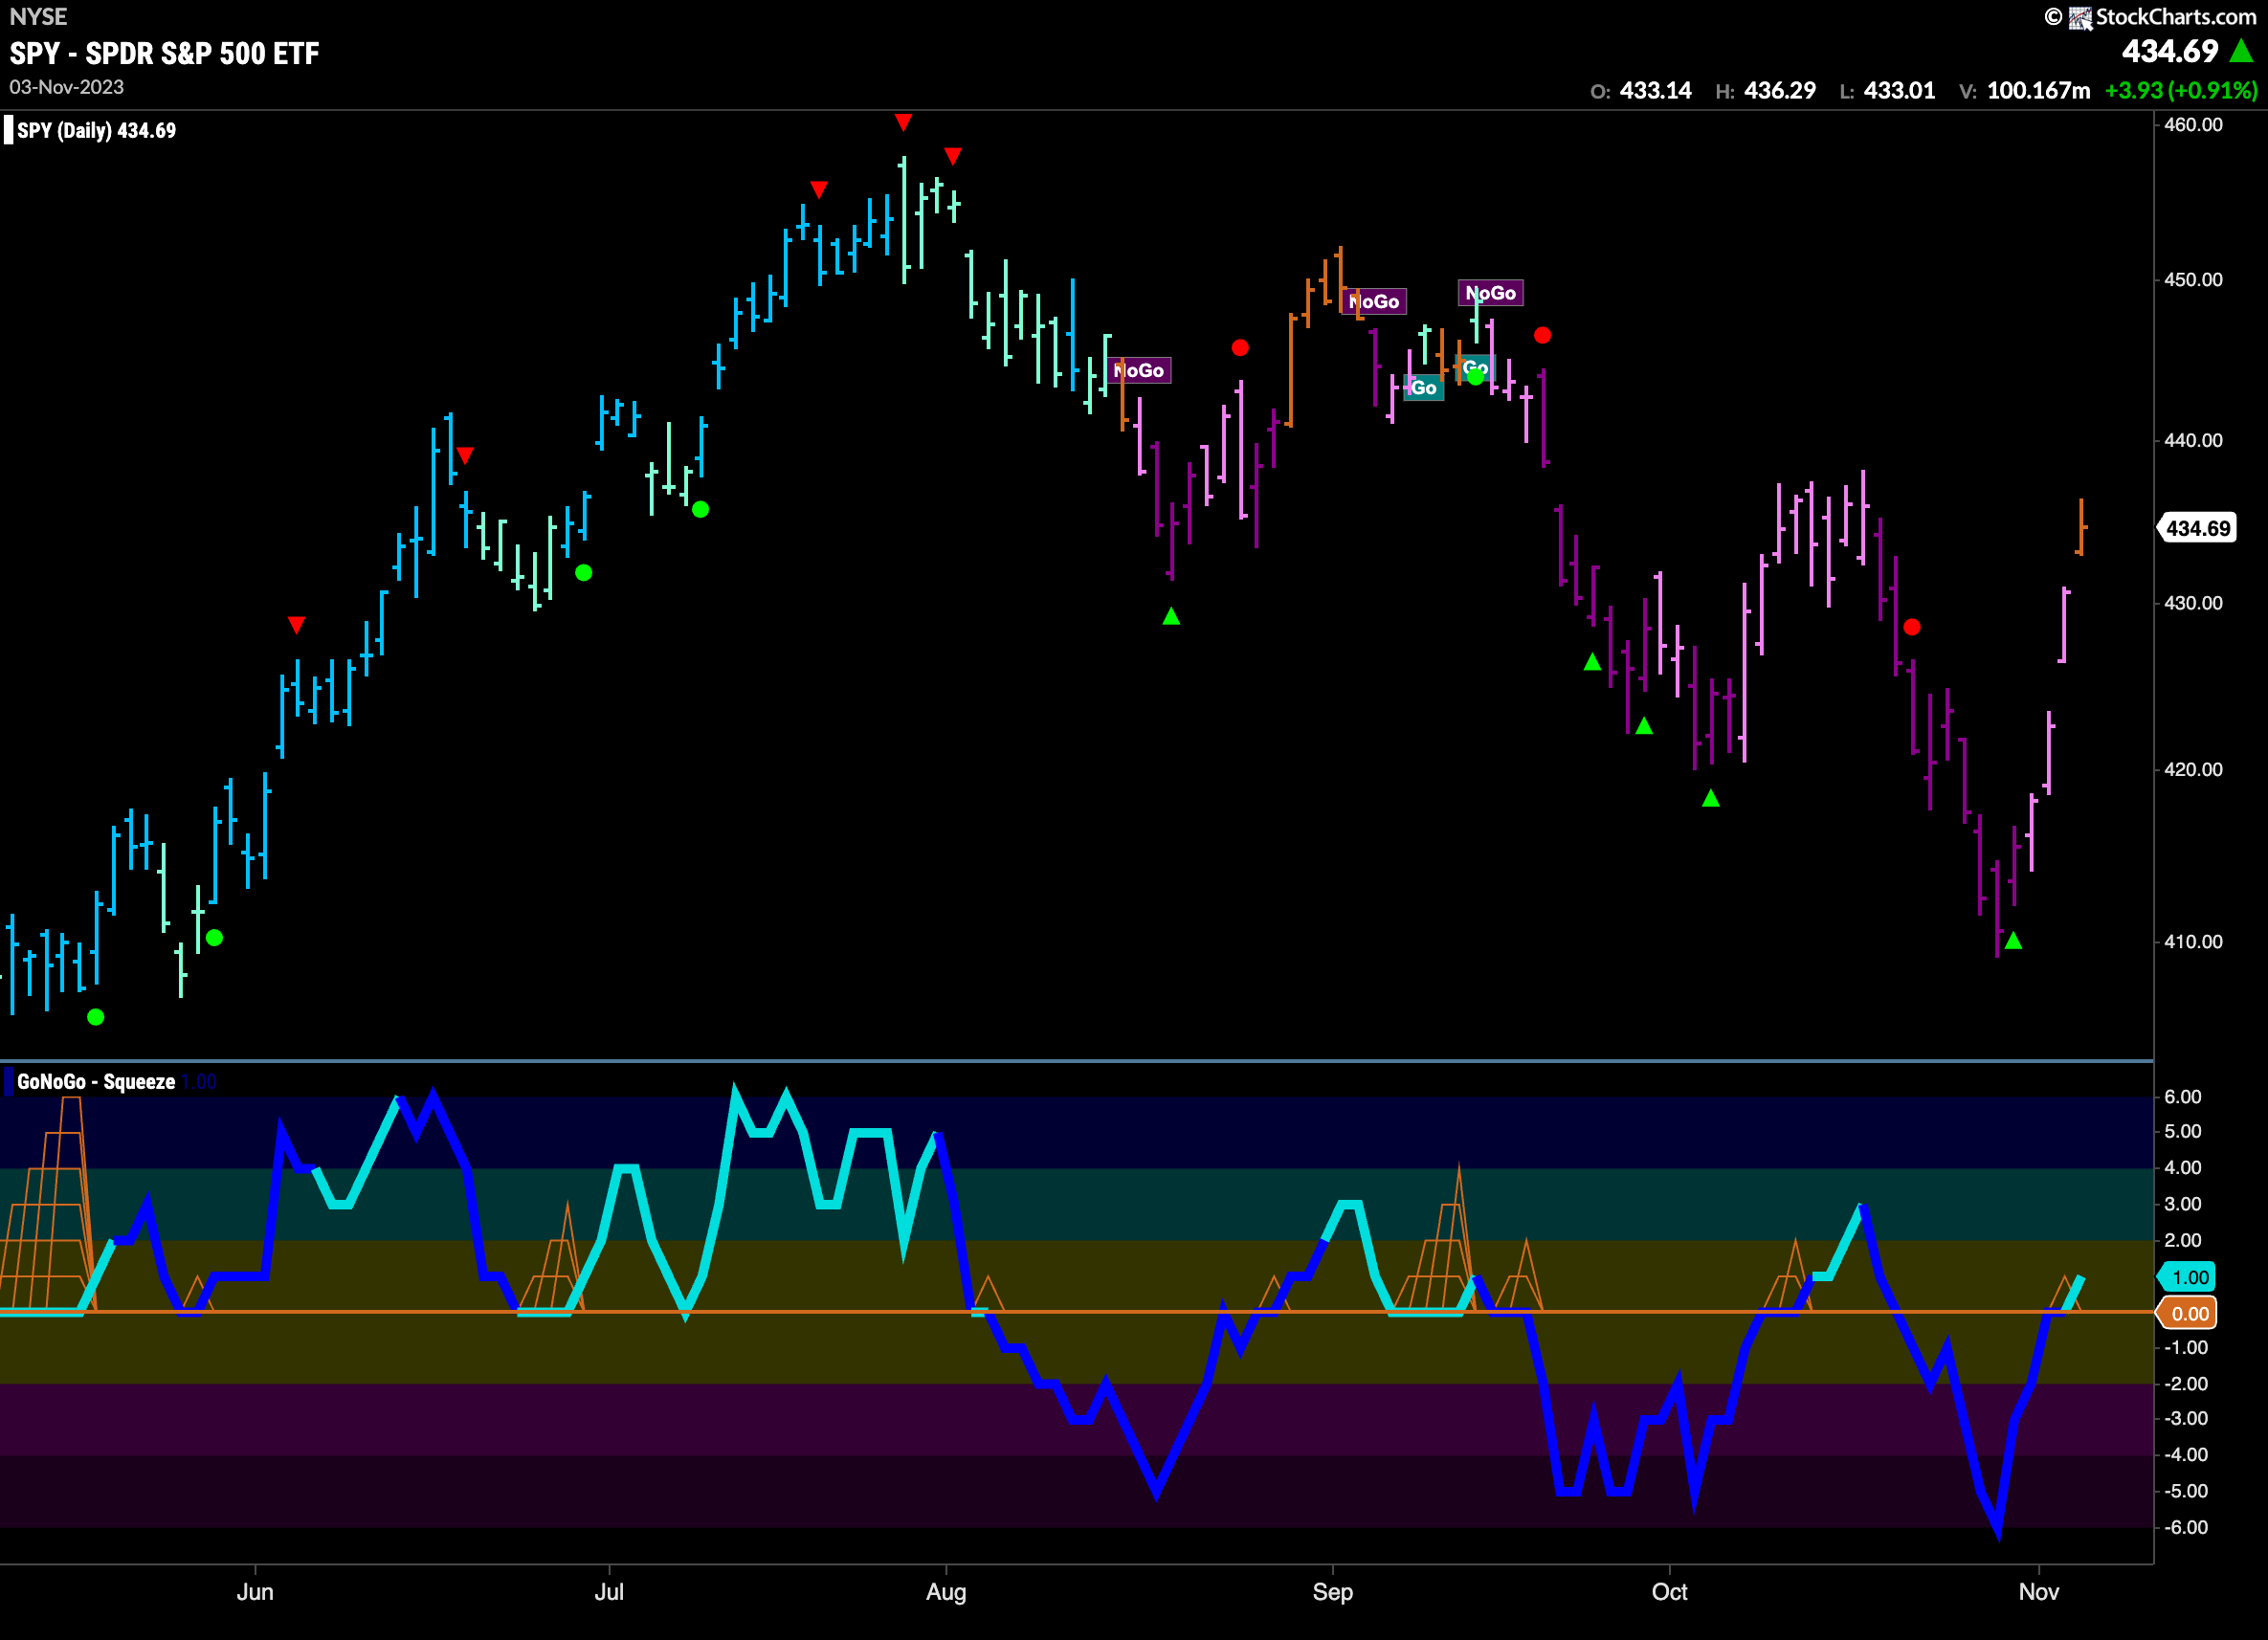
Strong Rally Sees Price Rise Out of “NoGo”
Price action last week was strong. We saw a rally off the lows that was strong enough to cause GoNoGo Trend to paint an amber “Go Fish” bar. We will watch to see if this week the indicator flashes a new “Go” trend or it returns to paint “NoGo” bars. GoNoGo Oscillator rallied to test the zero line from below and is dipping its nose into positive territory. We will pay attention over the next few sessions to see if the trend and oscillator remain aligned.
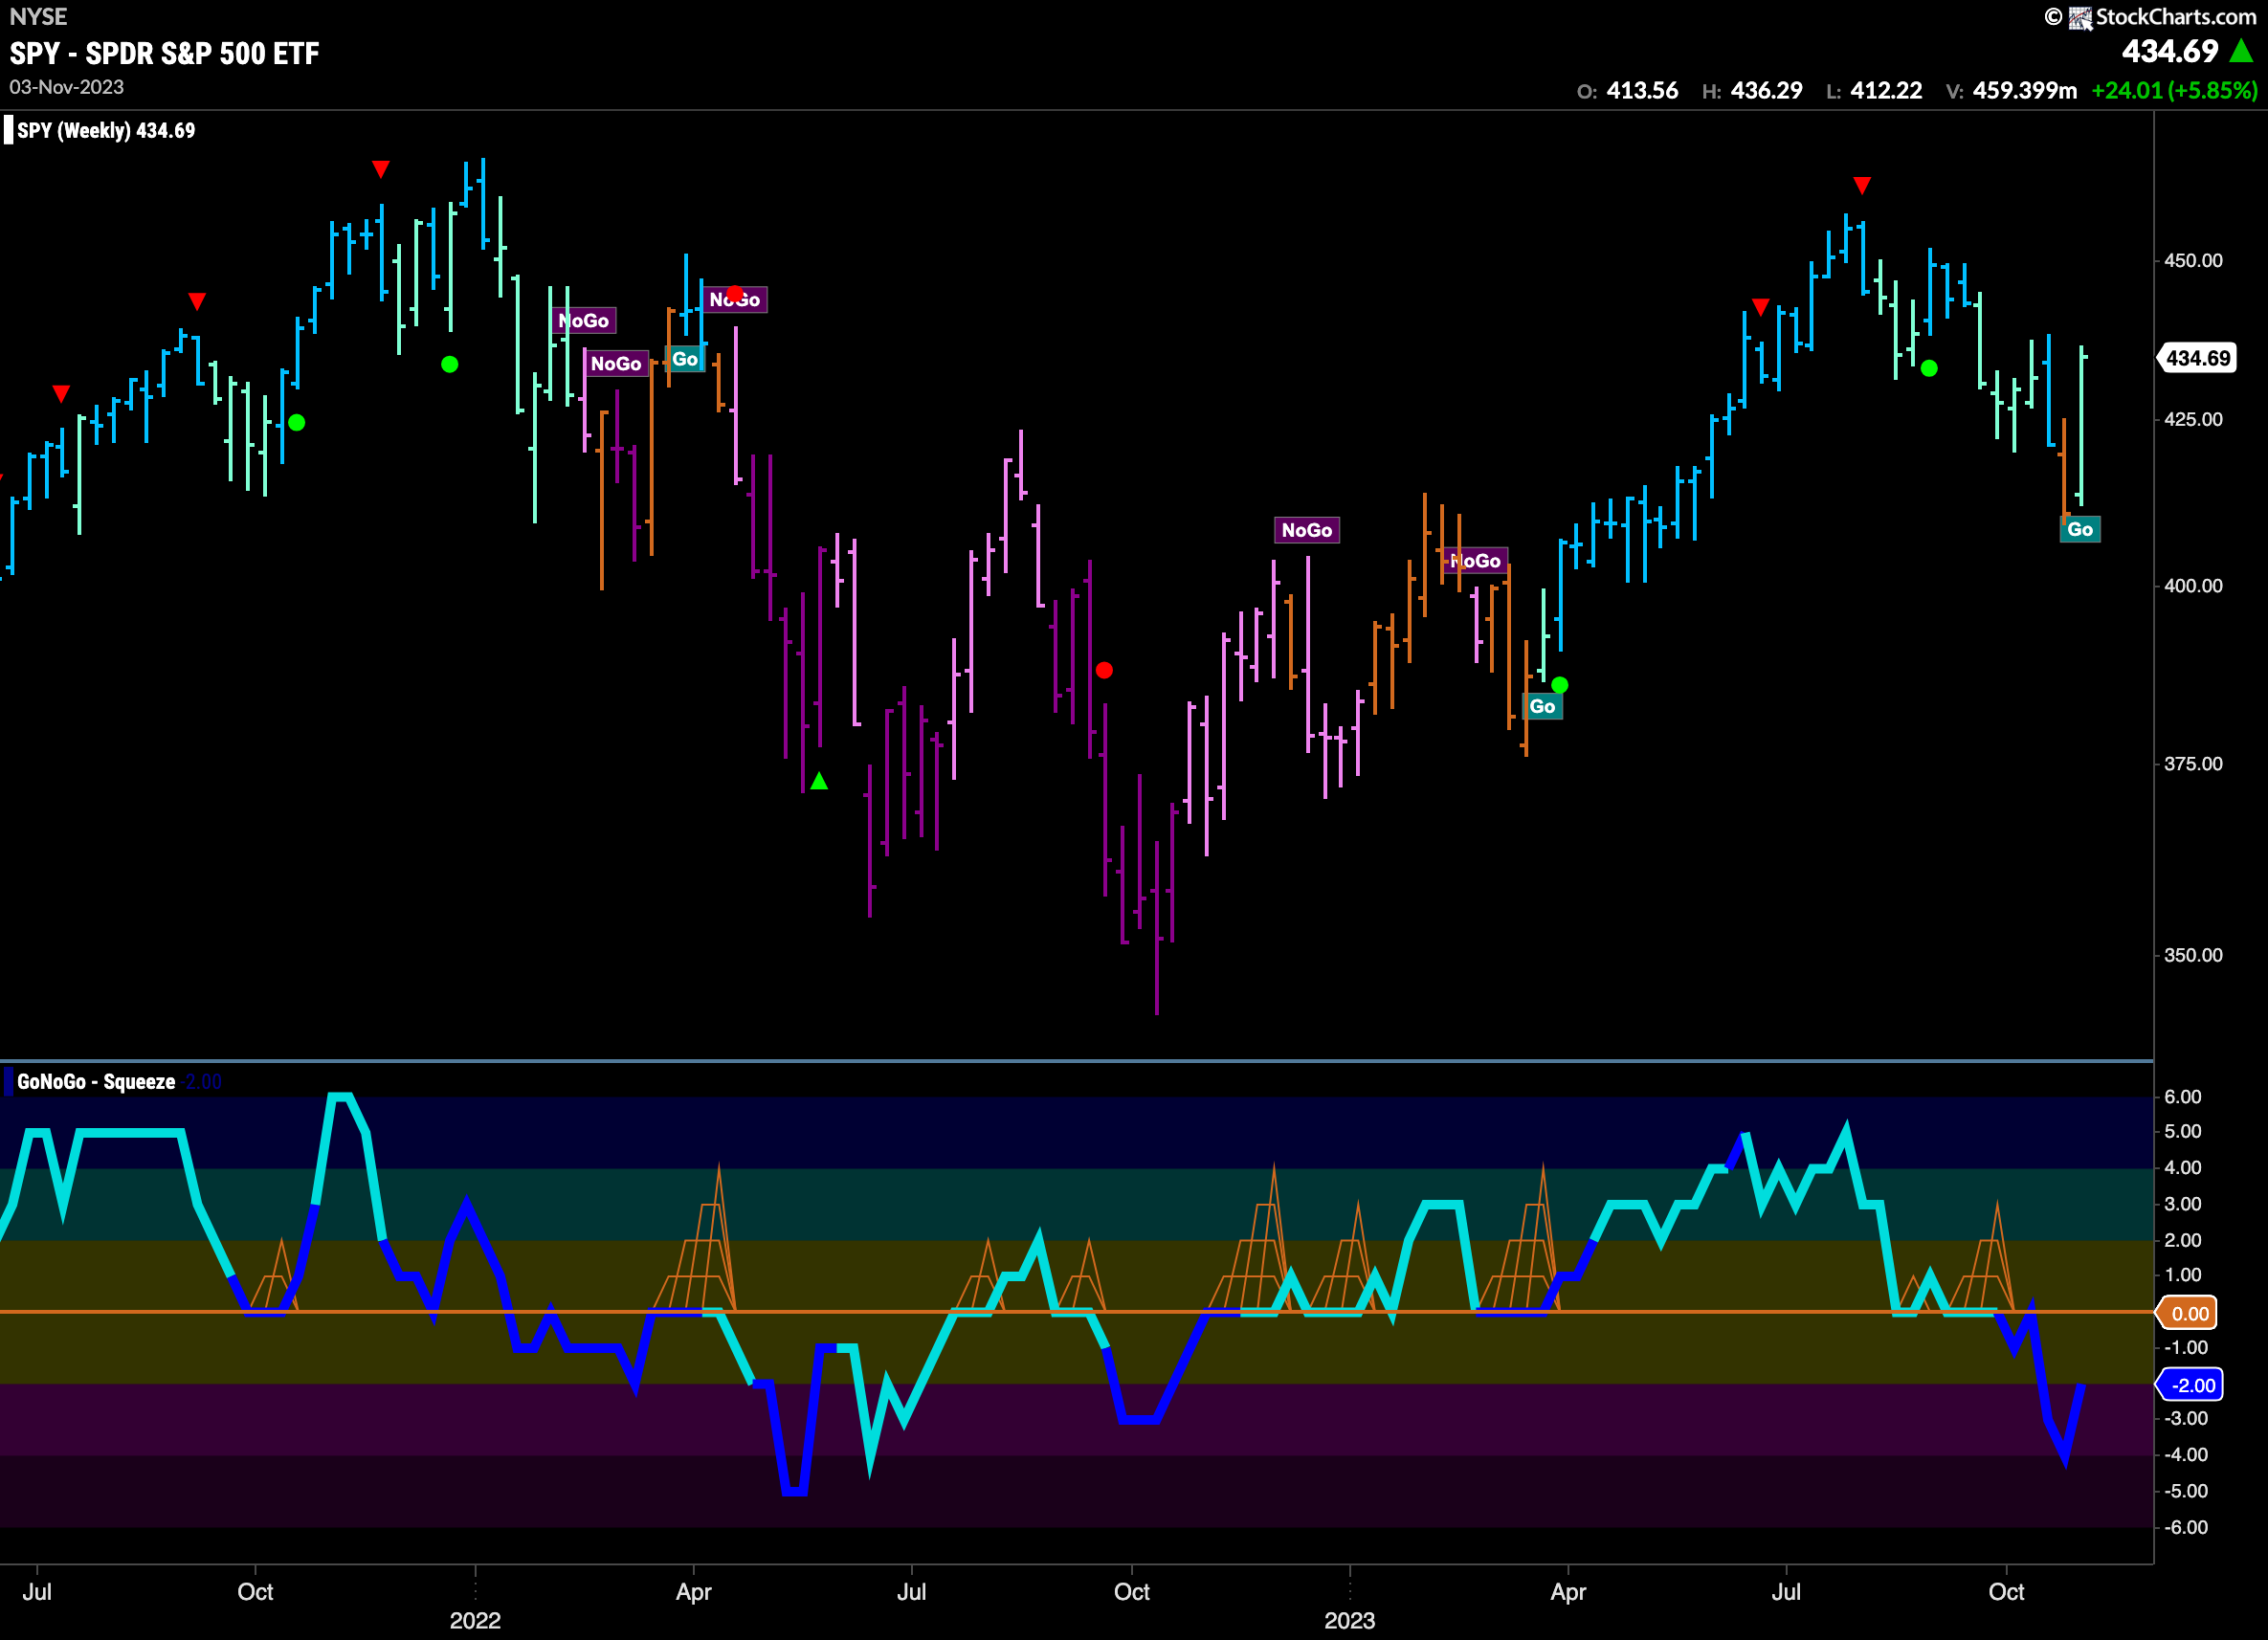
The longer term weekly chart shows how strong last week’s price reaction was. After a first amber “Go Fish” bar the week before, GoNoGo Trend painted an aqua bar as price responded to move higher. However, responsible thinking would remind us that we are still just in “lower high” territory and that the GoNoGo Oscillator is in negative territory at a value of -2.
Treasury Fall to Support from Prior Low
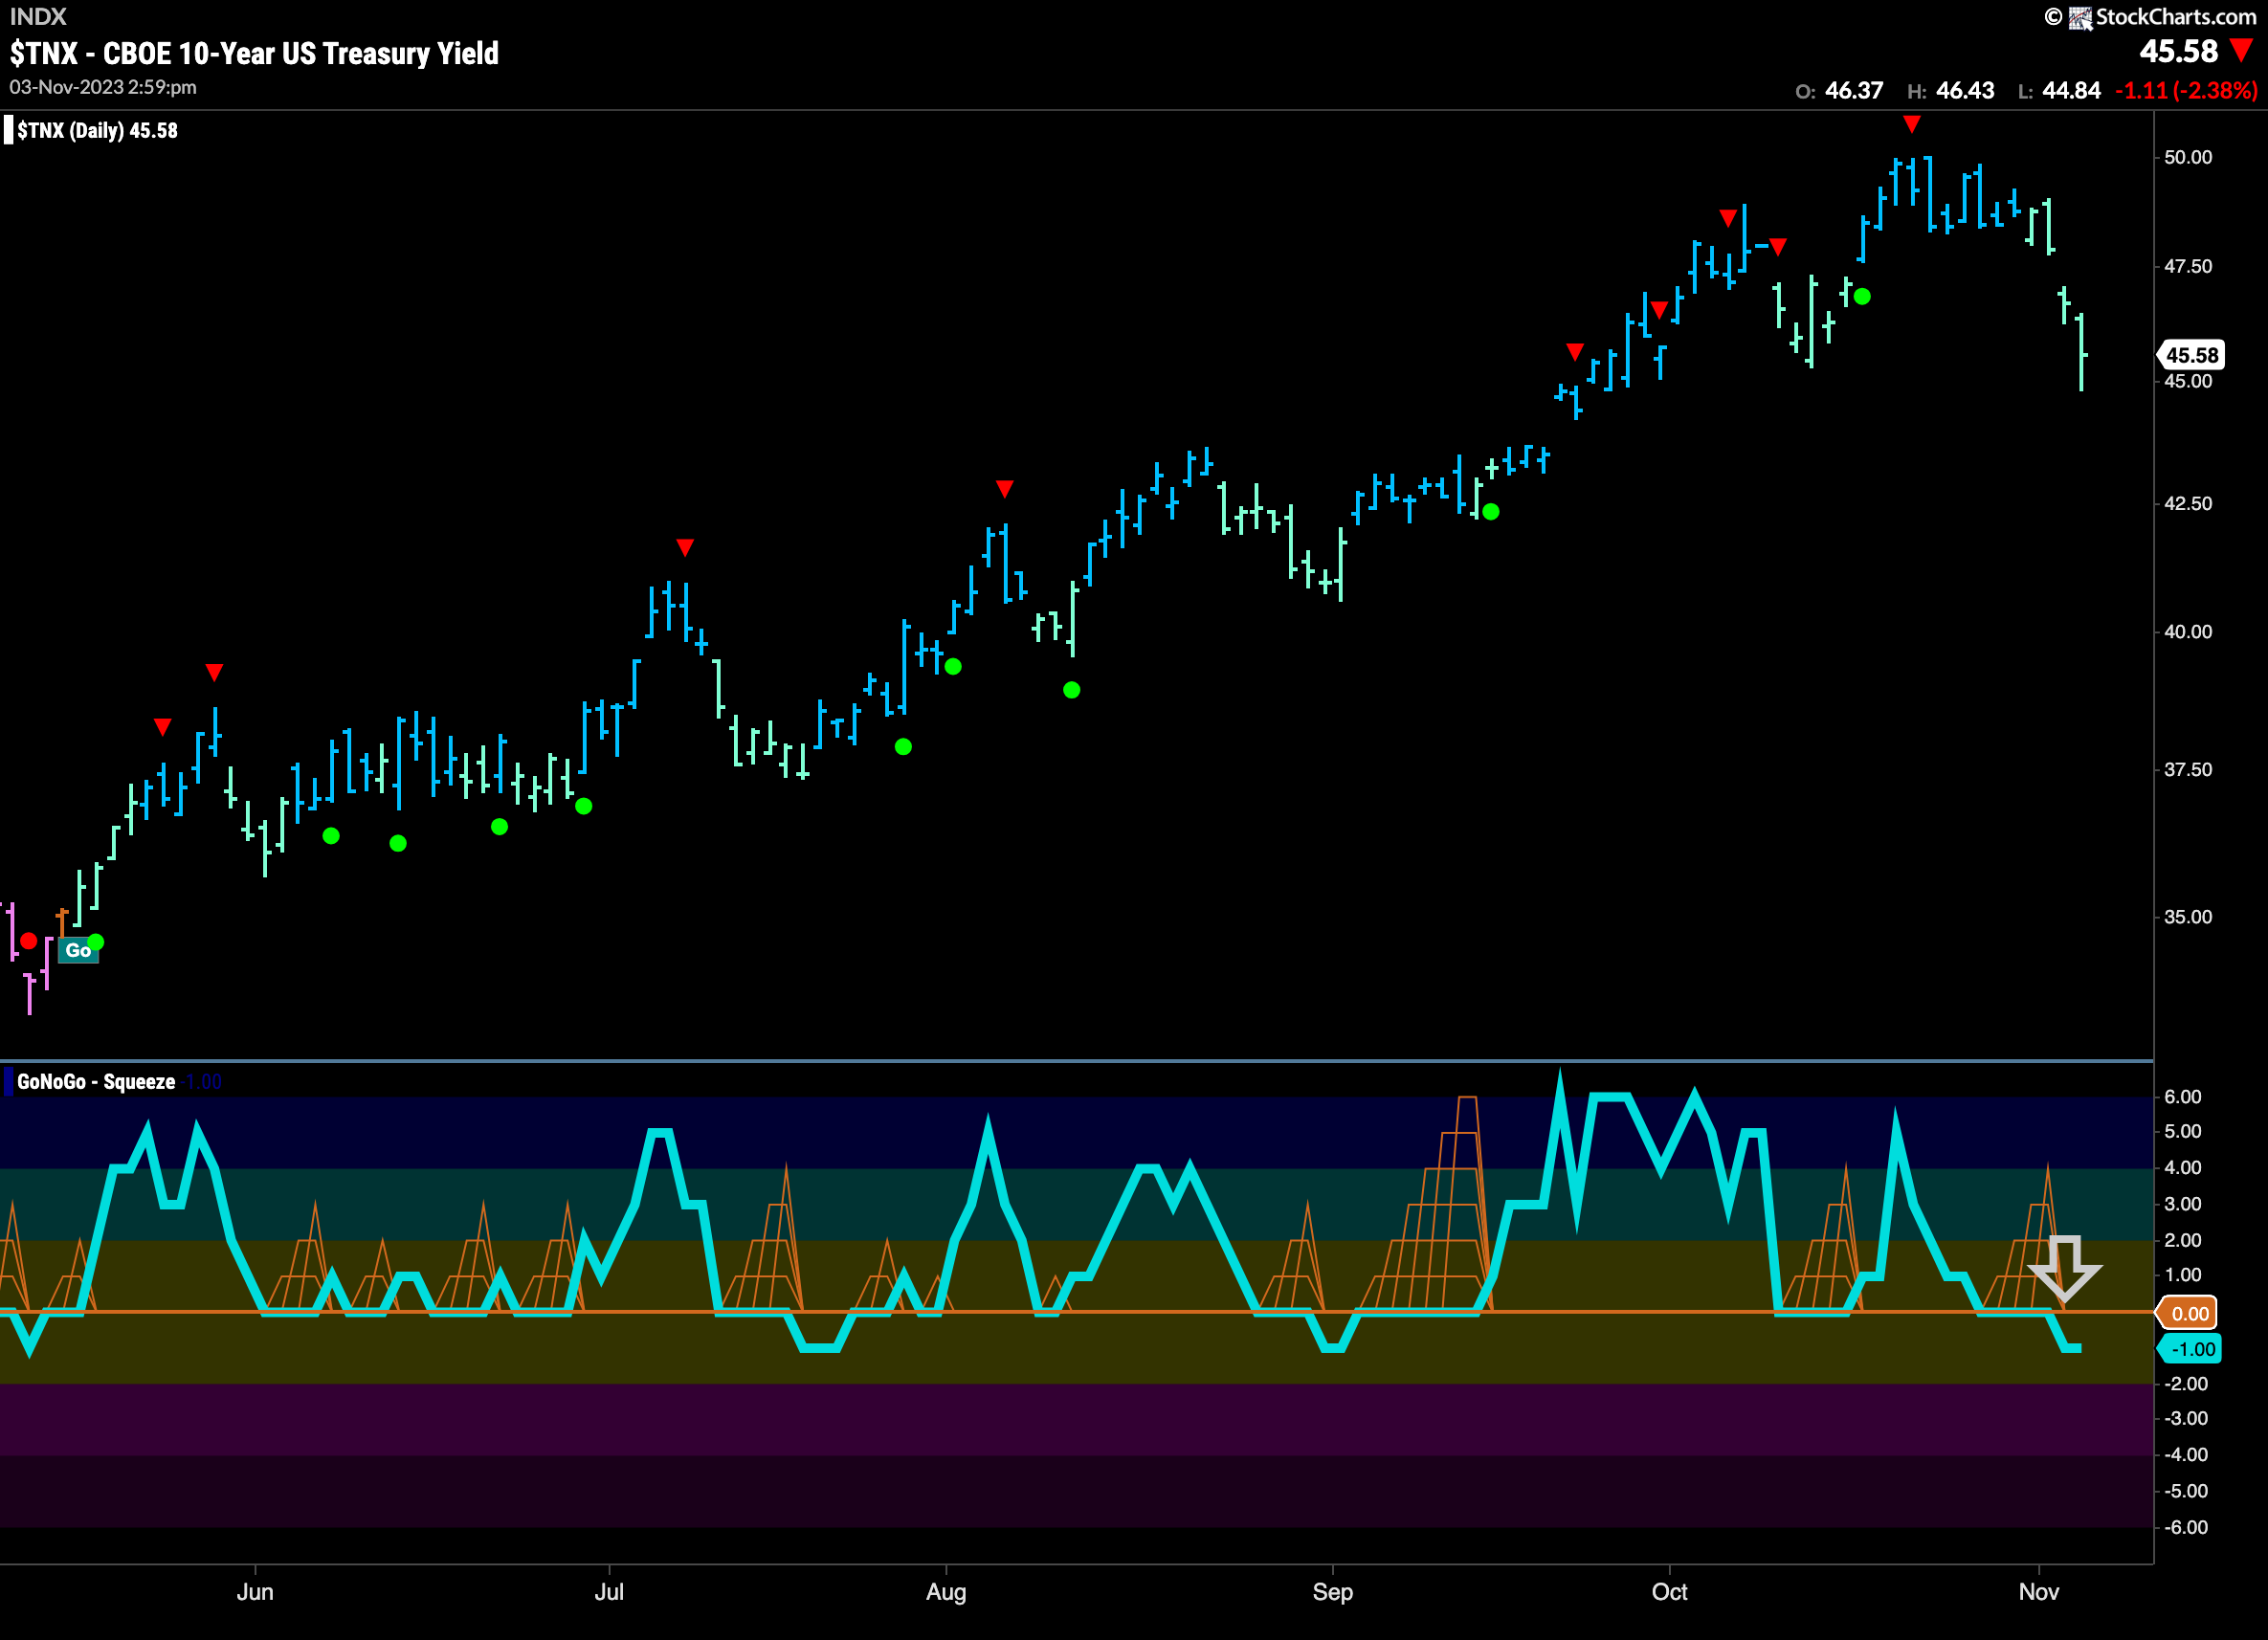
Treasury rates remain in a “Go” trend. However, we see weaker aqua bars were the color of the week and that price has fallen sharply from its recent Go Countertrend Correction Icon (red arrow) and tested support at a prior low. GoNoGo Oscillator rode the zero line for a few bars this week before falling slightly into negative territory. We will watch to see if the oscillator stays negative or rebounds to support the “Go” trend.
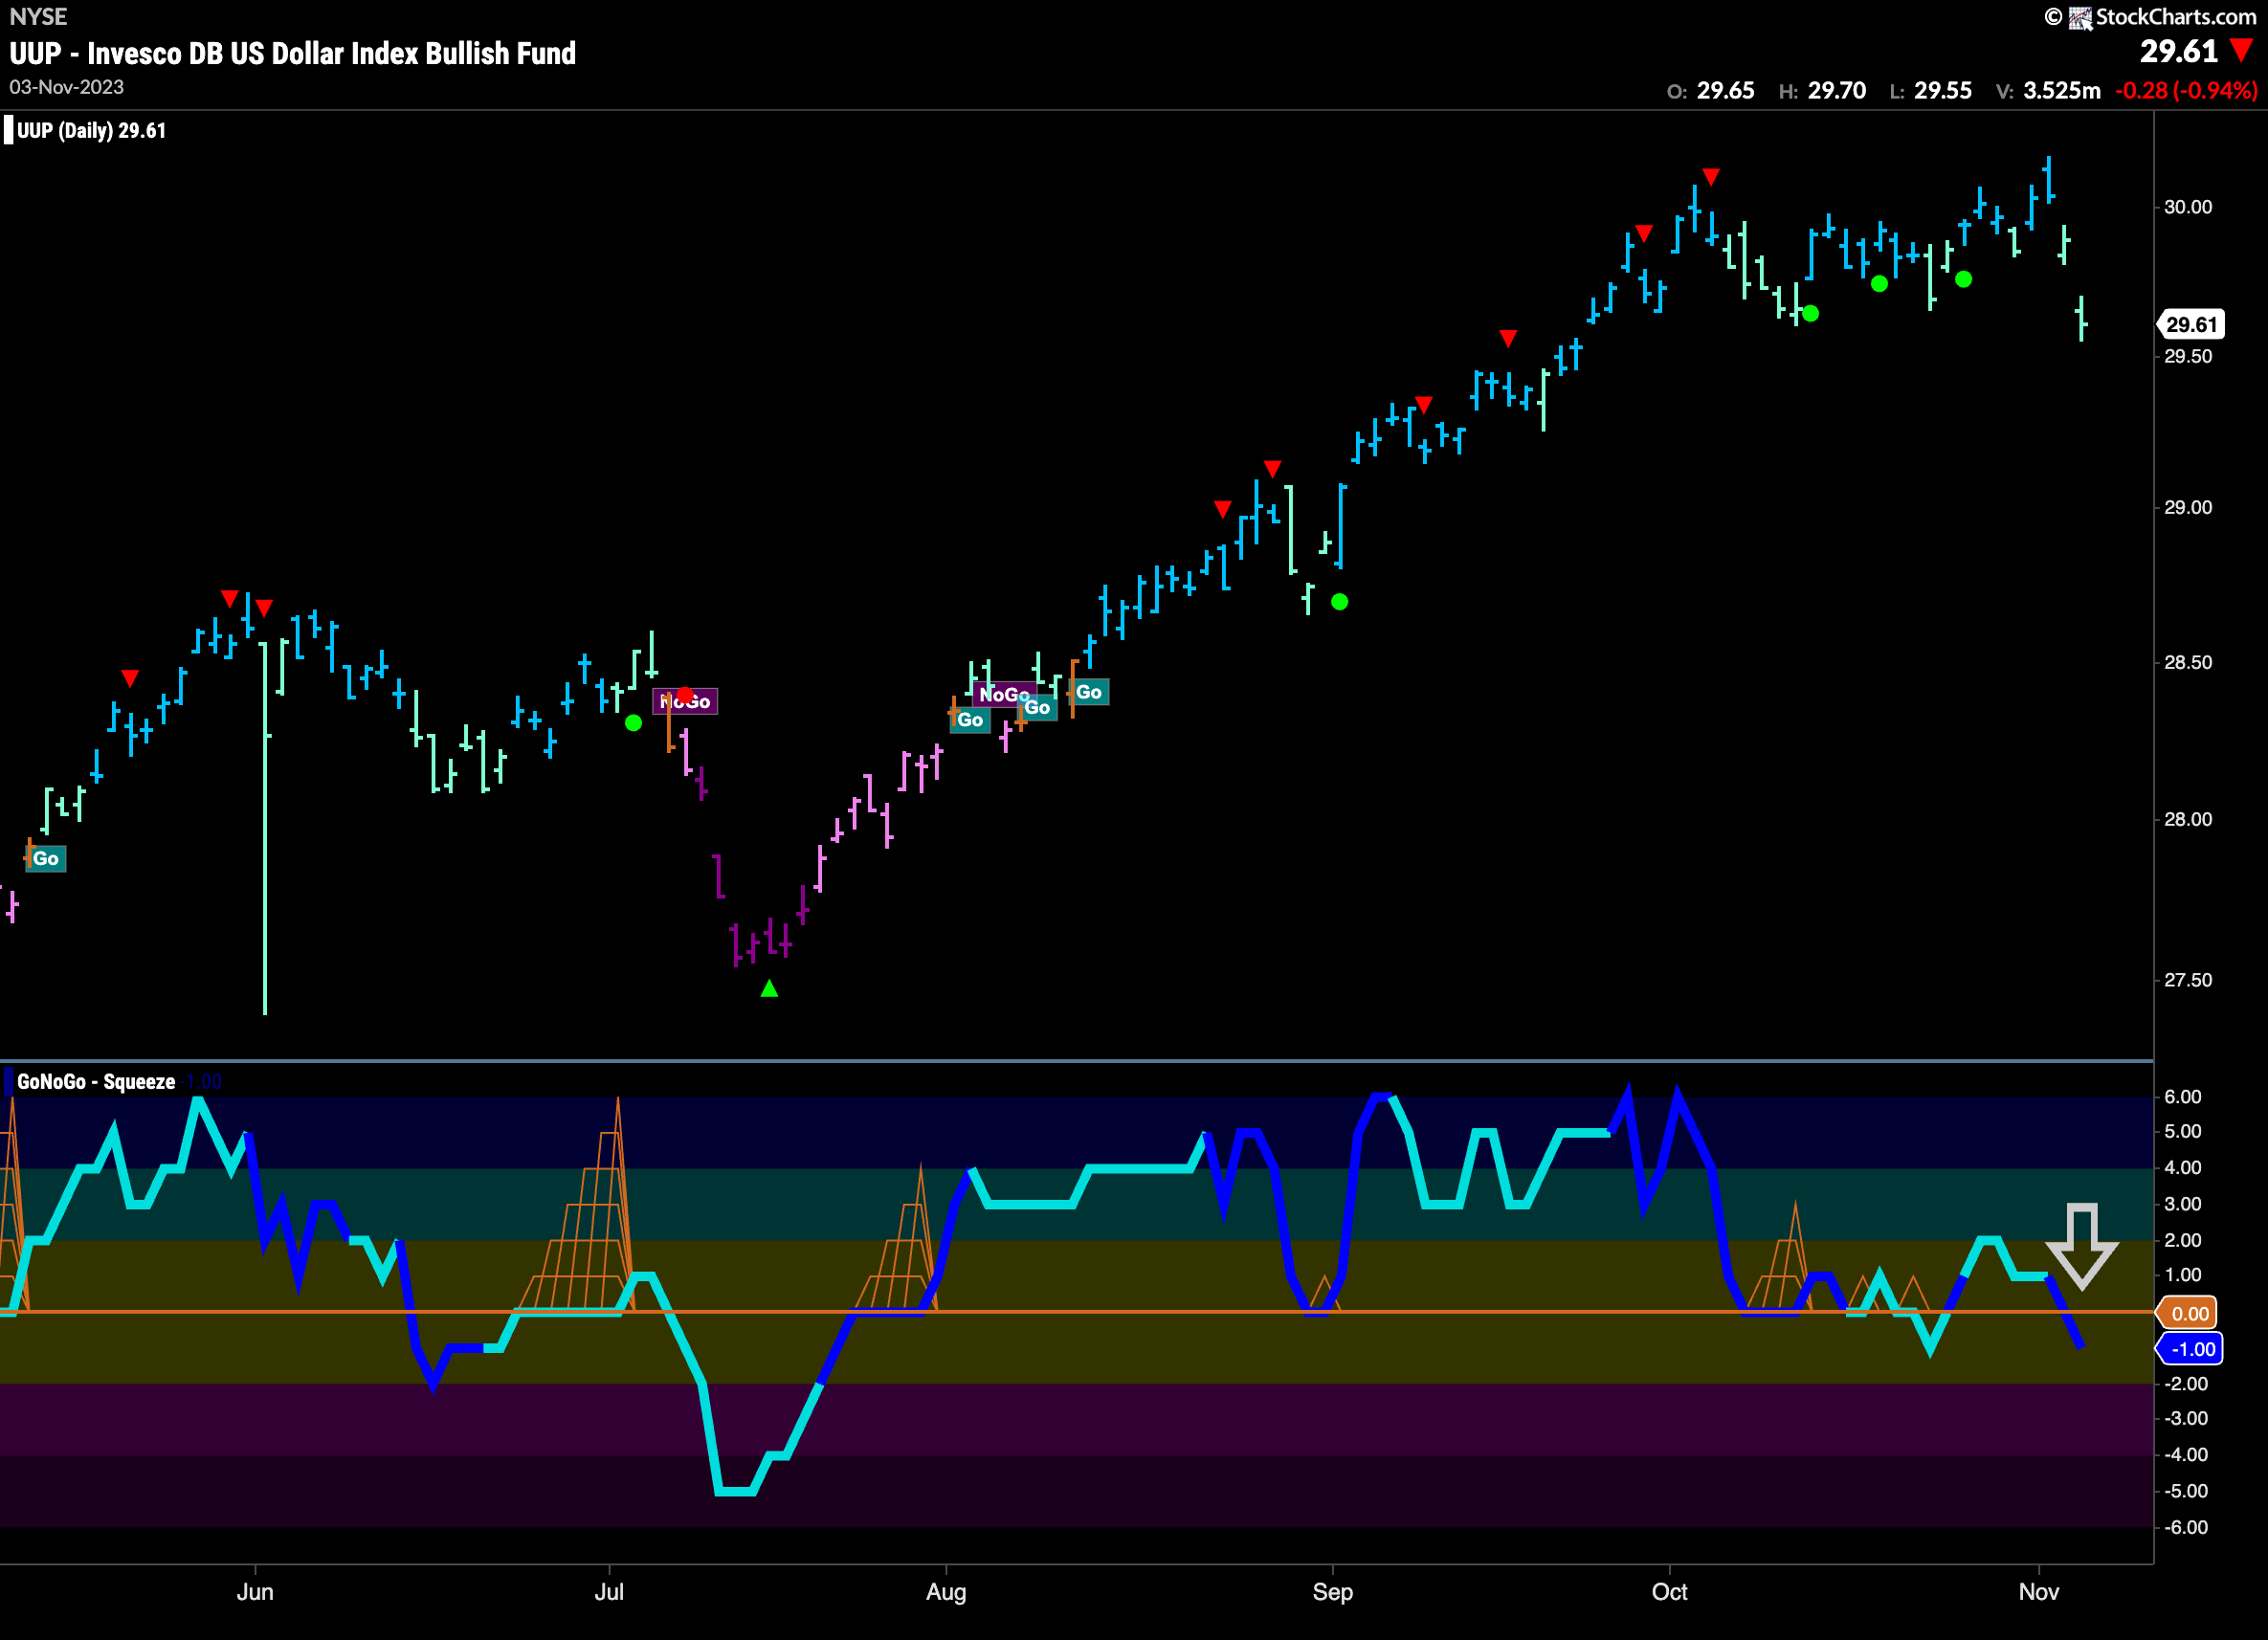
Dollar Fails at Prior Resistance
The dollar fell away from an attempt at a new high this past week. We saw consecutive weaker aqua bars and GoNoGo Oscillator fell through the zero line on the last bar of the week. Now, we are testing support from prior lows in what looks to be a small sideways channel. If price falls from here, we will see a new lower low and GoNoGo Oscillator will turn more negative. Volume was heavy on the move lower at the end of the week.
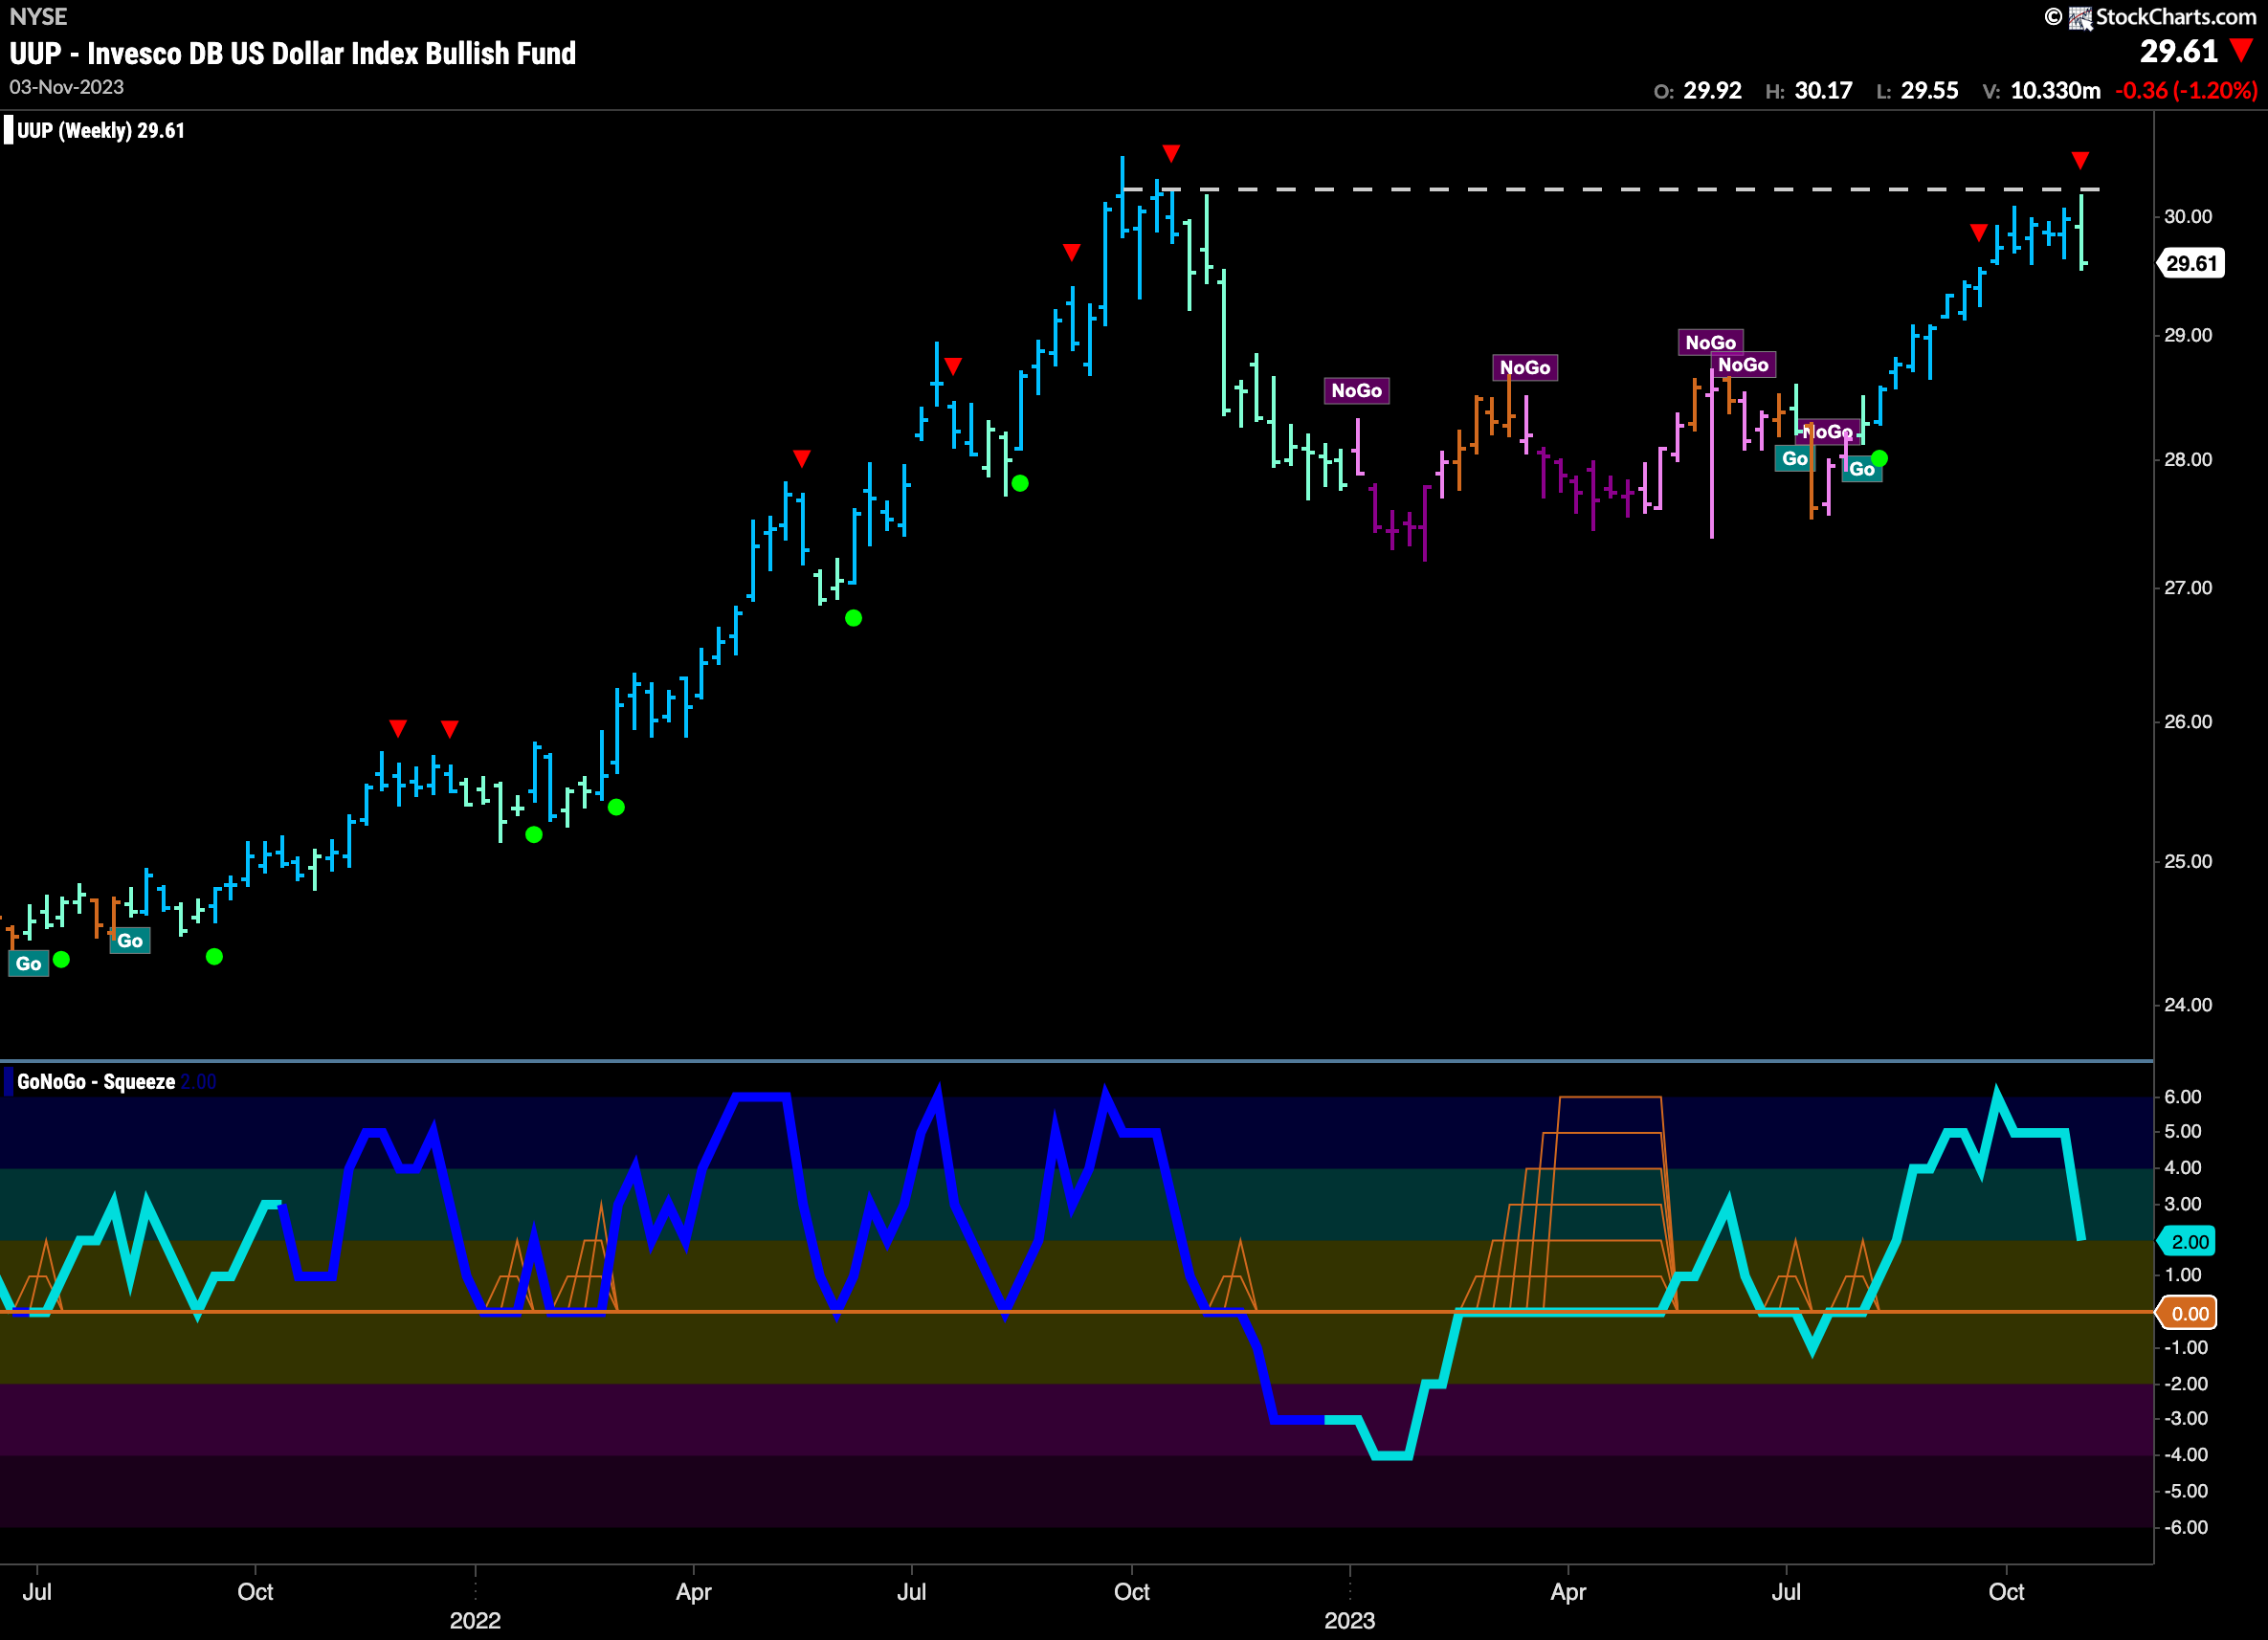
The weekly chart shows that the resistance was not just from recent highs. There is strong resistance at these levels that comes from highs a year ago. This level will be significant going forward. We will watch to see if price is unable to work through resistance and move higher or if it can indeed break through. Both scenarios would have strong implications for equity prices.
Oil Falls into “NoGo” Trend on Daily Chart
Oil seemed to make up its mind this week. GoNoGo Trend painted a string of strong purple “NoGo” bars as the trend took hold after a few weeks of chop. GoNoGo Oscillator broke back into negative territory on heavy volume to support the “NoGo” trend seen in the price panel. There is some support likely to be found from the prior low but the weight of the evidence at the moment tells us the trend is to the downside. 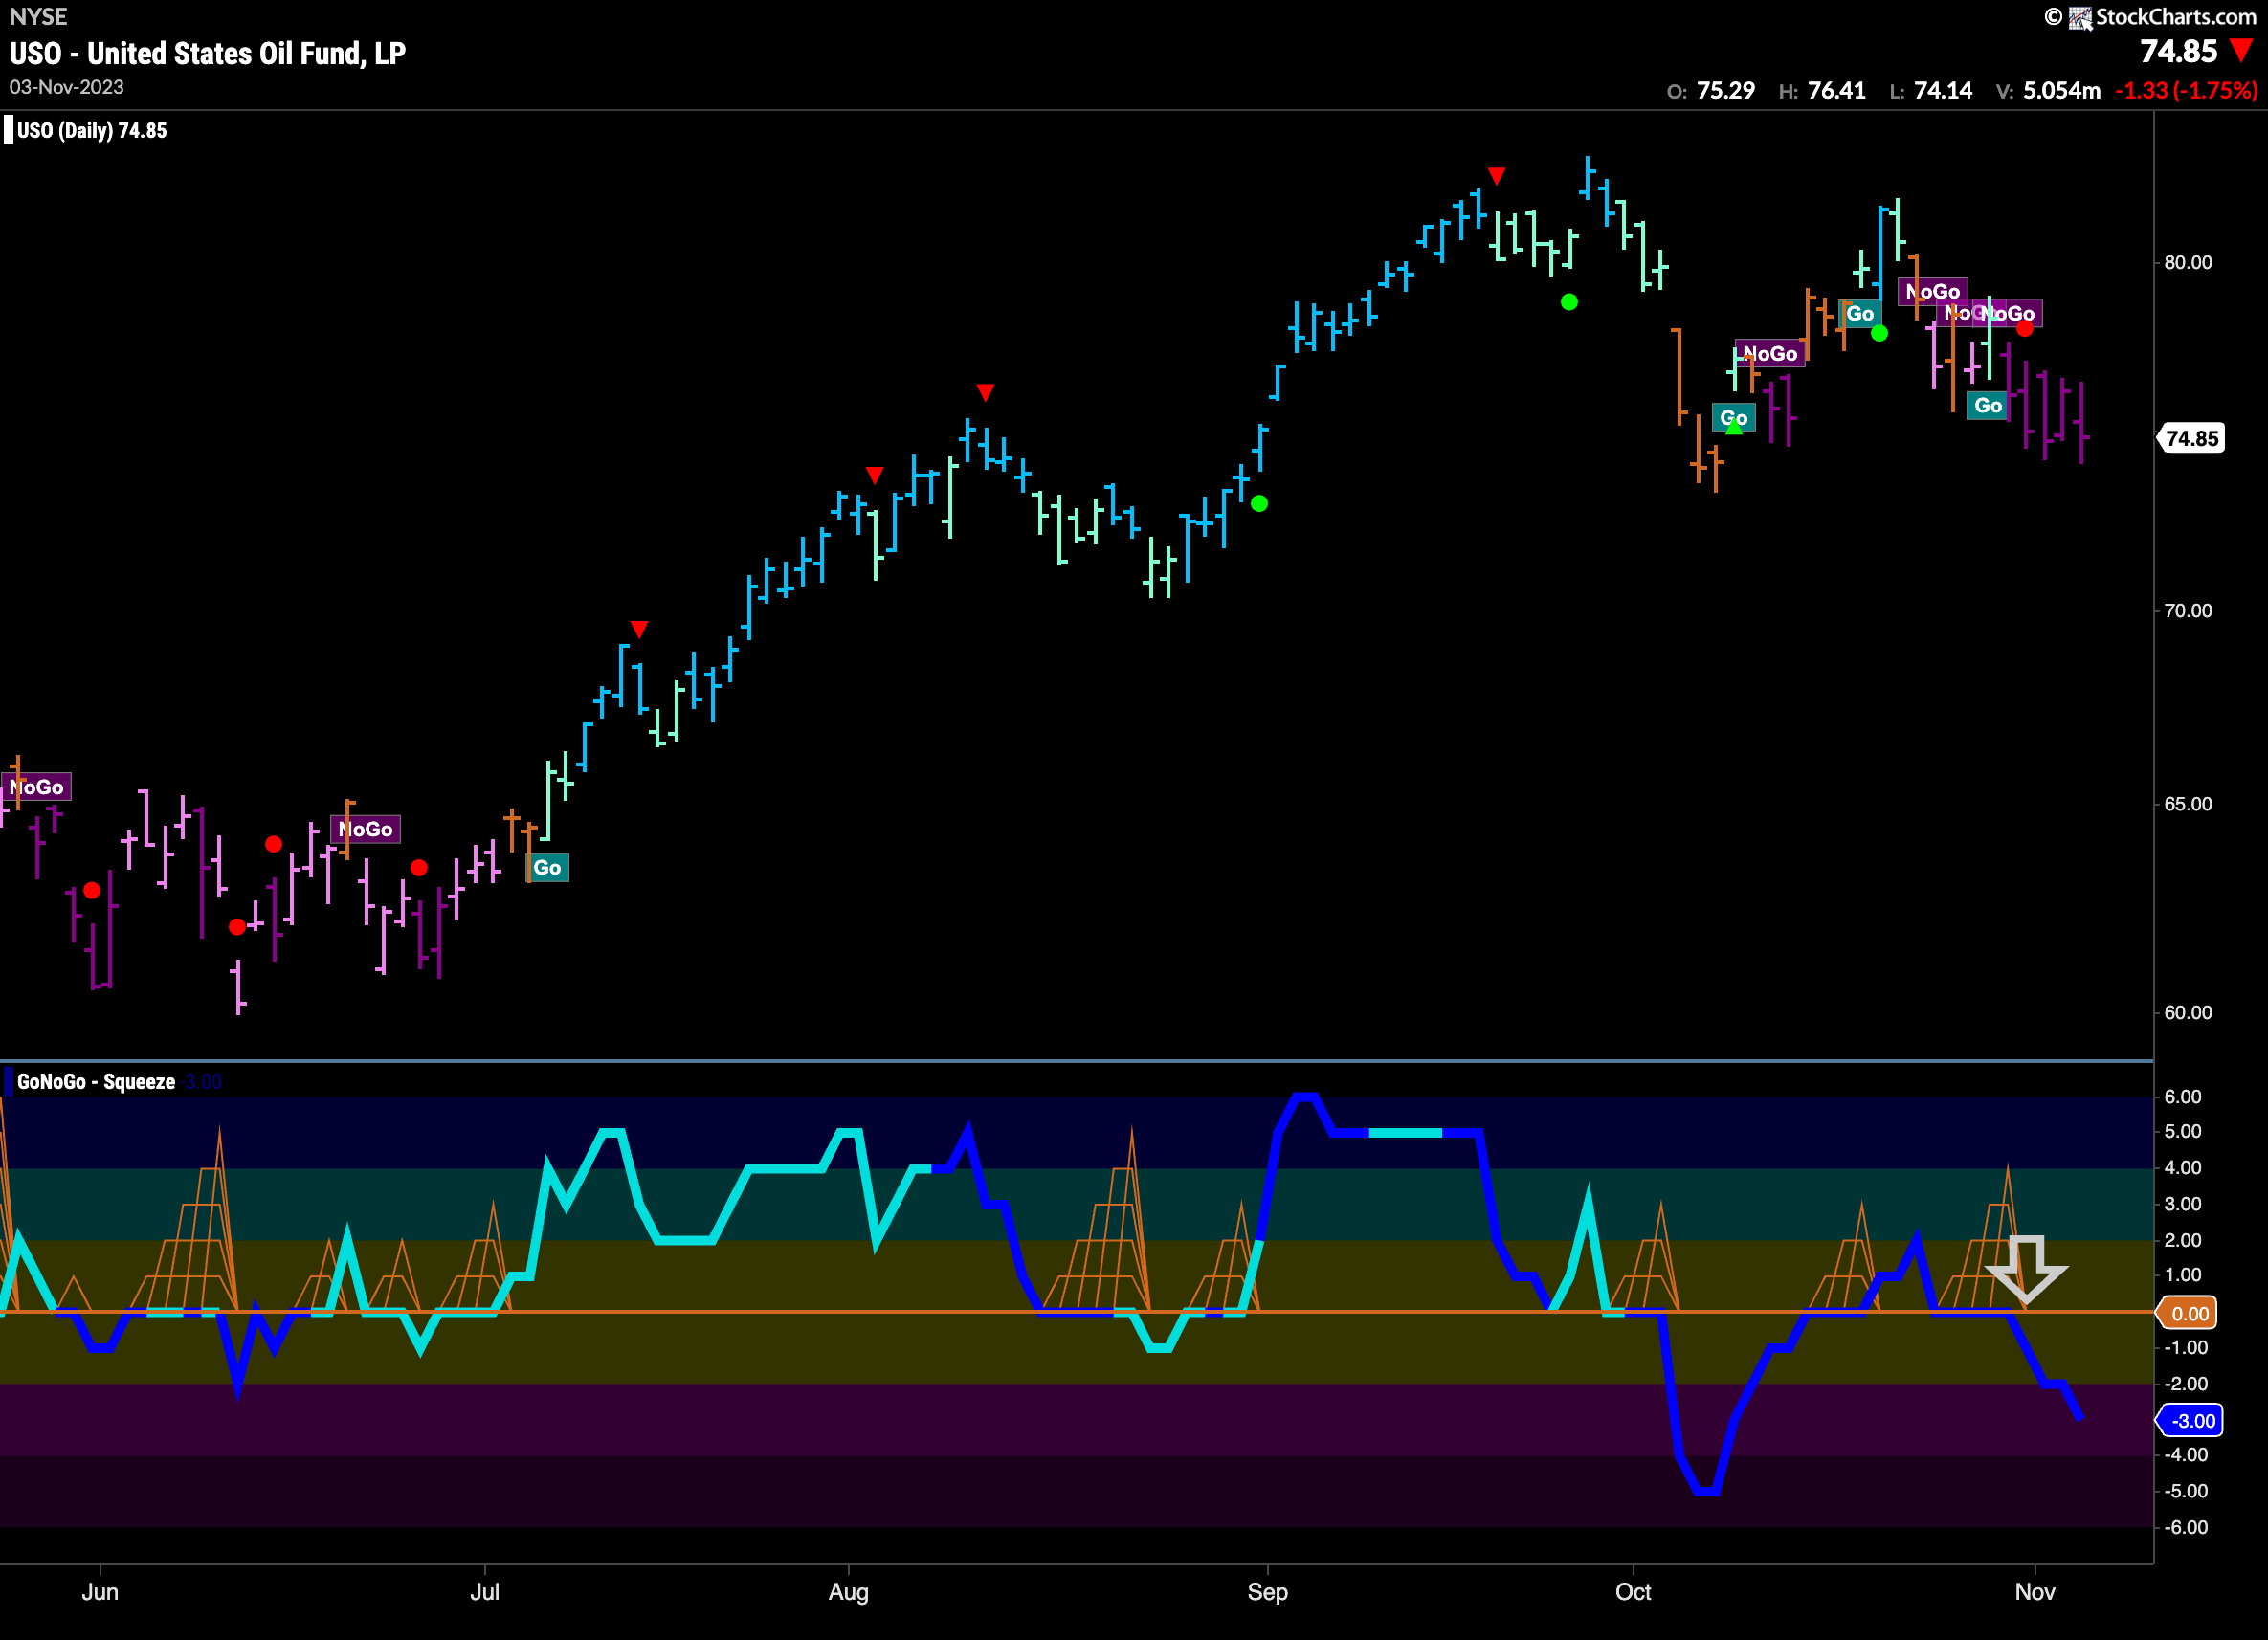
Gold Tries to Consolidate Move
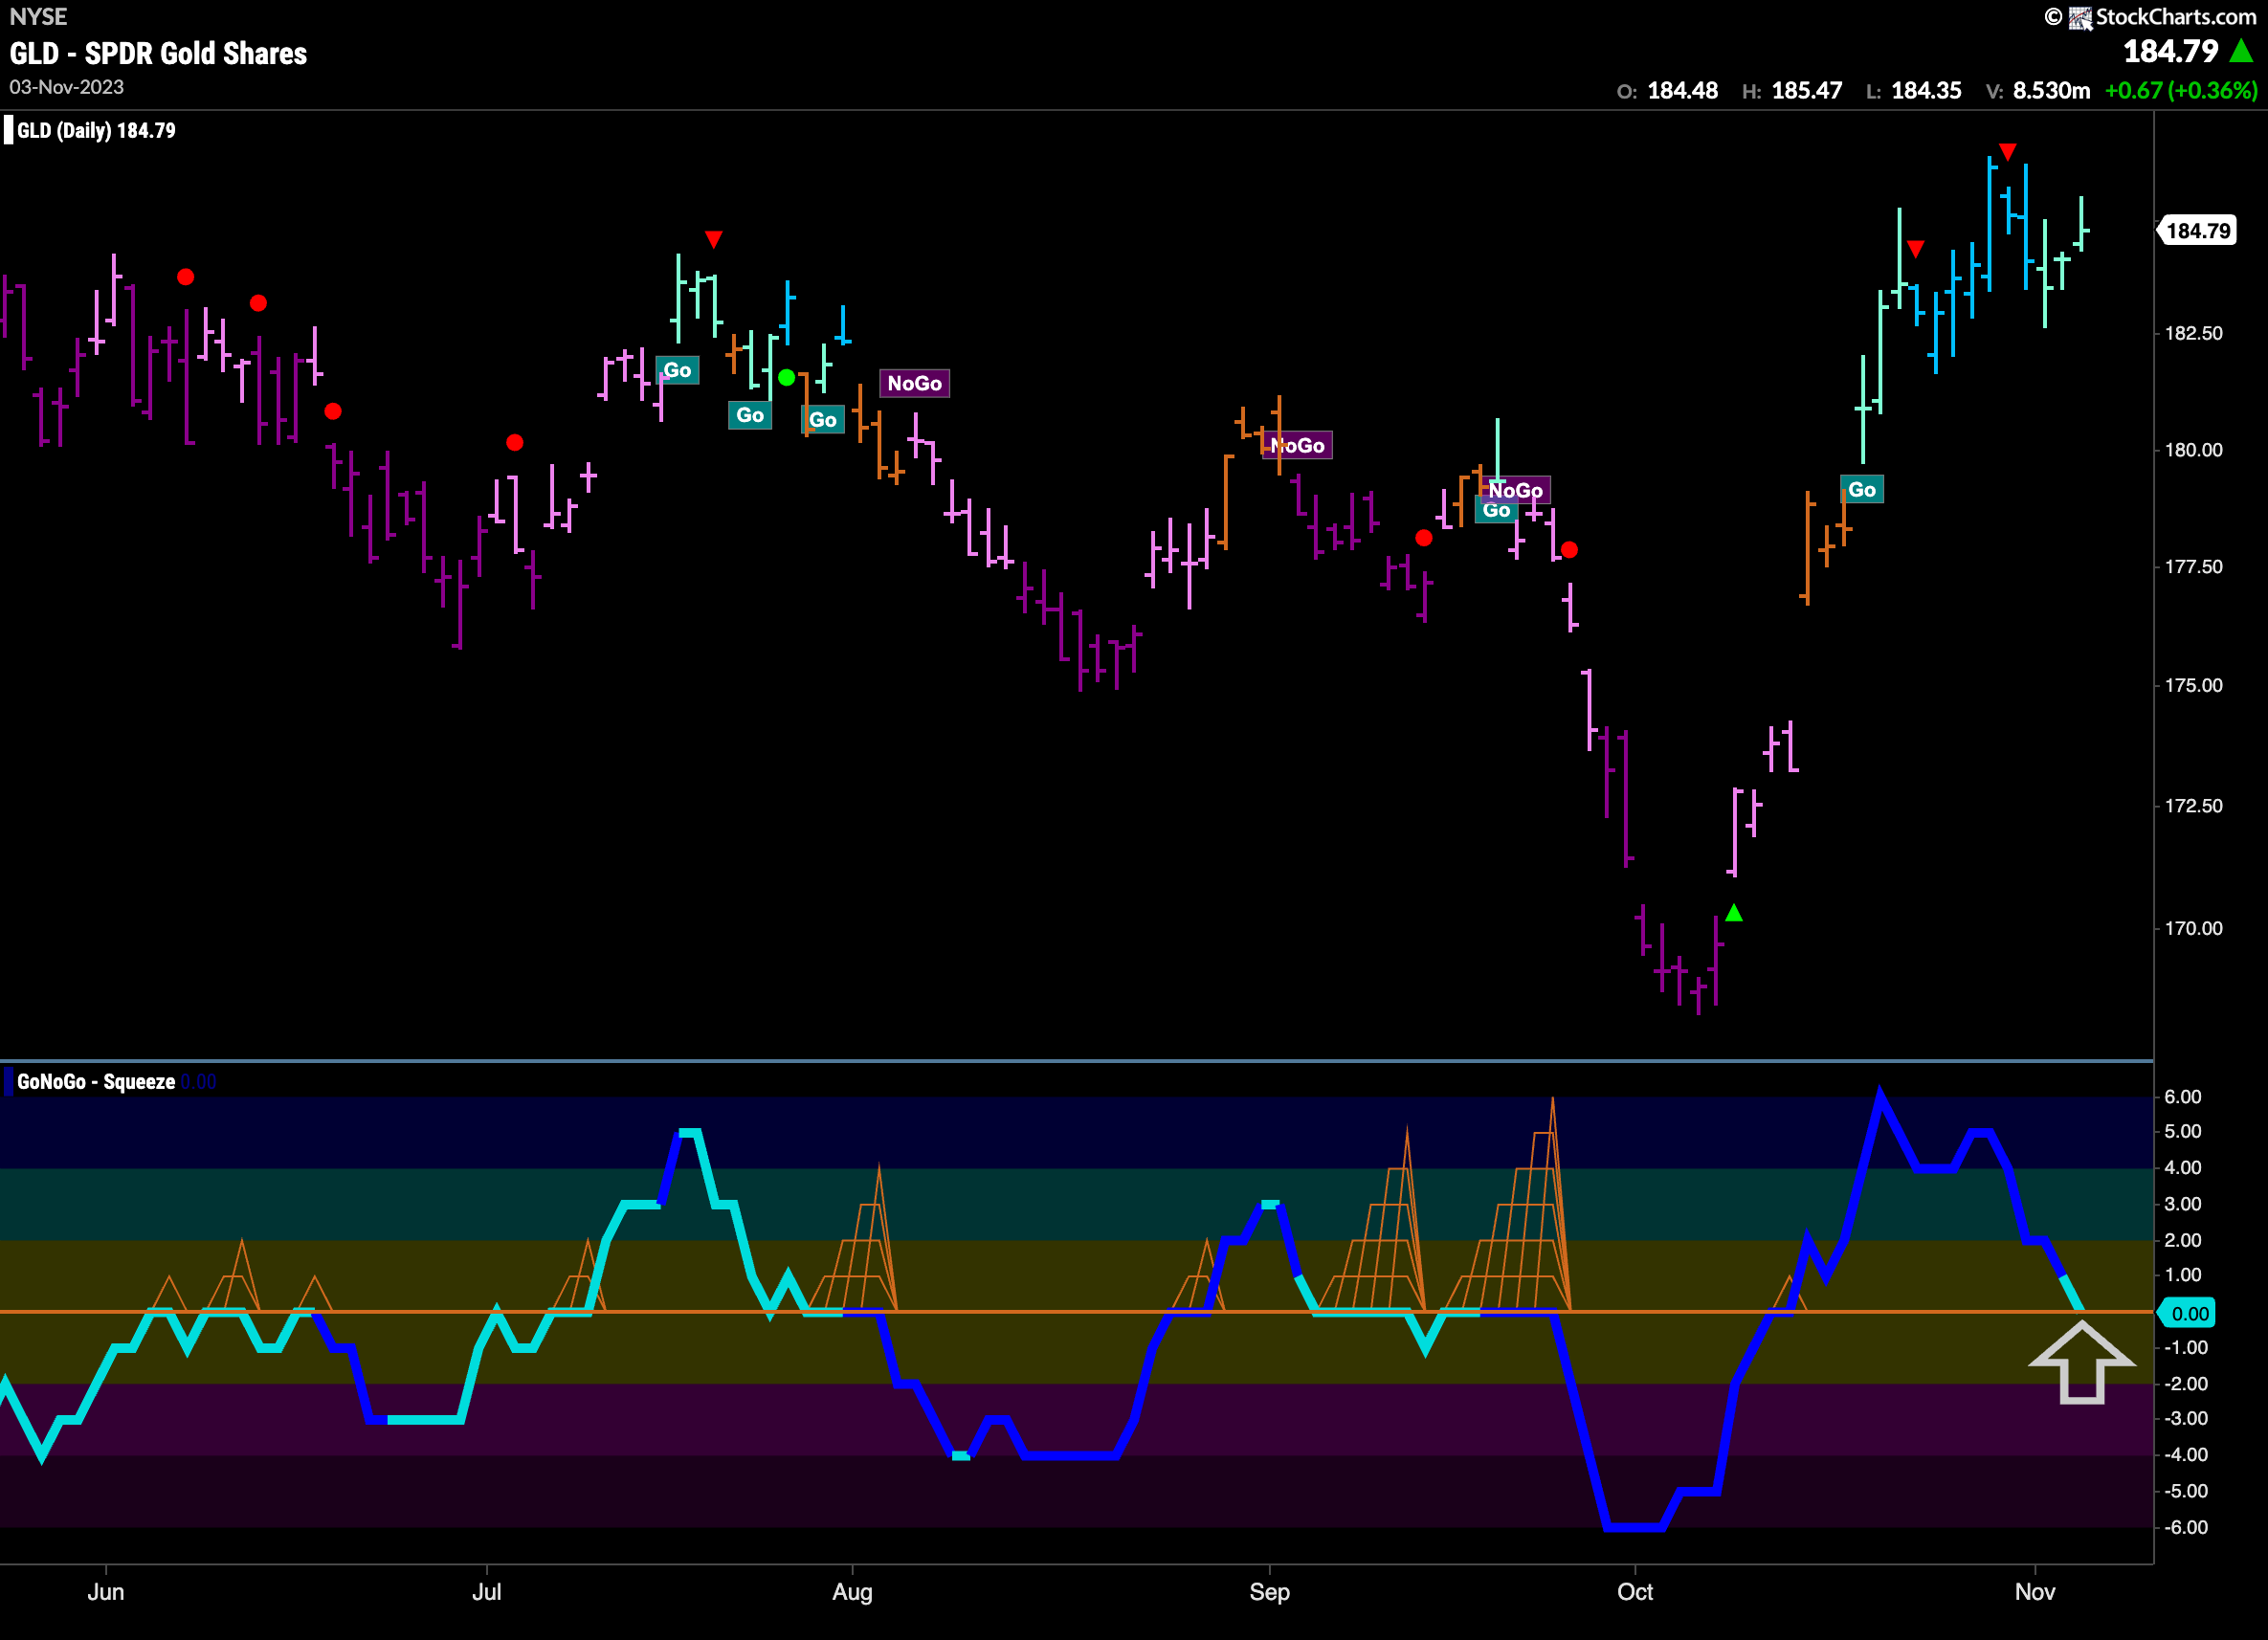
After entering into a “Go” trend a few weeks ago, Gold prices hit another higher high a week ago. We saw a Go Countertrend Correction Icon (red arrow) at the beginning of the week that indicated a temporary struggle to go higher. Indeed, price moved mostly sideways this week and GoNoGo Trend painted weaker aqua bars. GoNoGo Oscillator has fallen to test the zero line from above. We will look to see if it finds support at this level and if it does that would indicate resurgent momentum in the direction of the “Go” trend.
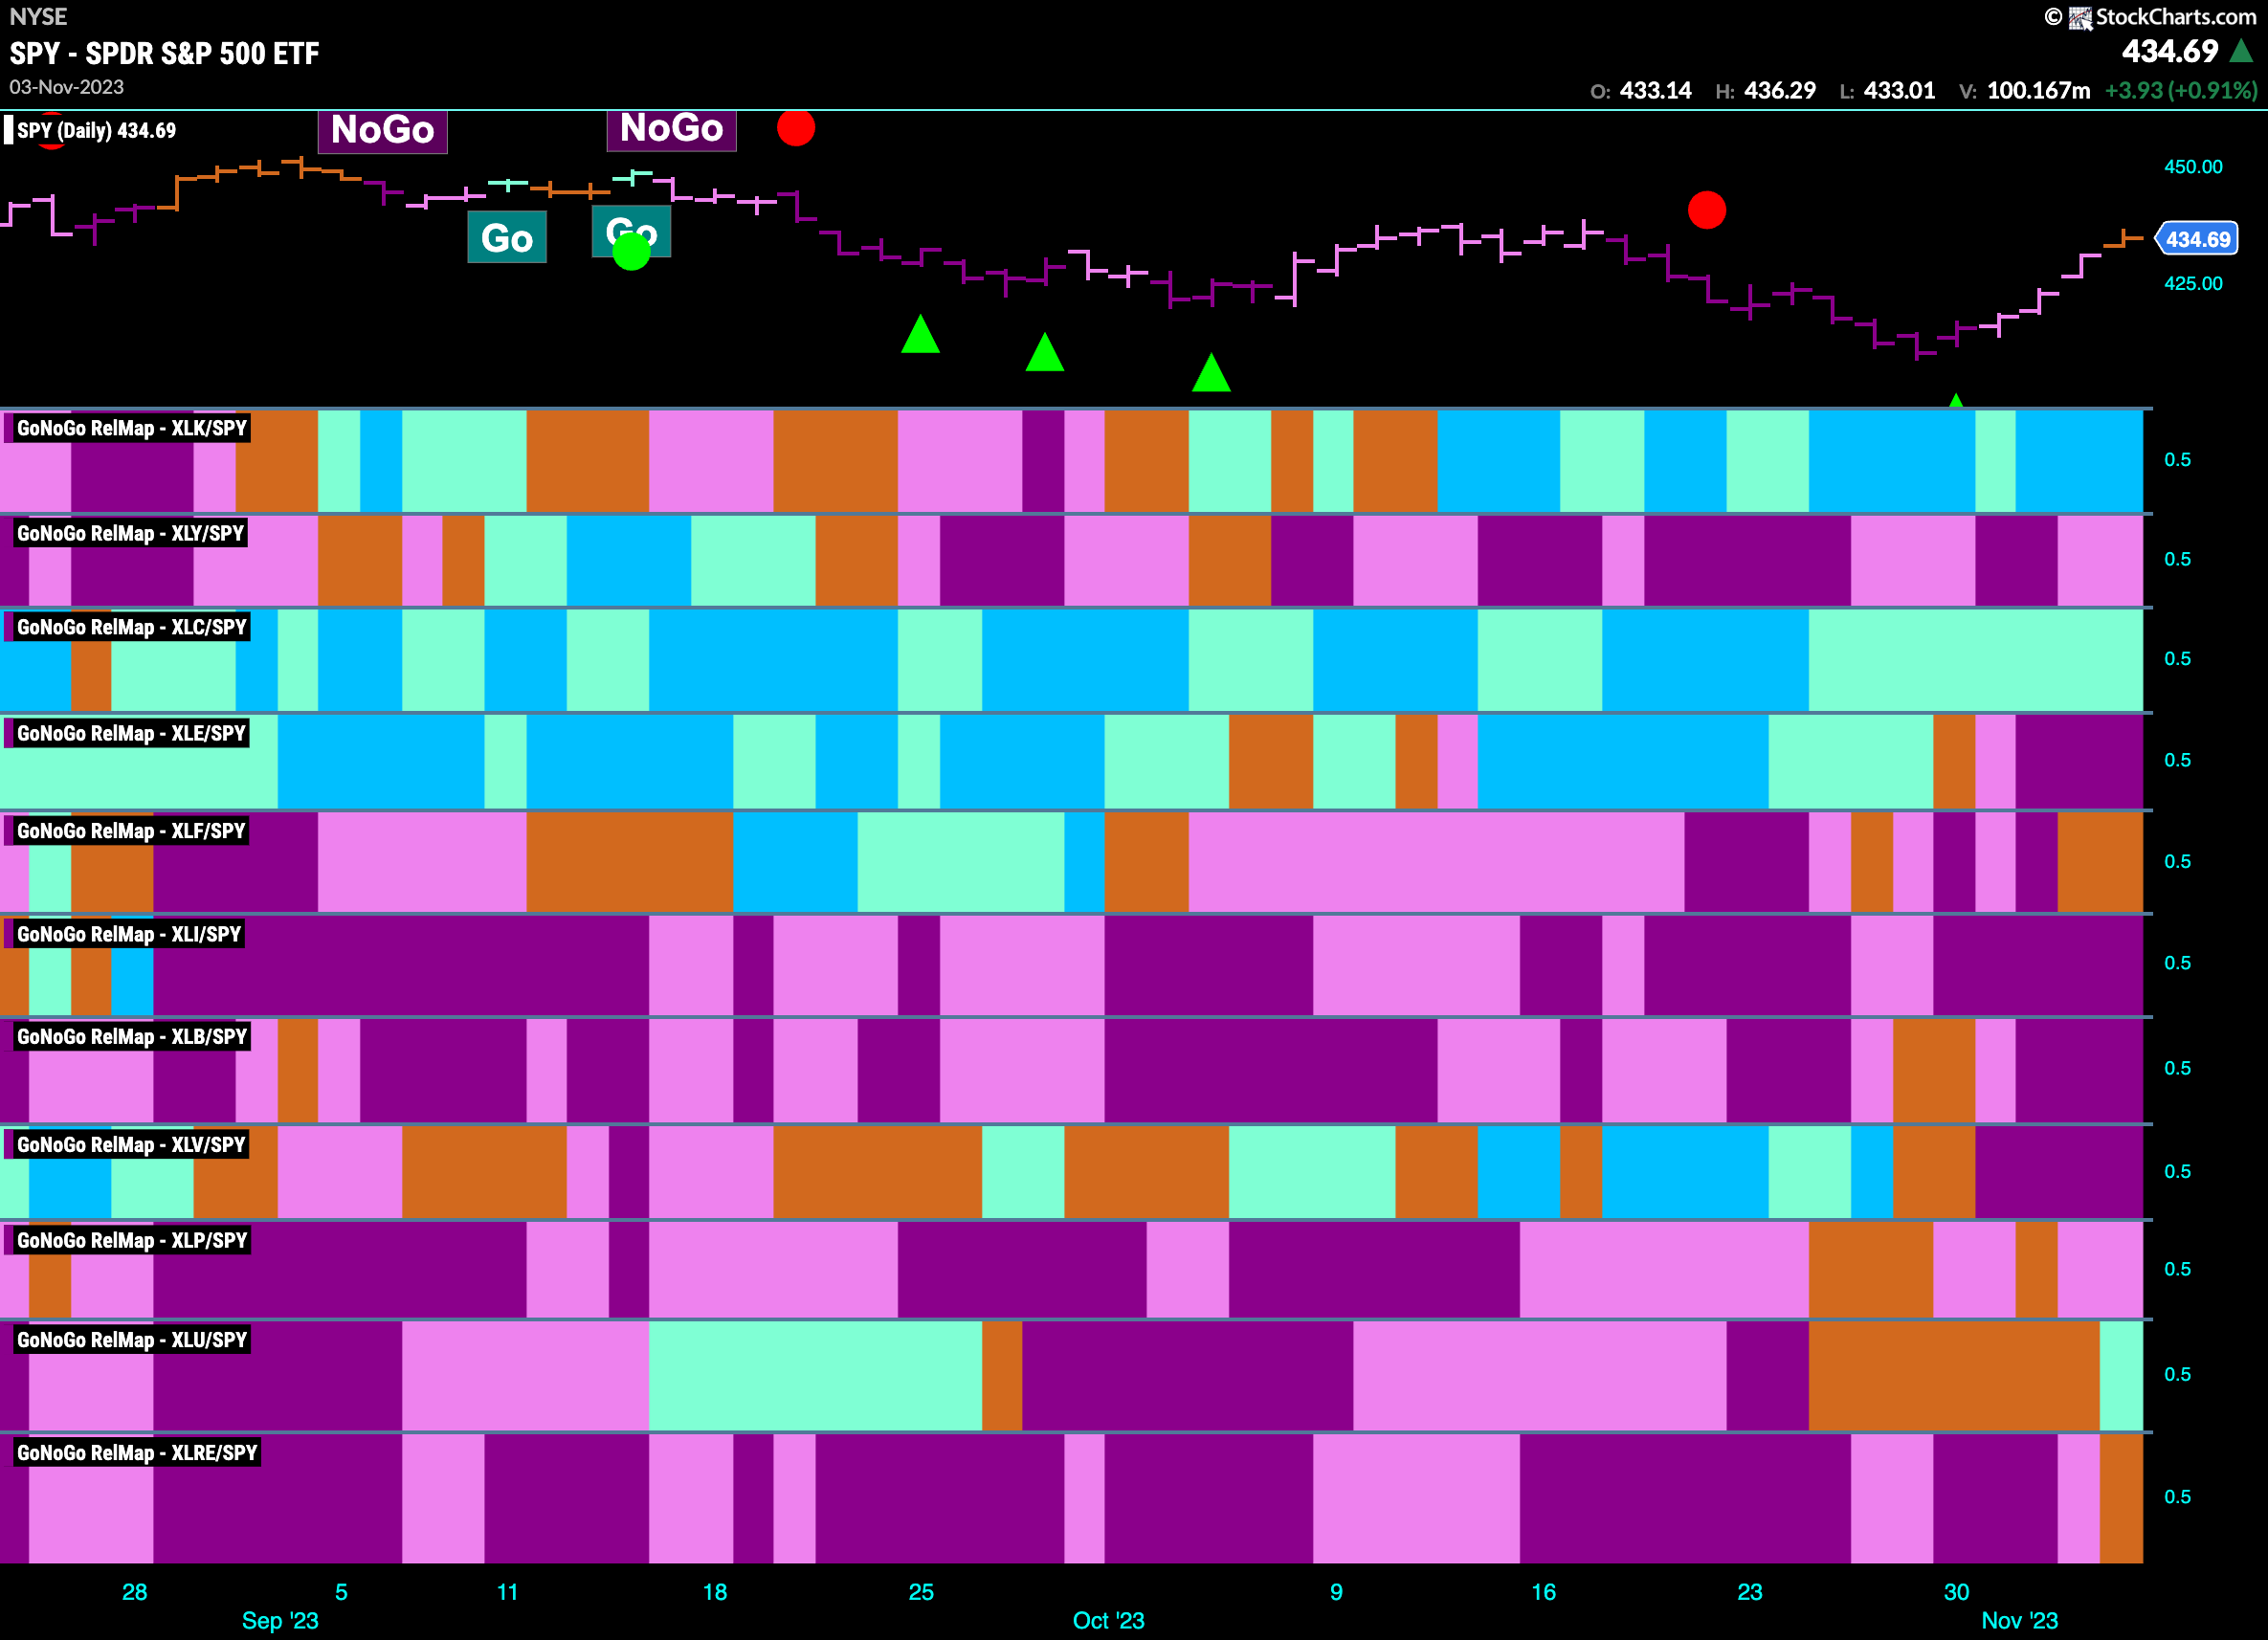
Sector RelMap
Below is the GoNoGo Sector RelMap. This GoNoGo RelMap applies the GoNoGo Trend to the relative strength ratios of the sectors to the base index. Looking at this map, we can quickly see where the relative outperformance is coming from as well as which sectors are lagging on a relative basis. 3 sectors are outperforming the base index this week. $XLK, $XLC, and $XLU, are painting “Go” bars.
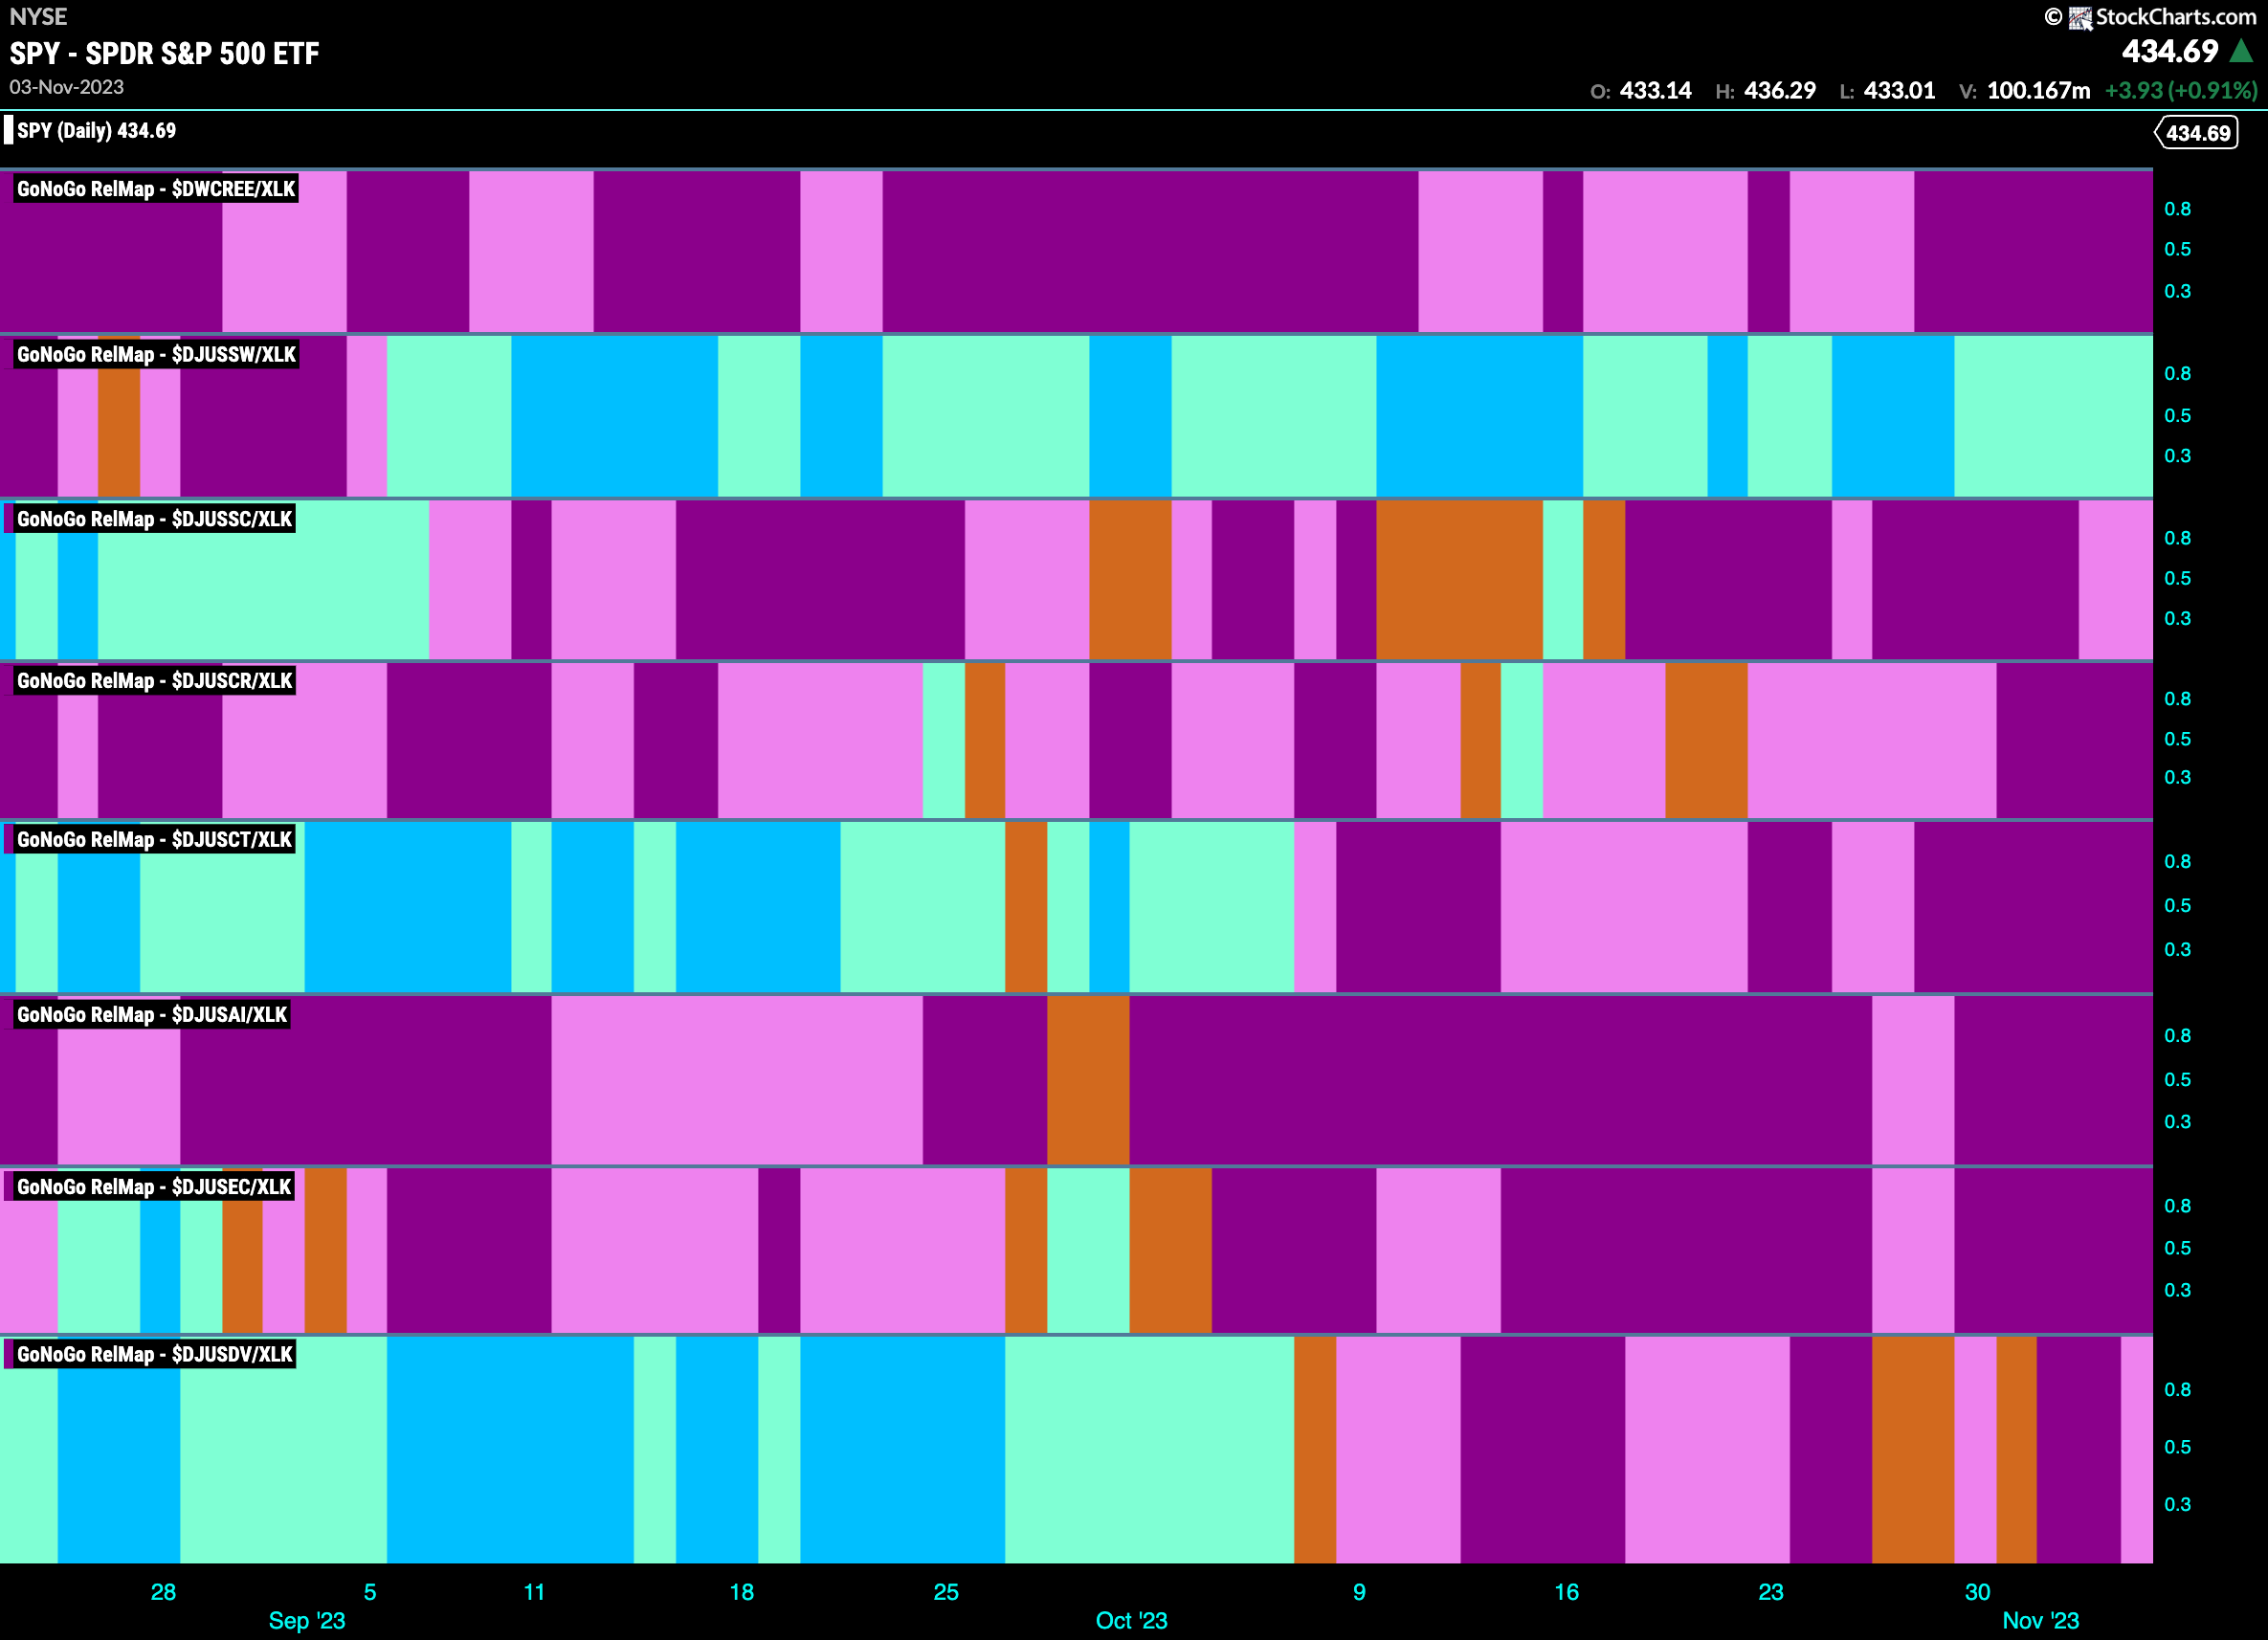
Technology Sub-Group RelMap
The GoNoGo Sector RelMap above shows the technology sector returning to paint strong blue “Go” bars in terms of its relative outperformance versus the larger index. We can break down the sector in a Sub-Group RelMap to see what is driving that outperformance. Currently, it is the software sub-group (panel 2) that is in a persistent “Go” trend relative to the sector itself.
$PLTR Sets up For Move Higher?
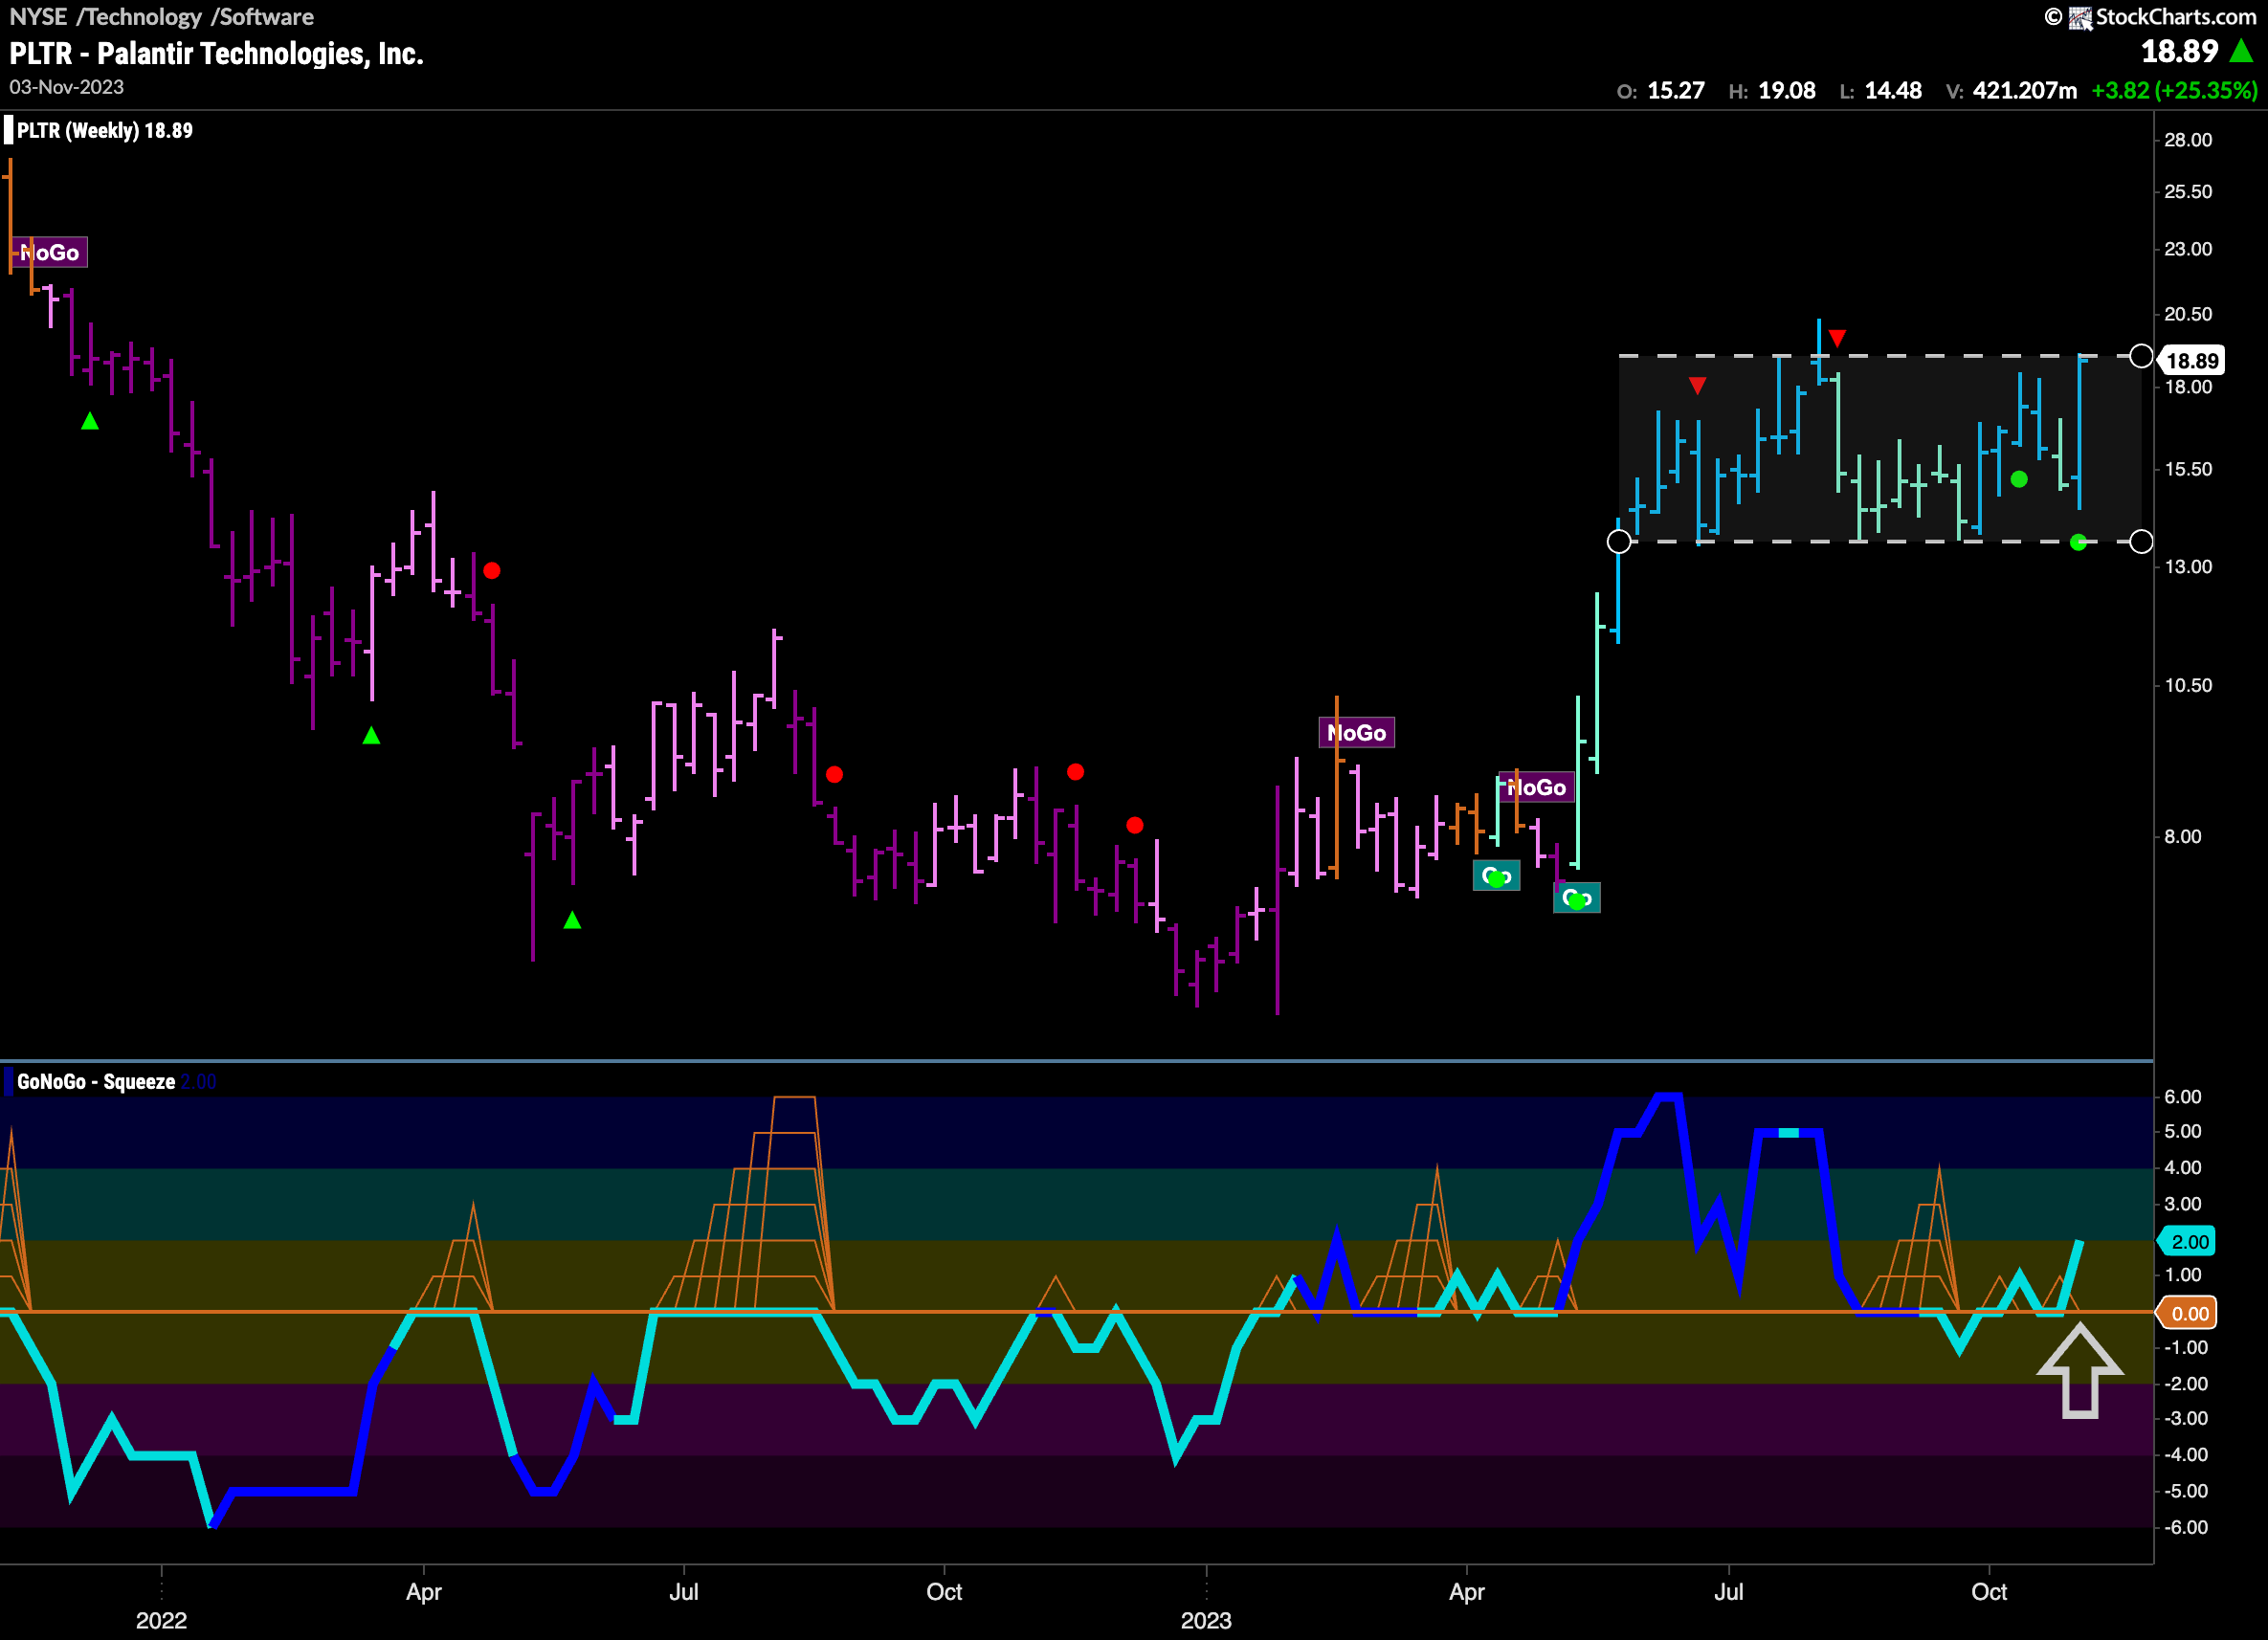
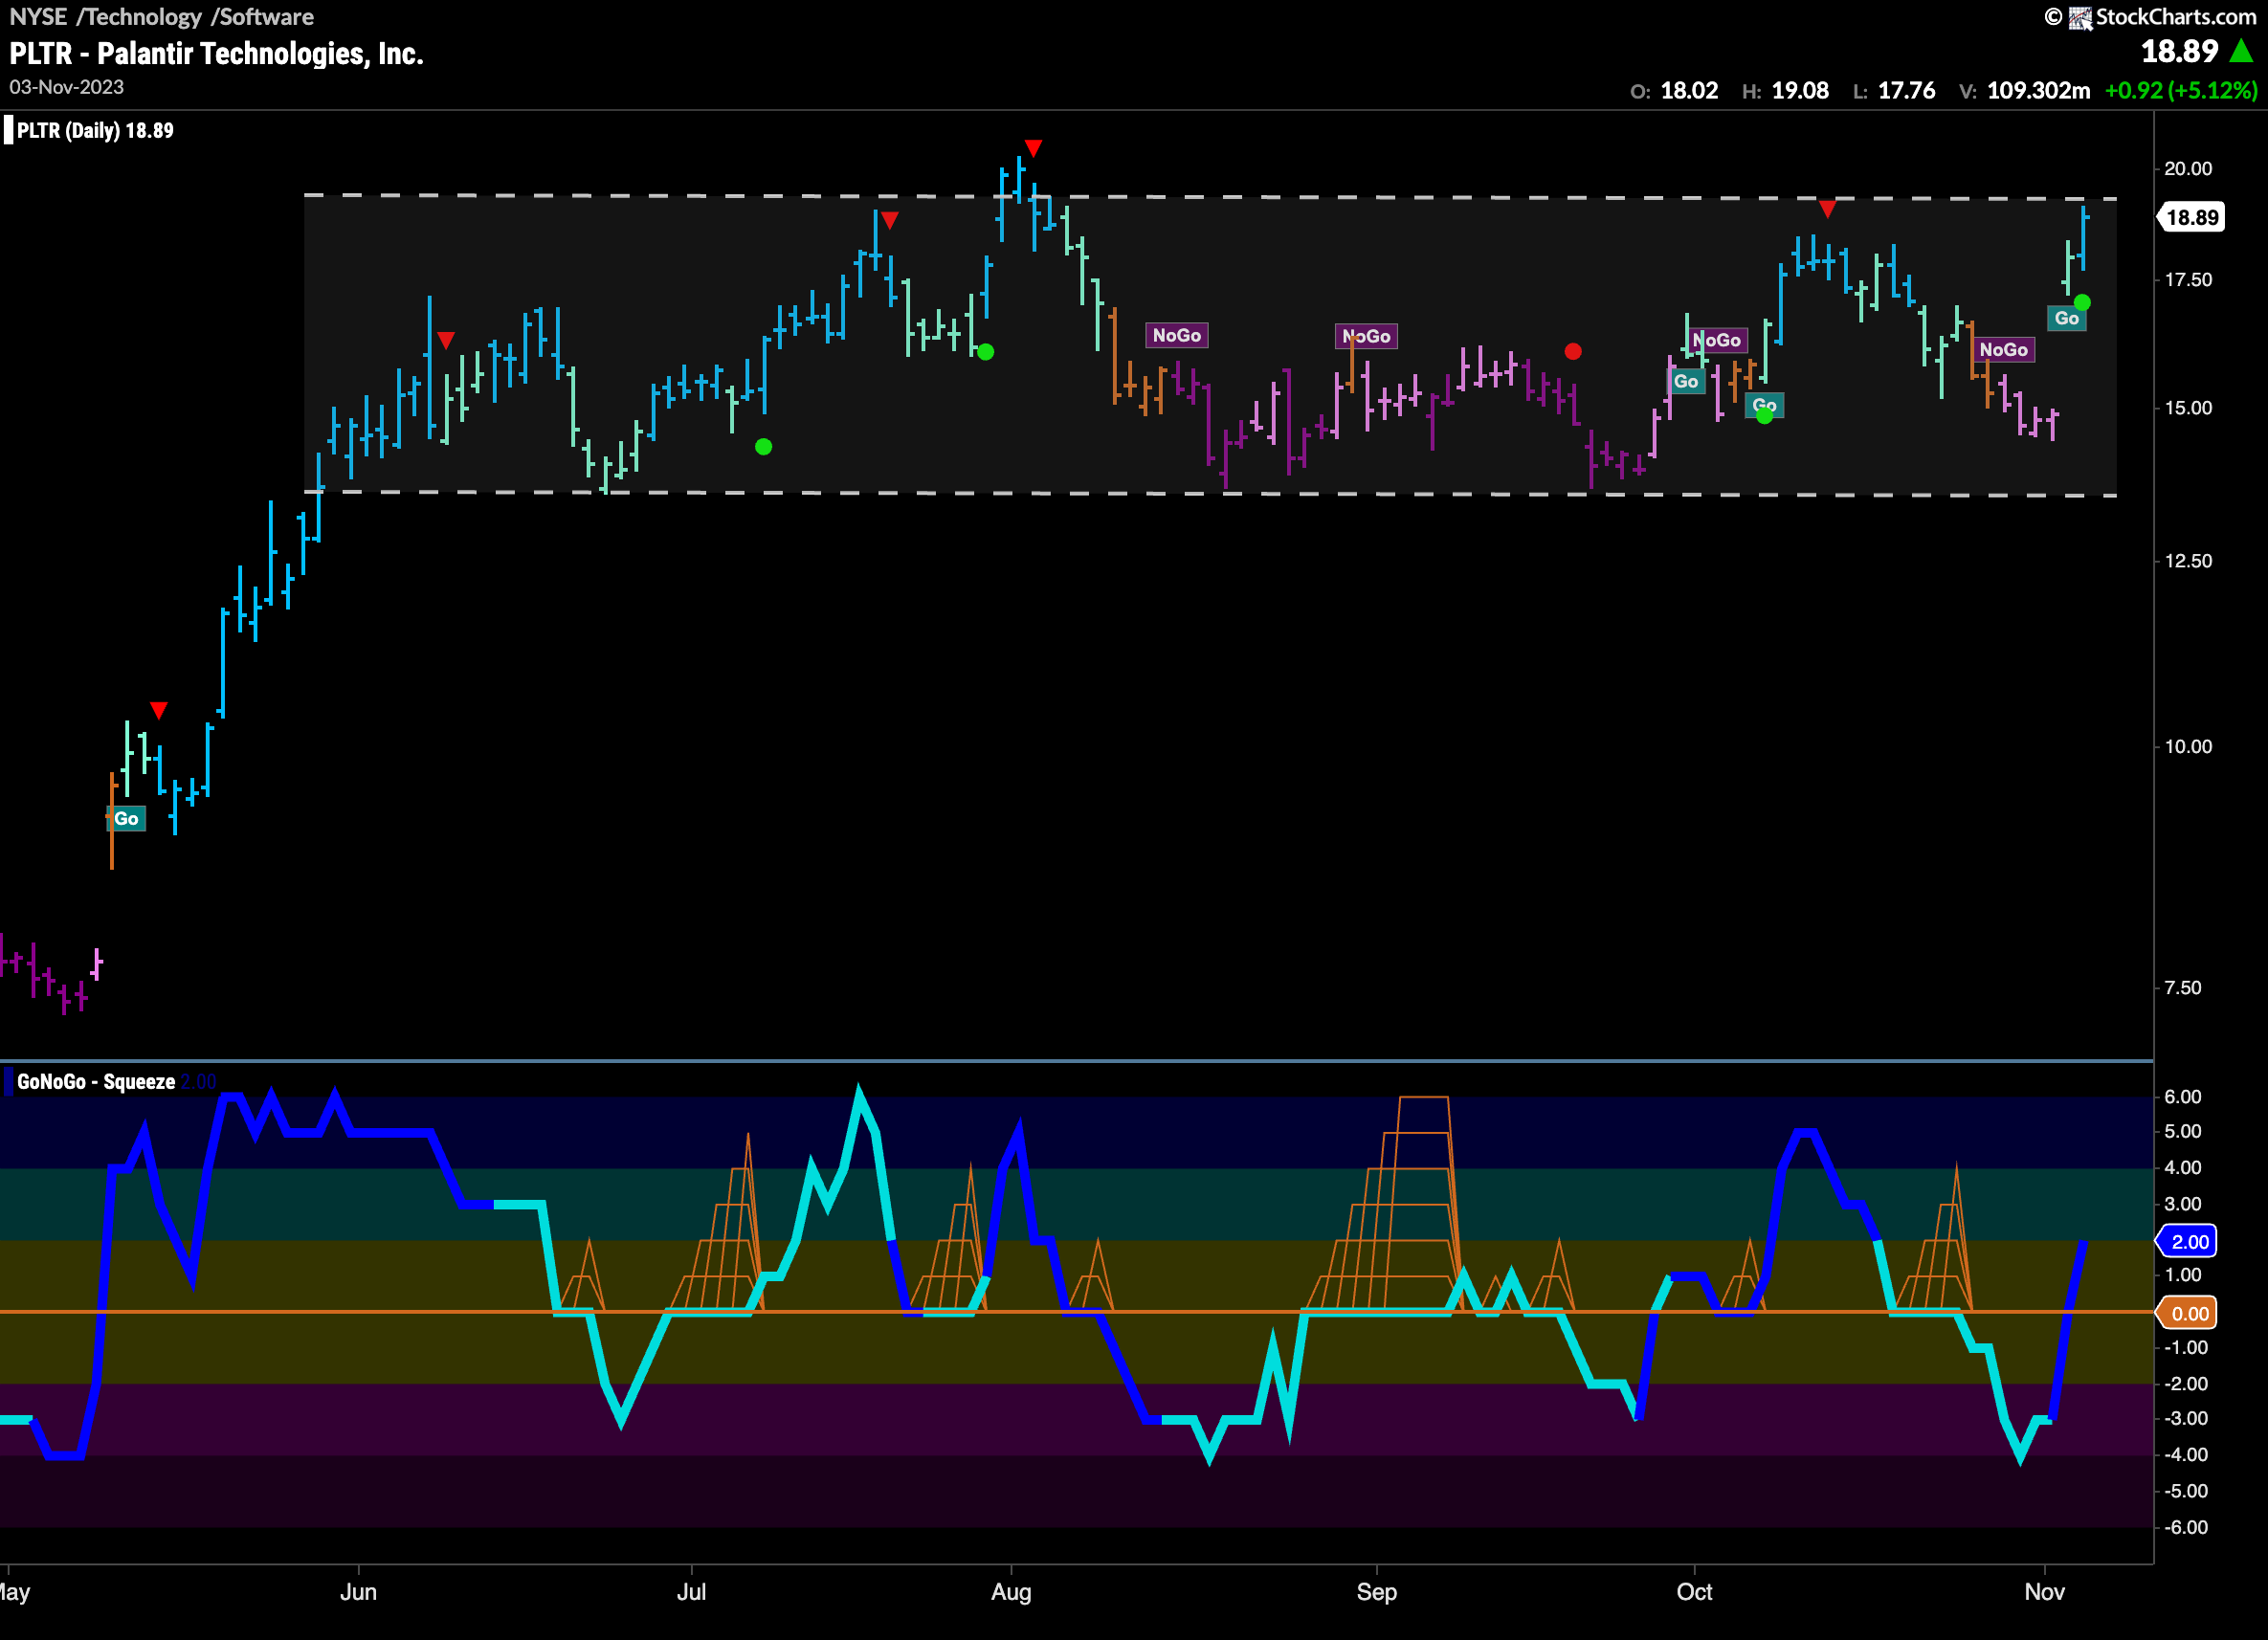
Palantir Technologies was one of the darlings of the pandemic tech rally in 2020. It struggled through 2022 and into the beginning of this year causing some investors to forget about the stock. The weekly chart below shows that late spring saw a new “Go” trend that pushed price quickly higher and this “Go” trend is now well established. Since Go Countertrend Correction Icons (red arrows) in the summer we have seen price settle into a sideways channel as it creates clear support levels at the lower bound. During that time, GoNoGo Oscillator has primarily found support at the zero line which is a positive for the health of the “Go” trend. Now, price is testing the upper bound of the channel and we see Go Trend Continuation Icons (green circles) as momentum stays on the side of the trend.
The daily chart shows that this has been a long sideways move that has created some choppiness. We are now back testing the top of the channel and GoNoGo Oscillator has burst back through the zero line into positive territory and volume is heavy. We will watch to see if this resurgent momentum and resistance will be enough to push price to new highs.
$ZENV Enters New Trend on Weekly Timeframe
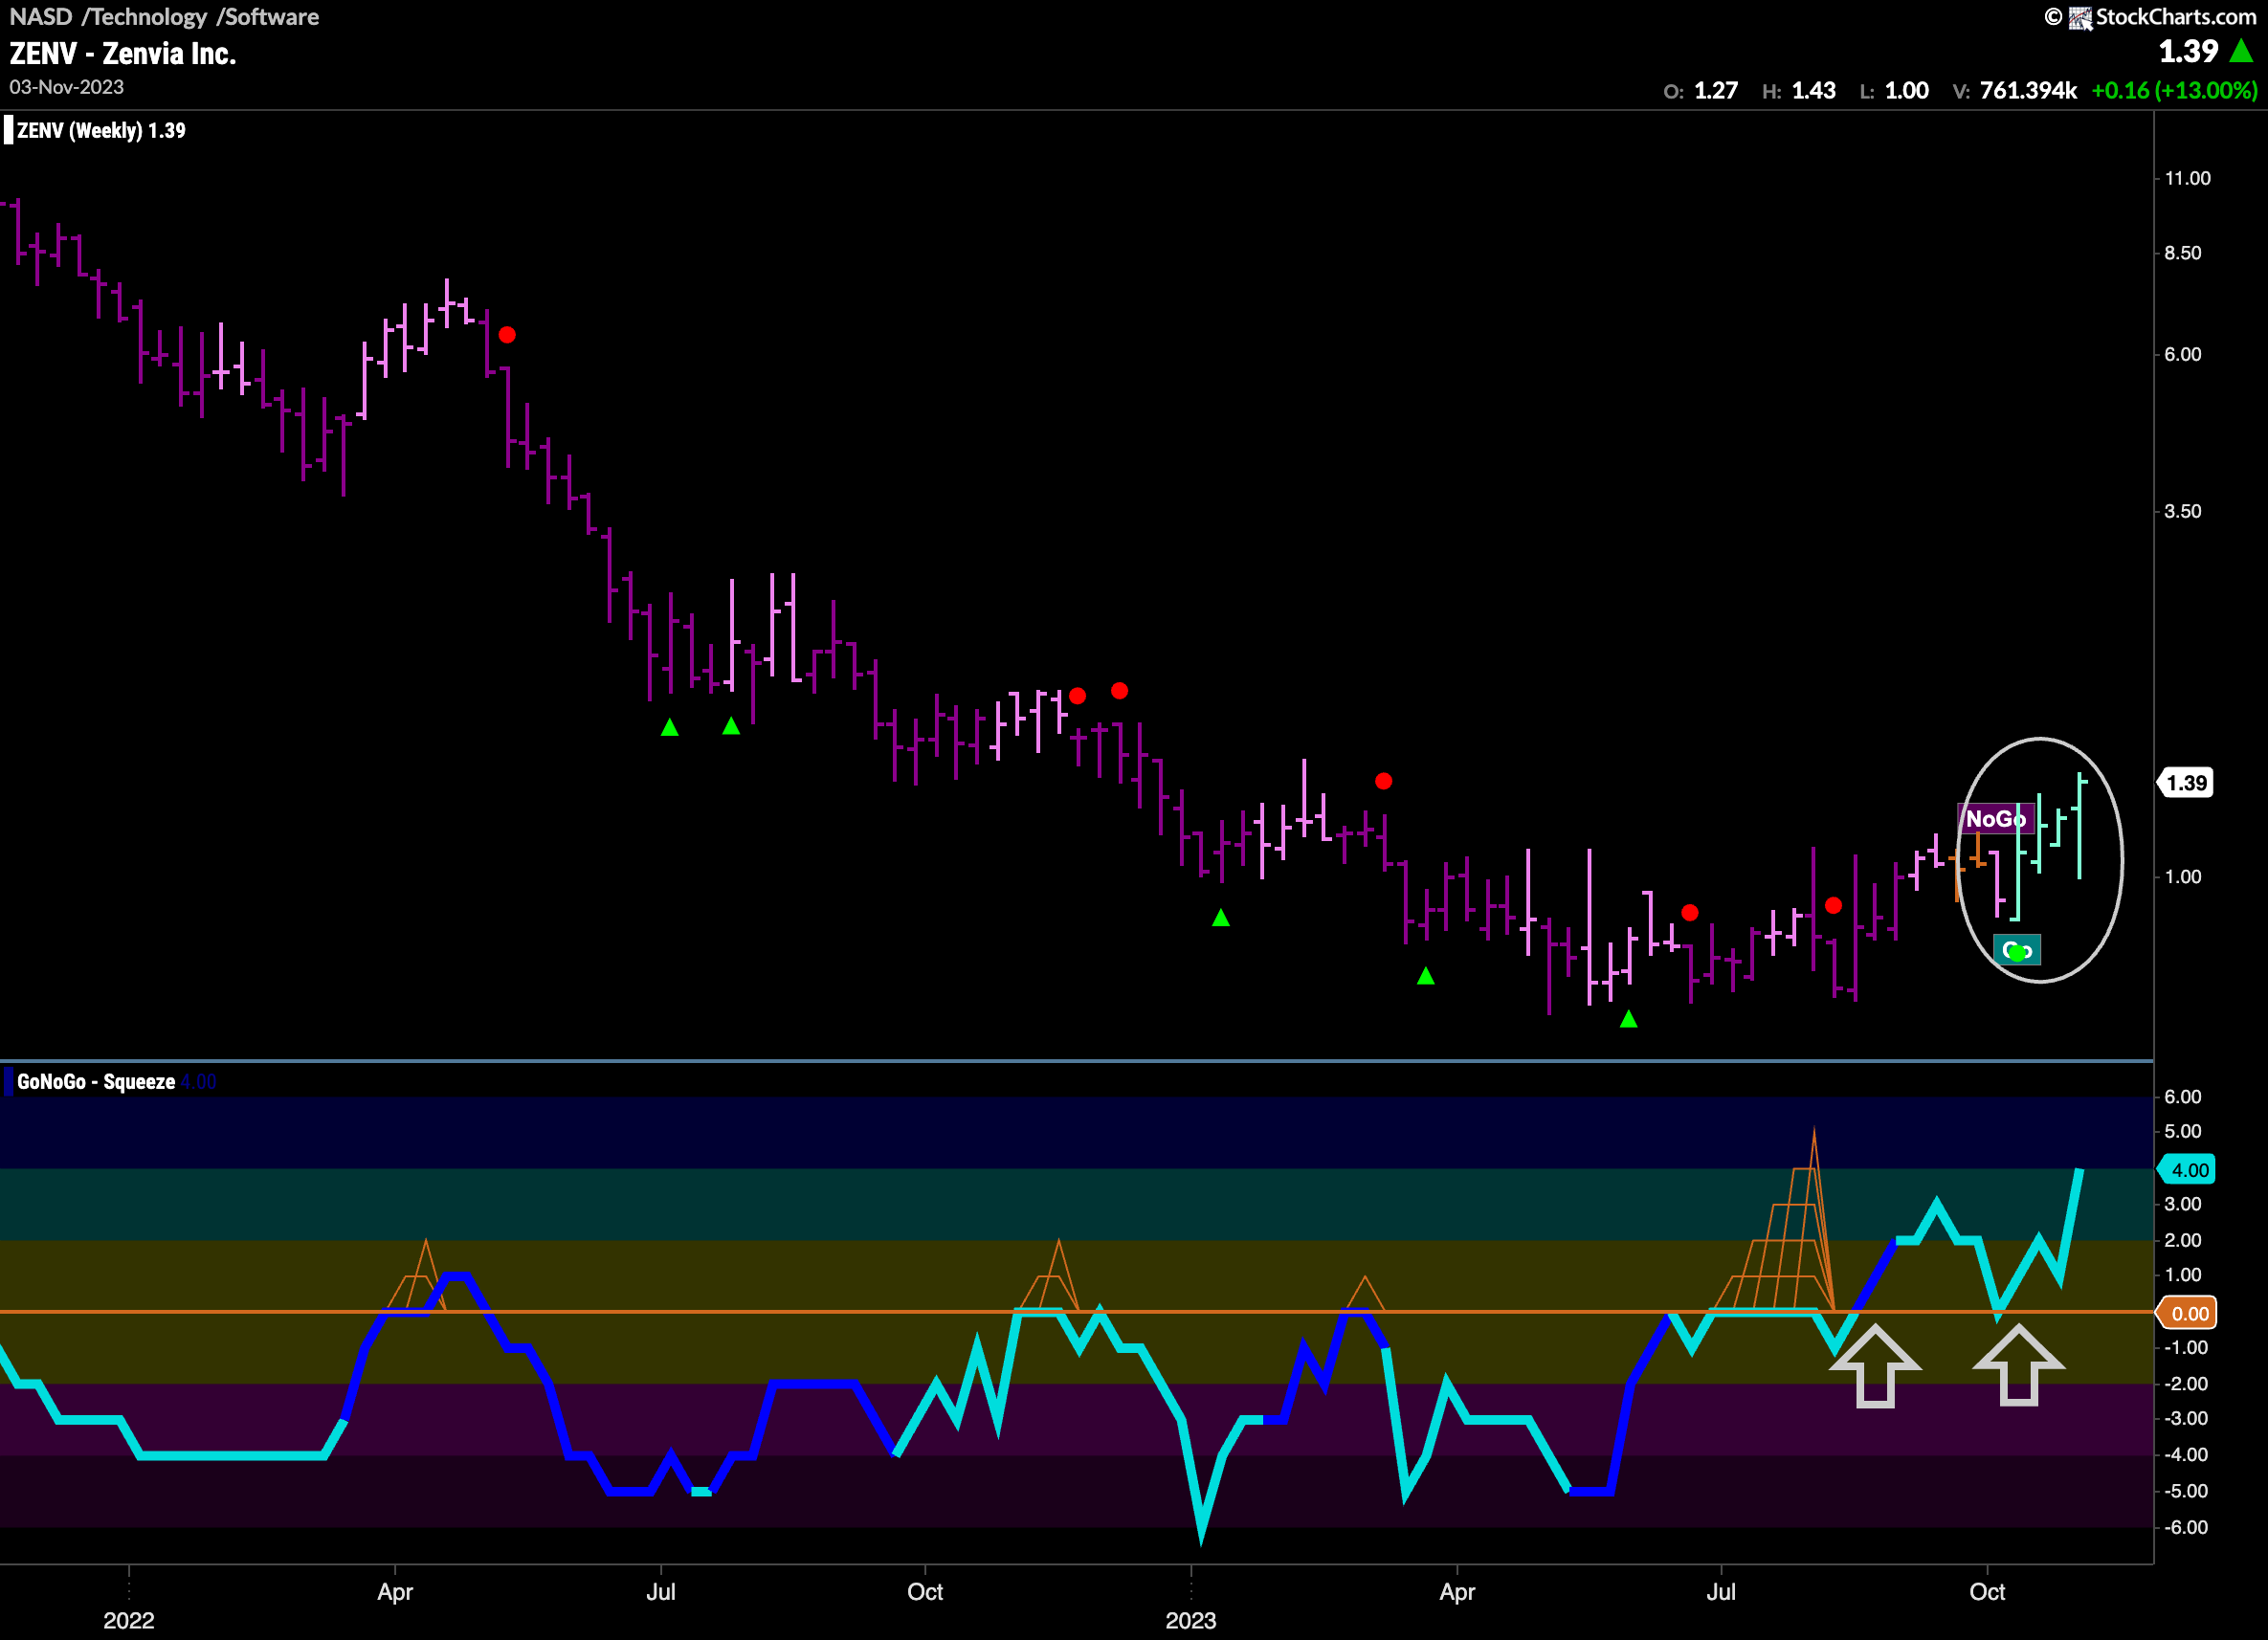
Another security in the outperforming software space is $ZENV. We can see that after a very long and strong “NoGo” trend GoNoGo Oscillator was able to break above the zero line after a GoNoGo Squeeze. This showed price was emerging from a basing pattern. After a couple of amber “Go Fish” bars GoNoGo Trend began to paint aqua “Go” bars and GoNoGo Oscillator retested the zero line from above and found support. Now, with a “Go” trend in place and support from positive momentum we will look for price to move higher from here.
