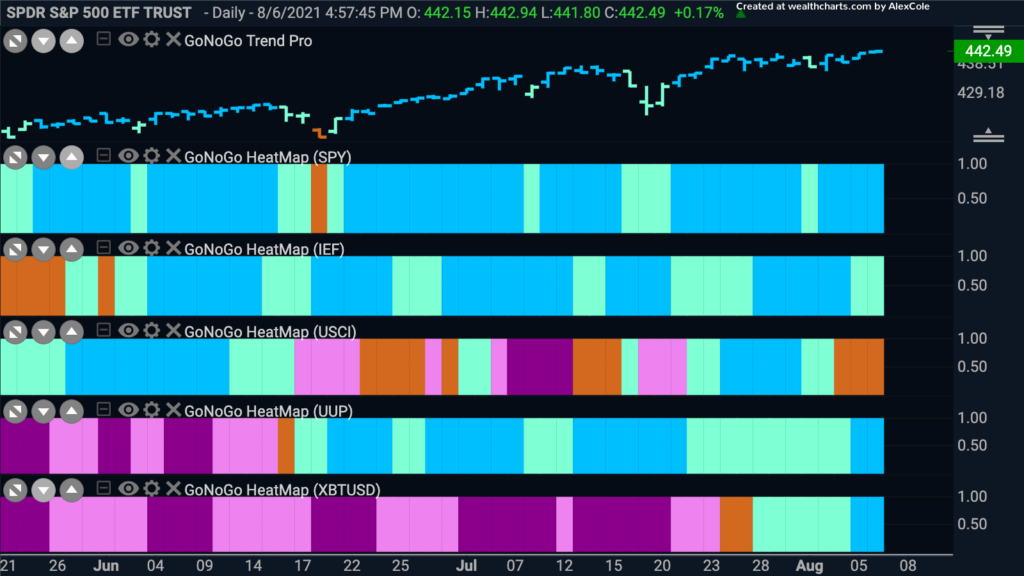
This week we see most of the the “Go” trends remain in place. Equities set a new high on strong blue “Go” bars, and treasury prices were able to maintain their “Go” trend even though they weakened to pale aqua bars. We discussed the dollar last week and it bounced back, strengthening to strong “Go” bars to end the week. Bitcoin also saw its “Go” trend strengthen and ended the week painting strong “blue” bars. Commodities have struggled though, and have painted a succession of amber “Go Fish” bars.
Bitcoin Ready to Bounce
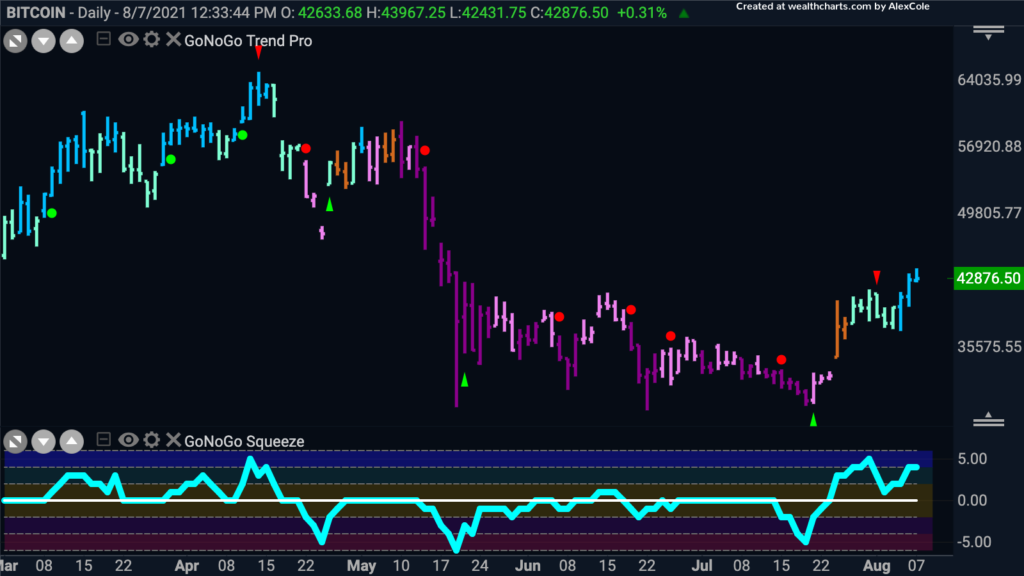
Last week we saw the emergence of the new “Go” trend in the world’s largest digital asset. This week we saw the trend strengthen as the end of the week painted strong blue bars. We saw the GoNoGo Oscillator break above zero as the GoNoGo Trend moved from NoGo colors into amber “Go Fish” bars. Since then, it has found support at the zero line and rallied back into positive territory as the trend strengthened. Currently, price is trying to consolidate above levels that were resistance during the “NoGo” trend. If prices can hold here we will look for more gains.
Stick with the Strong Sectors
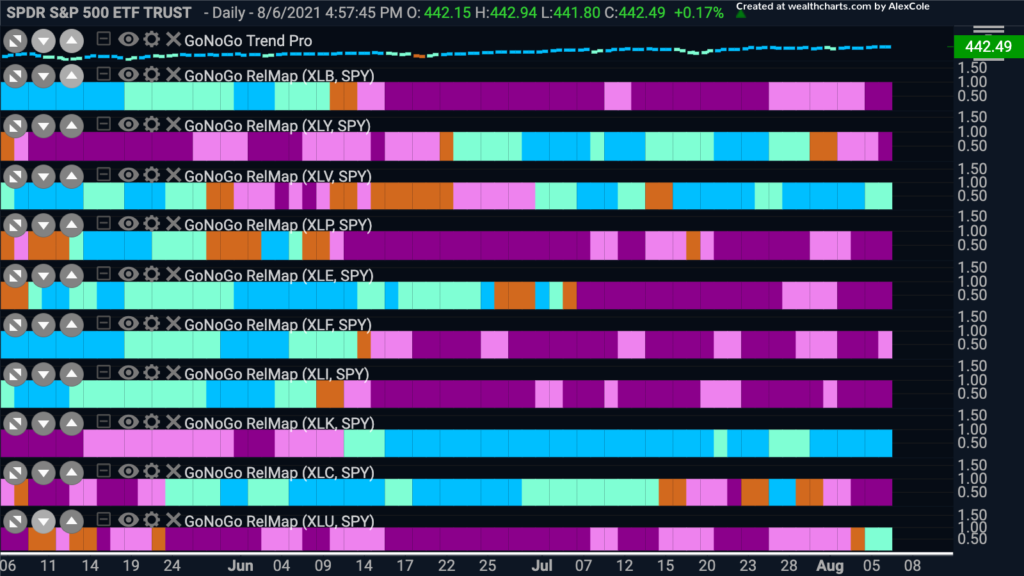
Below is the GoNoGo RelMap showing the trend of the relative strength ratios of each of the S&P 500 sectors to the base index. Although the broad market index is hitting new all time highs, only 3 sectors are outperforming on a relative basis. The healthcare sector ($XLV), the technology sector ($XLK) and the utilities sector ($XLU) are in relative “Go” trends while the rest of the sectors are underperforming. Does this imply weak market health or will the other sectors fall into line?
Technology Continues to Lead
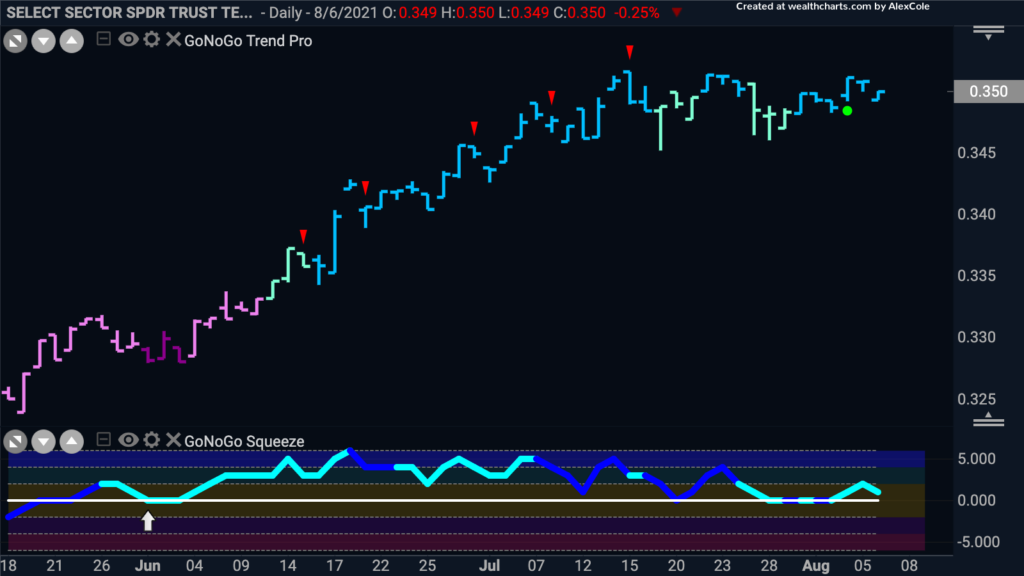
The GoNoGo Chart below shows the GoNoGo Trend and GoNoGo Oscillator applied to the ratio of $XLK to $SPY. We can see that after rallying strongly from the middle of June price has consolidated sideways but recently found support having spent several bars stuck at the zero line. In theory, if the GoNoGo Oscillator has found support at zero then it suggests a resurgence of momentum in the direction of the trend. That being said, we will look to see if price can set a new high.
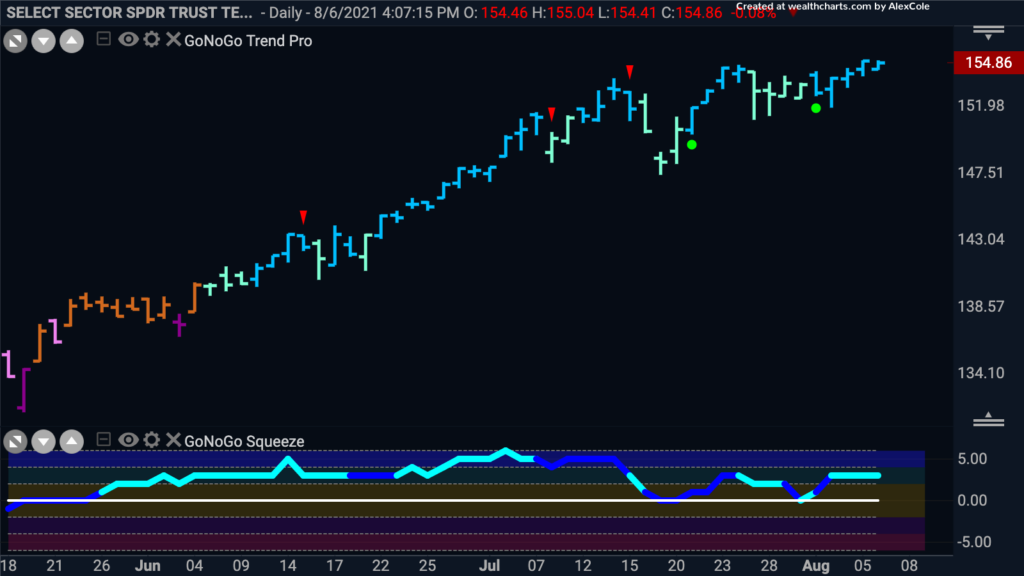
If we take a look at the pure GoNoGo Trend of the technology sector it is very bullish. This week we’ve seen a succession of strong blue “Go” bars. Recently the GoNoGo Oscillator bounced off the zero line and is now in positive territory but not yet overbought. Price has crept to new highs and we will see if price can consolidate at these levels which would provide a platform for further gains.
Zoom-ing higher?
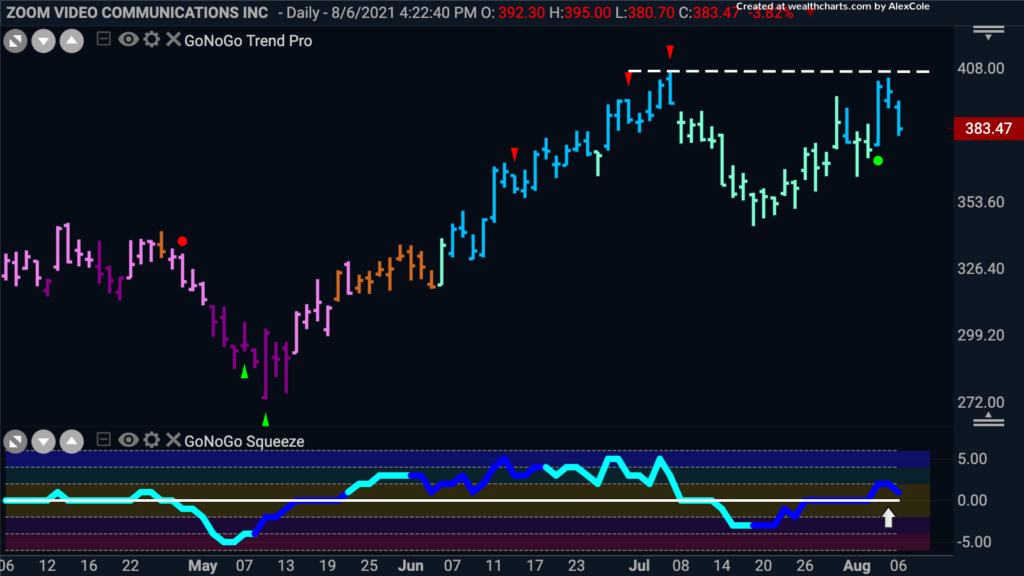
Looking for single stock opportunities within the technology sector, Zoom has been strong recently and painted the brightest blue “Go” bars to end this week. It did however run into resistance at levels that were prior highs and we’ll need to see price get above this resistance in order to set new highs. The GoNoGo Oscillator has broken above zero and on heavy volume as well. It has quickly turned back to zero and we will need to monitor closely to see if there is support again at the zero line. If so the “Go” trend is likely to continue.
Zooming in for Possible Entry
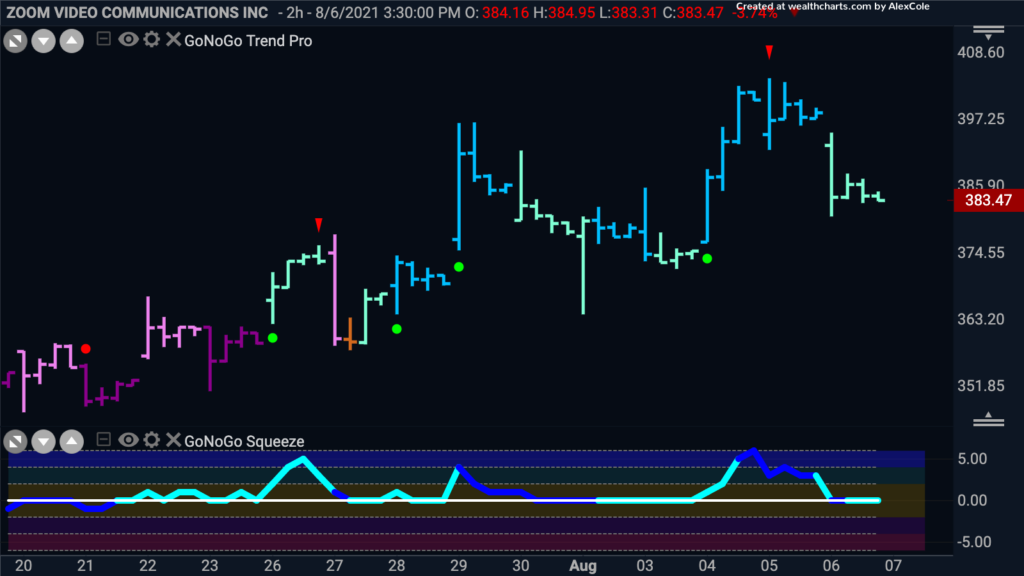
If we take a look at a 2 hr GoNoGo Chart of Zoom Video Communications Inc, we can see that price has corrected from a recent high and we saw a red countertrend correction arrow at the high. This correction has caused the GoNoGo Oscillator to fall to and ride the zero line for several bars. Price is currently at levels which would be a new higher low if it can rally from here. Knowing that the “Go” trend is in place, it is likely that the GoNoGo Oscillator will find support at zero and rally once again into positive territory. Should this happen, we will see a green low risk trend continuation icon appear under price which would suggest an attack on the most recent high.
Cloudflare Inc Soaring above the Clouds
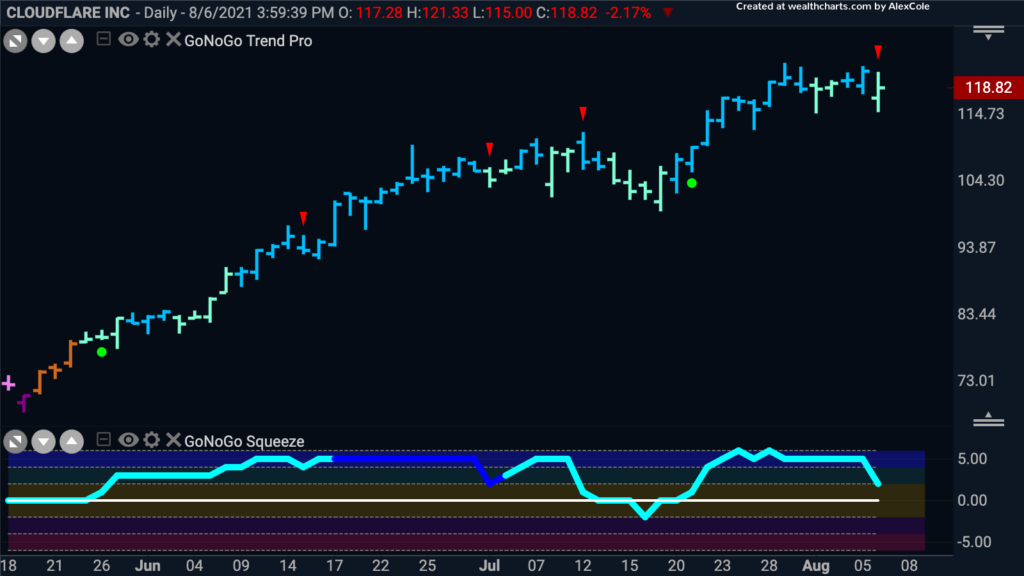
CloudFlare Inc is another stock in the outperforming technology sector in a very strong “Go” trend. Newton’s first law states that an object in motion will stay in motion until acted on by an external force. So it is with trends. “The trend is your friend until it ends” might be another way to look at it. In this case, the trend in place is clearly a “Go”. We have seen a series of higher highs and higher lows since the “Go” trend was identified at the end of May and the GoNoGo Oscillator has been mostly in positive territory since then. Currently, the GoNoGo Oscillator is falling as price takes a breath for investors to digest gains, and we will look to see if support at zero will provide another low risk opportunity to enter the “Go” trend as price tries to rise above the clouds.
