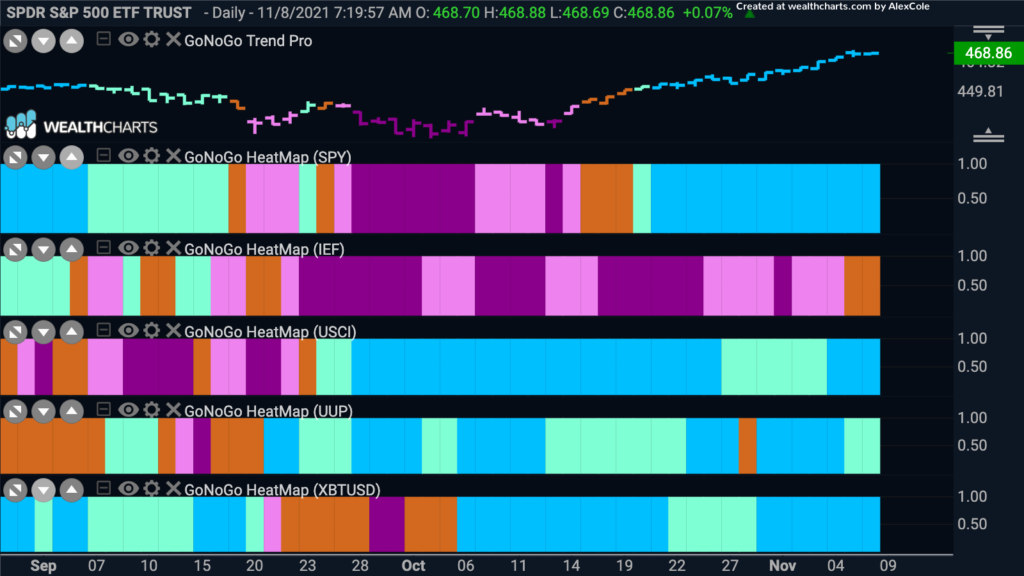
Good morning and welcome to this week’s Flight Path. Let’s take a look at the below GoNoGo Asset Map for this week. The top panel shows that the “Go” trend has remained strong in U.S. Equities. Prices climbed to a new high once again to end the week and we are looking at a string of uninterrupted bright blue “Go” bars. Commodities remain in the “Go” trend and we see strength again as the week ends with strong blue bars. The U.S. dollar was able stay in a “Go” trend albeit on paler aqua bars. Bitcoin also saw its trend stay strong this week.
Sector Strength
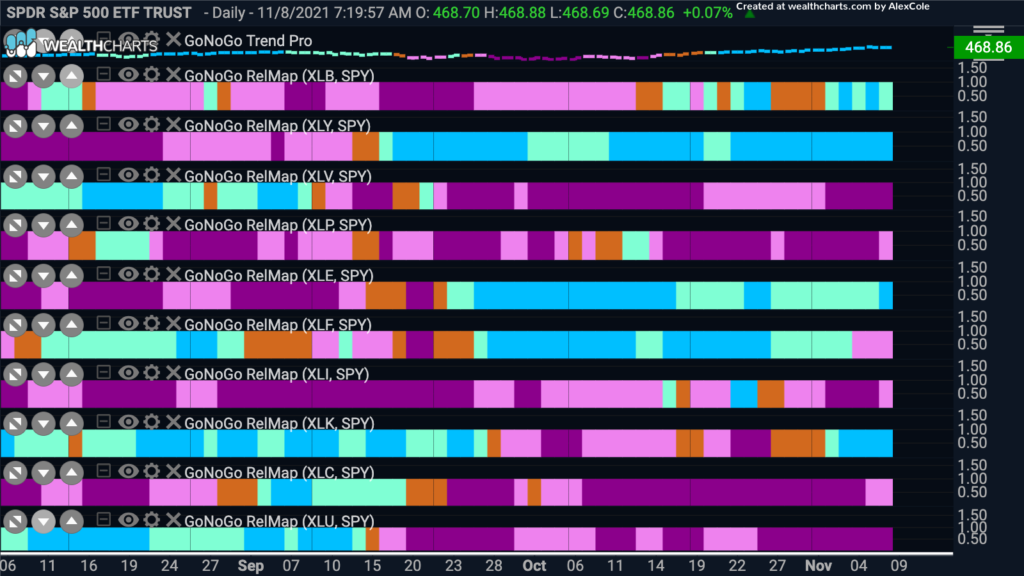
Below is a GoNoGo Sector RelMap. The chart applies the GoNoGo Trend to the relative ratio of each sector ETF to the base ETF, the $SPY. There are four sectors that are showing relative “Go” trends to end the week. Materials ($XLB), discretionary ($XLY), energy ($XLE) and technology ($XLK). Discretionary and energy have been strong for some time but it is good to see materials hanging on to its relative outperformance and also technology return to its “Go” trend.
Technology Takes off Again
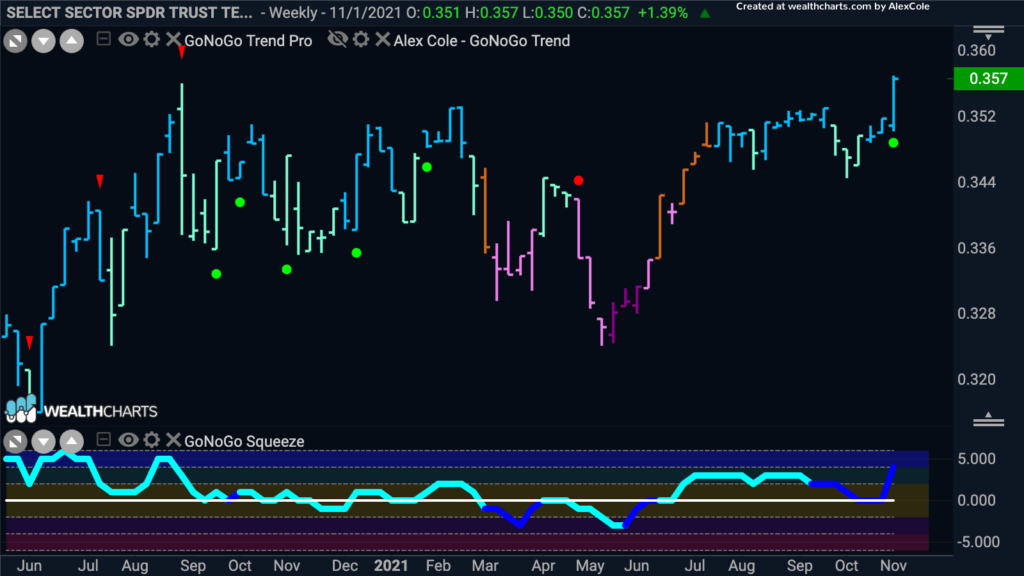
Below is a GoNoGo Chart of the ratio of $XLK to $SPY. From the above GoNoGo RelMap we saw that technology has started to outperform the broader index. If we look at the chart of this ratio with the GoNoGo Trend and Oscillator applied we can see that the recent “Go” trend came after the oscillator broke above positive territory. The bars following the “Go” trend broke new highs and the oscillator showed strong momentum on heavy volume.

Looking at this ratio on a larger time frame, we can turn to the GoNoGo weekly chart below. It was a strong week for the ratio as we see GoNoGo Oscillator find support at the zero line on heavy volume. This tells us that positive momentum has returned in the direction of the “Go” trend. This triggered a green Go Trend Continuation icon to appear under the price bar. The long term environment is strong for tech relative to the S7P but there is some potential overhead resistance from prior highs from September 2020 to look out for.
From Facebook to Meta
Facebook recently changed its name to Meta Platforms Inc. Some say it is an attempt to distance itself from controversy, believers say its a push to be innovative and move technology forward into the metaverse. Let’s look at the charts.
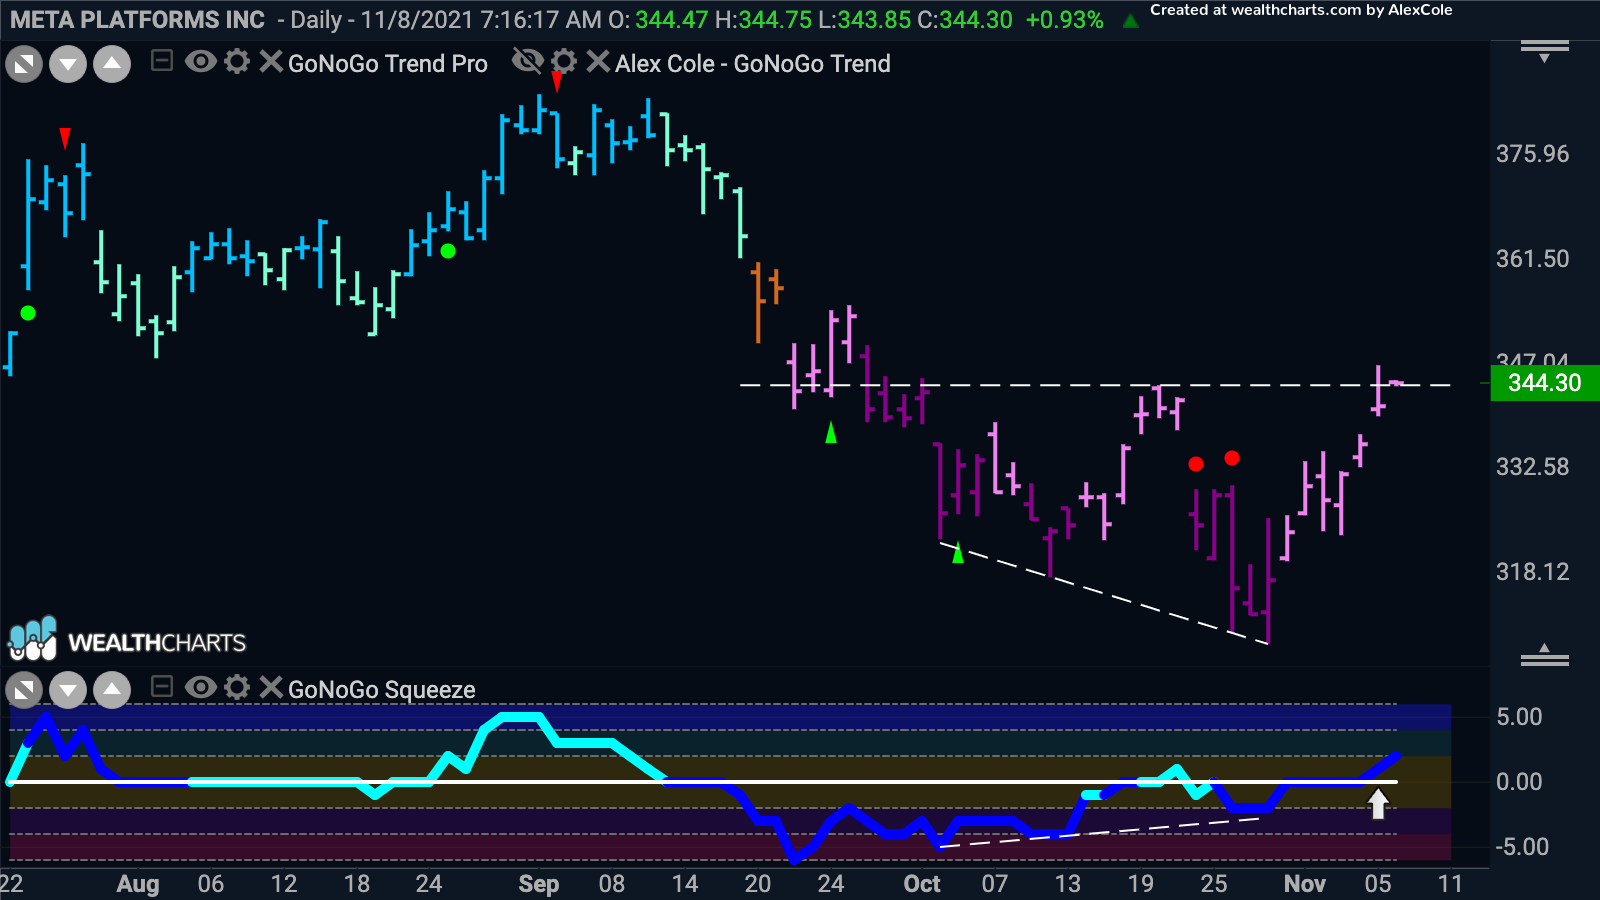
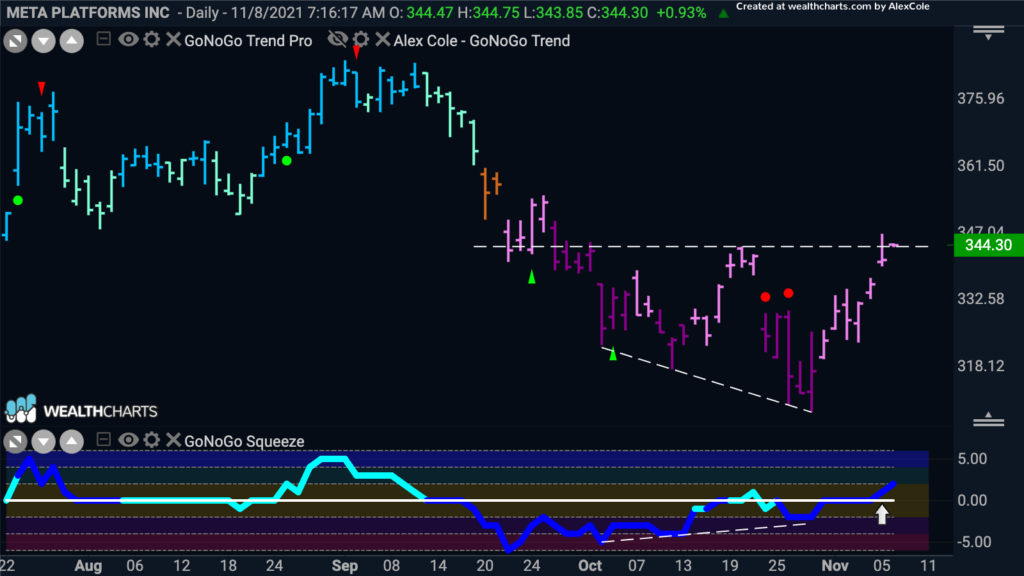
The daily chart below shows $FB is still embroiled in a “NoGo”. Given the strength in the sector we can look for reasons to be ready for a technical change. We see traditionally bullish divergence between price and the oscillator. Price made a lower low but GoNoGo Oscillator did not confirm and instead made a higher low as it approached zero. Now, GoNoGo Oscillator has broken above zero on heavy volume. We know that in theory, if this “NoGo” trend was healthy, that wouldn’t happen. Price is also currently at resistance from a clustering of supply and demand at around $344. If price can consolidate above this level and the zero line begins to act as support for the oscillator we may well see a color change in the GoNoGo Trend.
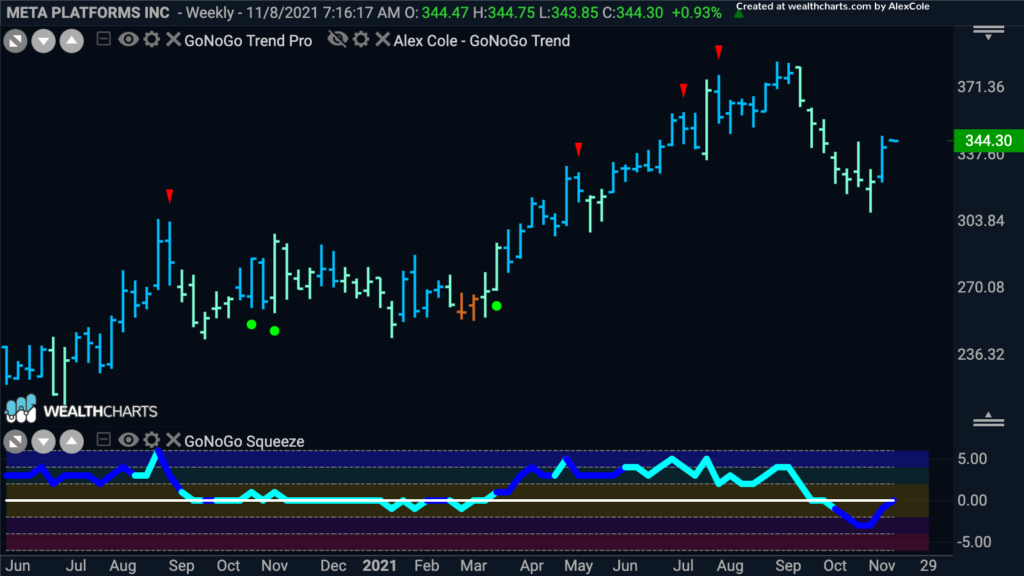
How does Faceb… I mean Meta, look on a weekly chart? Is there reason to believe that the above daily chart may incline itself towards a “Go” trend? The chart below shows the GoNoGo Trend and Oscillator applied to weekly prices. We see that the “Go” trend remains in place. In fact, after a string of paler aqua “Go” bars that corrected against the trend, we ended the week with a strong, bright blue bar. GoNoGo Oscillator is at a crucial point, having broken below zero, which was a concern, it is now back at the zero line on heavy volume. We will watch to see if it can break back into positive territory or if it gets rejected here.
Materials Hanging On to Outperformance
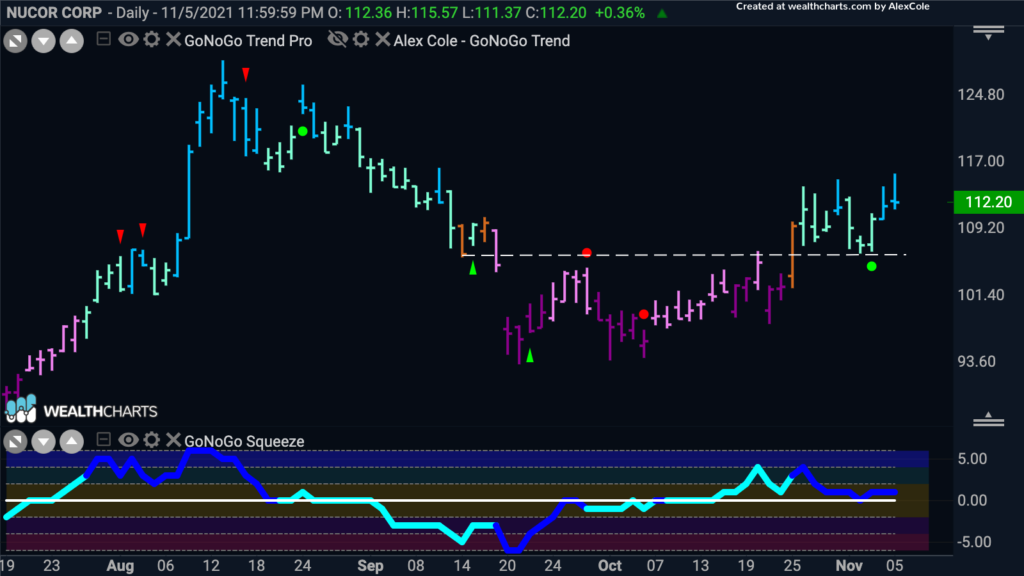
We noted at the beginning of this Flight Path that the materials sector was one of the 4 outperforming sectors on a relative basis to the broader index. Having flirted with an amber “Go Fish” bar a week ago, the trend has returned for the sector. Looking for an opportunity here then as an alternative to the technology sector we can look at the charts of Nucor Corp. The daily chart below is a set up that we like a lot. After enduring a month long “NoGo” correction, the GoNoGo Oscillator first broke above the zero line. This was followed with an amber “Go Fish” bar as often happens as a bridge between trends. This amber bar closed above pattern resistance and was followed by the new “Go” trend. Importantly, price retested this level that was now support, but maintained “Go” colors. On heavy volume, GoNoGo Oscillator found support at zero leading to a Go Trend Continuation green circle appearing on Wednesday. Initially we would target prior highs of almost $129. Should prices reverse, a natural stop level is just below horizontal support.
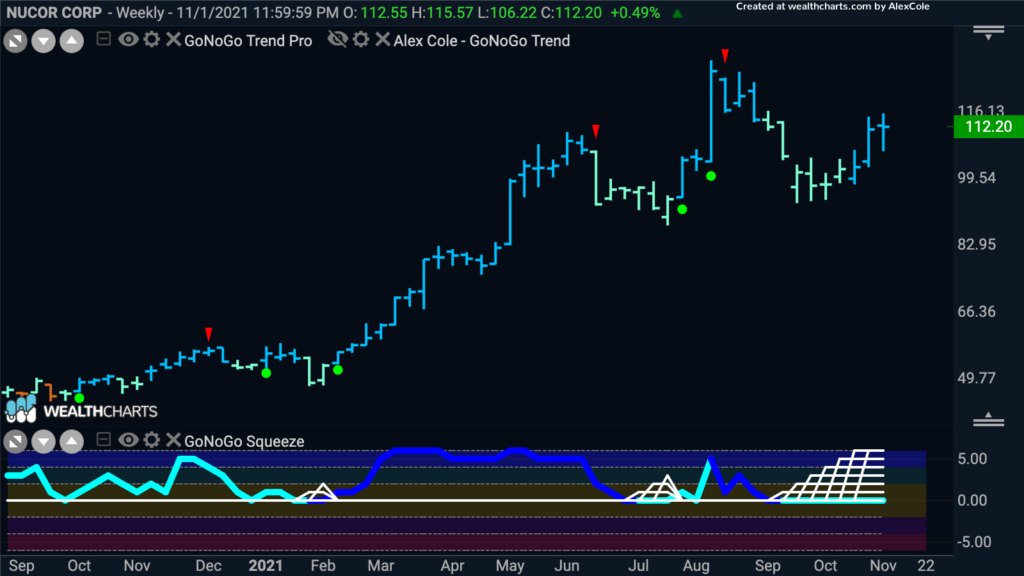
Does the larger timeframe support this analysis? The chart below shows GoNoGo Trend and Oscillator applied to weekly prices. The “Go” trend is in place with a higher low set after correcting from the highs identified by the red counter trend correction arrow. We see that we are in a max GoNoGo Squeeze at the moment, telling us that the blend of momentum inputs in the oscillator are in neutral territory as volatility is reduced. Given the trend is a “Go”, we can look for a break out of the squeeze into positive territory which would tell us momentum has returned in the direction of the trend and allow us to target prior highs.
