
Good morning and welcome to this week’s Flight Path. The trend in equities is now established as we see strong purple “NoGo” bars as price fell to new lower lows. Treasury bond prices painted a complete week of strong purple “NoGo” bars as well. The U.S. commodity index looked strong with uninterrupted bright blue “Go” bars as the dollar likewise held on to strong blue “Go” bars.

$SPY Falls as “NoGo” Shows Strength
The GoNoGo chart below shows the “NoGo” strengthened this week after one amber “Go Fish” bar of uncertainty on Tuesday. With a strong trend in place we turn our eye to the lower panel and can see that GoNoGo Oscillator has been rejected by the zero line on heavy volume. This tells us that momentum is resurgent in the direction of the “NoGo” trend. With the weight of the evidence on the side of further struggles we will watch to see if price falls from here.

On the longer term chart, GoNoGo Trend paints yet another weaker aqua bar! Having fallen from its most recent high we see the indicator painting continued weakness. GoNoGo Oscillator has fallen to test the zero line from above and rests there for a bar on heavy volume. For the long term health of this “Go” trend it will be important to watch whether the oscillator can rally back into positive territory from this point. 
Treasury Rates Rush to New Highs
GoNoGo Trend shows that rates thrived this week. After last weeks momentary weakness reflected by weaker aqua bars we have seen nothing but strength as rates have rallied past prior highs and are now higher still. GoNoGo Oscillator is in overbought territory but staying there. We will watch to see if momentum wanes this week.

The Dollar Sees More Strength at new Highs
GoNoGo Trend faltered mid week but bounced back strongly to hit another higher high on strong blue “Go” bars. GoNoGo Oscillator was falling quickly toward the zero line reversed course and is now in positive territory at a value of 3, not yet overbought. The trend remains looking strong for the greenback.

$USO Testing Second Layer of Resistance
Last week we saw how oil prices were in a strong “Go” trend and running up against horizontal resistance, seen here as the lower horizontal line. The last day of the week saw price jump higher only to run into new resistance from July highs. We will watch this week to see if this level remains too much and whether price remains stuck in the channel. GoNoGo Oscillator shows that momentum is overbought and volume is heavy.

Are the Bulls Back For New Gold Rush?
GoNoGo Trend shows that the “NoGo” trend gave way this week to aqua “Go” bars. this is after price struggled to make either higher highs or lower lows for several months. Now, with a change in trend, we will look to see if price can move to new highs. GoNoGo Oscillator shows that after struggling with the zero line as resistance for weeks it was able to break into positive territory. We see volume picking up as well as momentum confirms the new trend.

Sector RelMap
Below is the GoNoGo Sector RelMap. This GoNoGo RelMap applies the GoNoGo Trend to the relative strength ratios of the sectors to the base index. With this view we can get a sense of the relative out performance and relative underperformance of the sectors. 2 sectors are in relative “Go” trends. $XLY, and $XLC, are painting relative “Go” bars.

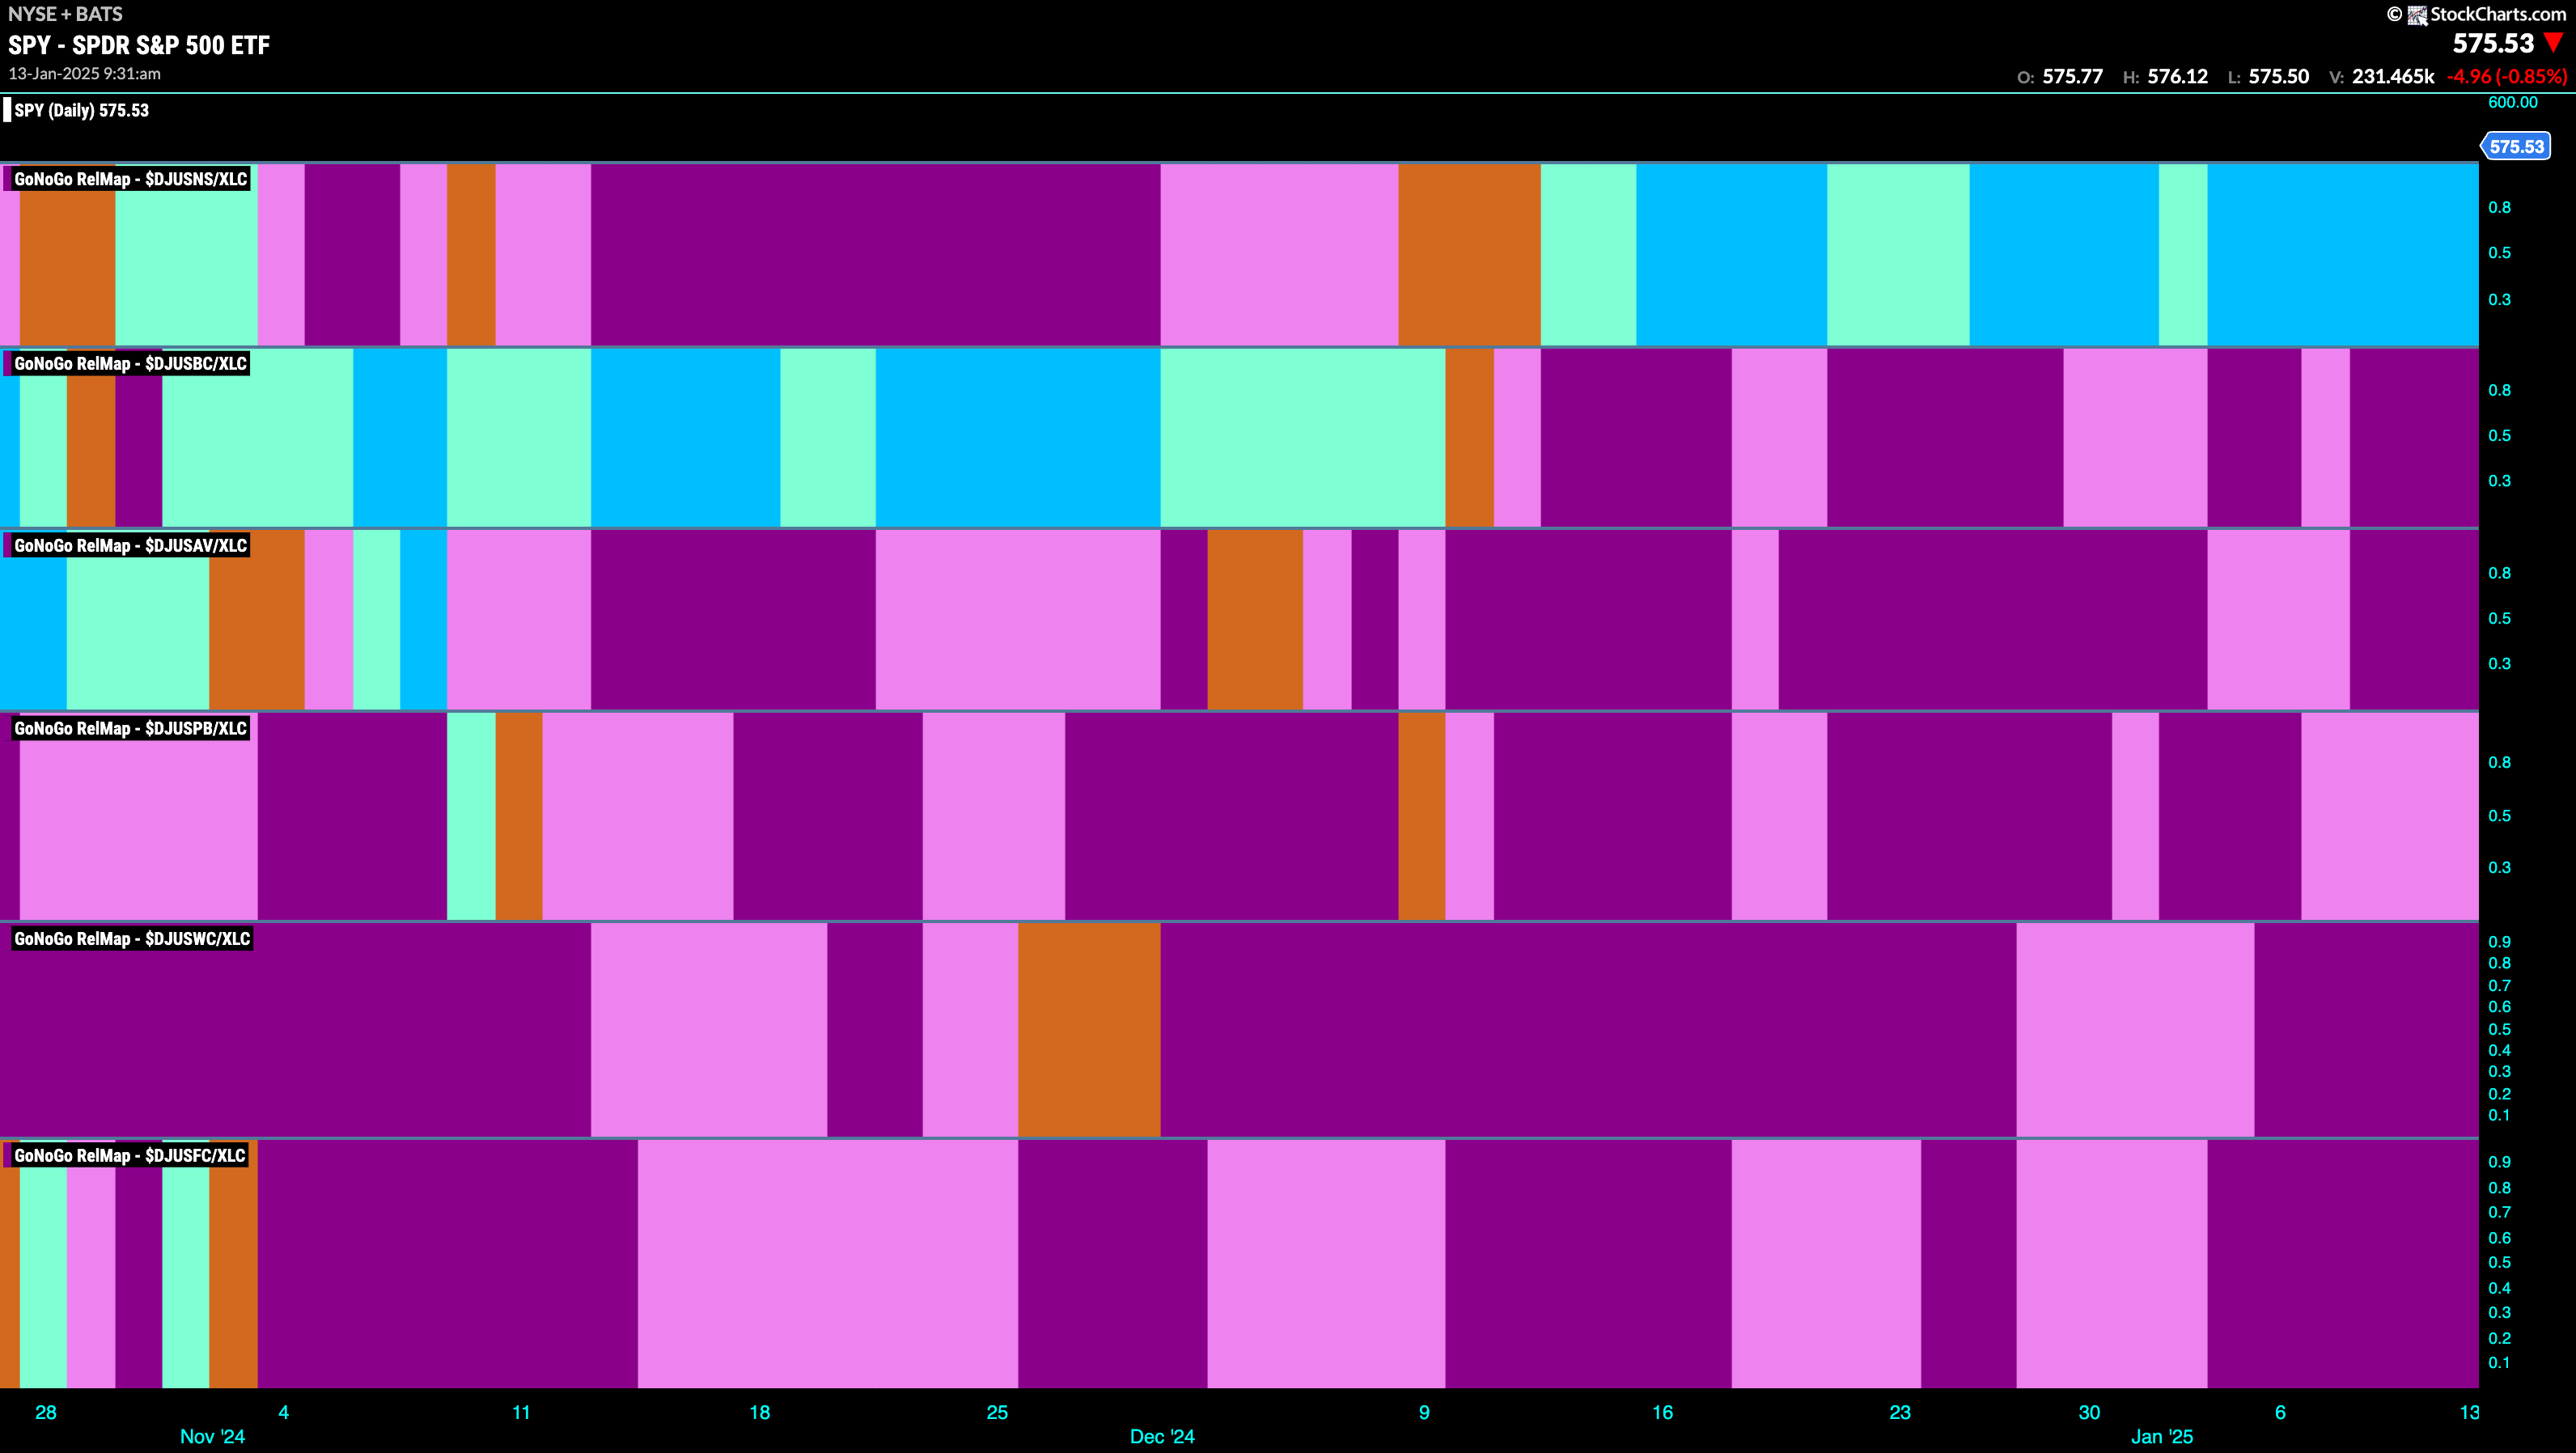
Communications Sub-Group RelMap
The chart below shows a relative trend breakdown of the sub groups within the communications sector again this week. The Sub-Group RelMap plots the GoNoGo Trend of each sub index to the $XLC. We saw in the above GoNoGo Sector RelMap that $XLC is strong relatively speaking as it paints blue relative “Go” bars to the S&P 500. If we look at the breakdown of the groups in the map below we can see where that outperformance is coming from. Painting strong “Go” bars in the top panel is the internet index sub group.

$GOOGL Tries to Find Support for New High
The chart below shows that $GOOGL has been in a trend since October and we see that price progressed nicely into the last higher high. Since then, price has moved mostly sideways and we see a majority of weaker aqua bars. GoNoGo Oscillator has fallen to the zero line several times where it has so far found support. It will be important to see whether the oscillator can rally back into positive territory again or if it does not, that could represent a bigger threat to the “Go” trend.

$NFLX Enters New “NoGo” Trend
Is this a sign of things to come for the larger internet sub group? Netflix has finally fallen out of its “Go” trend after weeks of struggles. After the last higher high, we saw Go Countertrend Correction Icons (red arrows) suggesting that price may struggle to go higher in the short term. Indeed, GoNoGo Trend painted a majority of weaker aqua bars as price fell from that high. GoNoGo Oscillator fell to test the zero line and eventually broke down into negative territory giving us early warning of possible trend change. Now with volume increasing and momentum entering oversold levels, GoNoGo Trend is painting a first “NoGo” bar. We will watch to see if price falls further from here.


