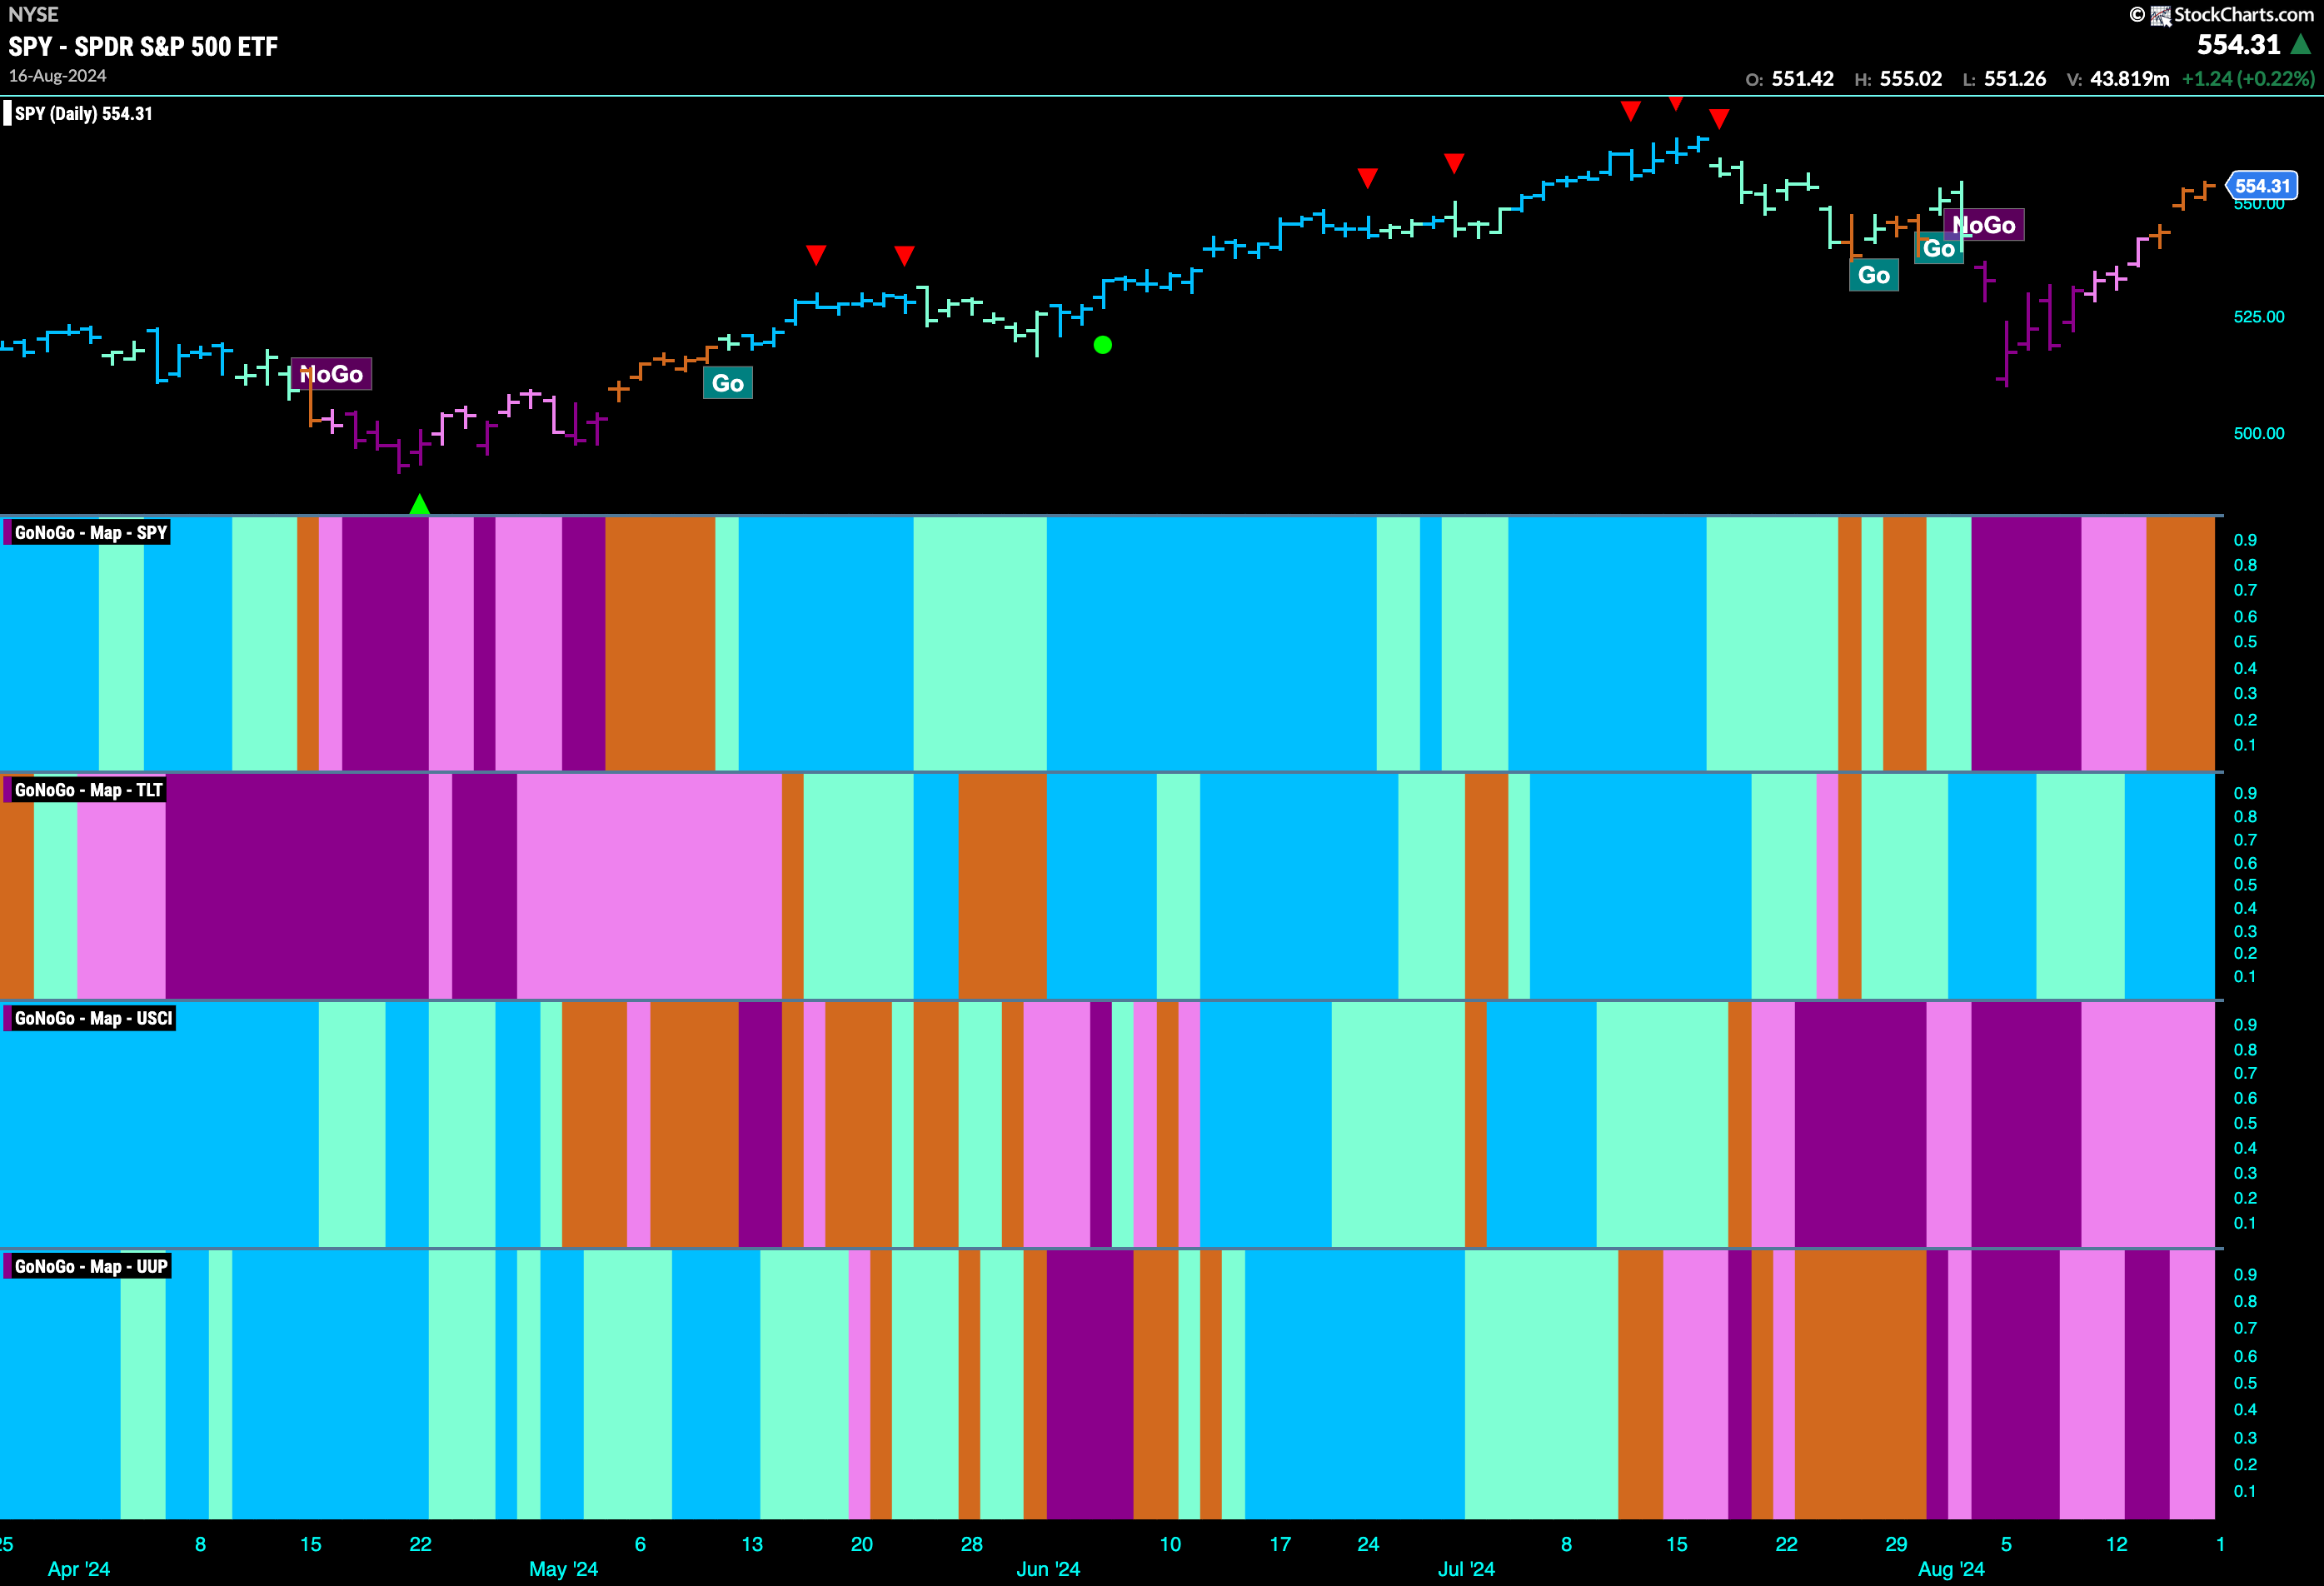
Good morning and welcome to this week’s Flight Path. Equities continue their path out of the “NoGo” correction. This week we saw amber “Go Fish” bars over the second half of the week. GoNoGo Trend shows that the trend in treasury bond prices saw strength with strong blue bars. U.S. Commodities index remained in the “NoGo” trend but continue to show weakness. The dollar as well, saw weak pink “NoGo” bars at the end of the week.
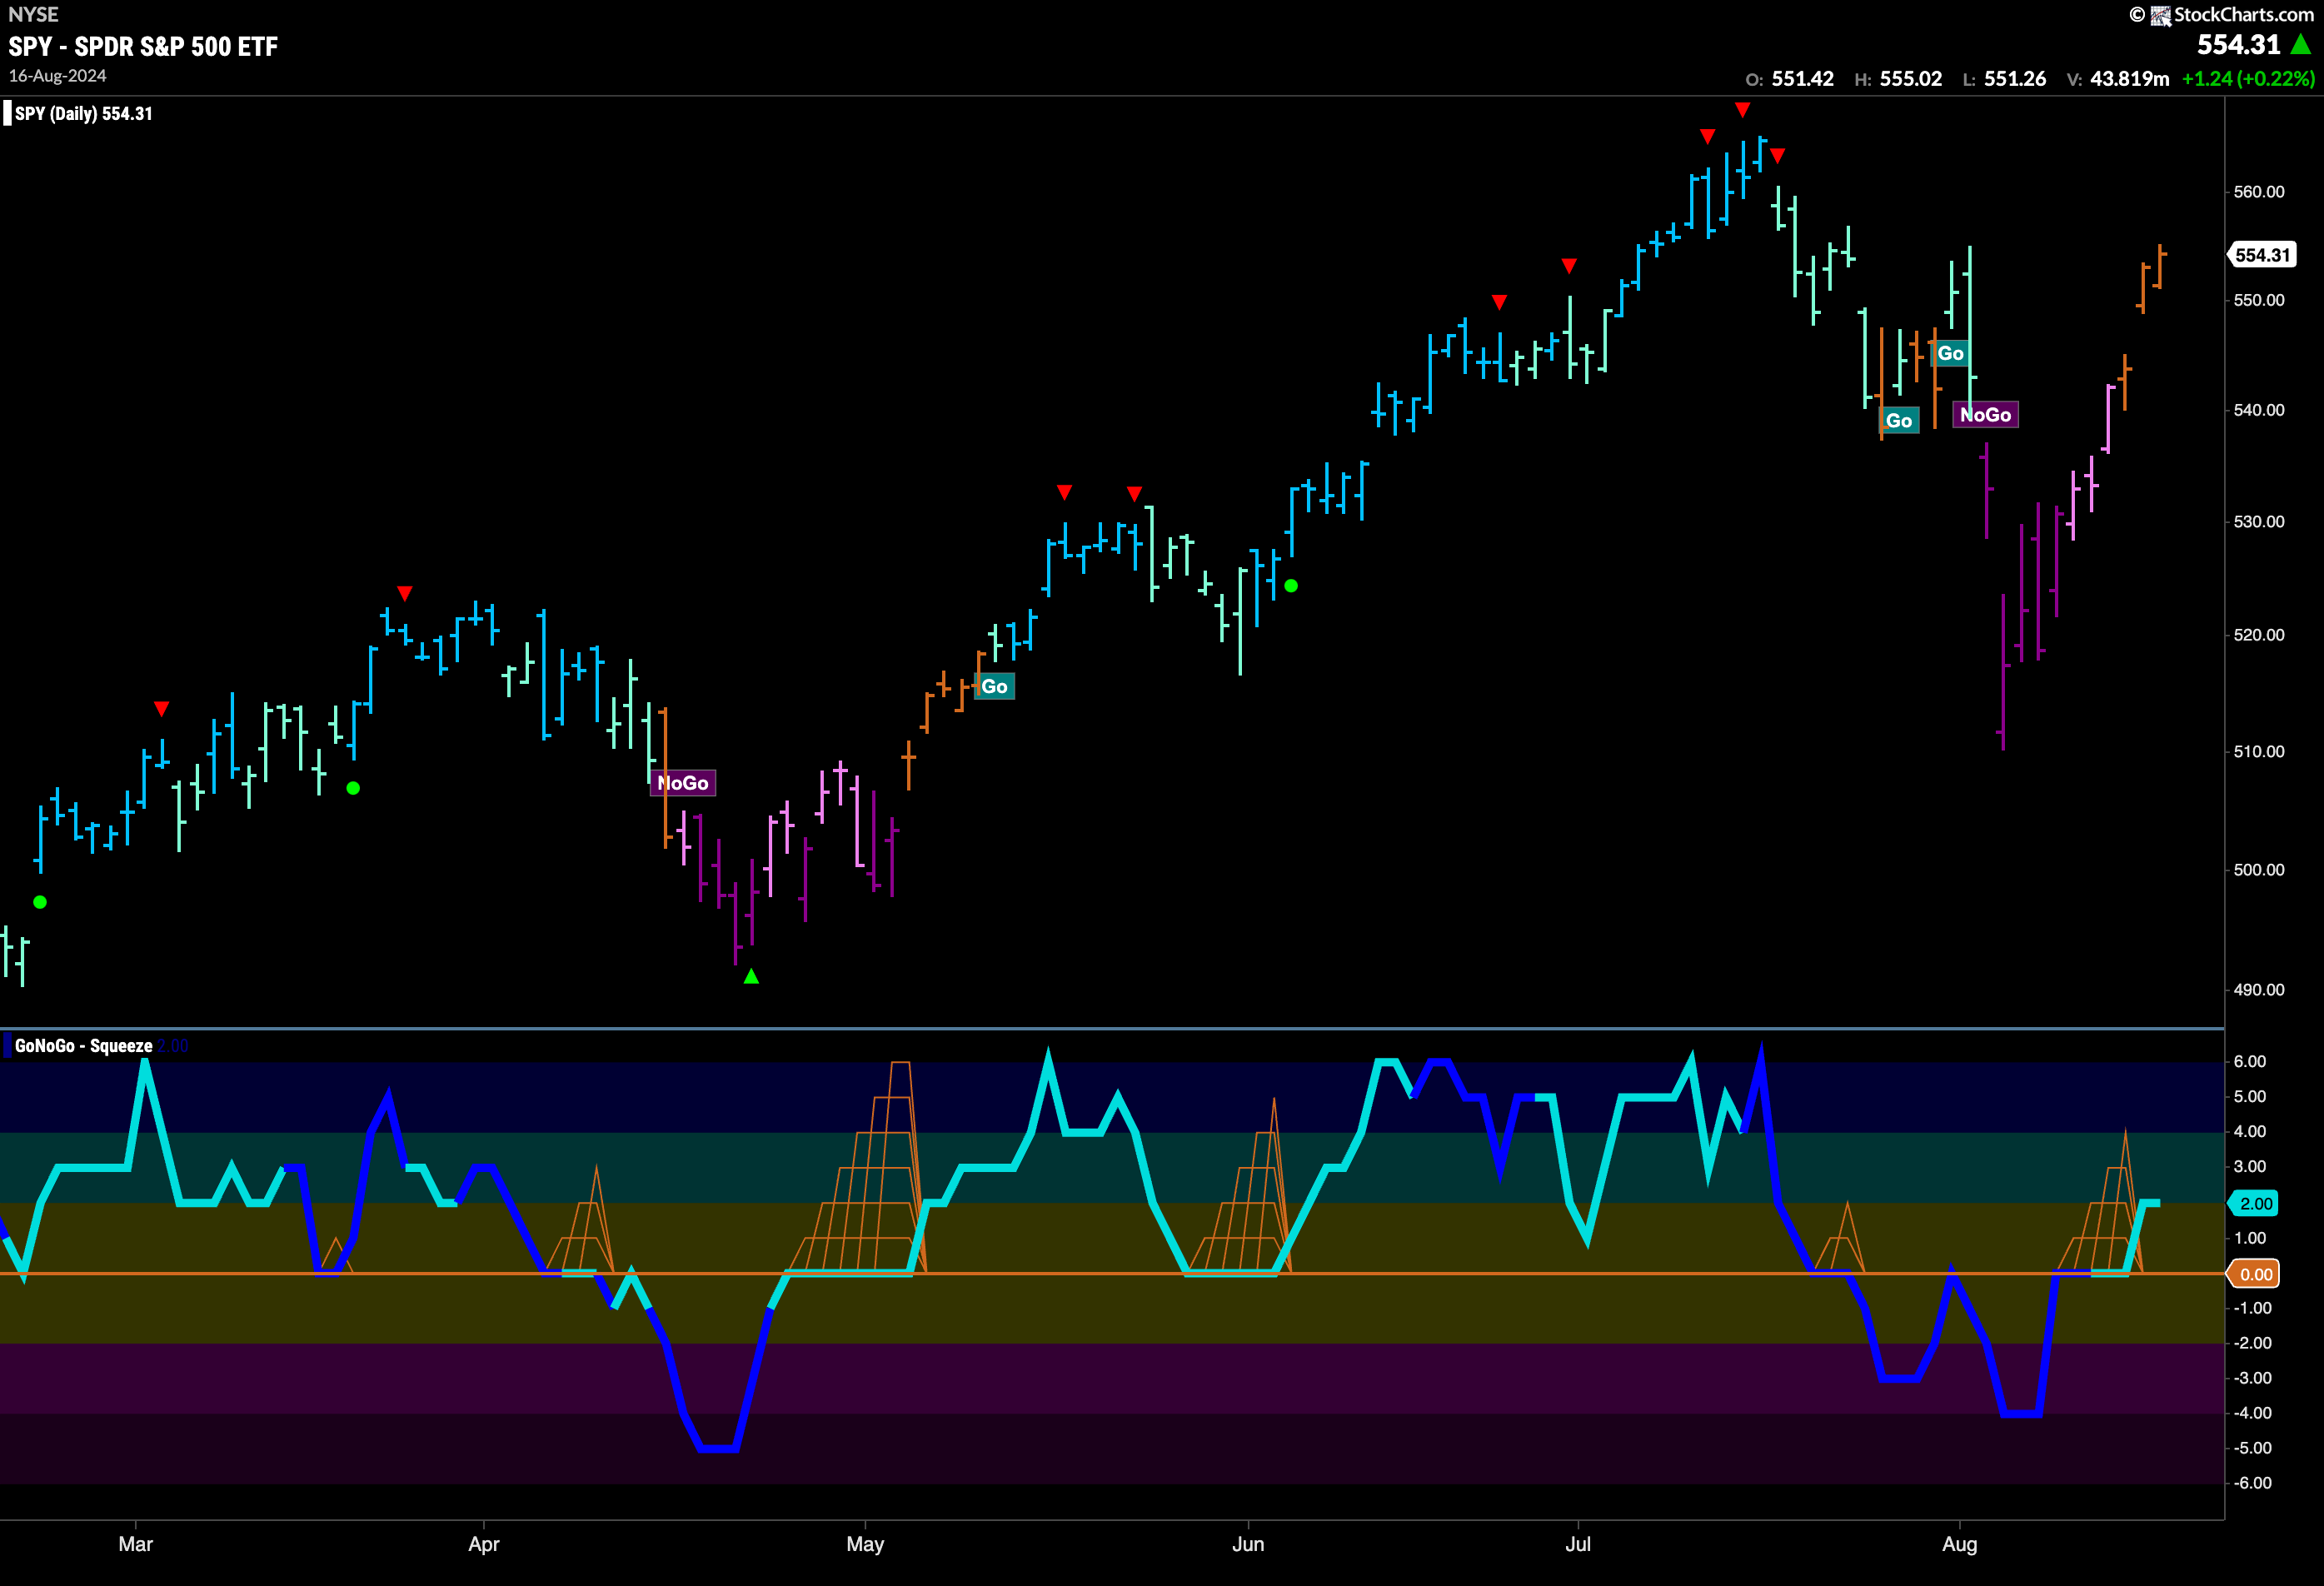
$SPY Rallies and Indicator Paints “Go Fish” Bars
On Thursday, price gapped higher and GoNoGo Trend painted more “Go Fish” bars as the week came to a close. There was much enthusiasm this week and we are fast approaching an interim high. GoNoGo Oscillator has broken away from the zero line and out of a small GoNoGo Squeeze into positive territory. With positive momentum, we will watch to see if this gives price the push it needs to enter a new “Go” trend.
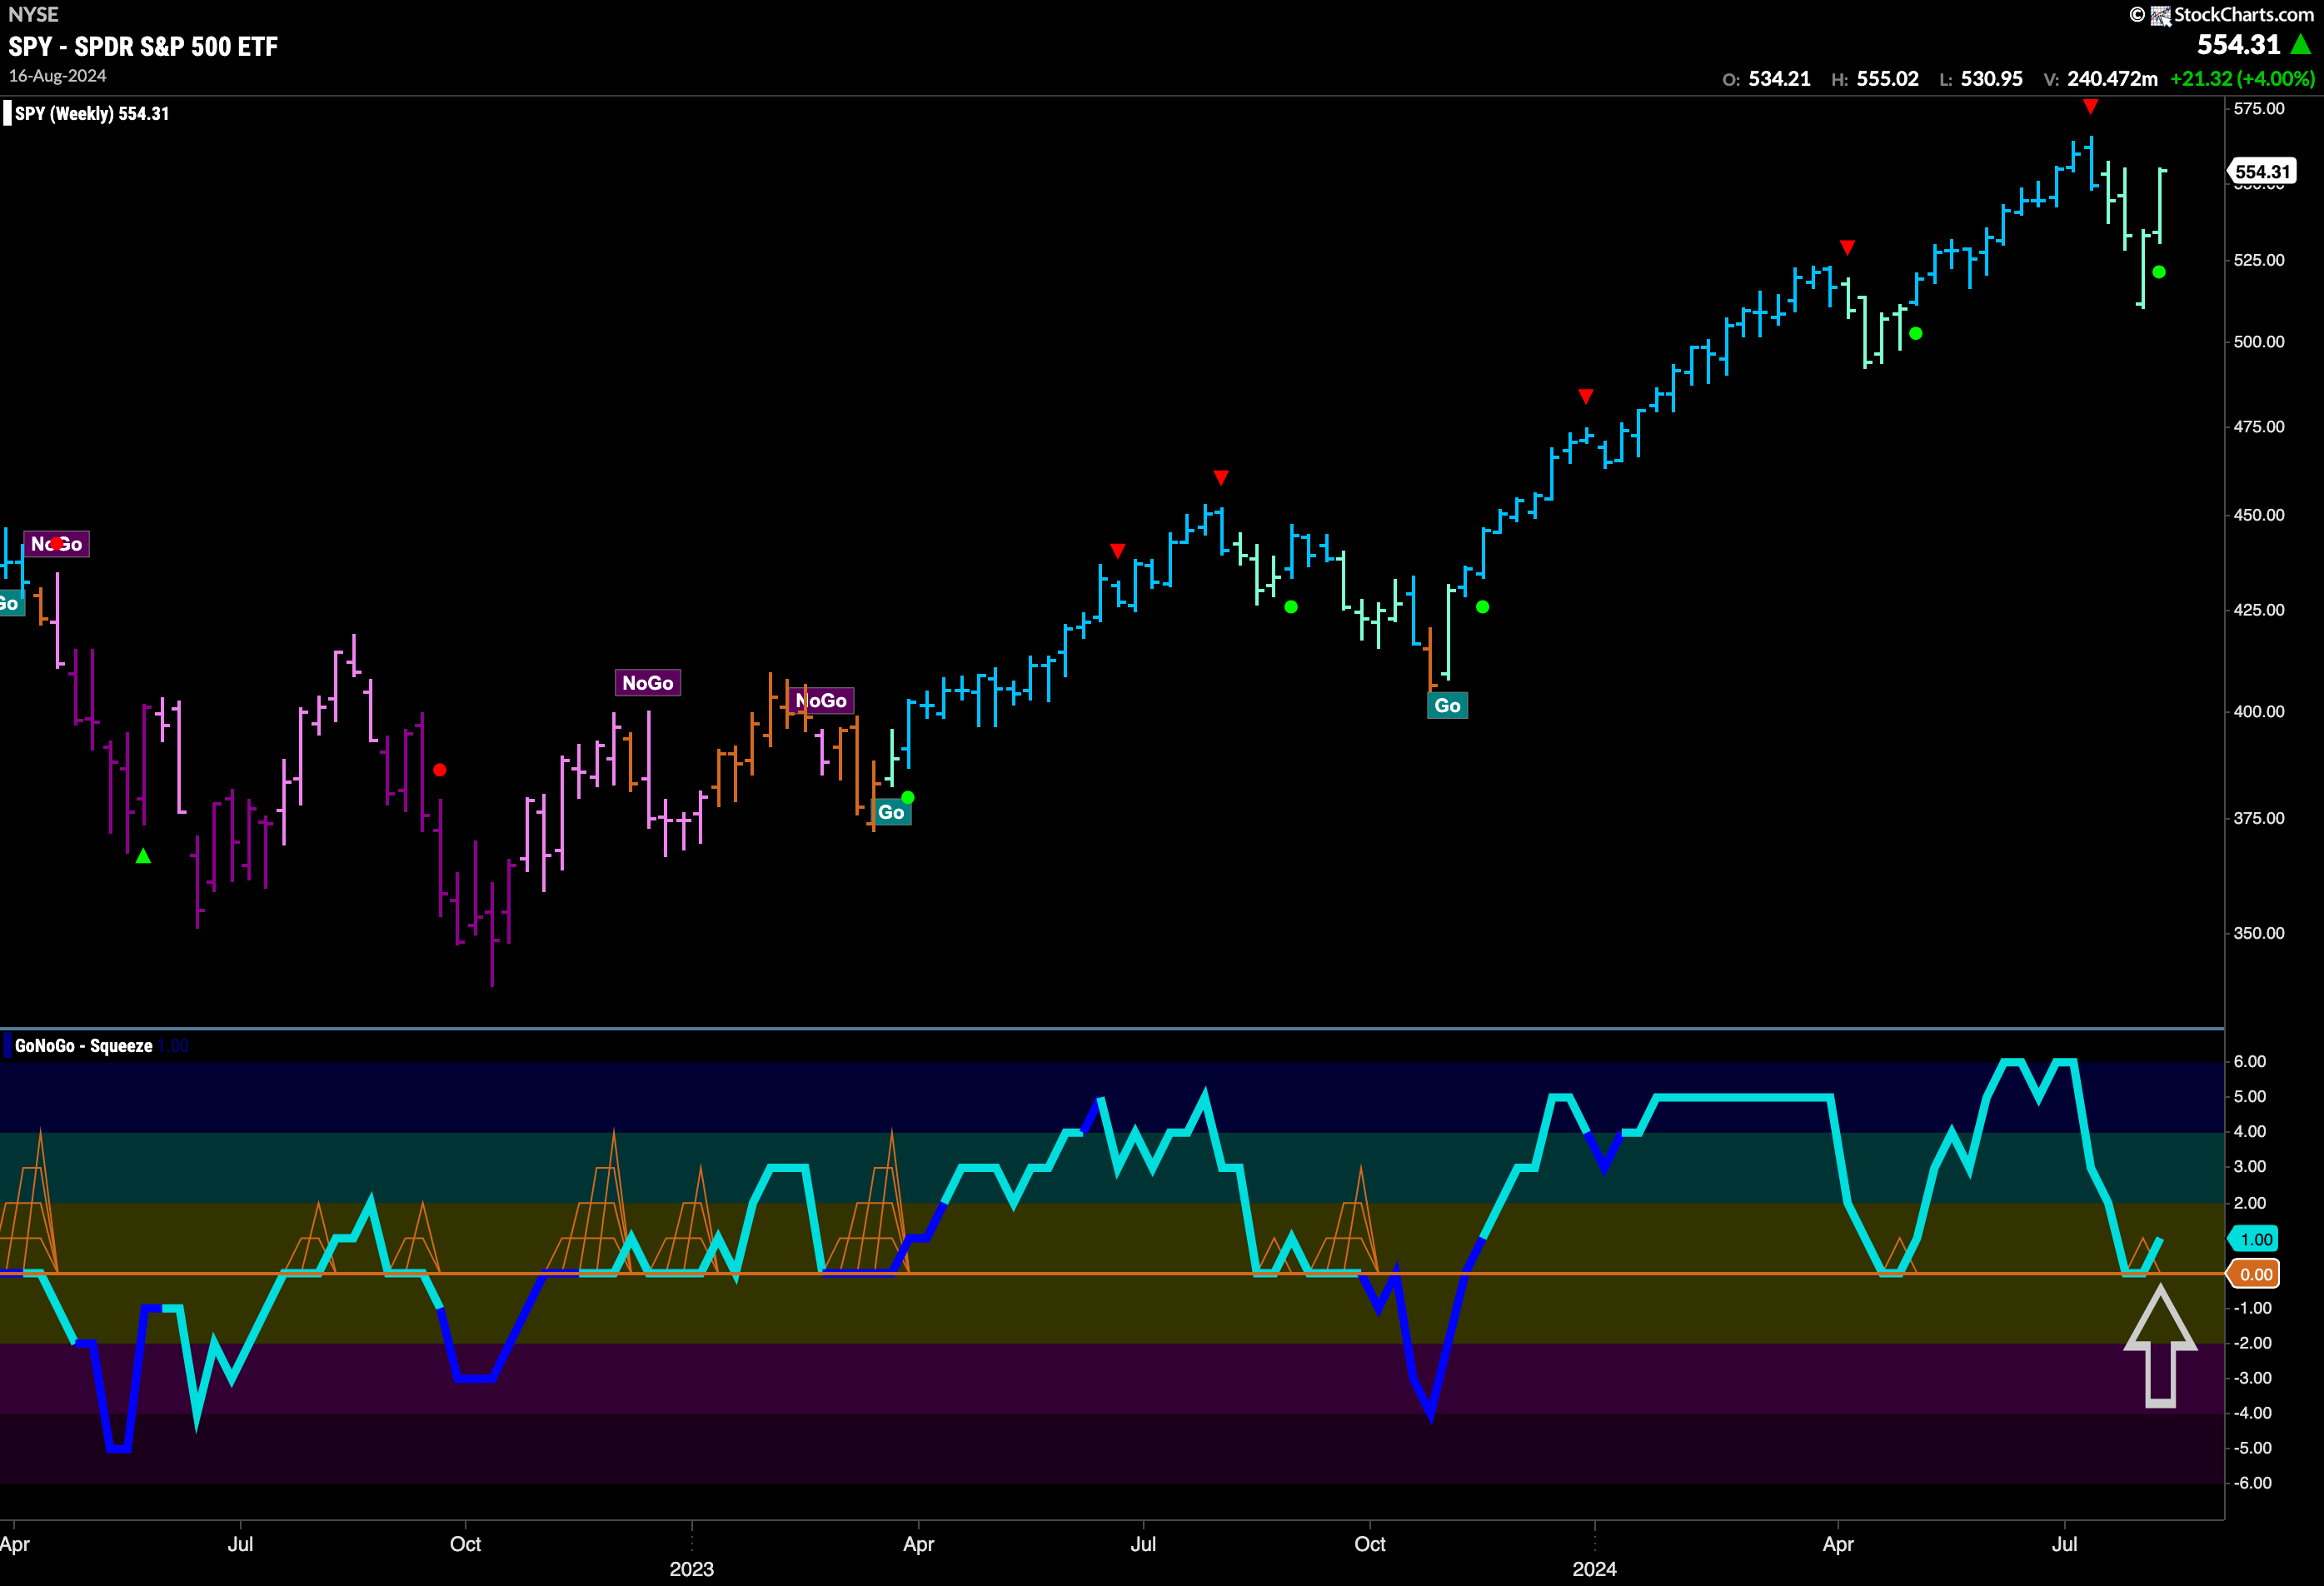
The longer time frame chart tells us that the “Go” trend is still safe for now. The week’s strong rally pushed price higher and away from last week’s lows. We look at the oscillator panel and see that GoNoGo Oscillator tested the zero level for only a bar or two, and was quickly able to find support and bounce back into positive territory. Now we can say that momentum is resurgent in the direction of the underlying “Go” trend and we will look to see if price can climb further from here.
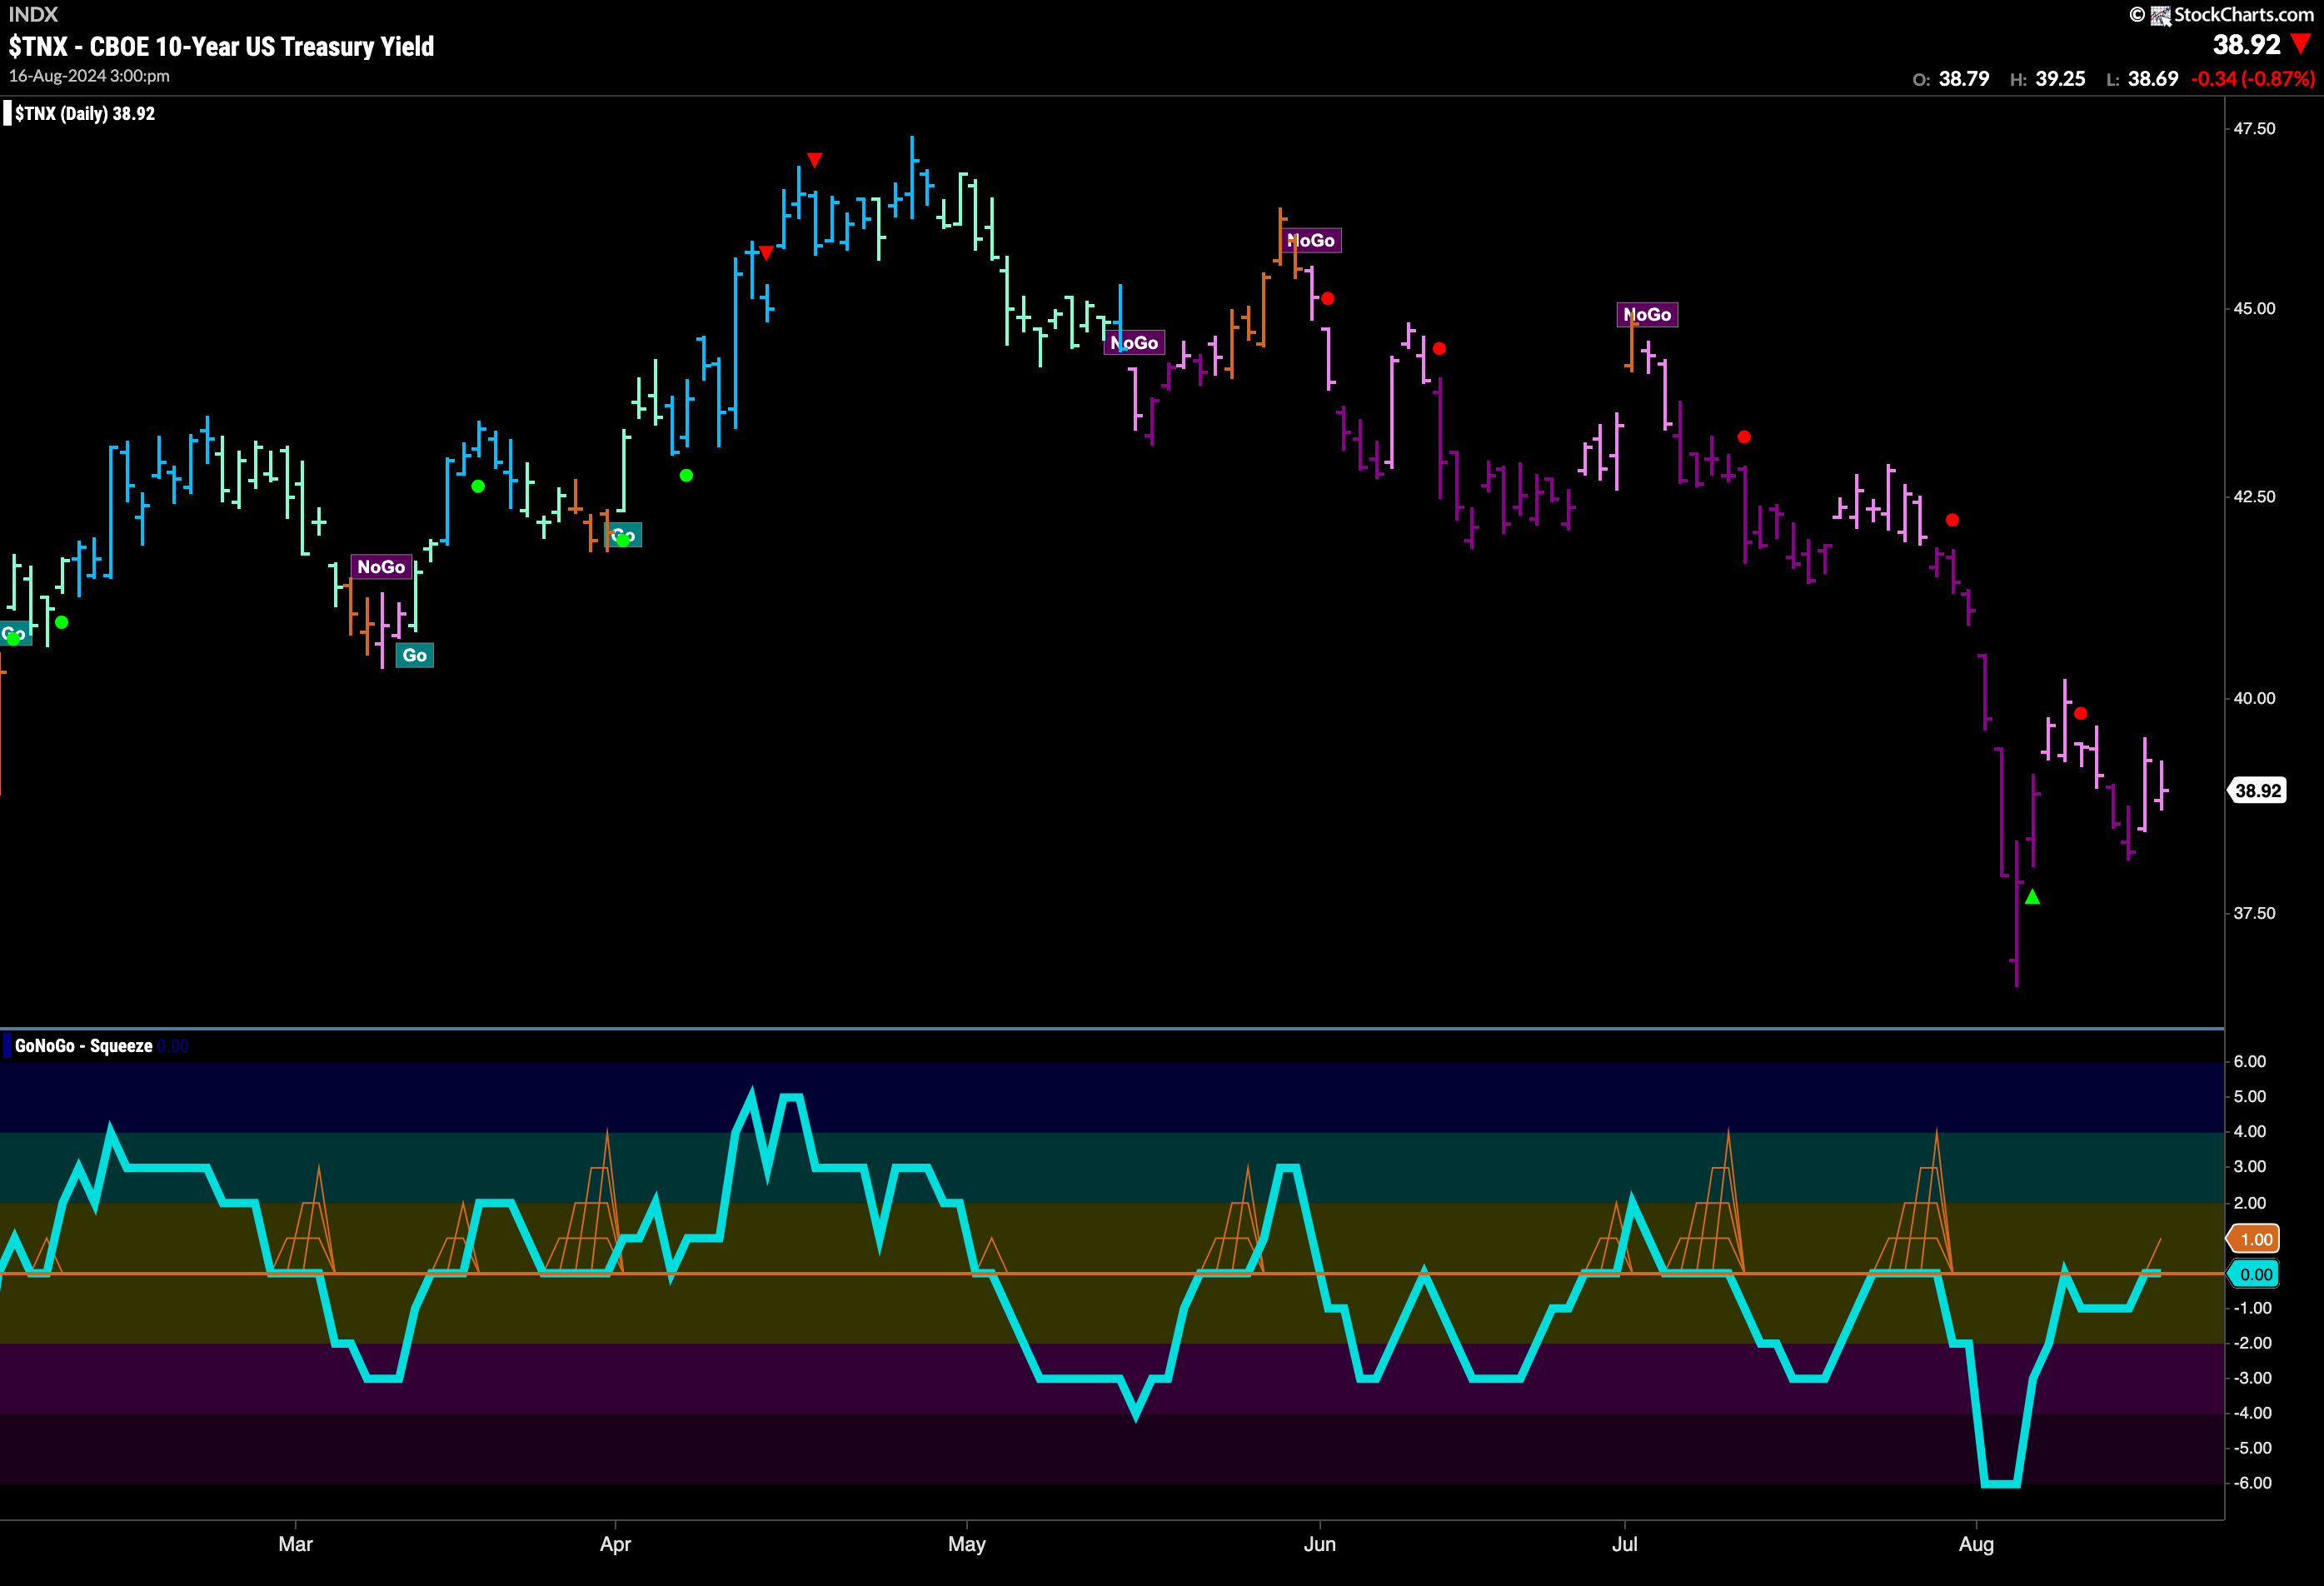
Treasury Remain Suppressed
While there was no new lower low this week, the “NoGo” trend remained in place. We can see that price is painting pink “NoGo” bars, higher than the recent low and lower than the recent high. If we look at the oscillator panel, we can see that GoNoGo Oscillator is testing the zero line from below again. We will watch to see if it finds resistance at this level as it has now for several weeks.
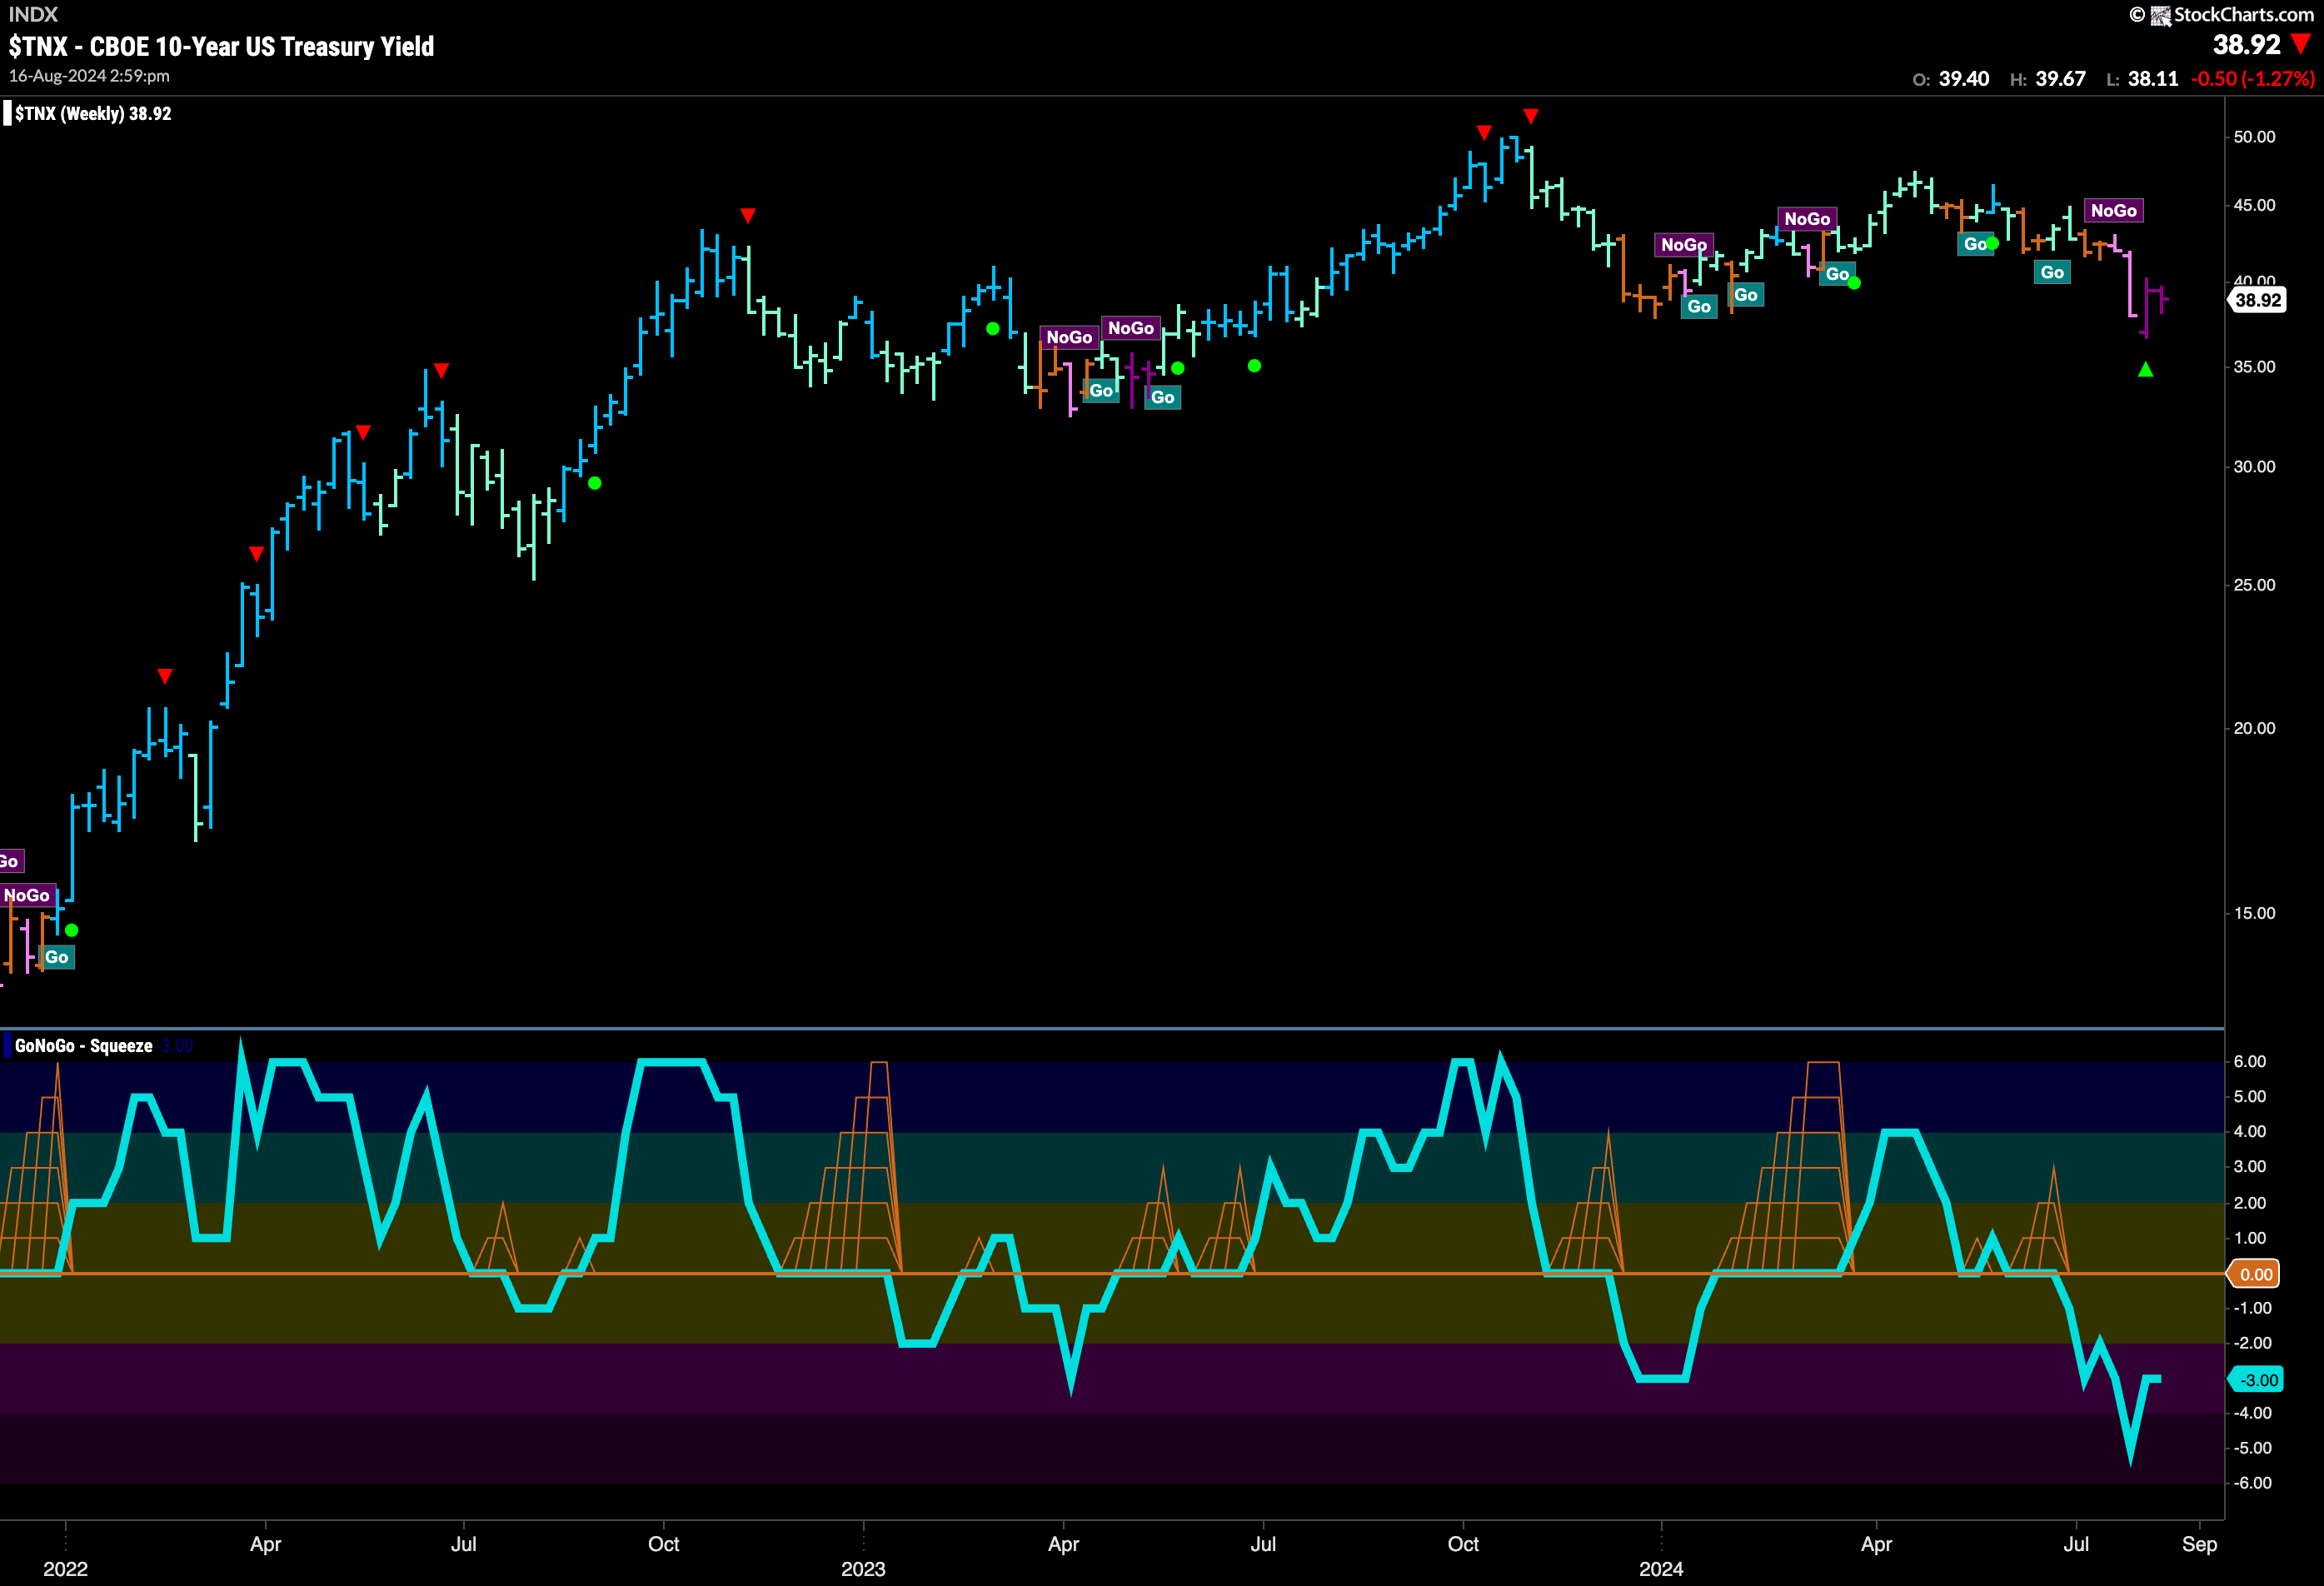
The weekly chart below shows us that the trend remains strongly “NoGo”. This is the second strong purple bar in a row and we can say that there is downside pressure on prices with the weight of the evidence approach. GoNoGo Oscillator is in negative territory but no longer oversold at a value of -3.
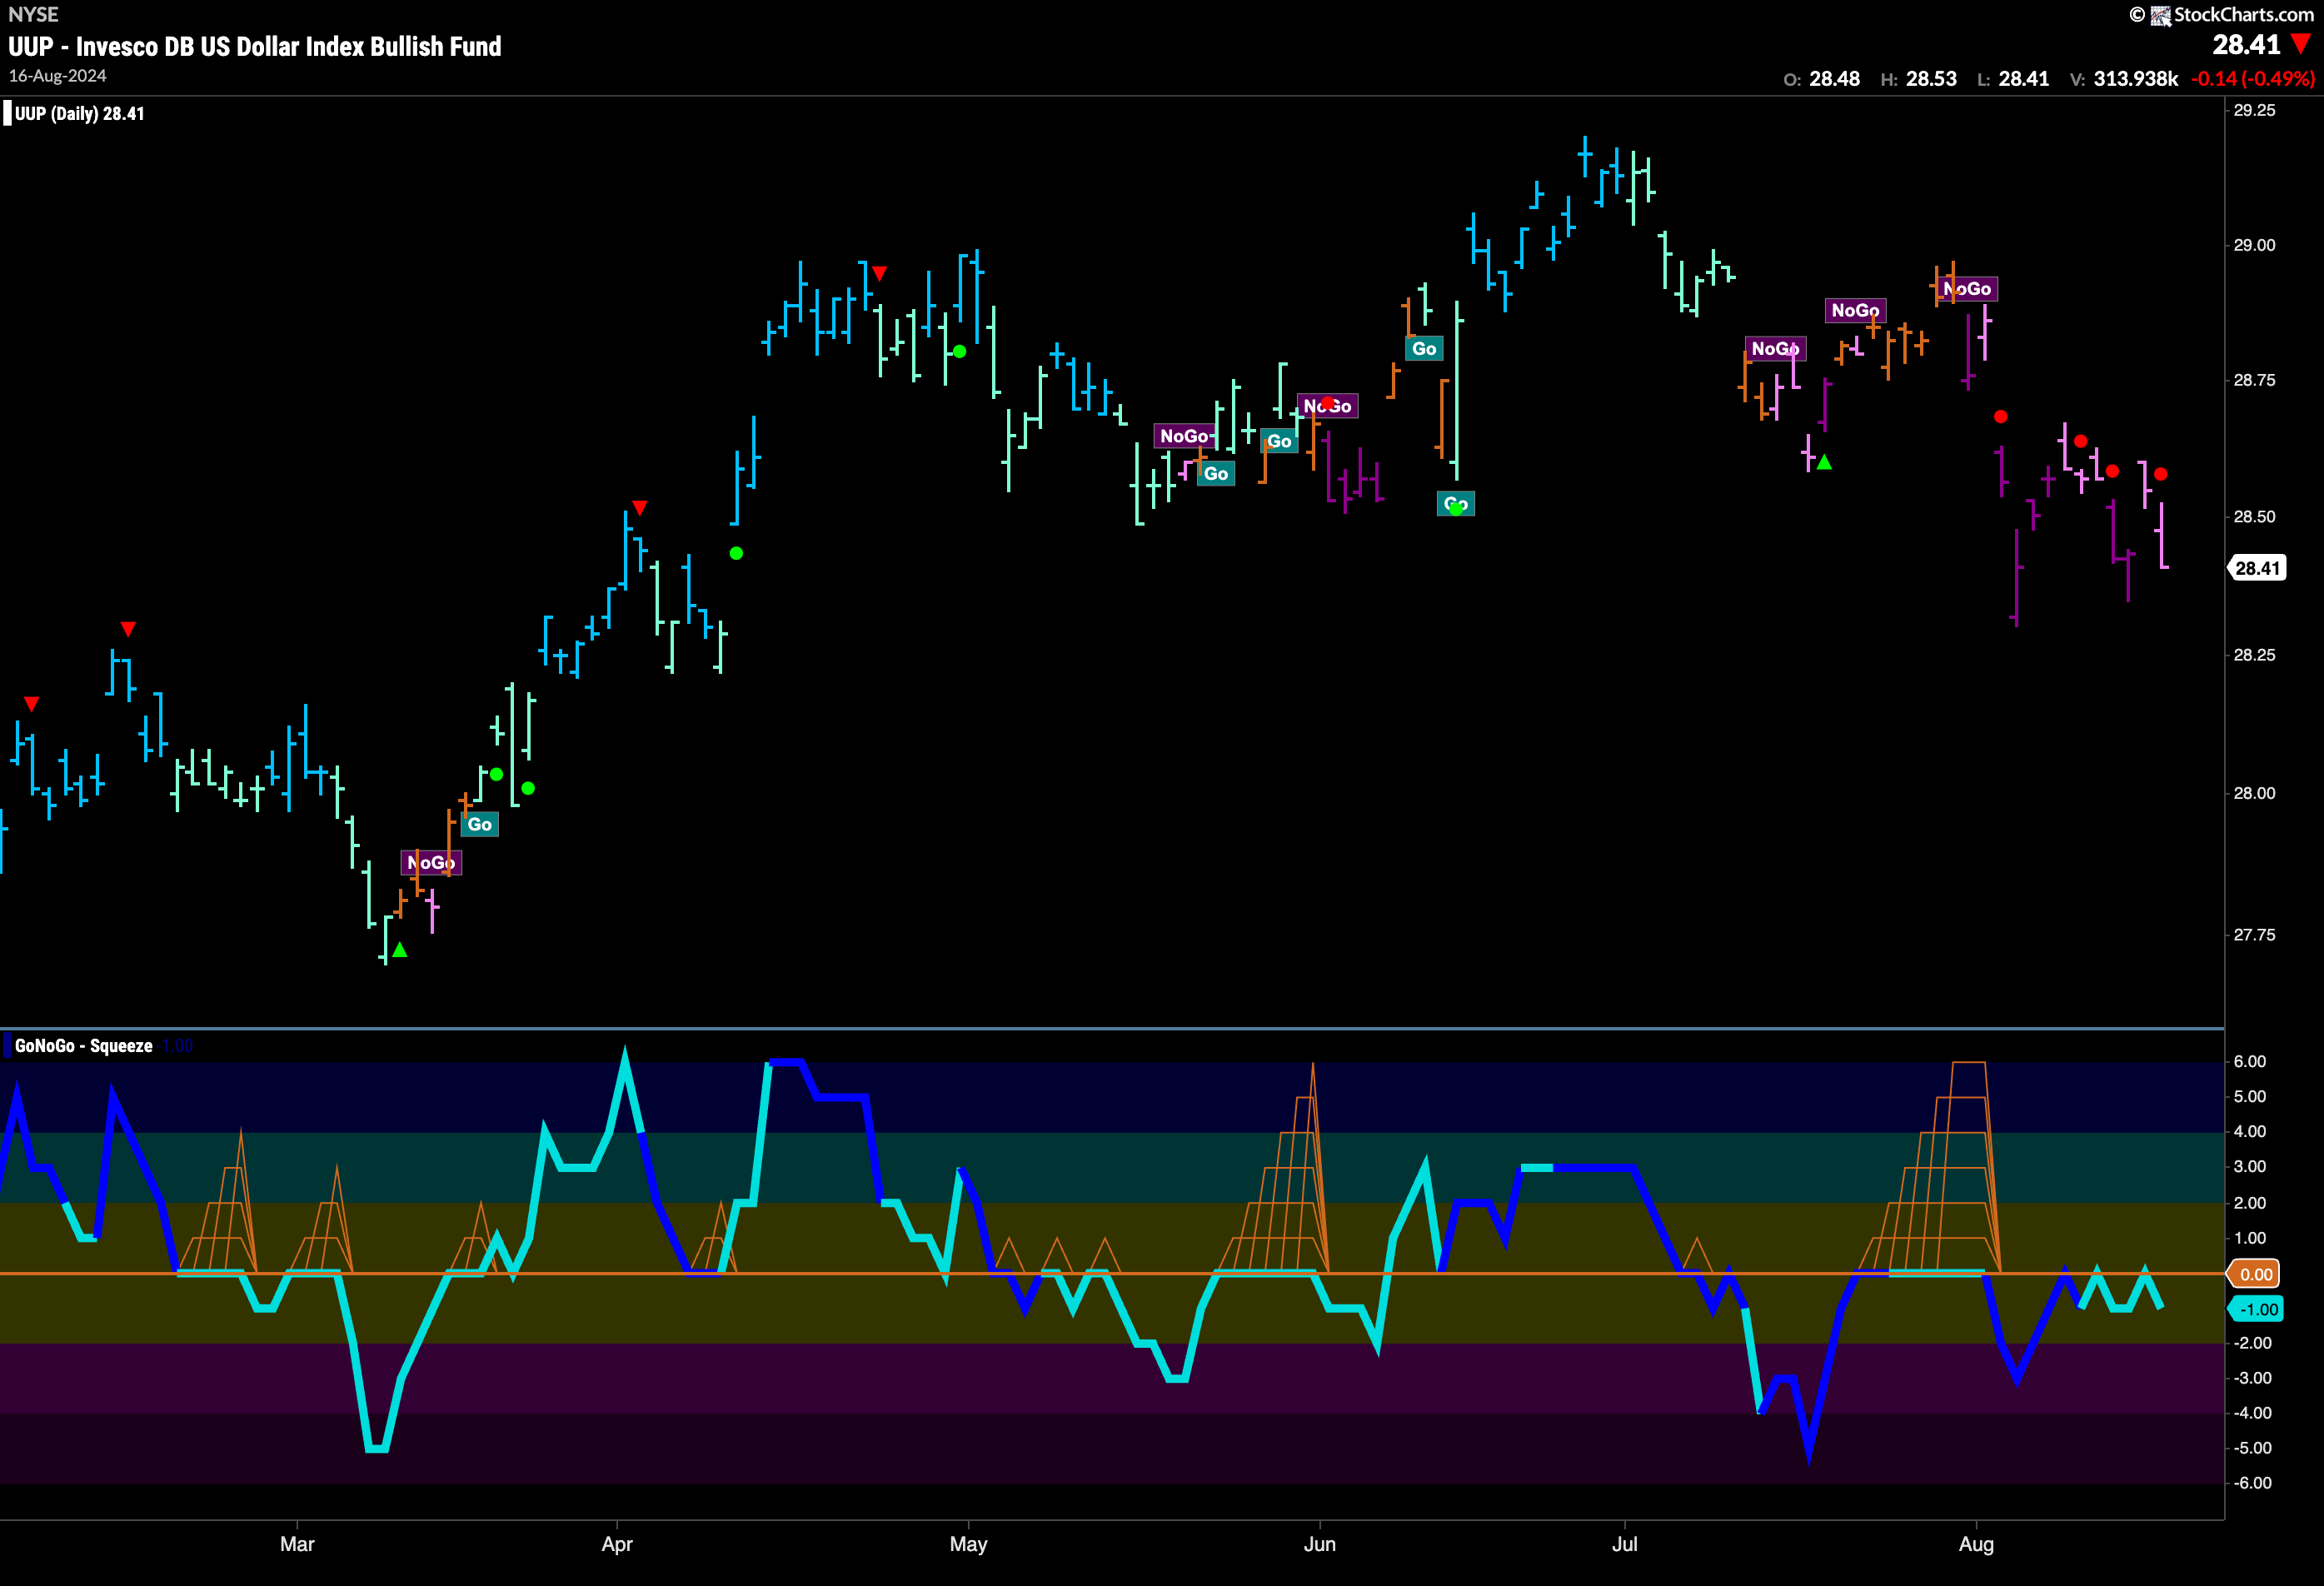
The Dollar’s “NoGo” Weakens but Remains
It was an up and down week for the dollar. It fell early in the week then gapped higher before falling again on Friday. We saw GoNoGo Trend move between pink and purple “NoGo” bars. When price gapped higher it was not able to set a new high and as prices fell again on Friday we saw a NoGo Trend Continuation Icon (red circle). GoNoGo Oscillator has been rejected again by the zero line and so we know that momentum is in the direction of the “NoGo” trend.
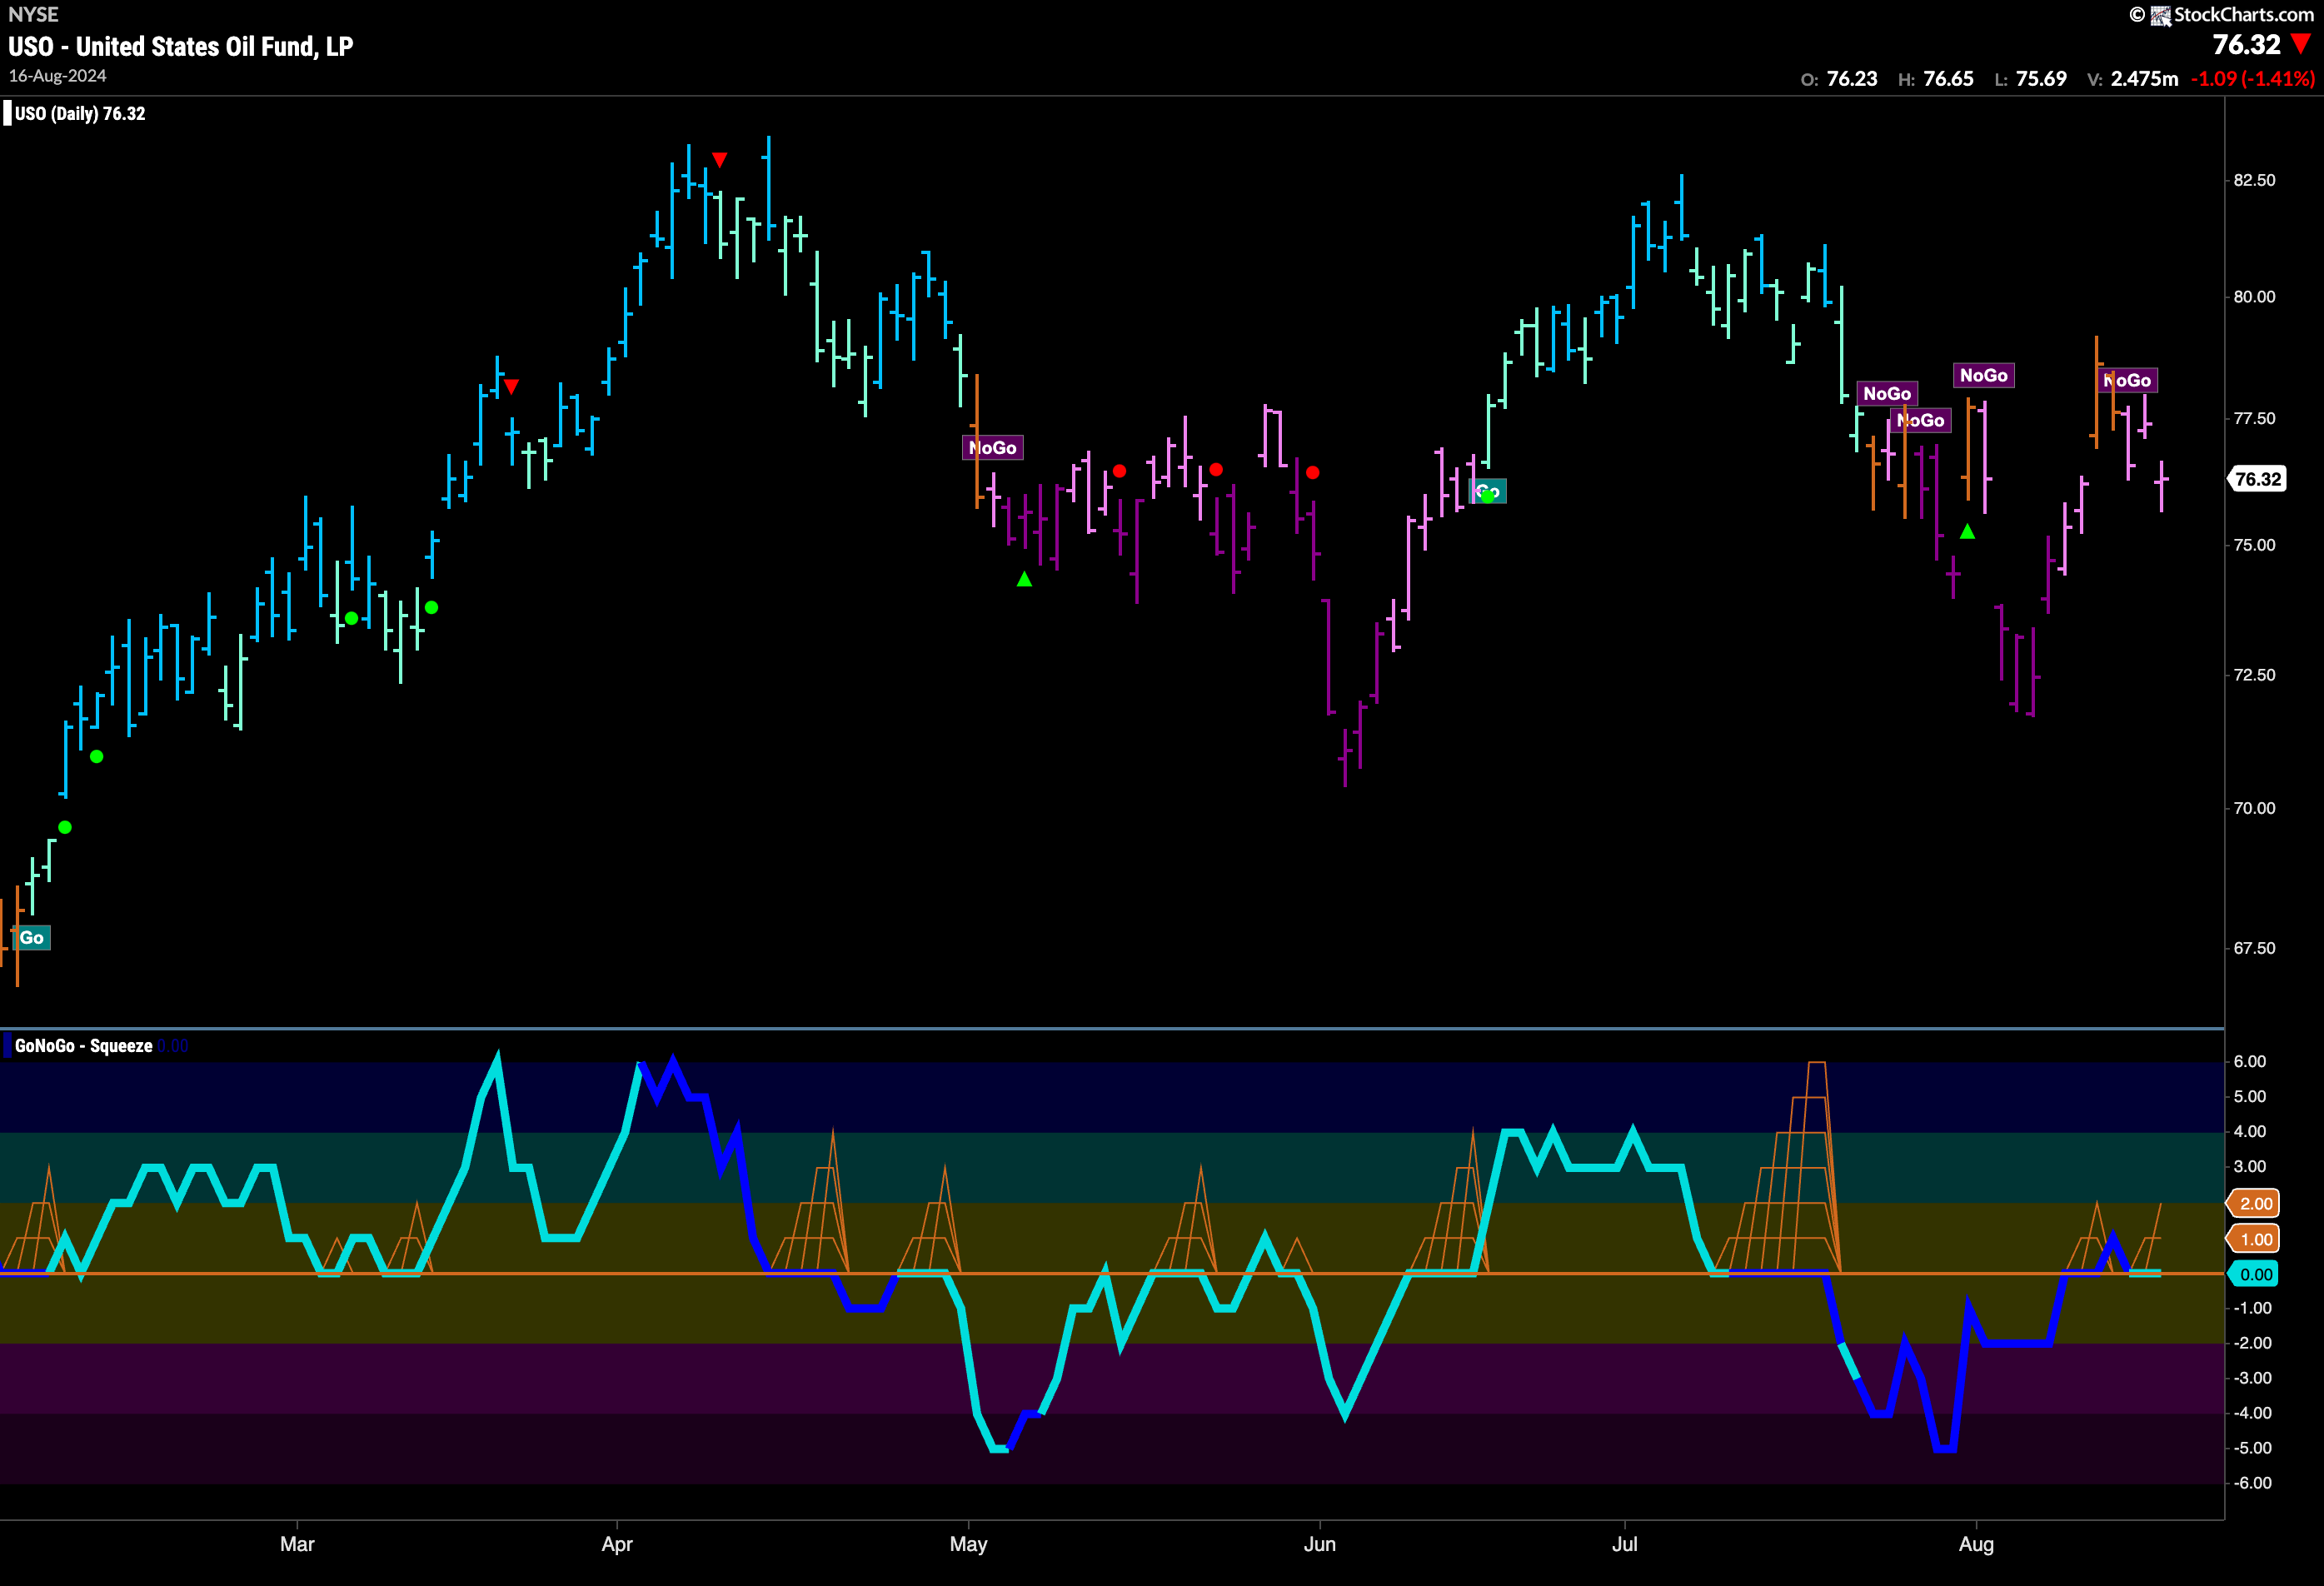
USO Flirts with Trend Change
Price started teh week higher and we saw a couple of amber “Go Fish” bars as the market expressed uncertainty. Wednesday saw the “NoGo” return and it stayed for the rest of the week painting pink bars. GoNoGo Oscillator was able to briefly poke through into positive territory but immediately returned to the zero level and so it will be important to note in which direction it heads next.
Gold Makes a Break Higher
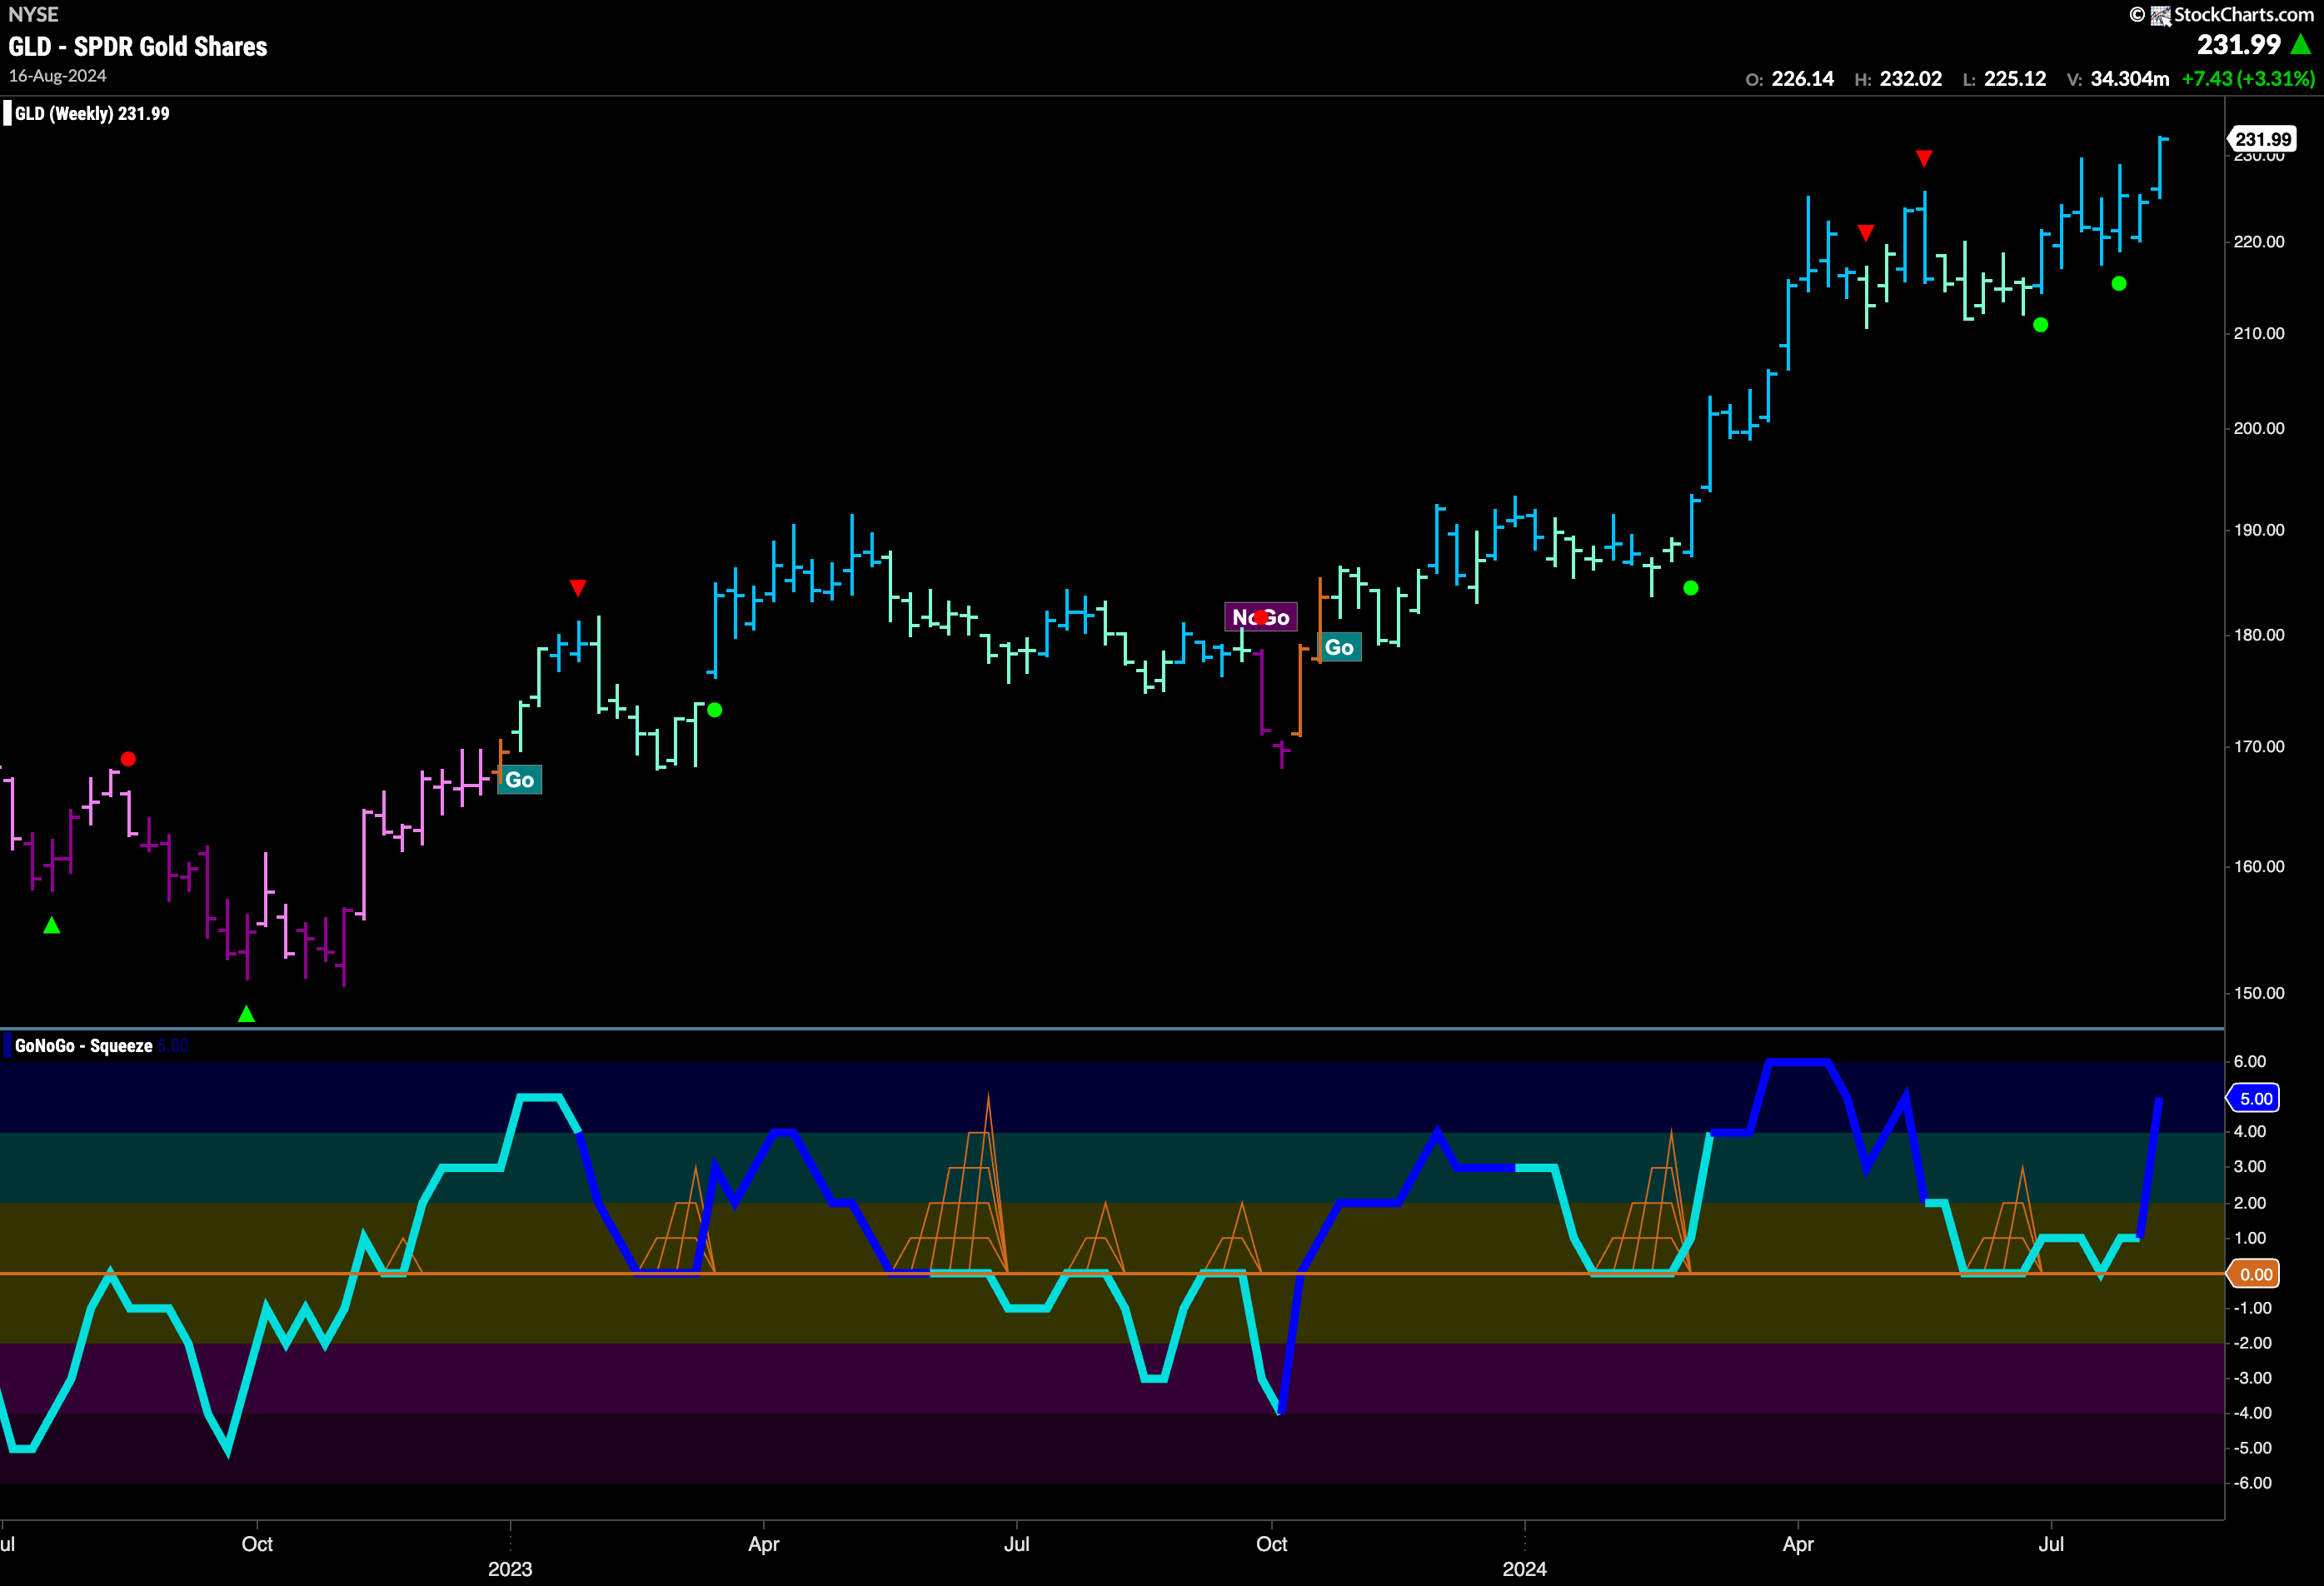
The weekly chart of Gold shows us that this week it made the move higher that we have been looking for now for several weeks. After threatening new highs for several weeks on strong blue “Go” bars we saw price close at new highs this week. This comes after GoNoGo Oscillator was able to find support multiple times at the zero level and that triggered the Go Trend Continuation Icons you see on the chart. Also interesting to note the surge in volume with this latest move.
Sector RelMap
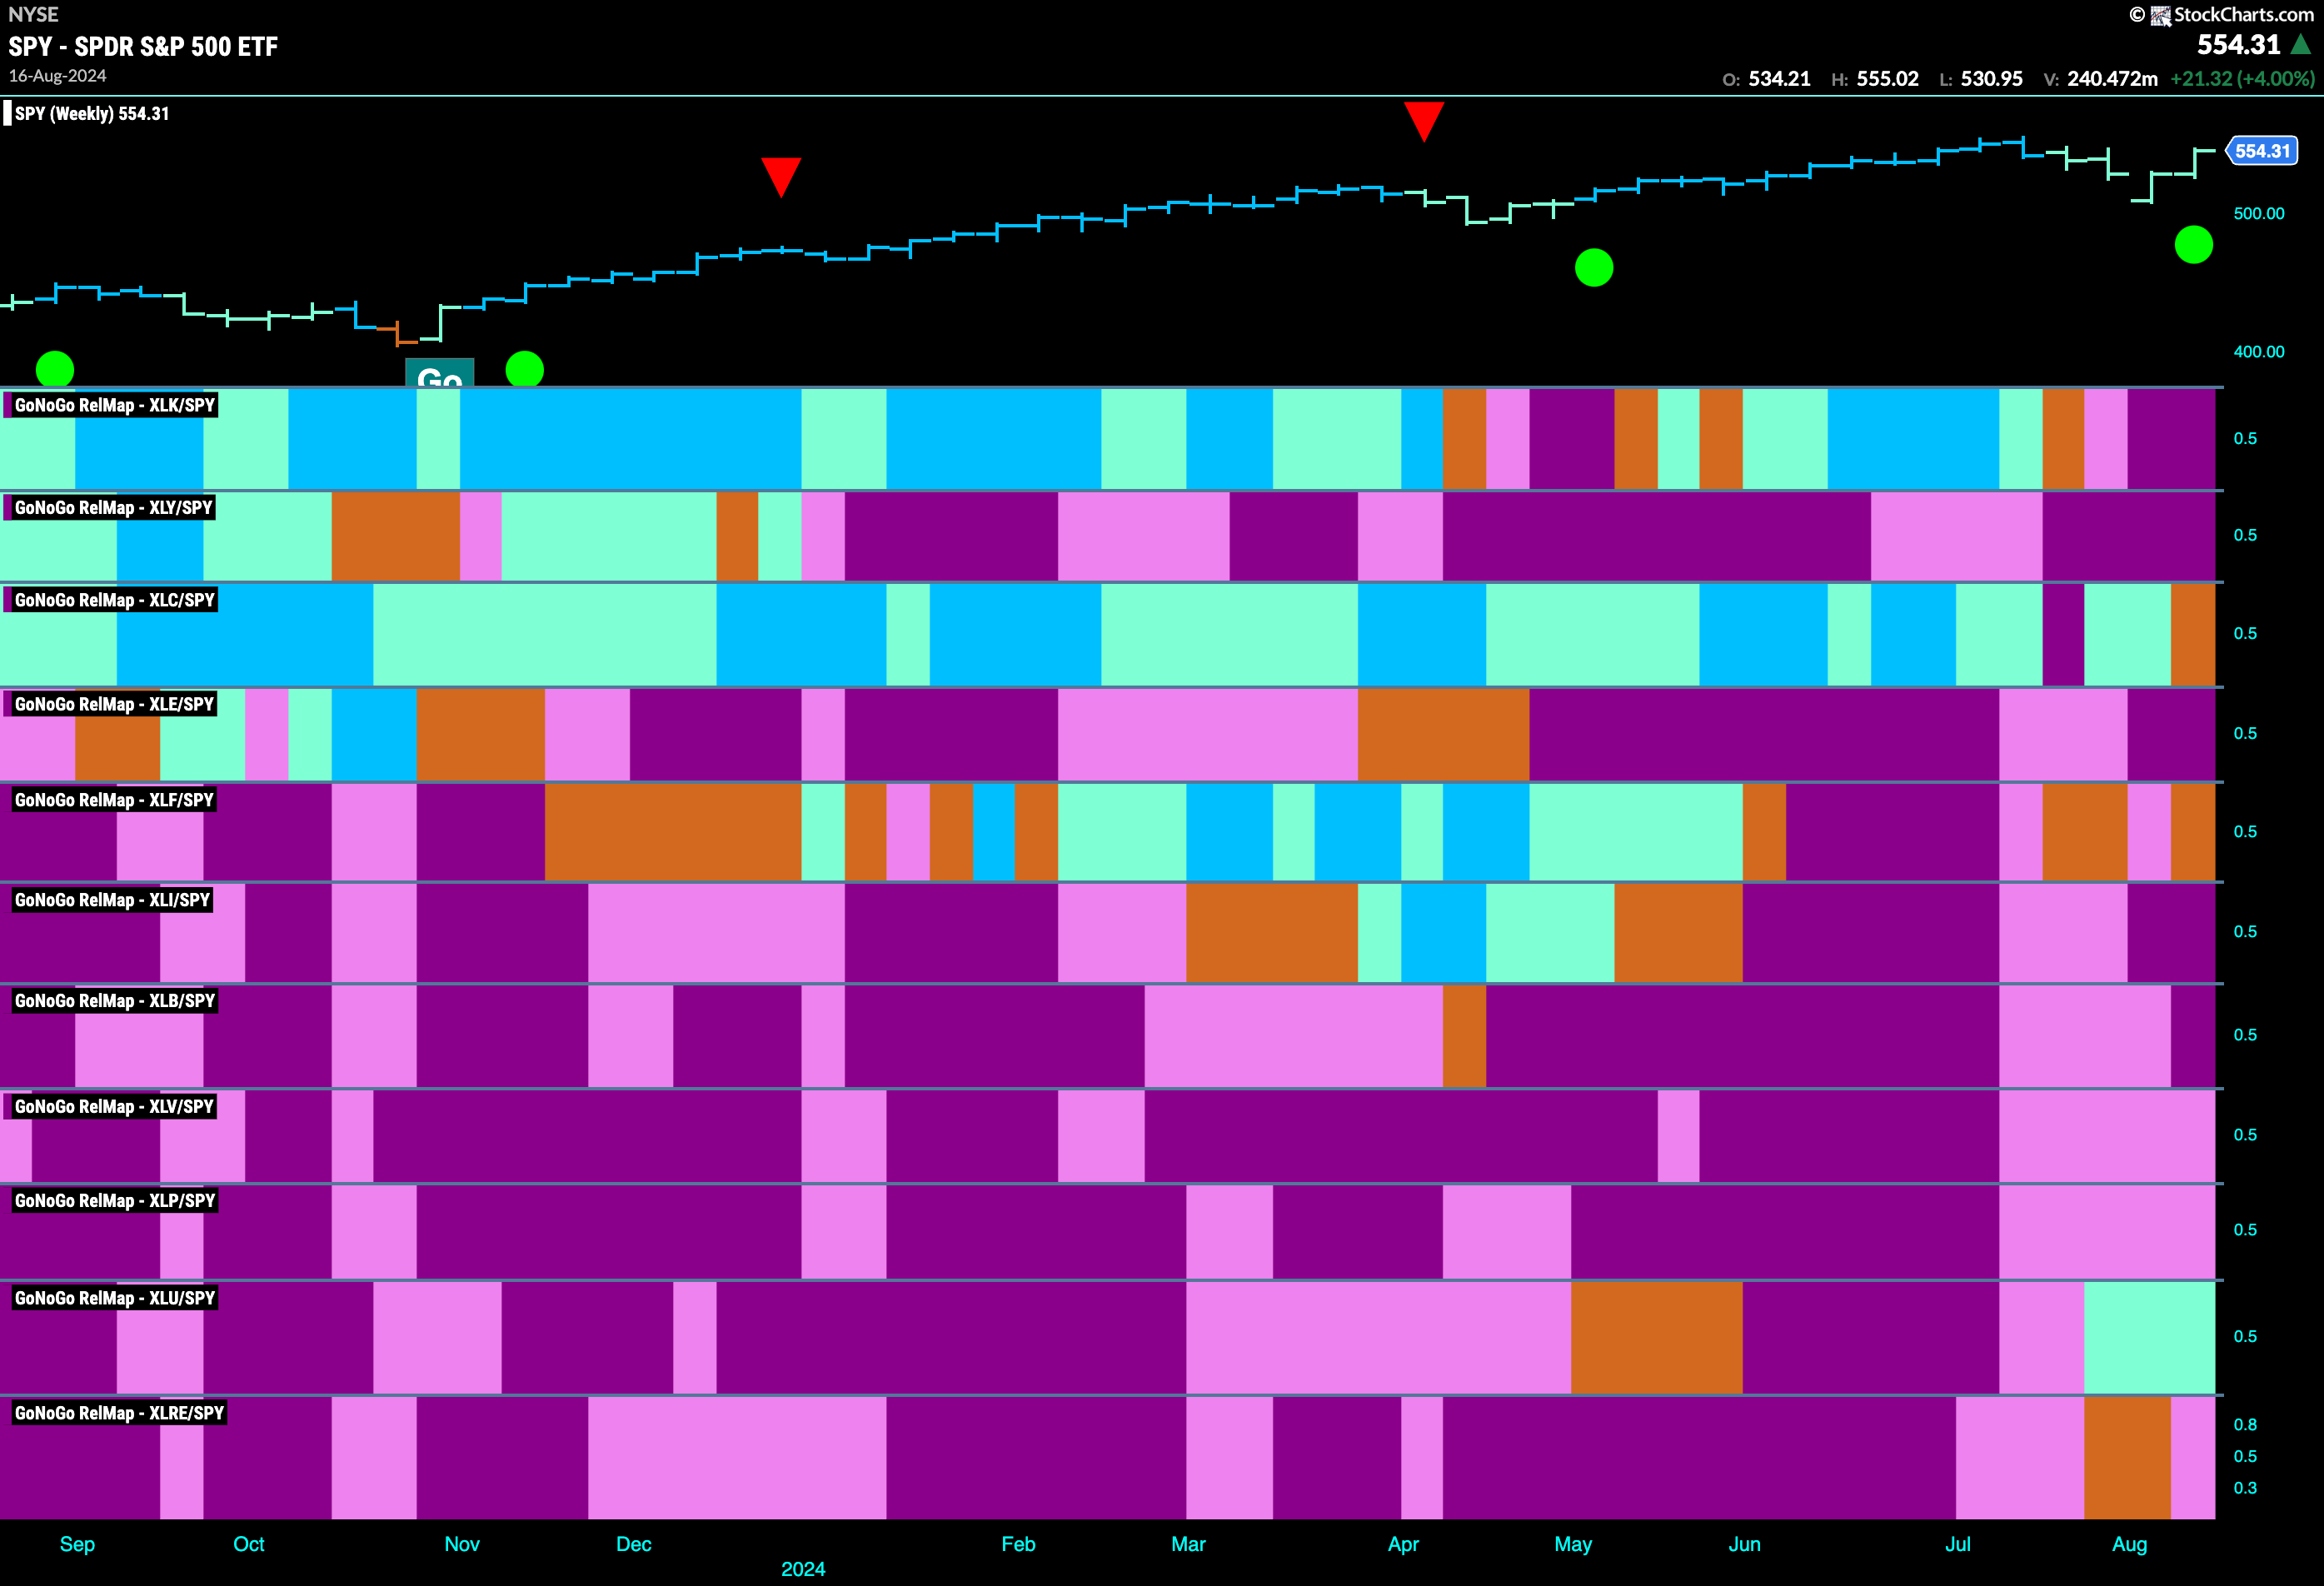
Below is the GoNoGo Sector RelMap. This GoNoGo RelMap applies the GoNoGo Trend to the relative strength ratios of the sectors to the base index. This week I have taken a WEEKLY view, for a longer term perspective. Interestingly, it is only $XLU that is outperforming the base index on a relative weekly basis.
$XLU Consolidating at New Highs
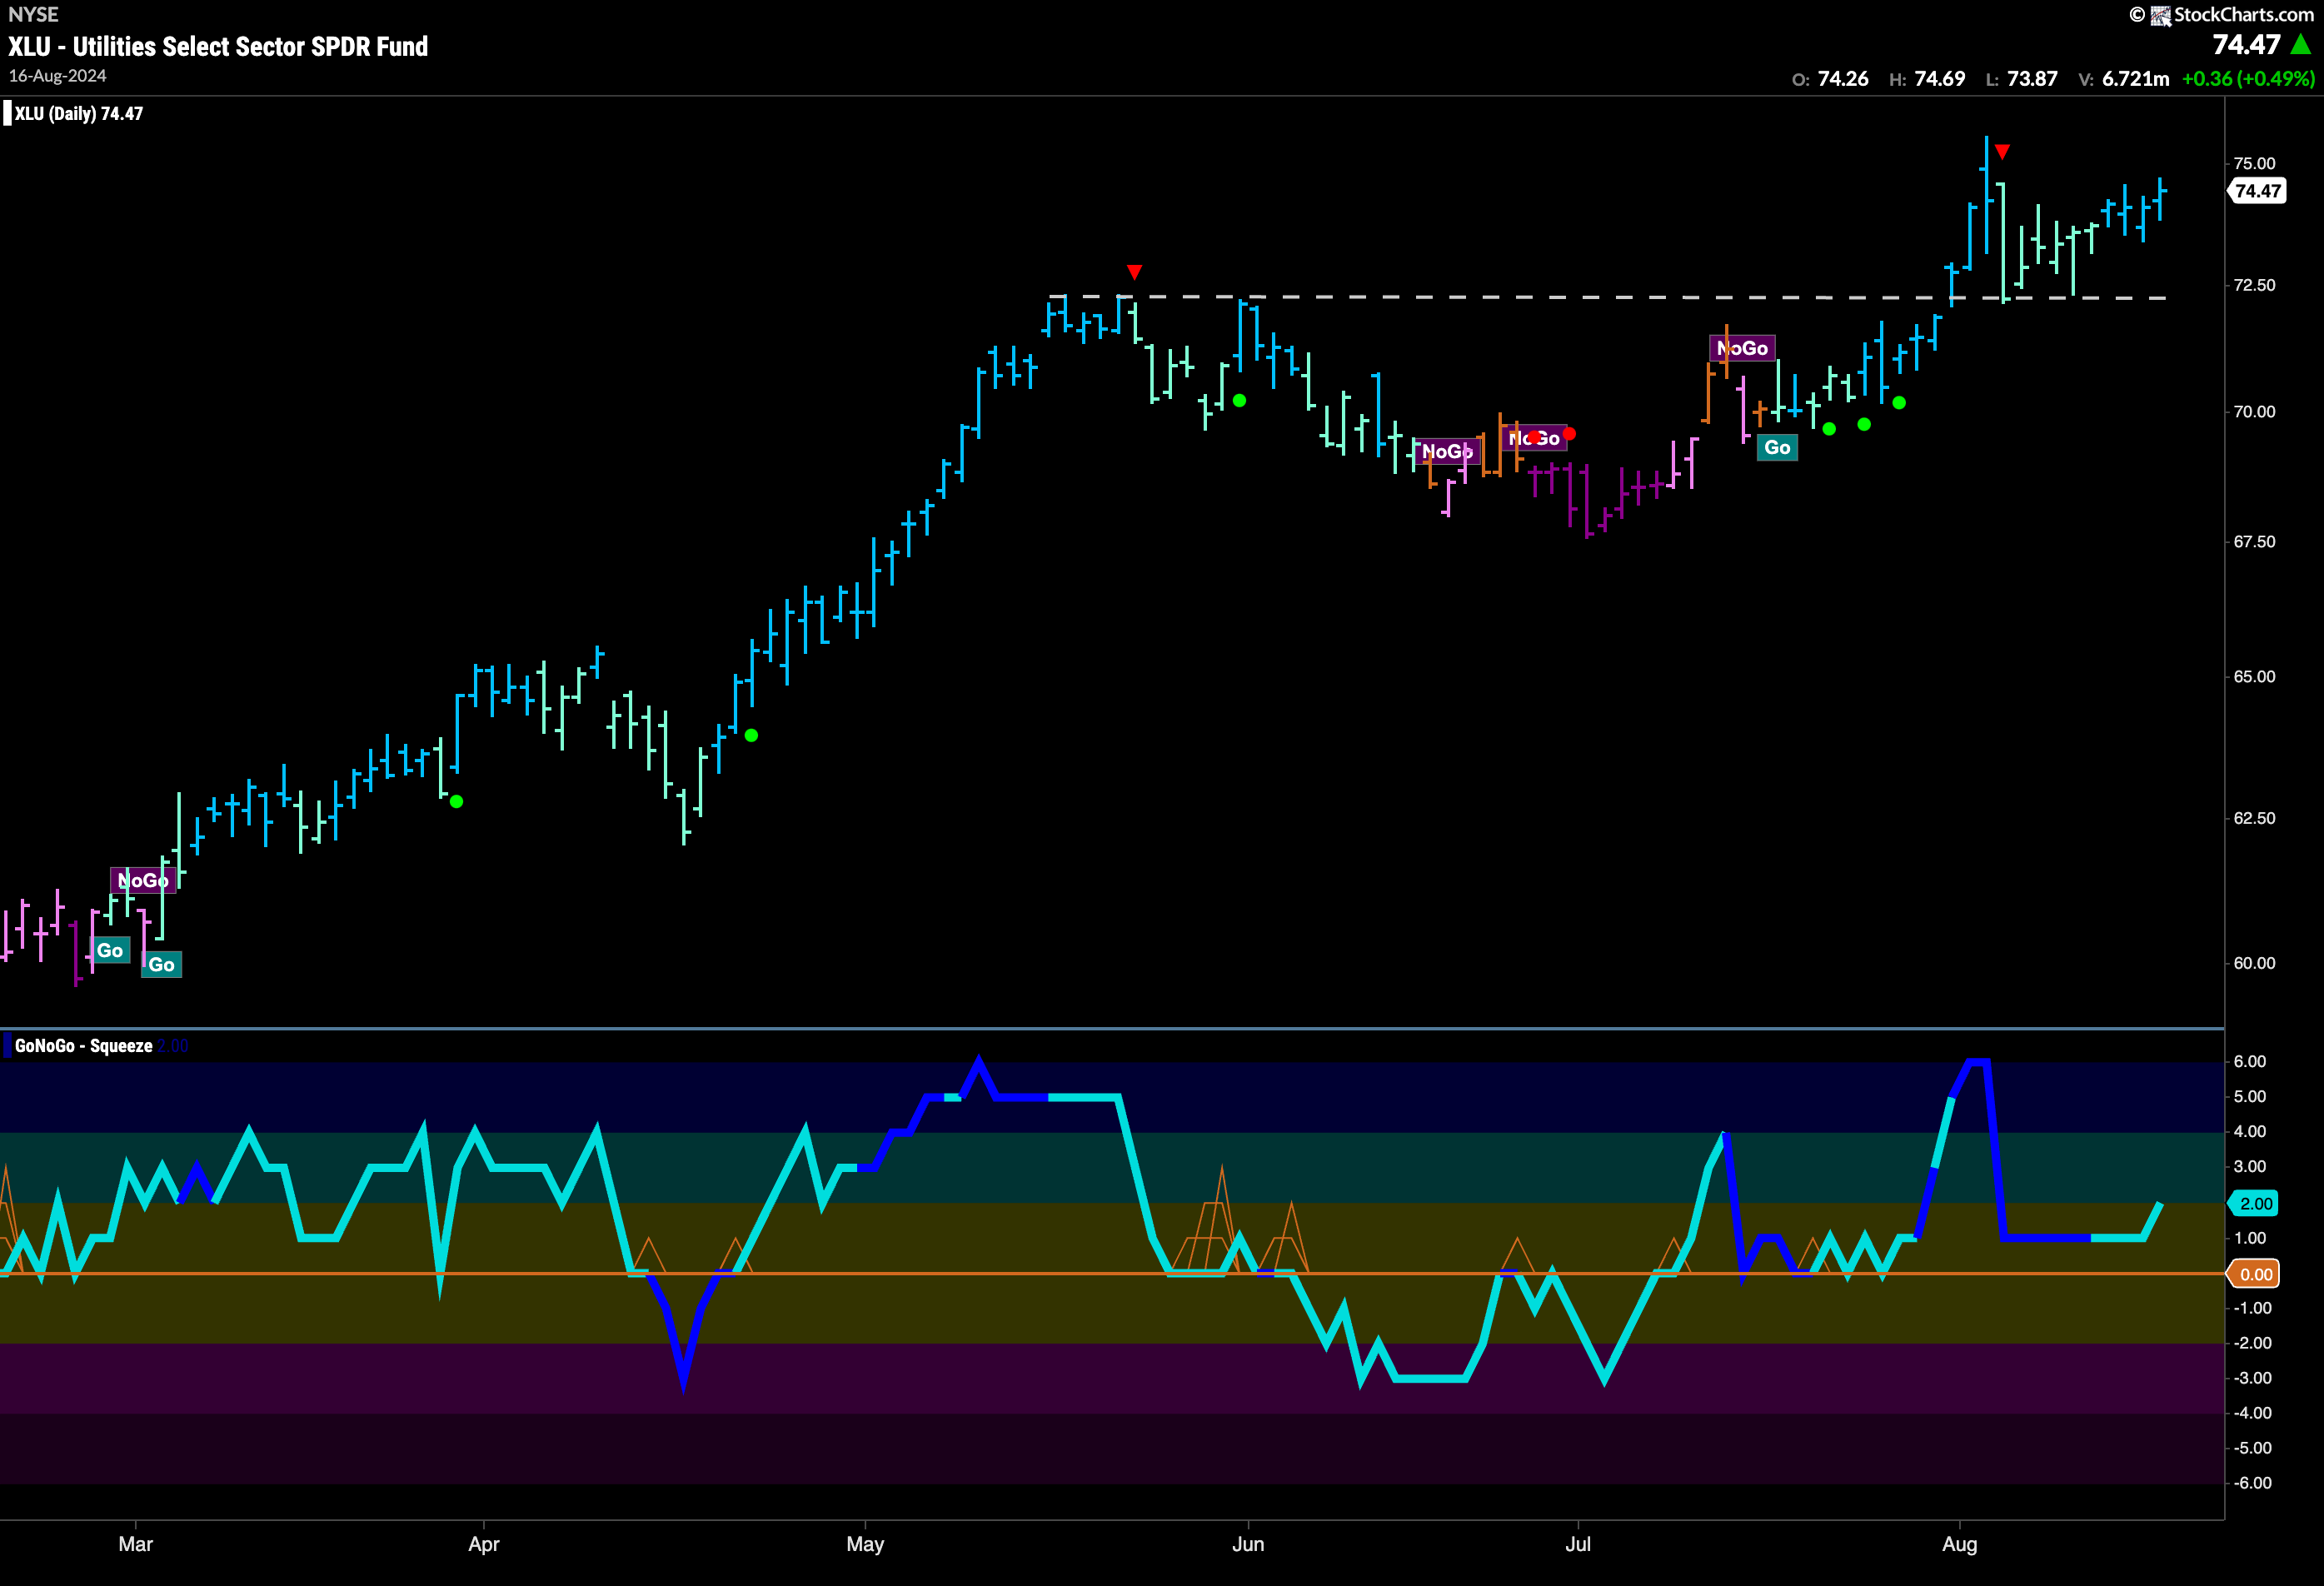
The chart below shows the $XLU with the full suite of GoNoGo tools applied. You can see that after a period of weakness (aqua bars) following the last high and Countertrend Correction Icon (red arrow), GoNoGo Trend has painted a string of stronger blue “Go” bars. This comes as GoNoGo Oscillator has turned higher without even reaching the zero line. We can now see that momentum is resurgent in the direction of the “Go” trend and we’ll look for price to make an attempt at a new high.
$AEE Setting up For Attack on New High
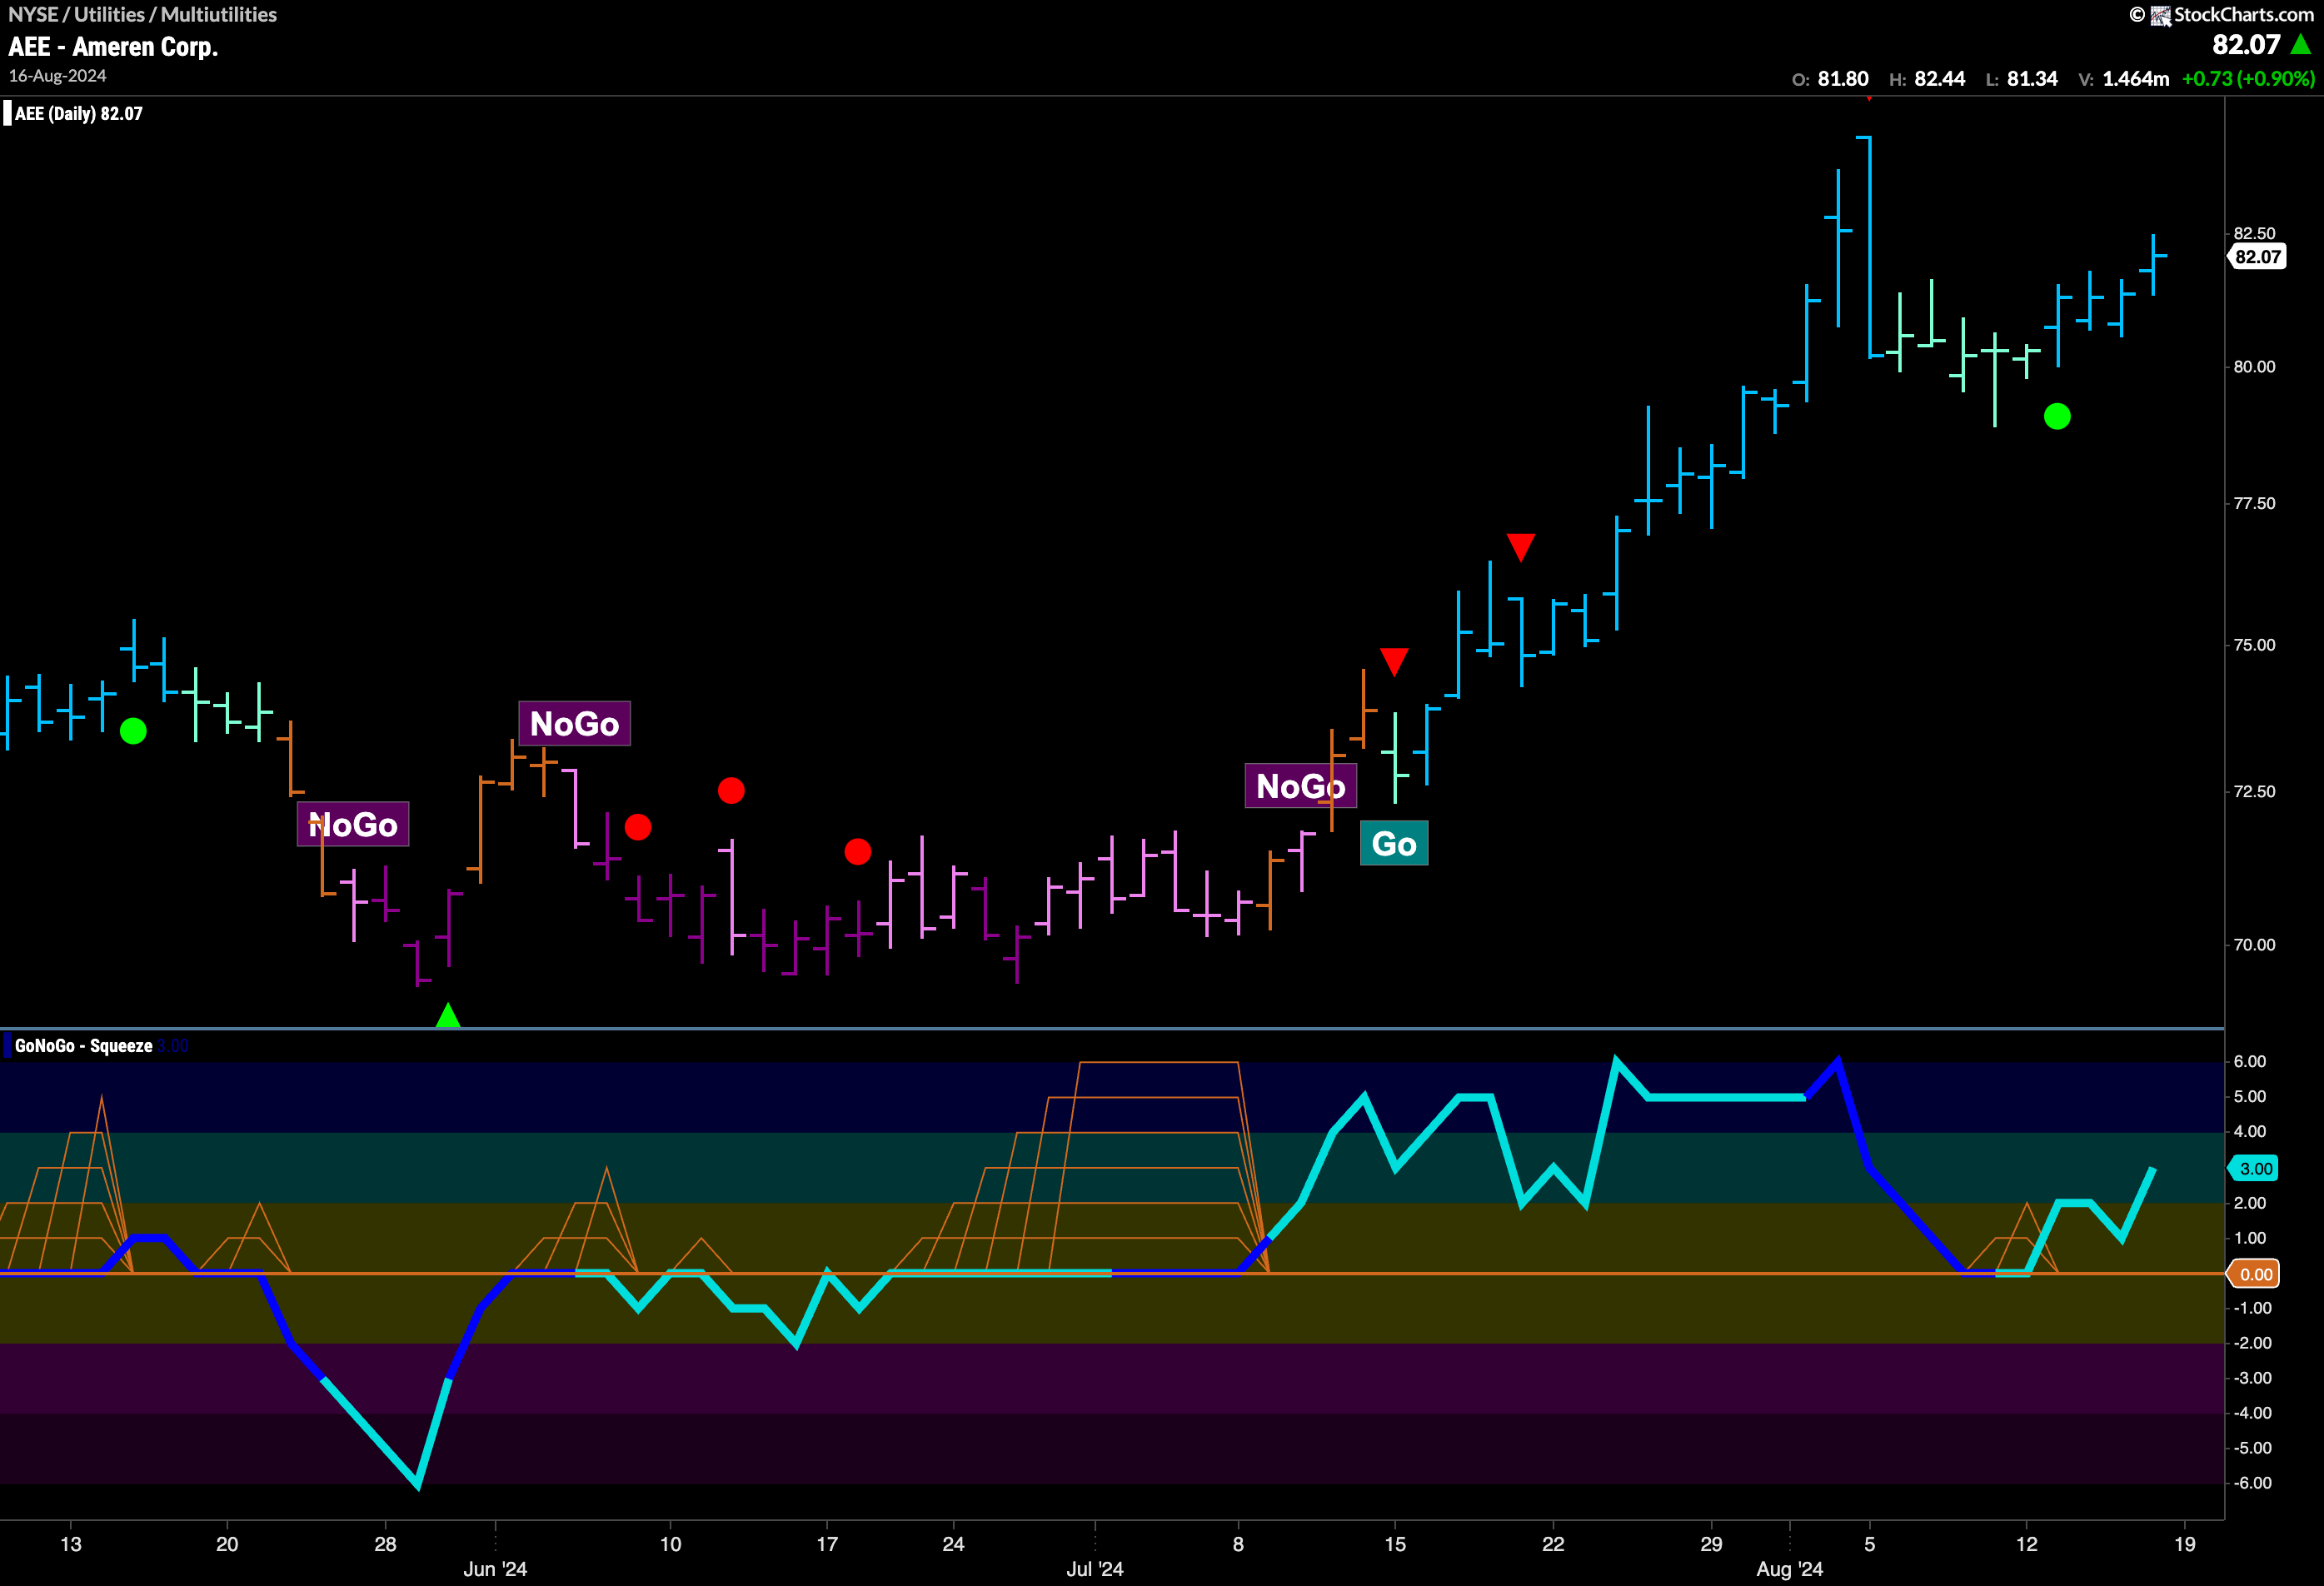
When we break down the utilities sector and look at the relative performance of the subgroups, we find that it its multi-utilities that are leading the way. $AEE below, shows a similar looking patter to $XLU above, with a strengthening “Go” trend as price tries to attack prior highs. We can see that here the GoNoGo Oscillator bounced off zero and so we got a Go Trend Continuation Icon (green circle) under the price bar a few days ago telling us that the trend was likely to continue. We will watch to see if price can rally to new highs.
$PEG Using Polarity as Springboard
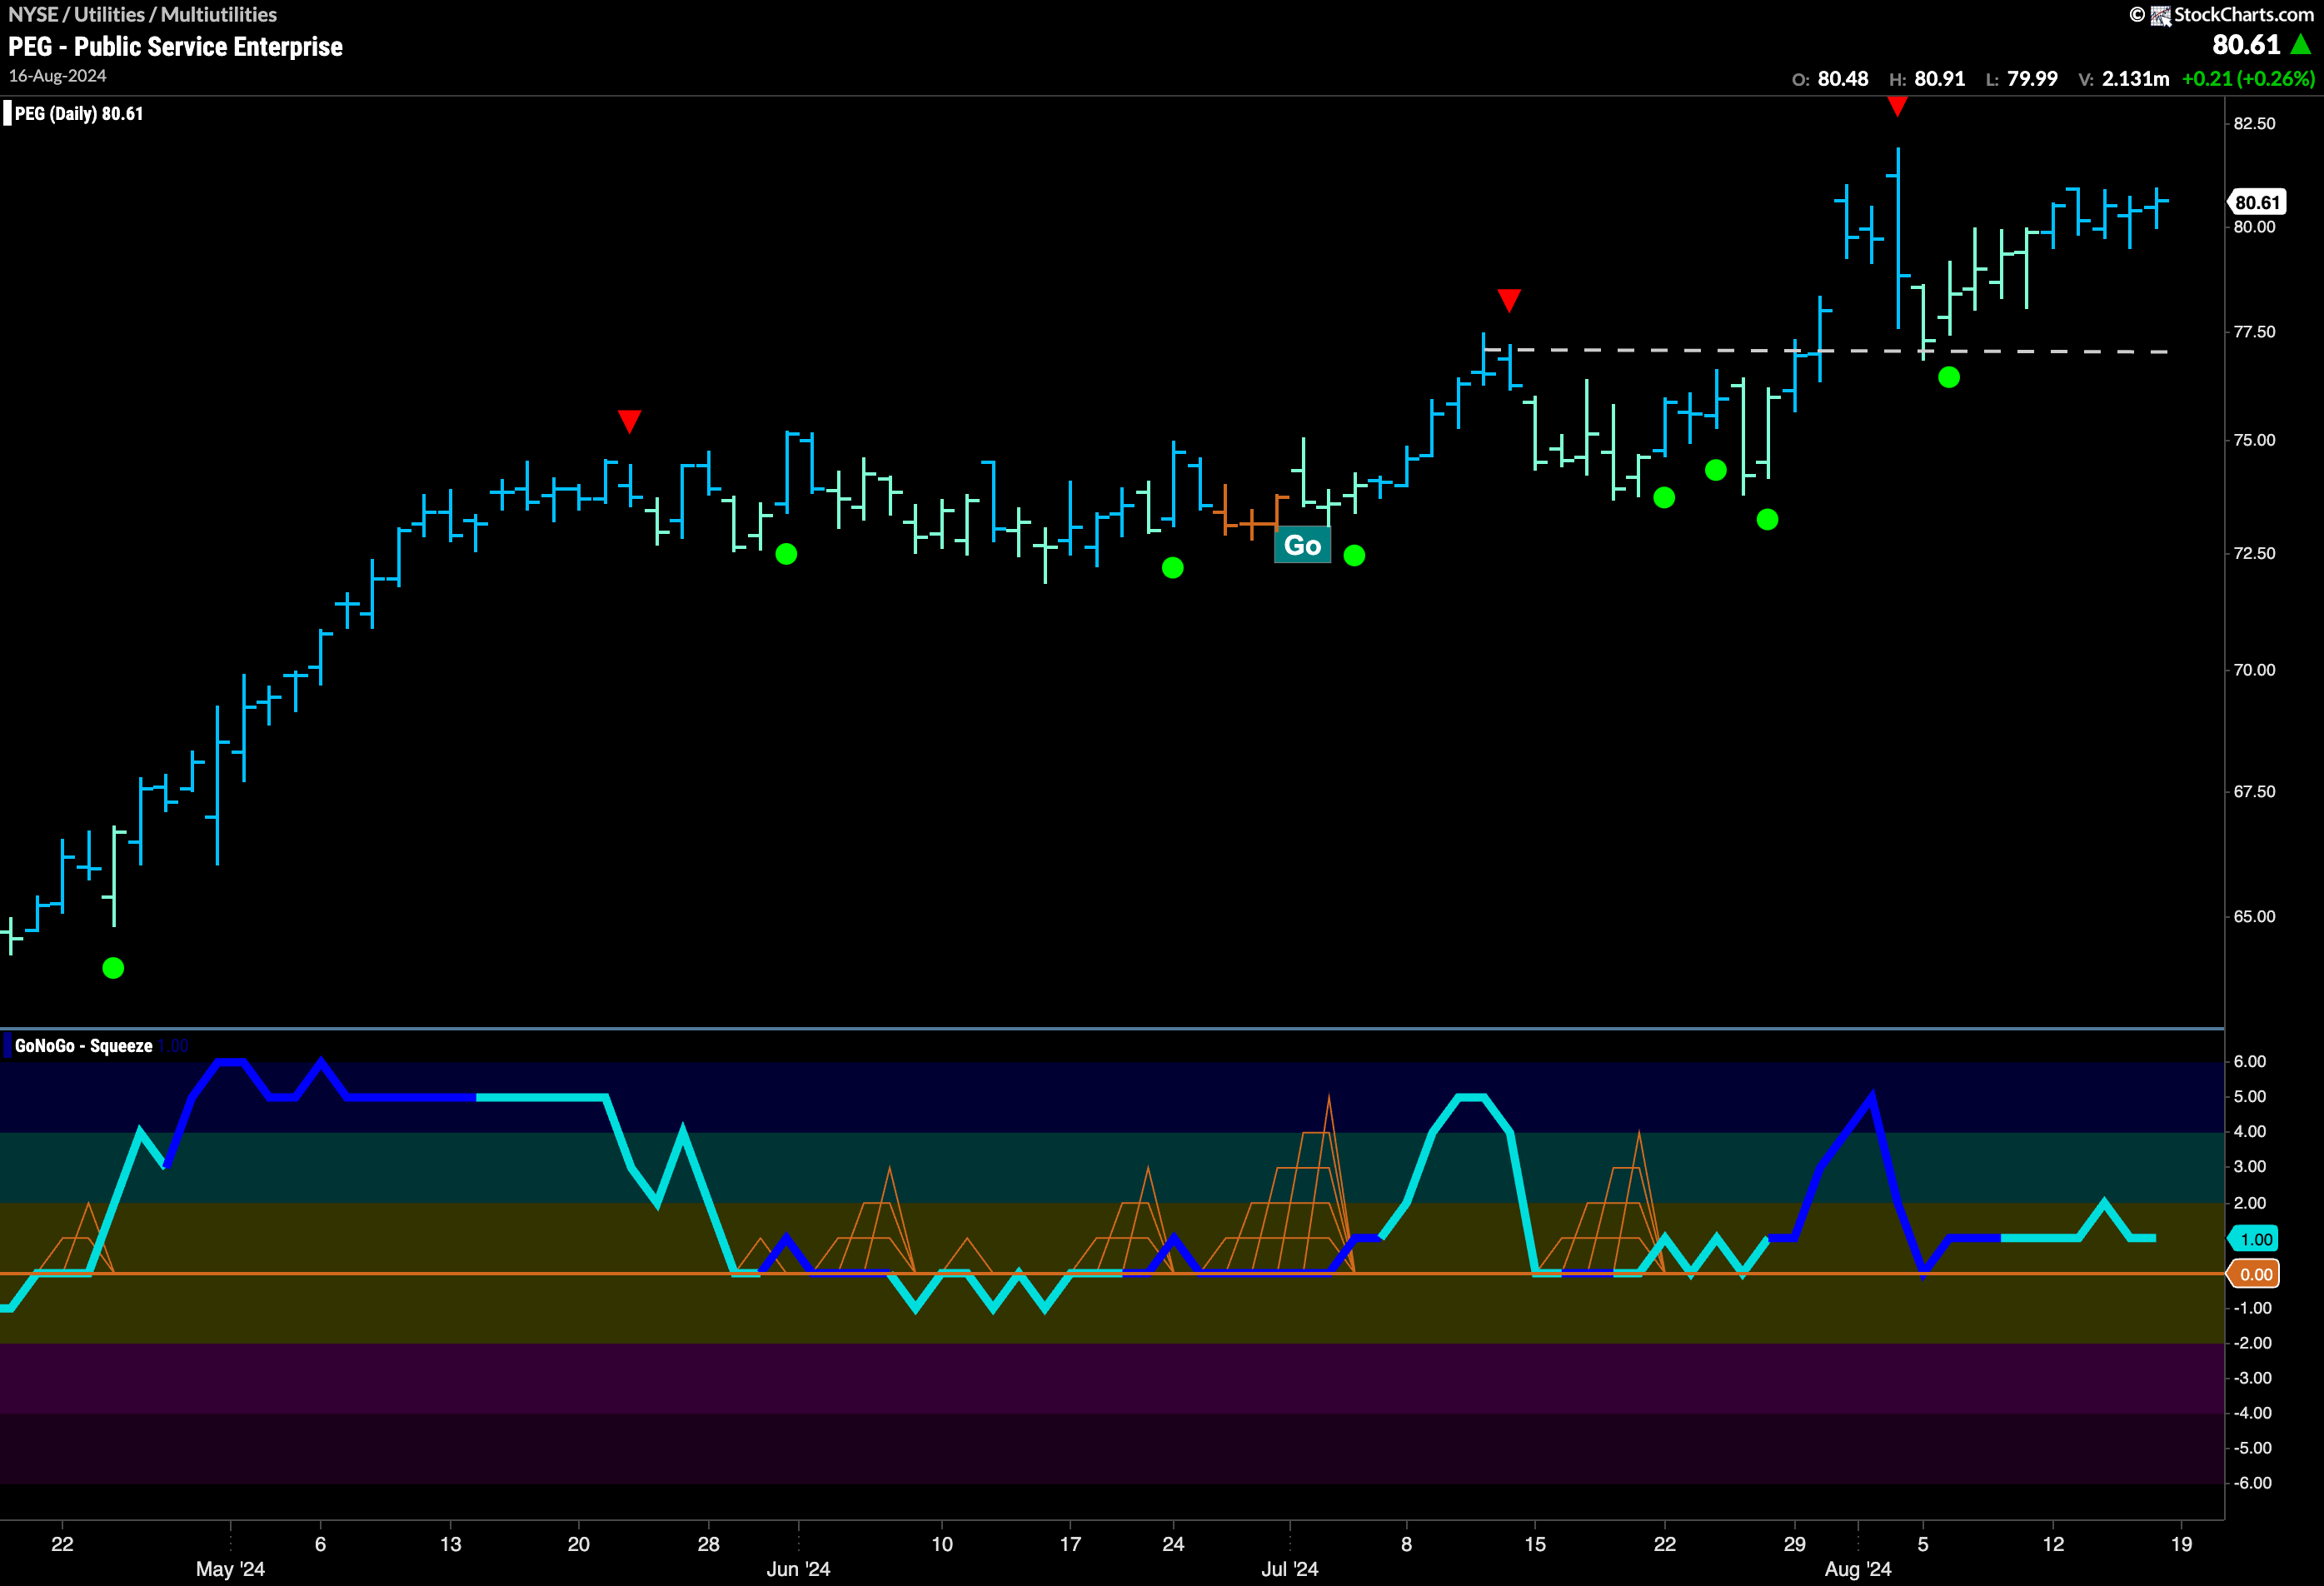
$PEG broke through resistance a few weeks ago to set a new high. We can see that resistance now becoming support. After a higher high and a Go Countertrend Correction Icon (red arrow) price fell to test that horizontal level. Support was found and GoNoGo Oscillator found support at the zero line at the same time. This told us that the trend was likely to continue. We have seen GoNoGo Trend return to strong blue bars and we are now close to new highs. With momentum on the side of the “Go” trend we will look for price to make an attempt at new highs in the next day sand weeks.
