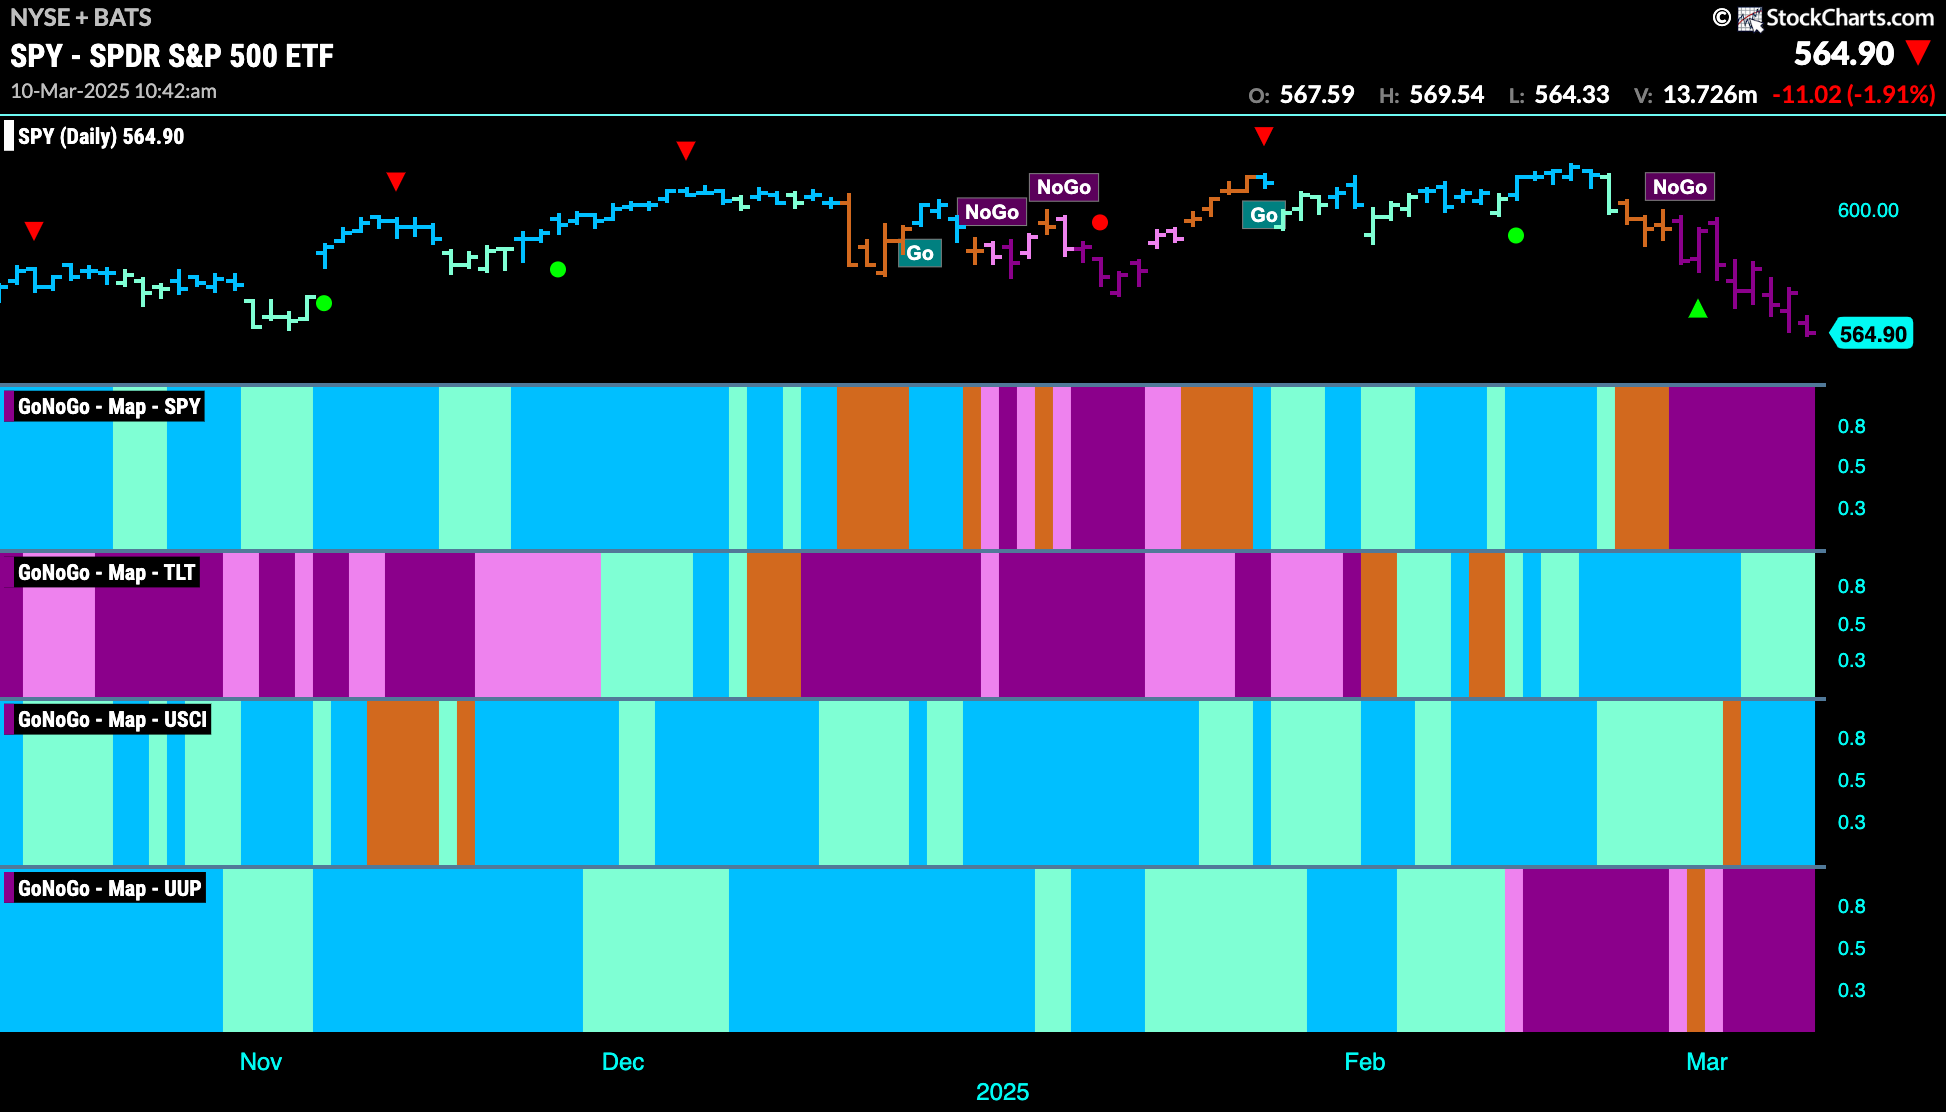
Good morning and welcome to this week’s Flight Path. The equity trend stayed strong as the indicator painted uninterrupted purple “NoGo” bars. Treasury bond prices remained in a “Go” trend but there was weakness with aqua bars. U.S. commodities shows a return to form for the “Go” trend as we saw bright blue bars while the dollar rolled over, back into a strong “NoGo” trend.
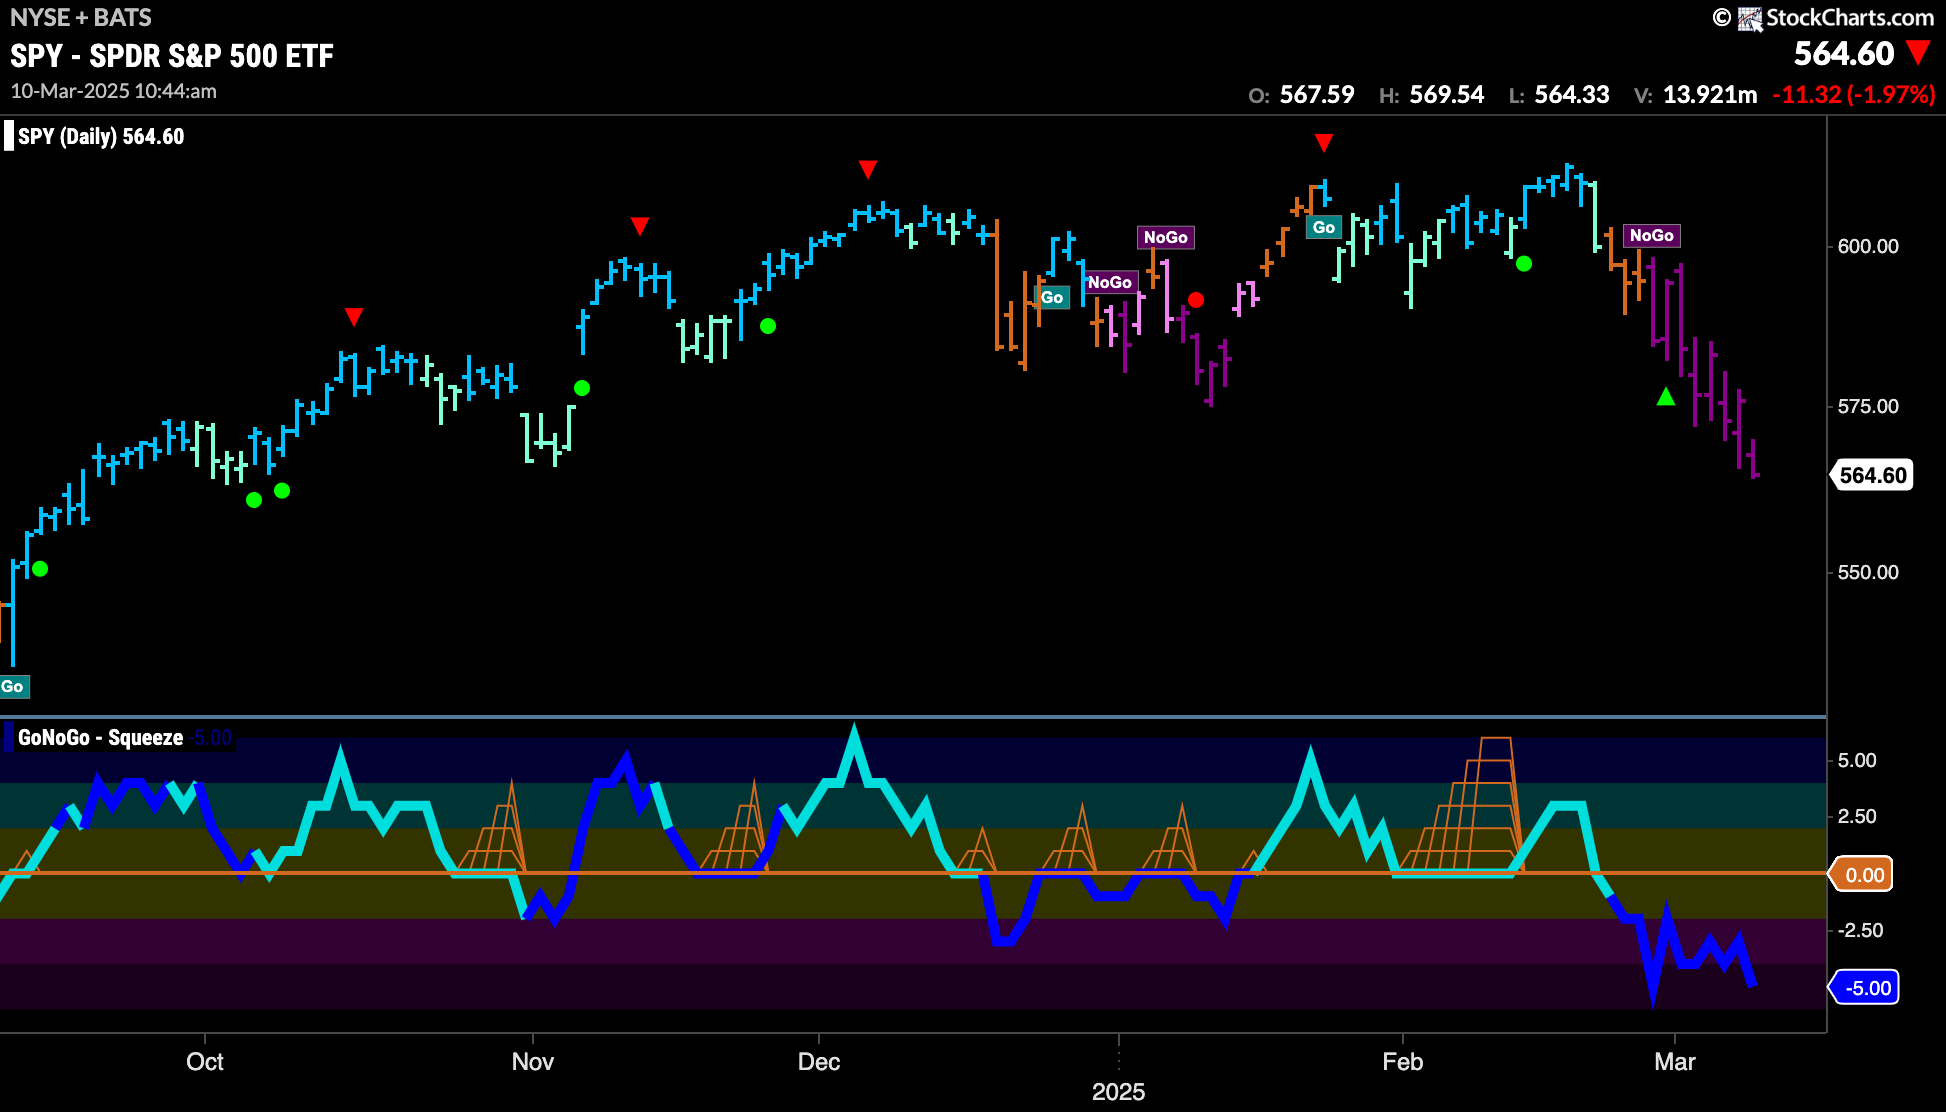
$SPY Stays in Strong “NoGo” with Purple Bars
The GoNoGo chart below shows price falling to new lows as the trend stays in a strong “NoGo”. GoNoGo Oscillator has stayed in negative territory since breaking through the zero level a few weeks ago. Now, we see that it has entered oversold territory at a value of -5 and volume is heavy. We will watch to see if momentum cools a little allowing price to find a low.
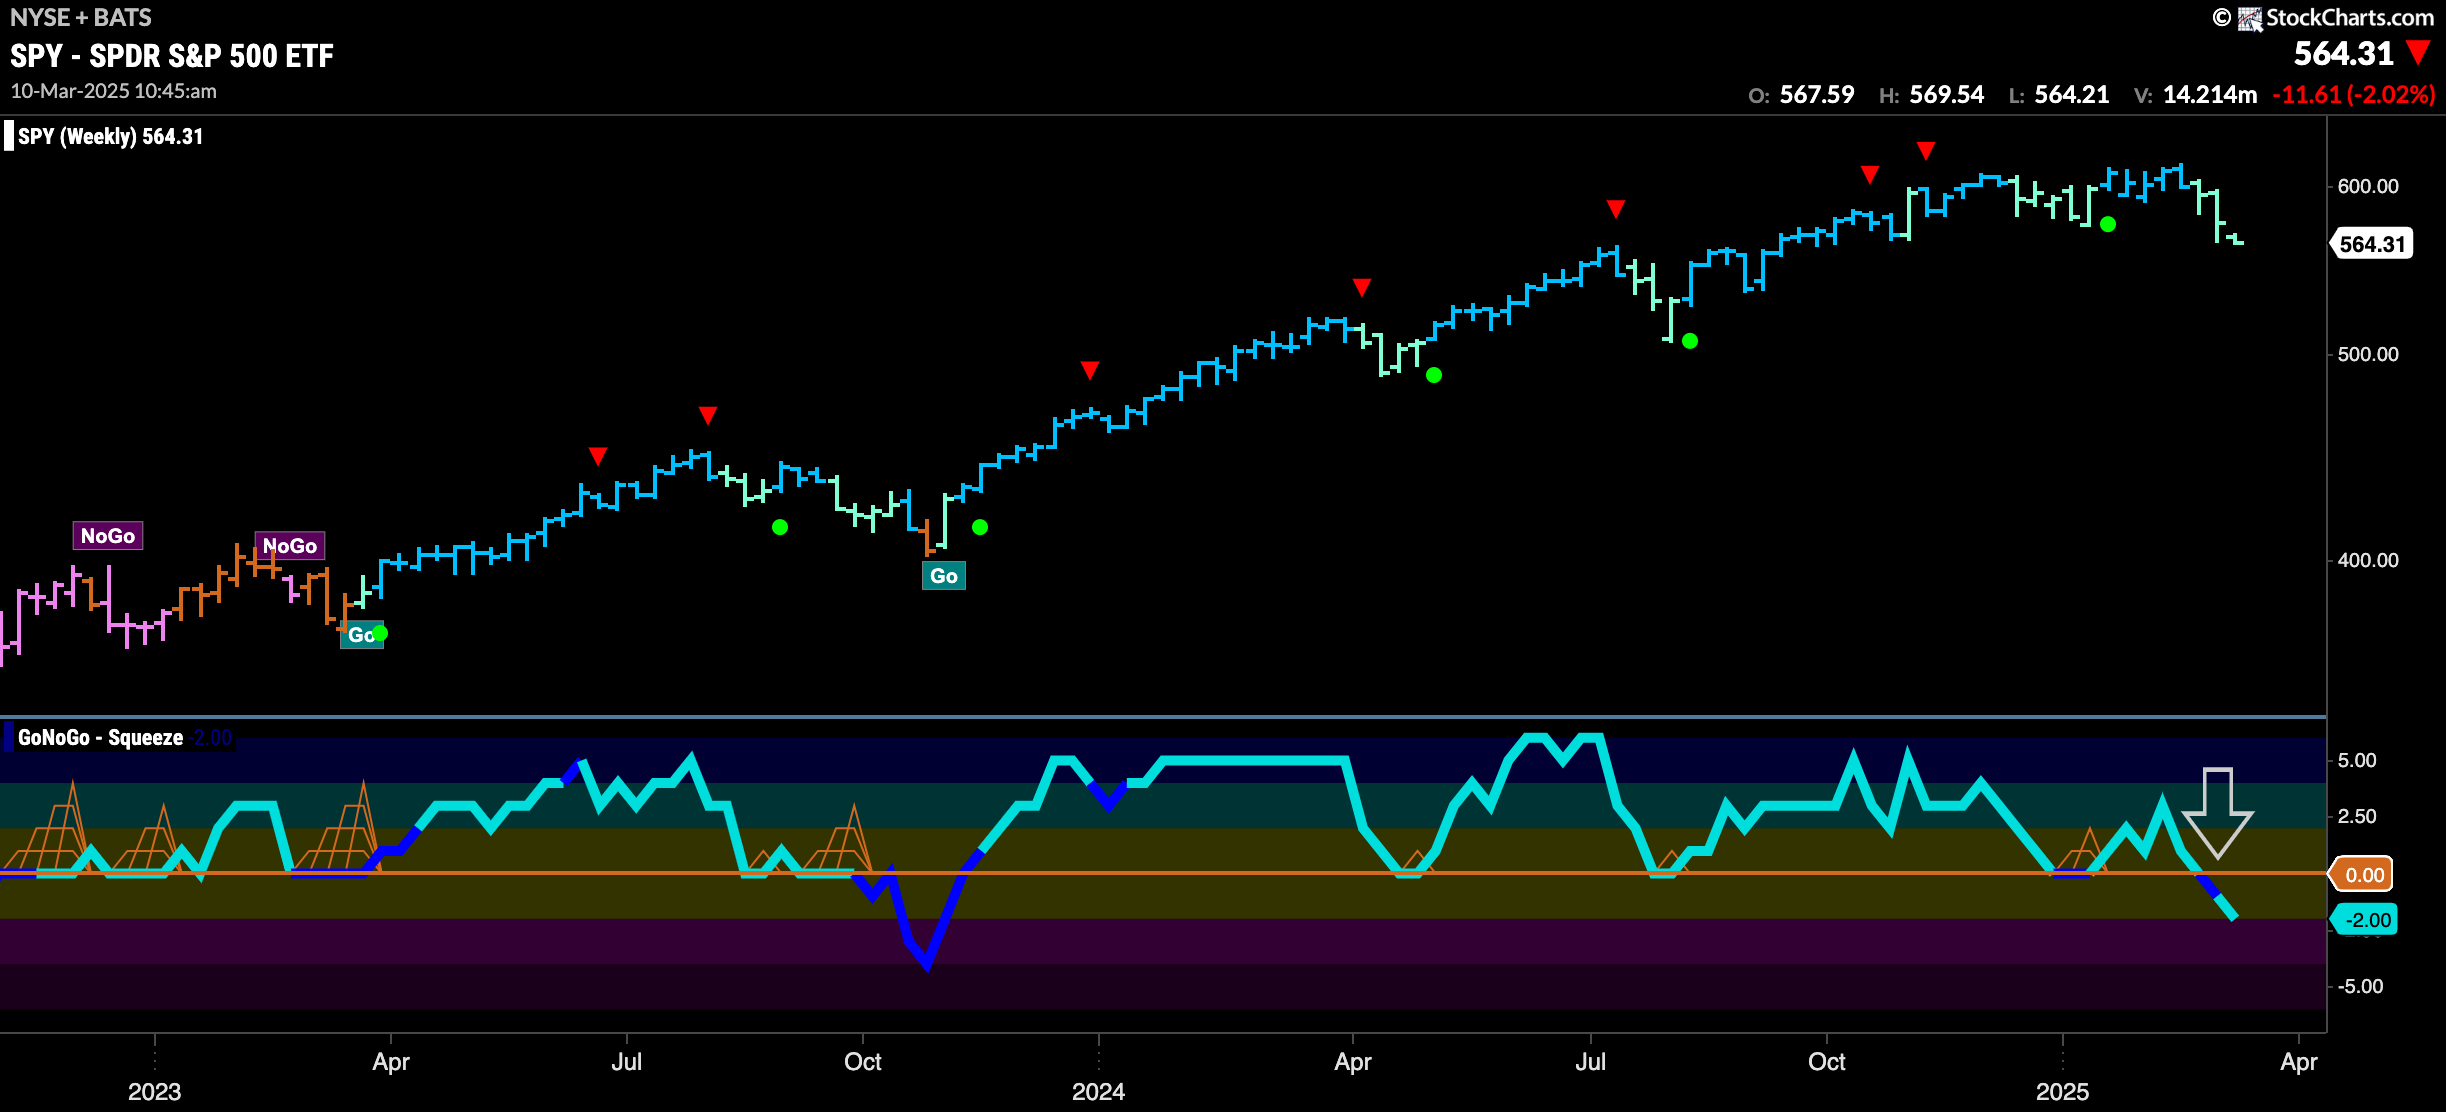
The “Go” trend on the weekly chart has survived again but we are seeing price at new lows on weak aqua bars. Worryingly, GoNoGo Oscillator has crashed through the zero line and is now in negative territory at a value of -2. This tells us that momentum is out of step with the “Go” trend and we could see more downward pressure.
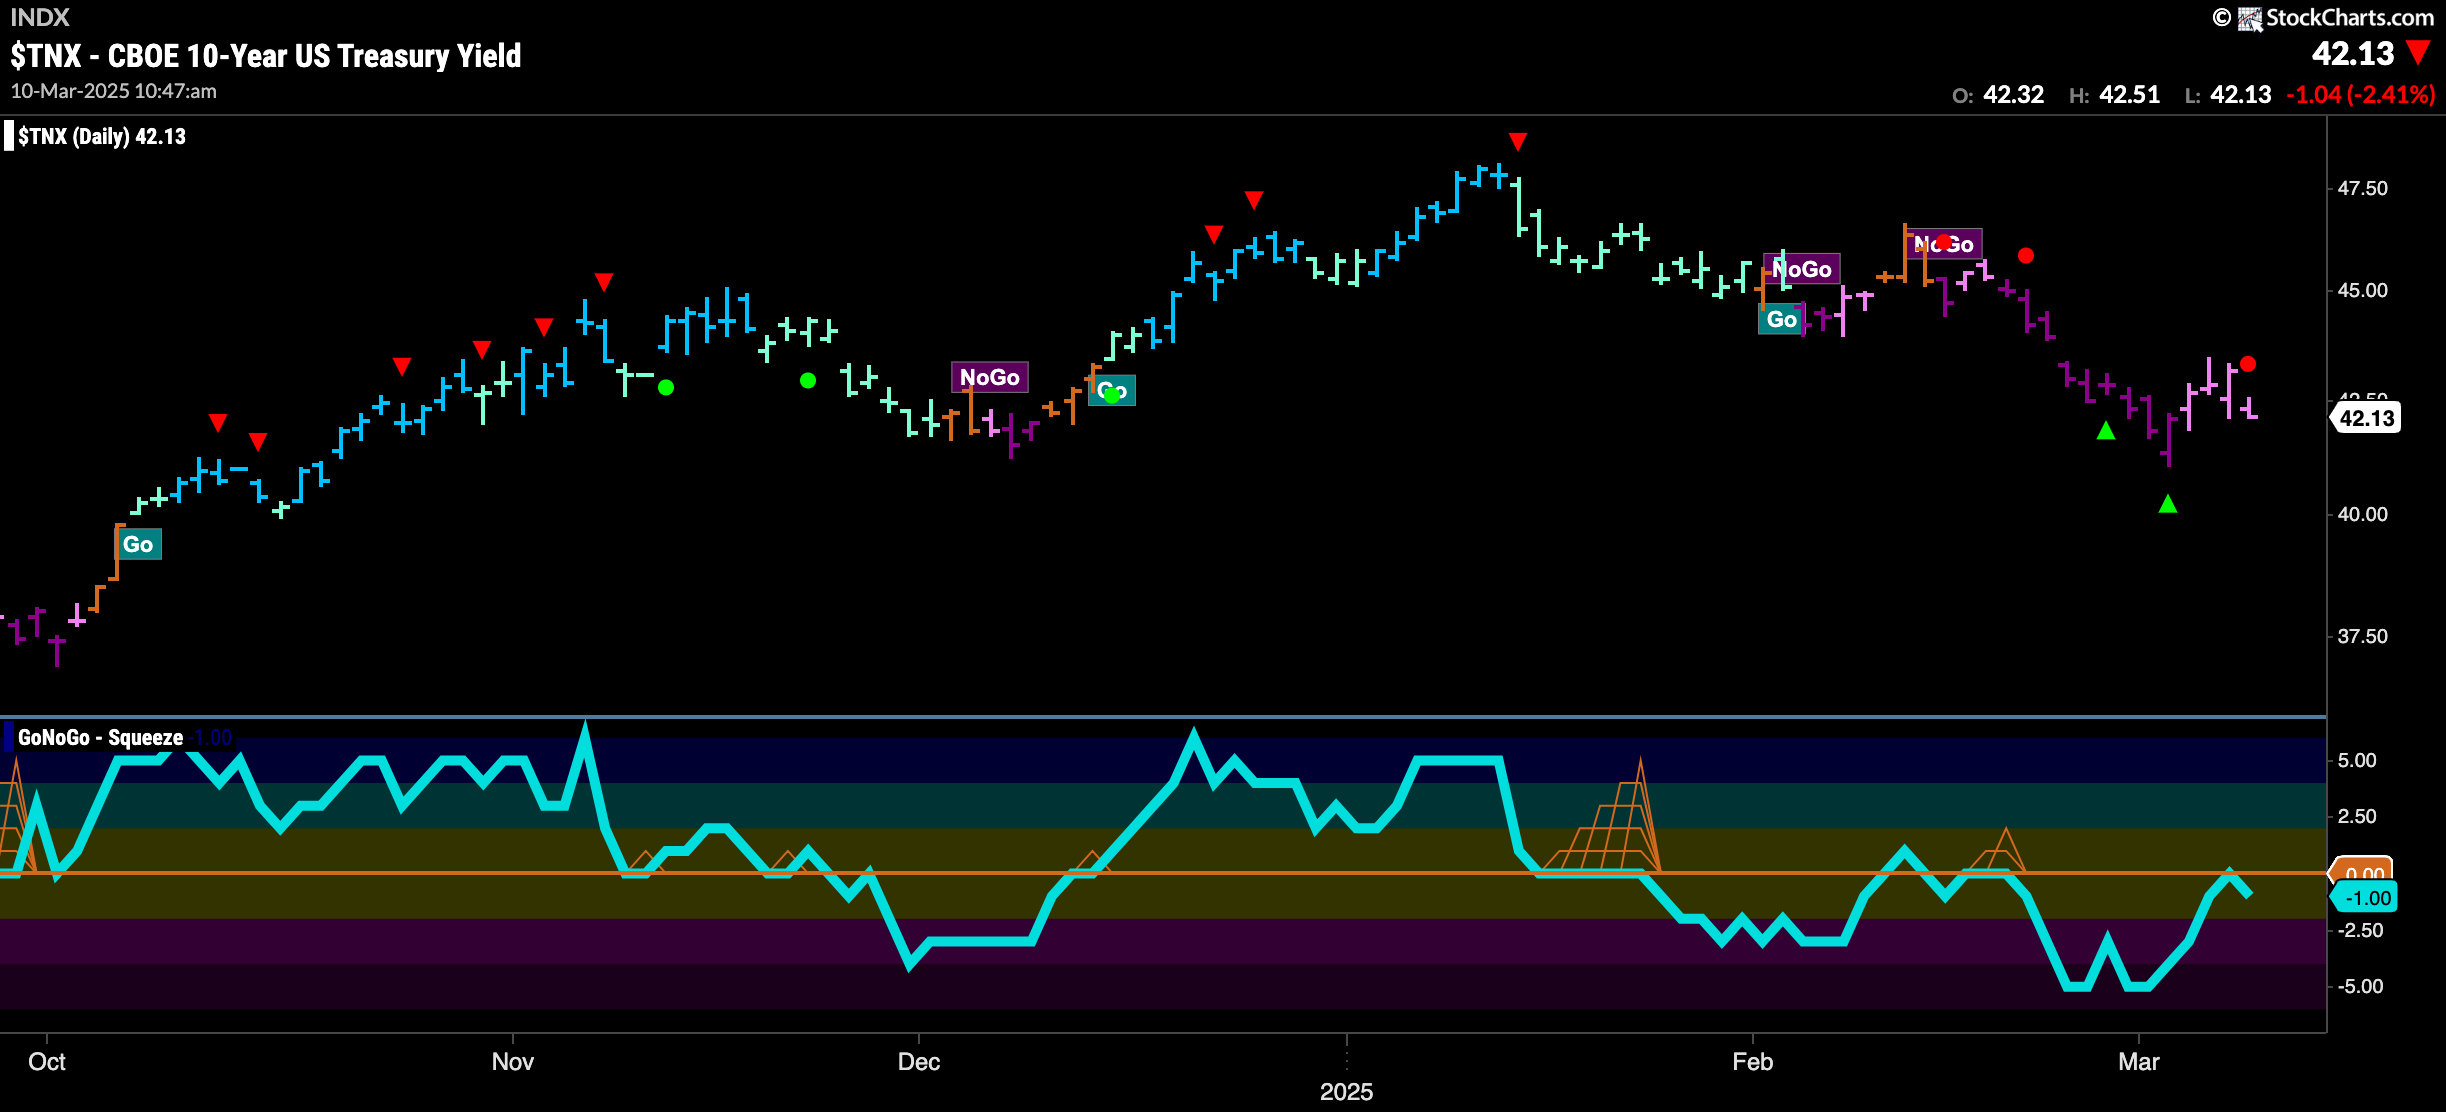
Treasury Rates Stabilize but Stay in “NoGo”
GoNoGo Trend shows that the “NoGo” trend remains in place this week but after finding a low we see rates rally and paint weaker pink bars. This comes after a NoGo Countertrend Correction Icon (green arrow) indicating that rates would struggle to go lower in the short term. Most recently, the oscillator met with resistance at the zero line and that triggered a NoGo Trend Continuation Icon (red circle) suggesting rates may be ready to head lower again.
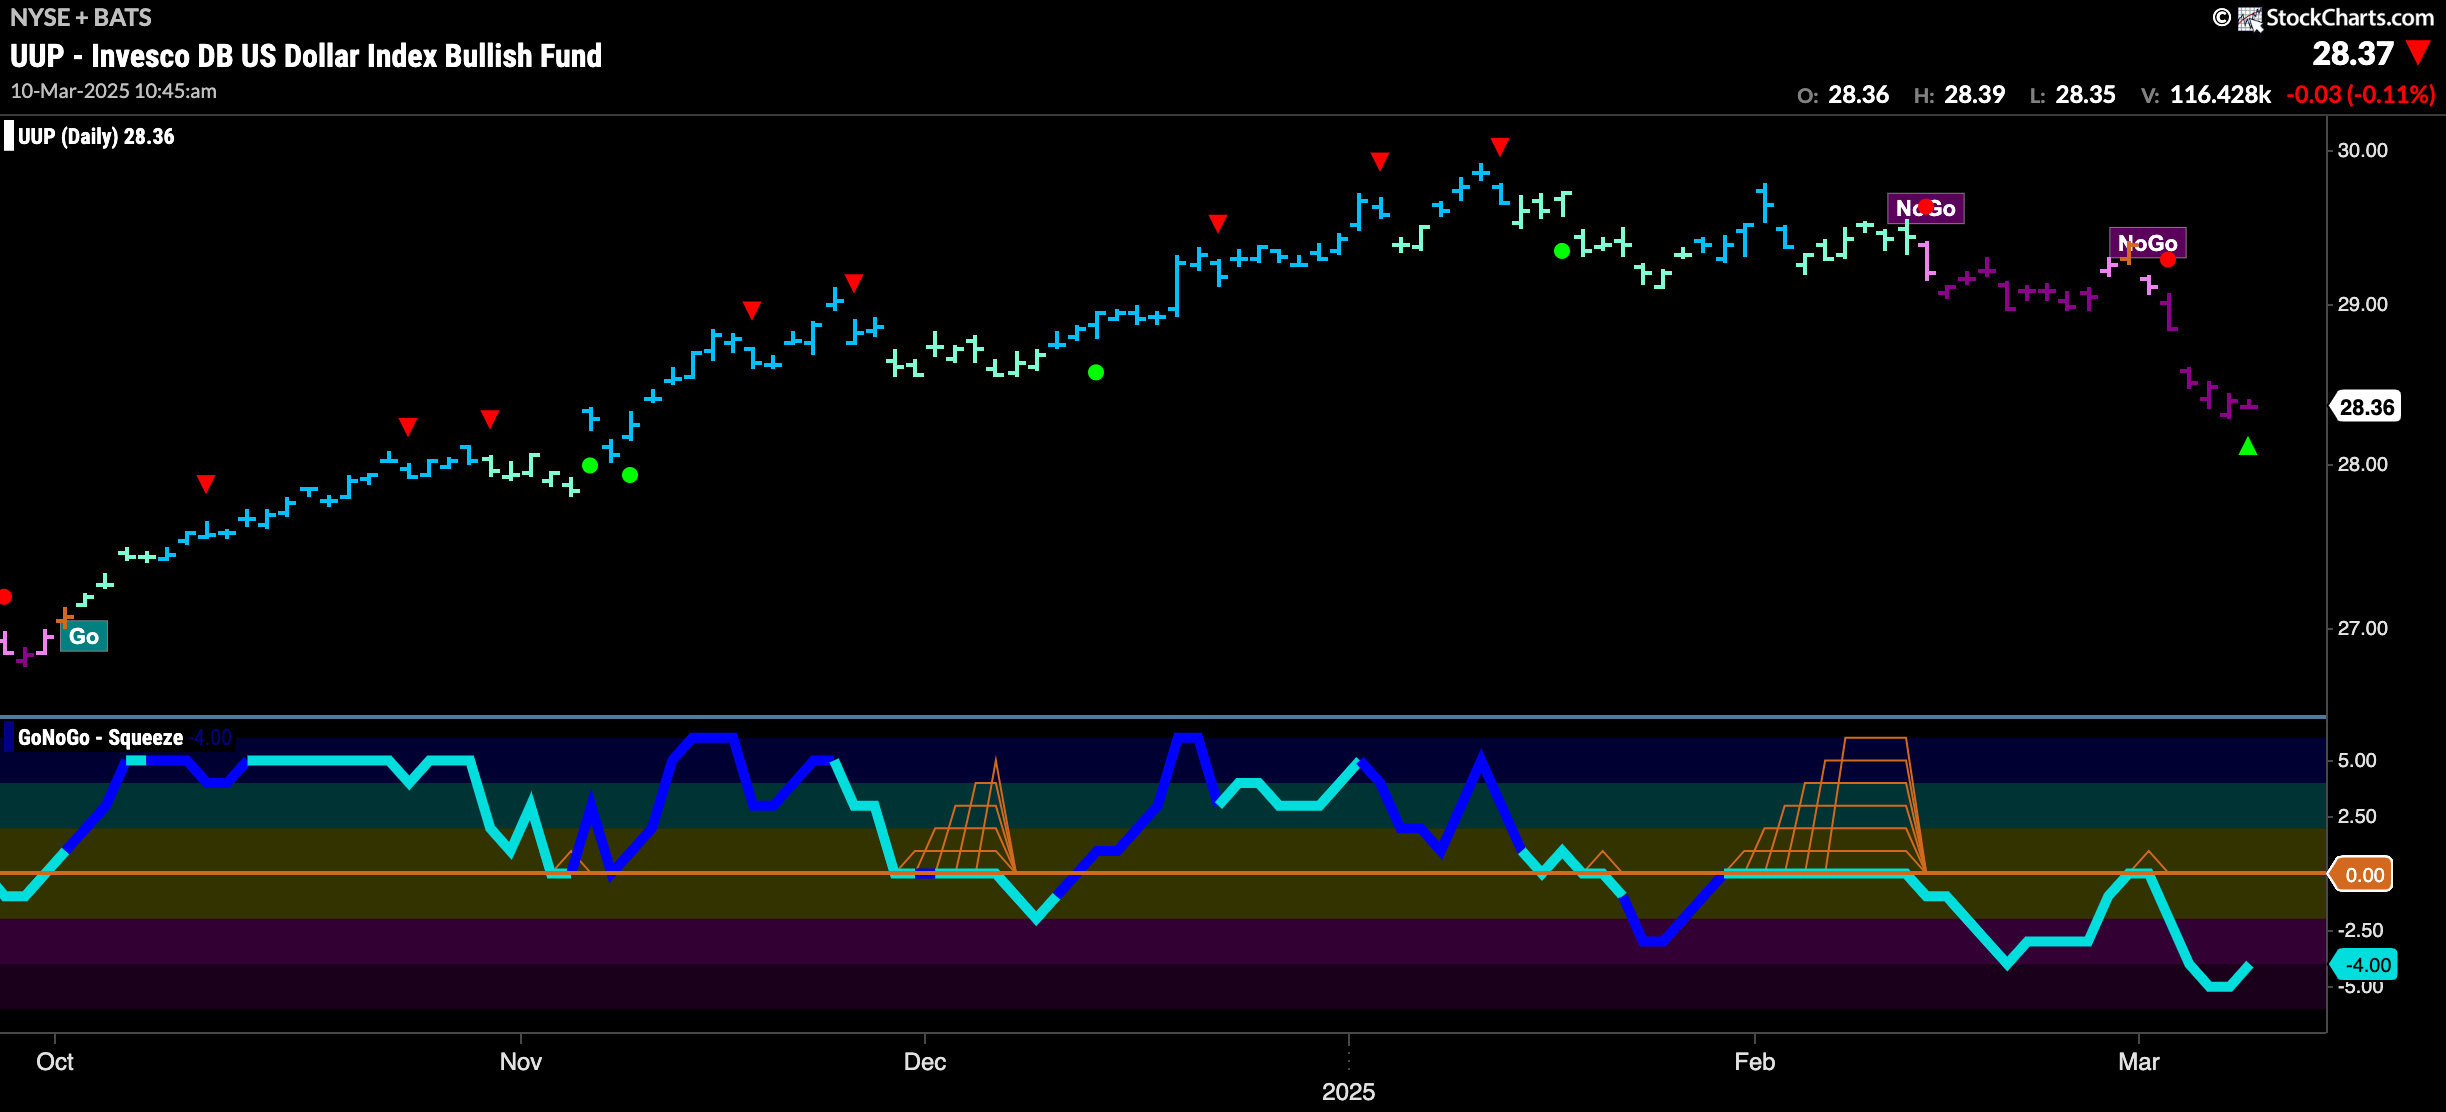
“NoGo” Returned in Force This Past Week
After failing to to go higher and setting a lower high, price rolled over back into a “NoGo” trend and has spent the entire week painting strong purple “NoGo” bars. This comes after GoNoGo Oscillator was rejected by the zero level and we saw a NoGo Countertrend Correction Icon (red circle) indicating resurgent momentum in the direction of the “NoGo”. Now, we see a NoGo Countertrend Correction Icon (green arrow) indicating that in the short term price may struggle to go lower.
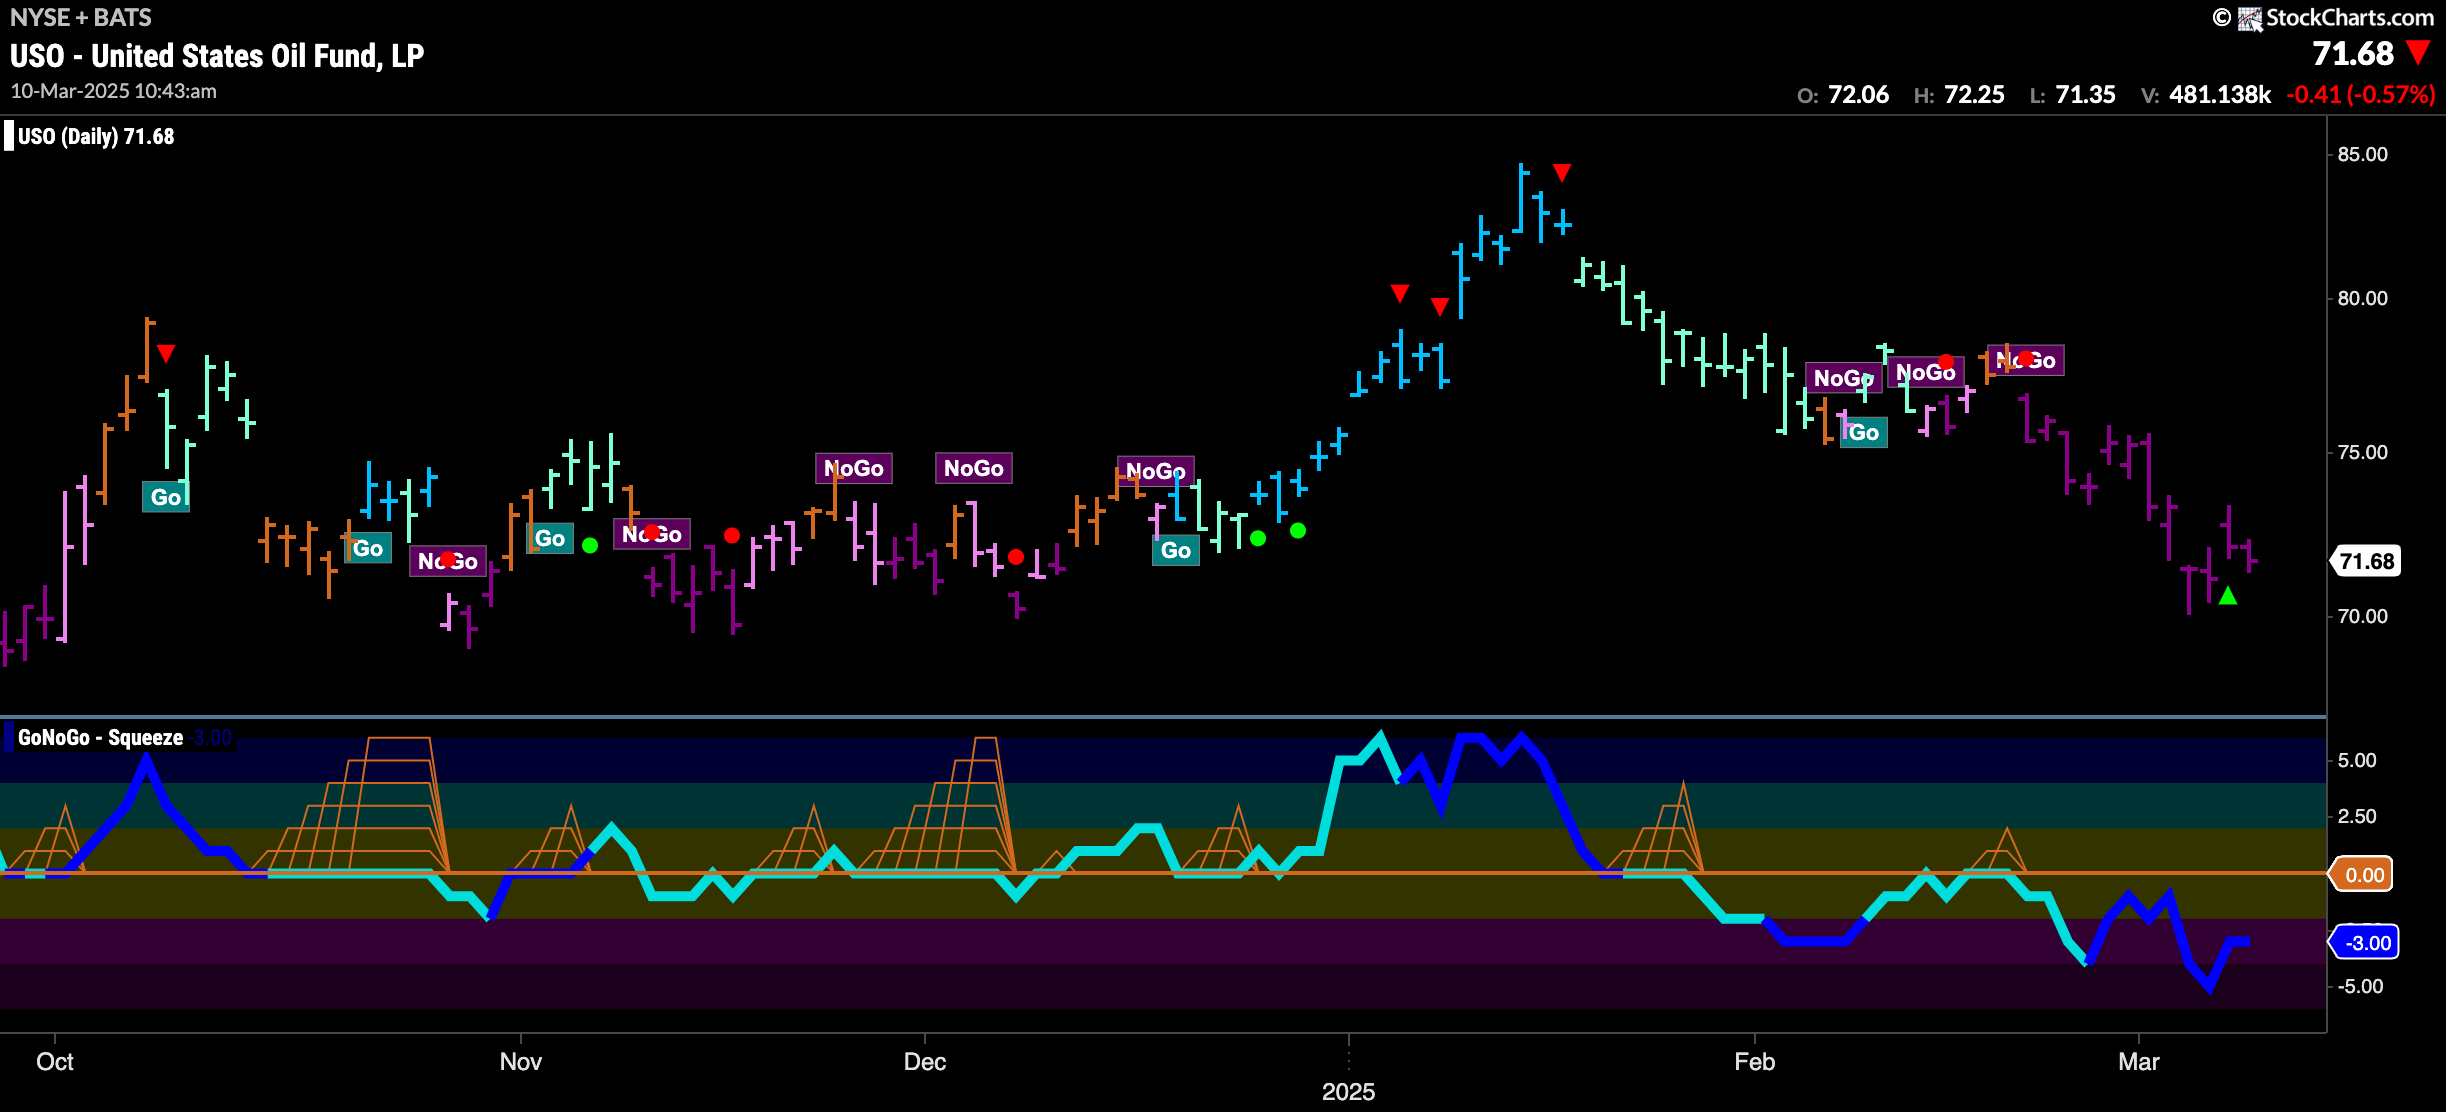
$USO Stays in Strong “NoGo” Trend
The “NoGo” trend stayed strong last week as we saw a series of lower lows and lower highs. Now, we see that price has fallen to an area of what may be natural support from lows earlier in the chart. GoNoGo Oscillator has come out of oversold territory and we see a NoGo Countertrend Correction Icon (green arrow) signaling that price may struggle to go lower in the short term.
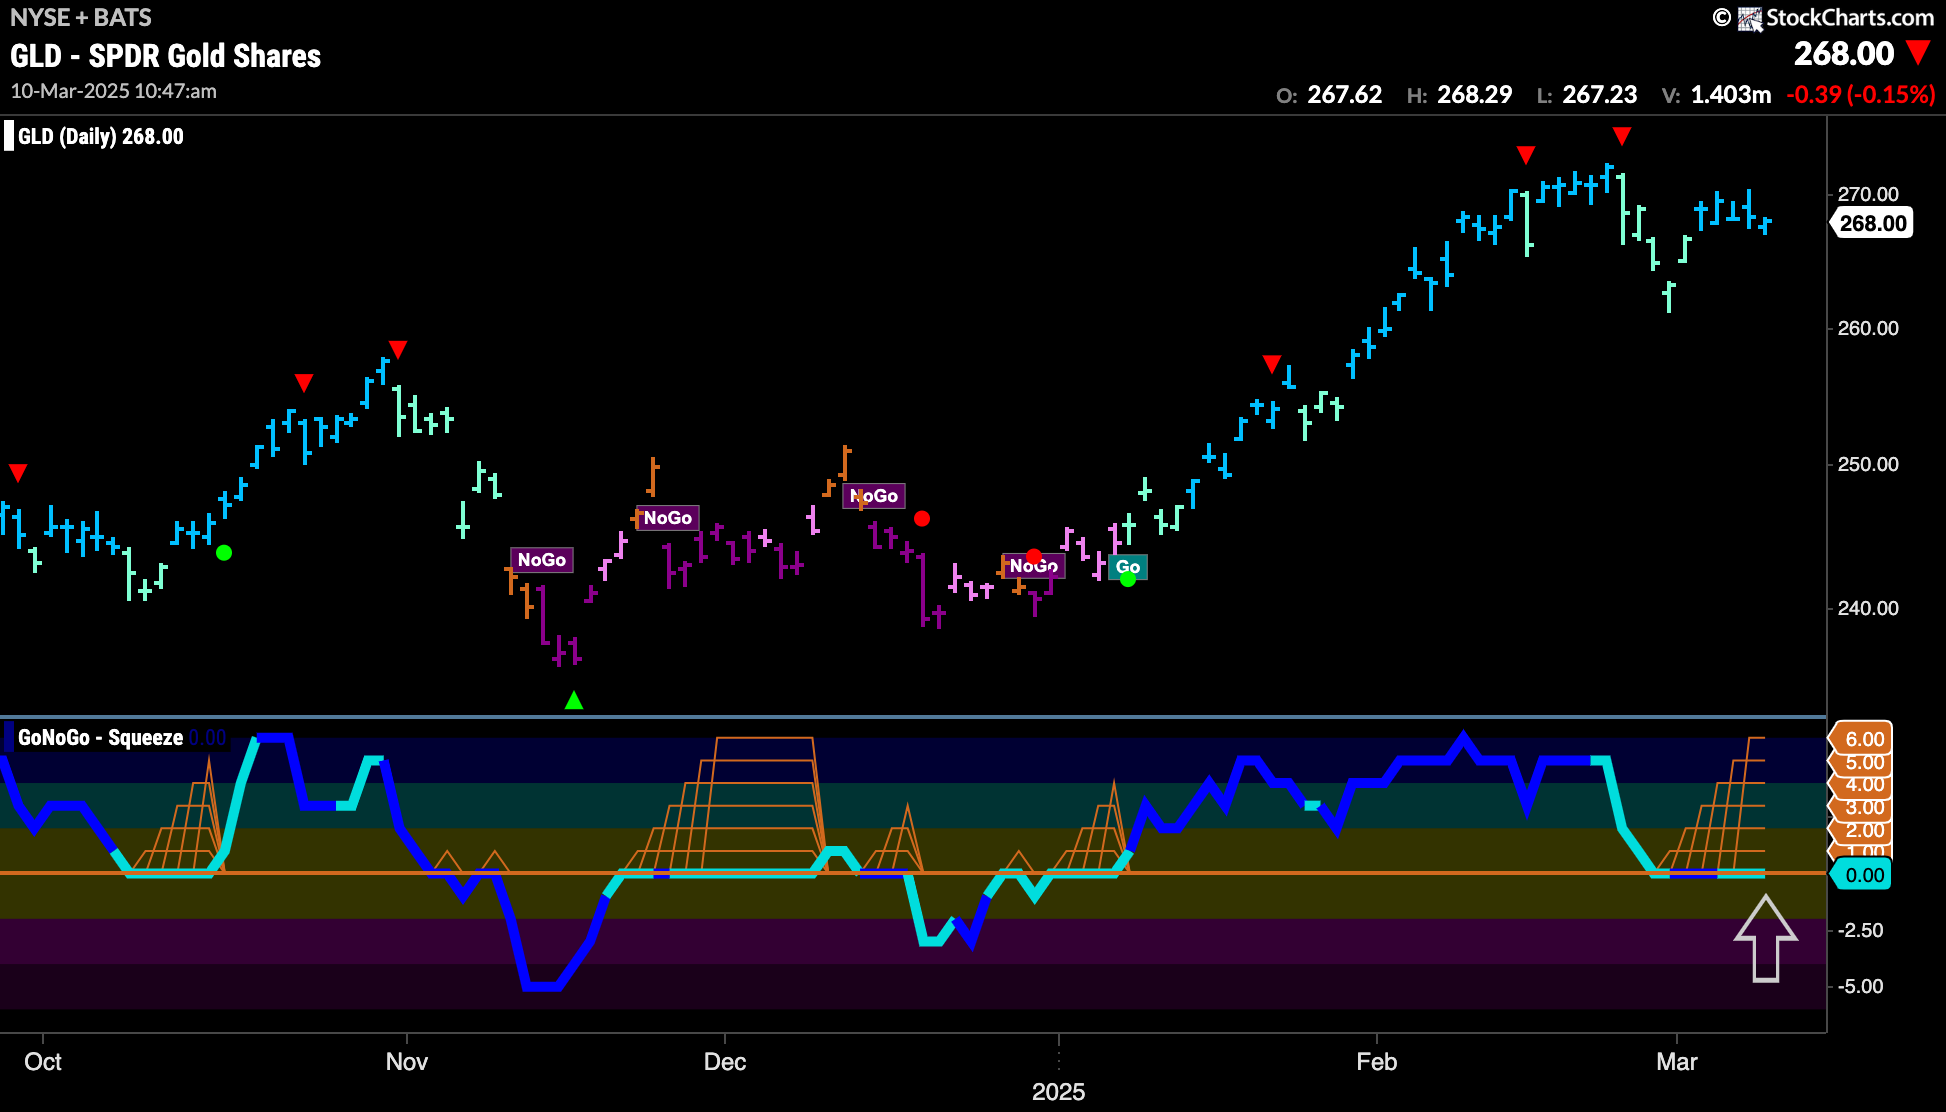
Gold Unable to Make New Highs but Trend Remains
After falling from the most recent high, price rallied and re-entered a strong “Go” trend with the indicator painting bright blue bars. During this time, we see that GoNoGo Oscillator has fell to and remained at the zero line and we see a Max GoNoGo Squeeze reflecting the tug of war between buyers and sellers at this level. We will watch closely to see in which direction the Squeeze is broken to help determine price’s next direction.
Sector RelMap
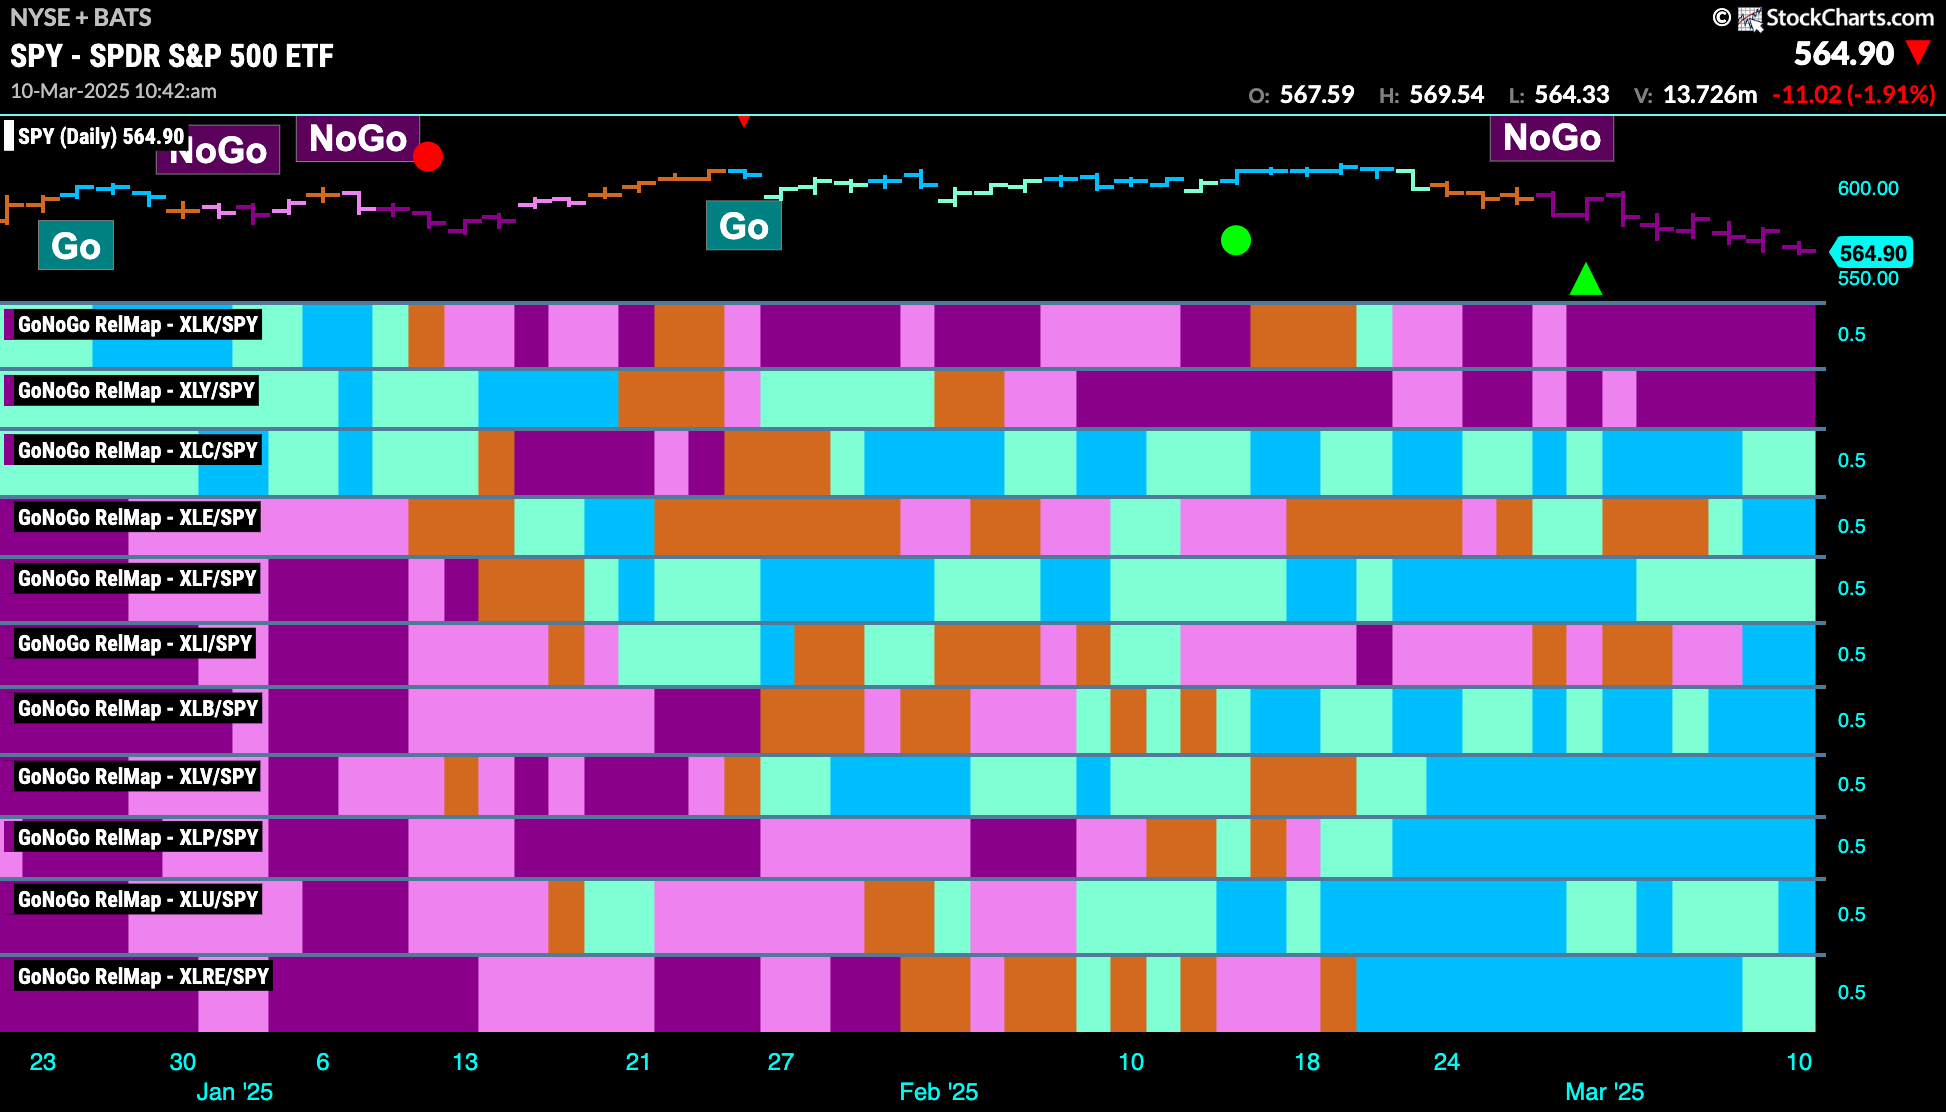
Below is the GoNoGo Sector RelMap. This GoNoGo RelMap applies the GoNoGo Trend to the relative strength ratios of the sectors to the base index. With this view we can get a sense of the relative out performance and relative underperformance of the sectors. 9 sectors are in relative “Go” trends. $XLC, $XLE, $XLF, $XLI, $XLB, $XLV, $XLP, $XLU, and $XLRE are painting relative “Go” bars.
Energy Sub-Group RelMap
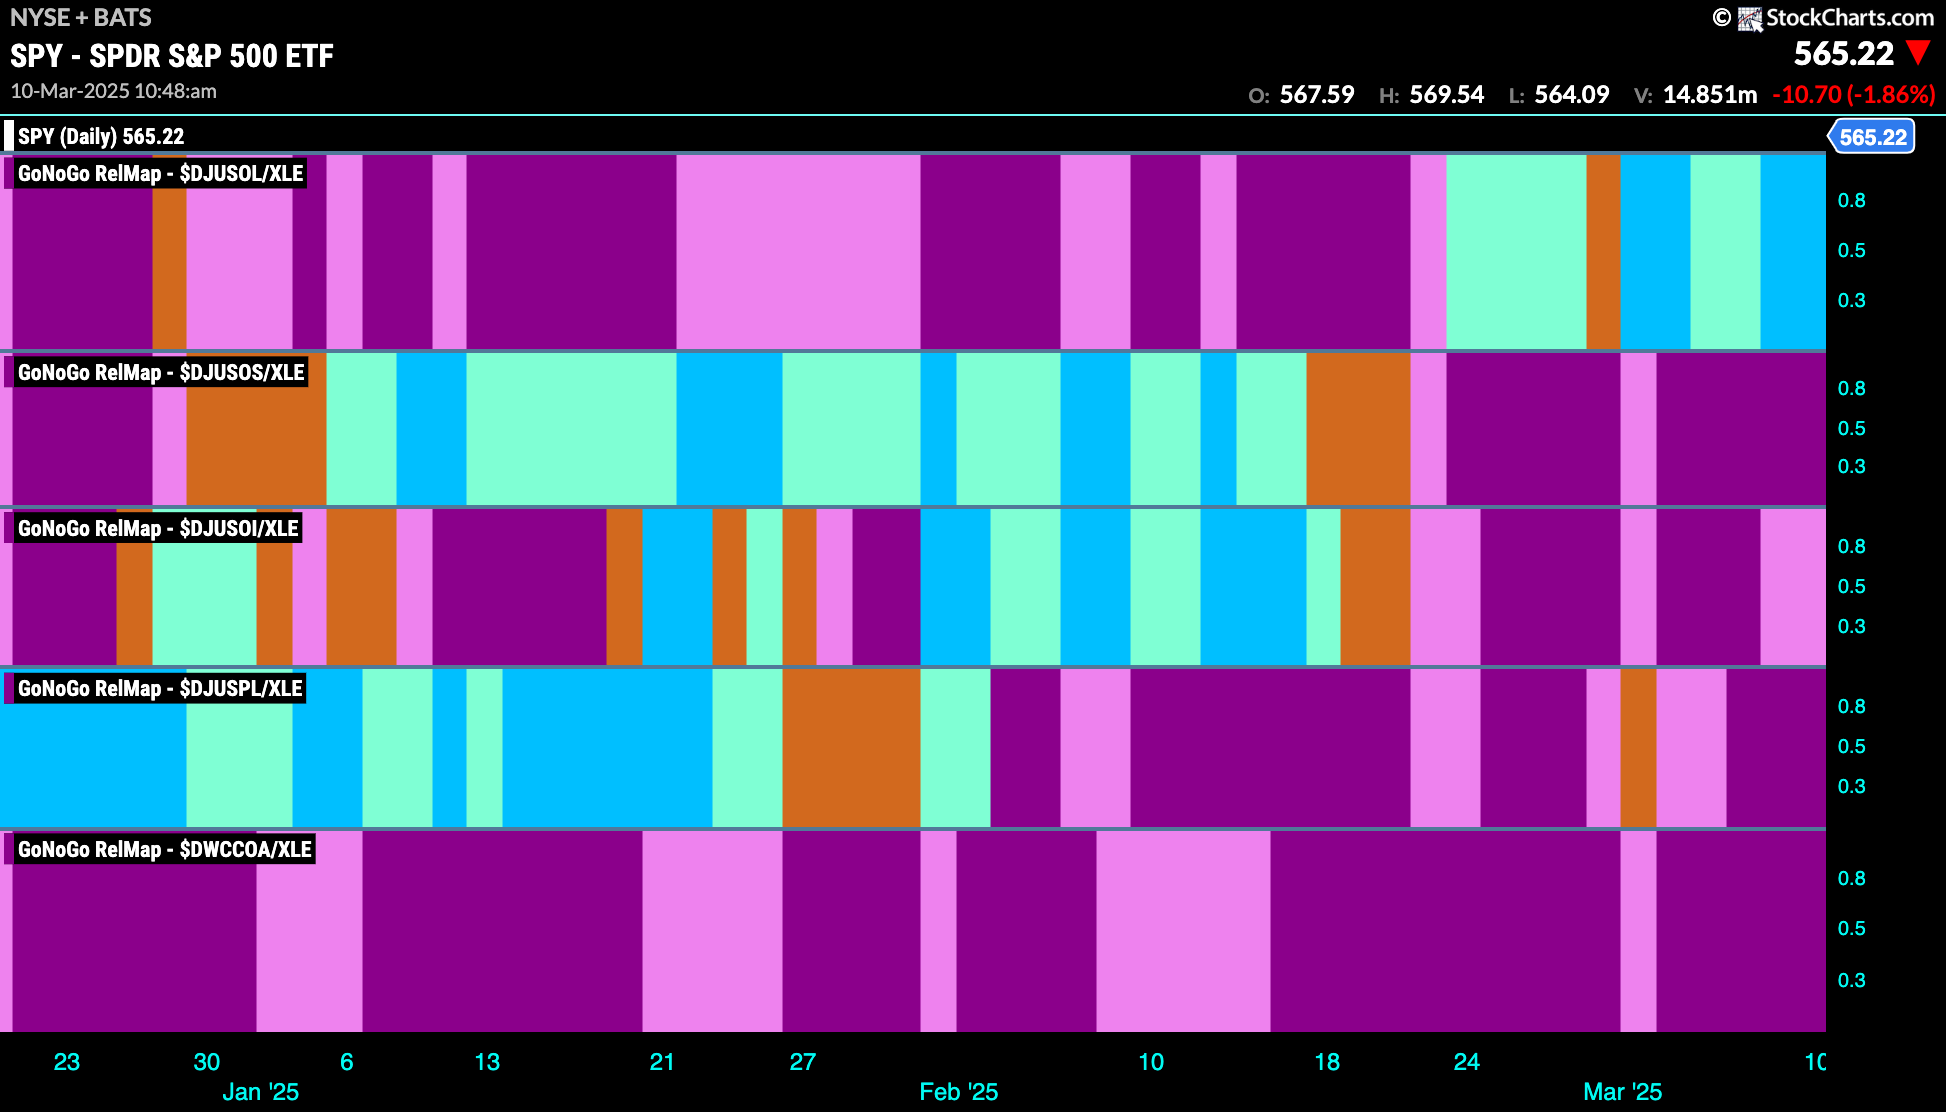
The chart below shows a relative trend breakdown of the sub groups within the energy sector this week. The Sub-Group RelMap plots the GoNoGo Trend of each sub index to the $XLE. We saw in the above GoNoGo Sector RelMap that $XLE is strong relatively speaking as it paints bright blue relative “Go” bars to the S&P 500. If we look at the breakdown of the groups in the map below we can see where that outperformance is coming from. We see strong blue “Go” bars in the 1st panel which represents the relative trend of the integrated oil and gas sub group.
$BP Looks for Support at Prior High
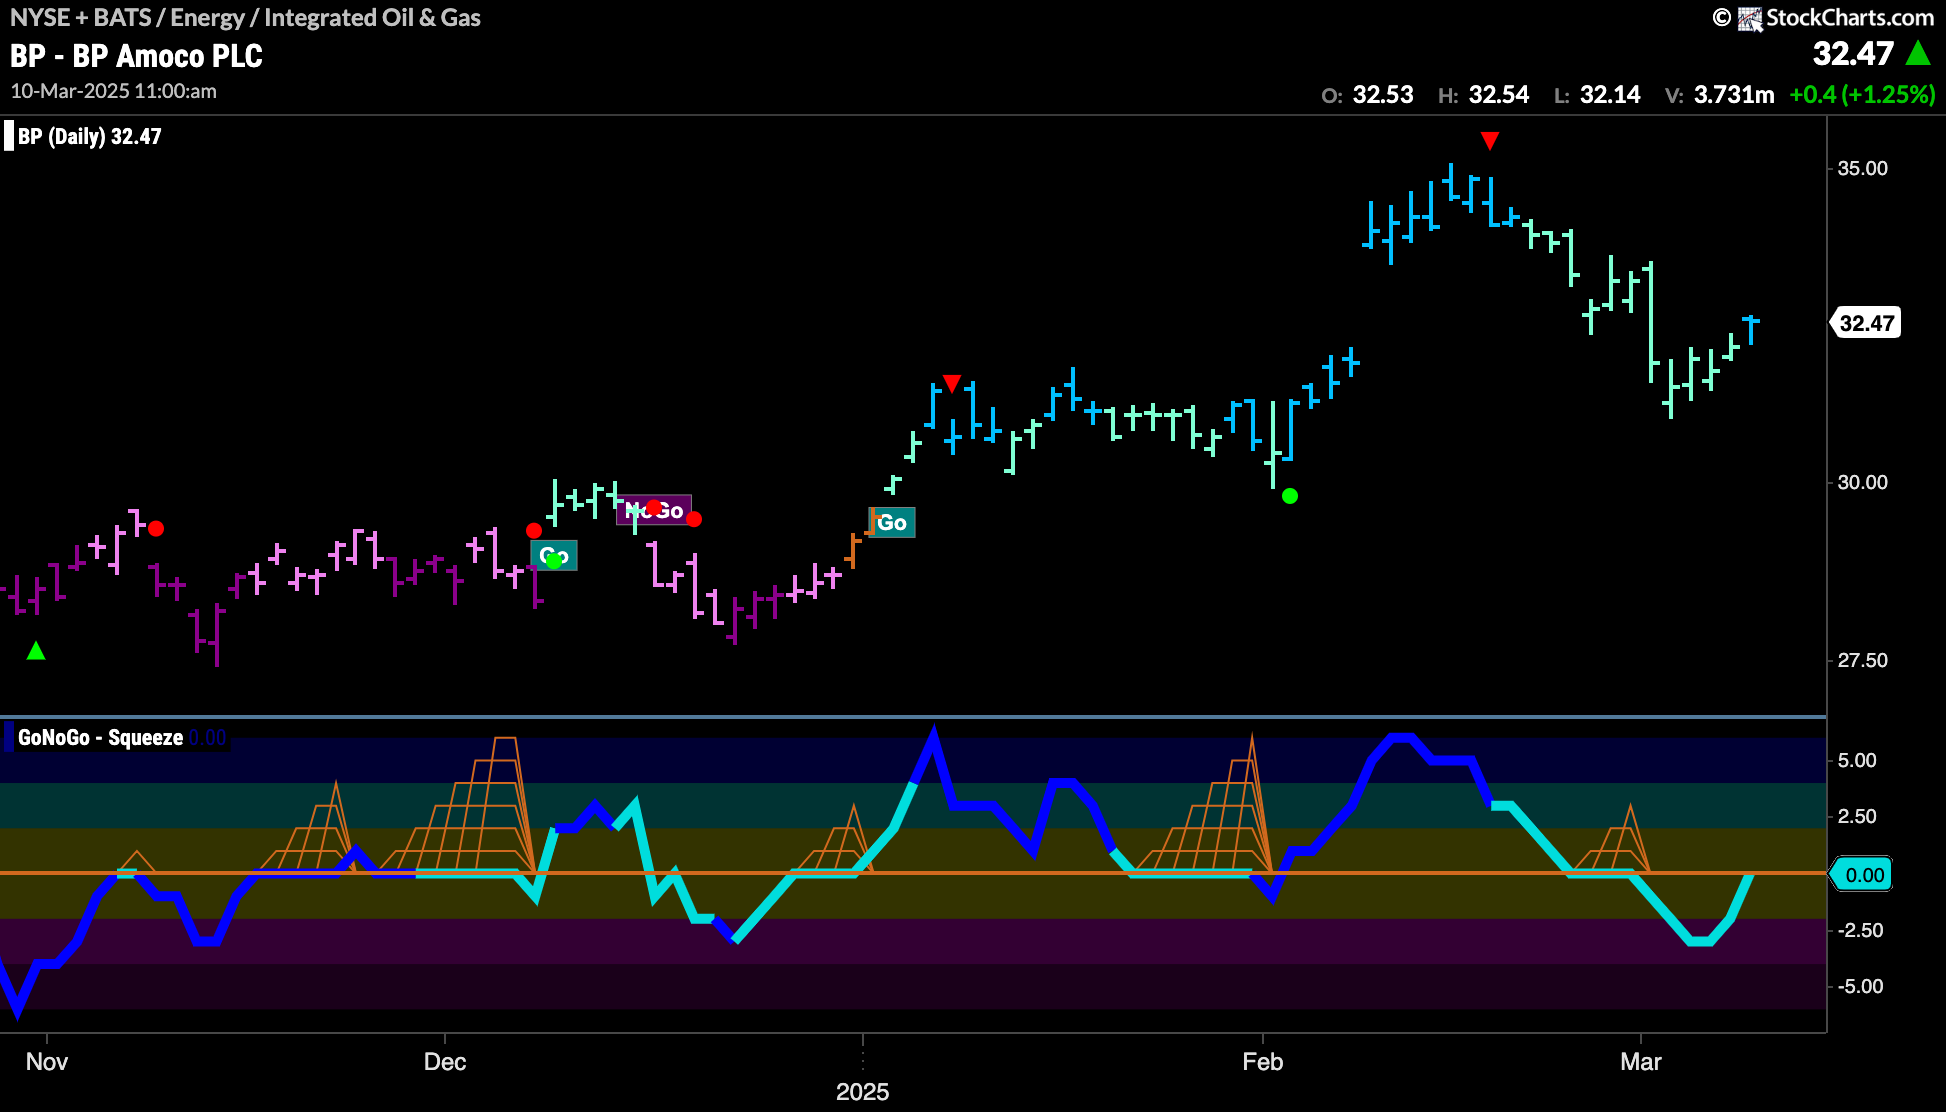
GoNoGo Trend paints a new strong blue “Go” bar as price seems to have found support at prior highs from the congestion area we see on the chart that was the beginning of this new “Go” trend. GoNoGo Oscillator has rallied back to test the zero line from below. We will watch to see if it can break back into positive territory which would show that momentum is confirming the “Go” trend again.
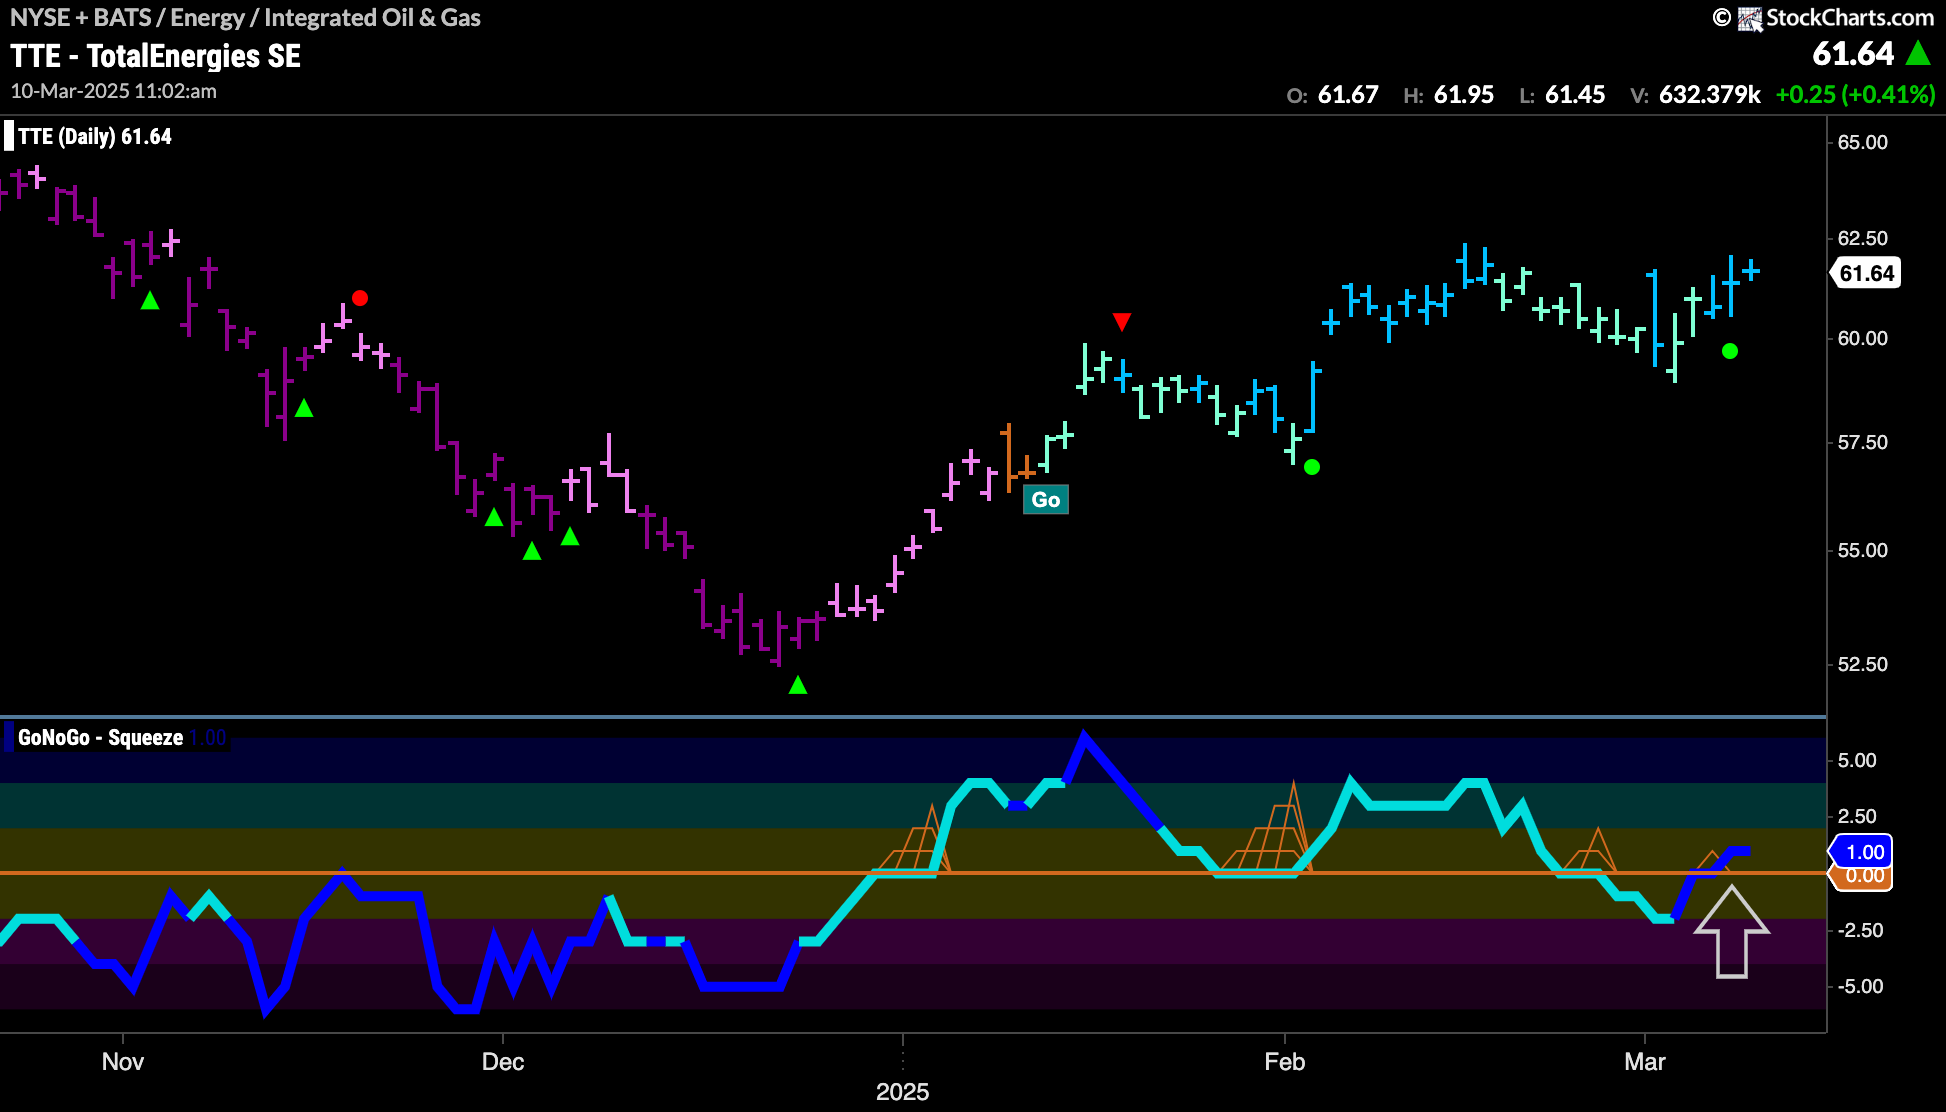
$TTE Finds Support in “Go” Trend
$TTE looks to have found support at prior high levels. This is the concept of polarity playing out. Resistance becomes support and support can become resistance. We see that this is confirmed by the GoNoGo Oscillator breaking back into positive territory on heavy volume. This triggered a Go Trend Continuation Icon (green circle) and we will look to see if this gives price the push it needs to set a new higher high.
