Yesterday was Memorial Day here in the United States. We have a short week ahead after the nation took the time to honor those that have died serving the country.
Start where you are. Use what you have. Do what you can. – Arthur Ashe
Another strong week for equities, as the S&P 500 ended the week by triggering a green trend continuation circle under price. As we noted over the weekend in our Launch Conditions Chart Pack, we continue to see relative outperformance from sectors such as materials, industrials, energy and financials. These sectors so far have shown the greatest positive earnings surprise for the second quarter. We’ll dig deeper into some financial names in this newsletter.
Welcome to your weekly Flight Path market review from GoNoGo Research.
Equities Remain Strong
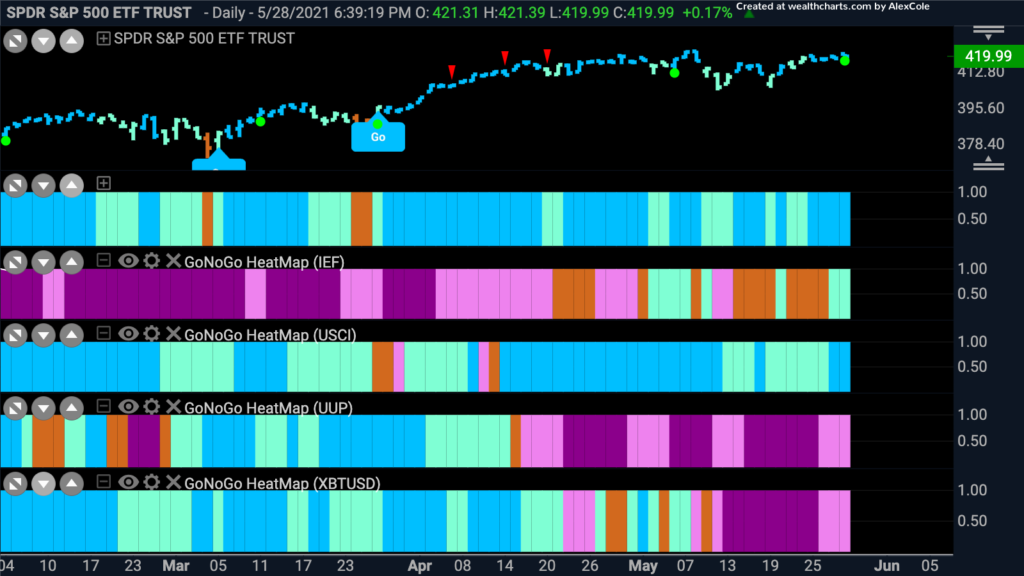
Take a look at the GoNoGo Heat Map below which offers a quick comparison of the major asset classes’ trends. Equities and commodities remain in “Go” trends, both strengthening last week. The dollar, and digital assets remain in “NoGo” trends as treasury bonds try to establish a “Go” trend of their own.
Investors Favoring Financials over Technology
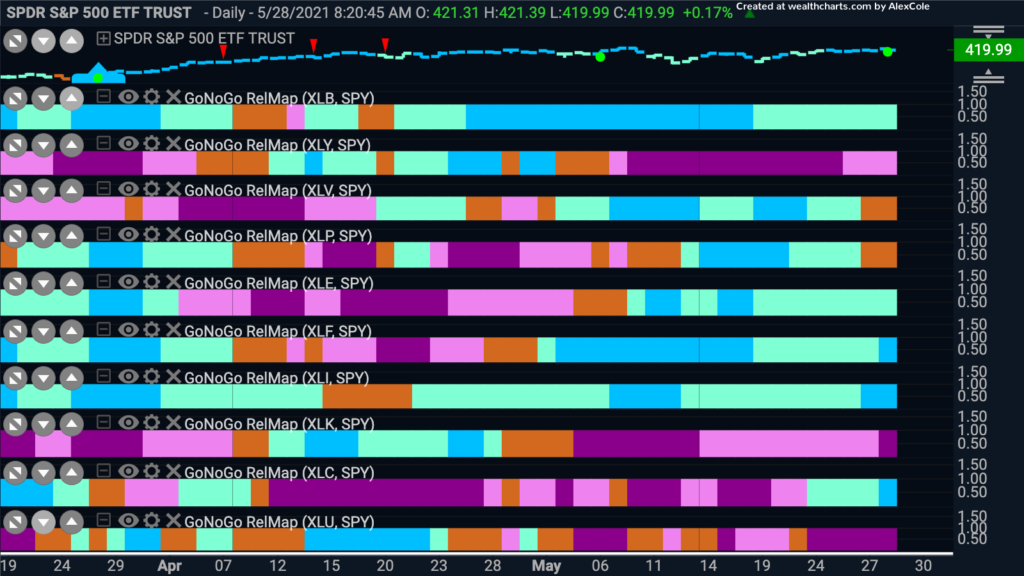
No change here in terms of what is leading and what is lagging in the equity markets. Materials, energy, financials and industrials forge ahead as consumer discretionary, technology and utilities bring up the rear.
The GoNoGo RelMap below applies the GoNoGo Trend concepts to each sector’s price ratio to the base index, the $SPY. In this way we can get a sense of the relative technical trend for each sector.
Financials Show Continued Relative Outperformance
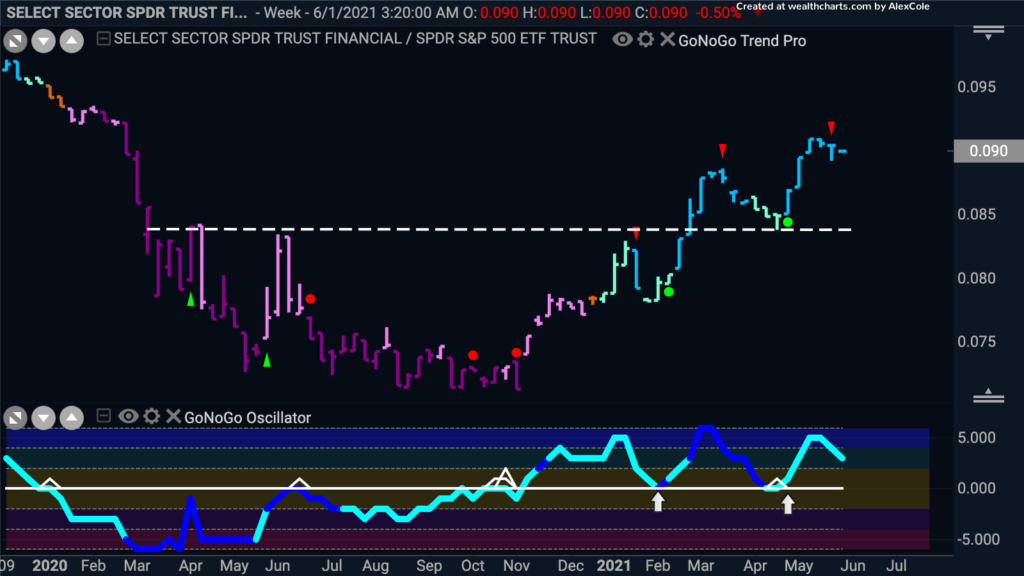
The financials sector has been helping drive markets higher now for some time. Below is a long term, weekly GoNoGo chart of the ratio of $XLF/$SPY.
- The Go trend is in place with the GoNoGo Trend painting strong blue bars
- Price has set a higher high after finding support at levels which once were resistance
- We saw the GoNoGo Oscillator break above zero ahead of the trend change in price
- Since establishing a “Go” trend we have seen each pullback supported by the GoNoGo Oscillator bouncing off the zero line
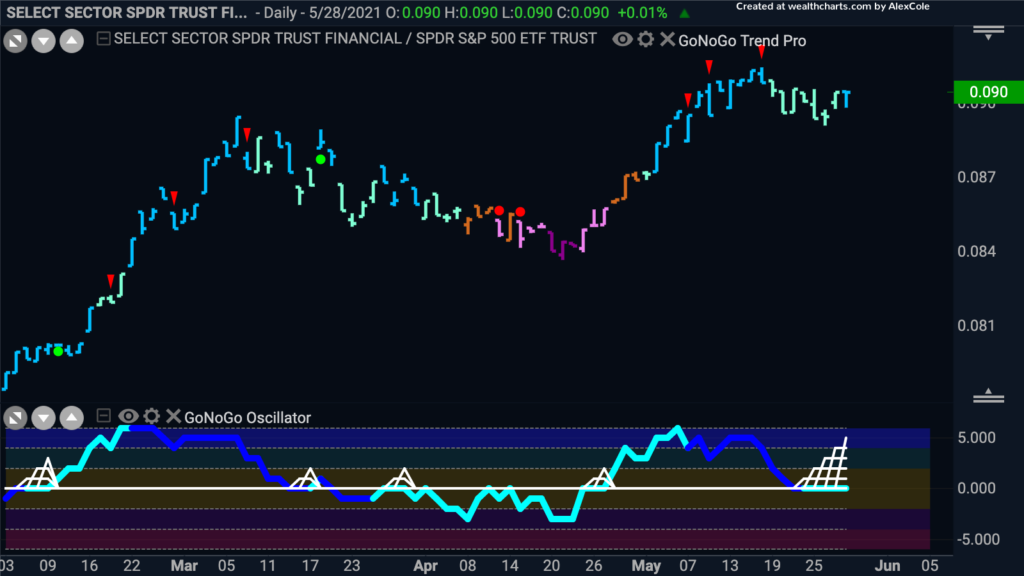
We can step down in timeframe to see the technical conditions on a shorter time horizon.
- After a rally to a new high, price has consolidated mostly sideways
- However, the “Go” trend is in place, with the last bar of week a strong blue bar
- This consolidation has caused the GoNoGo Oscillator to fall to and ride the zero line
- We will look to see if the oscillator can break out of the Squeeze into positive territory which would signal momentum in the direction of the trend
Troubling Times Still for Technology
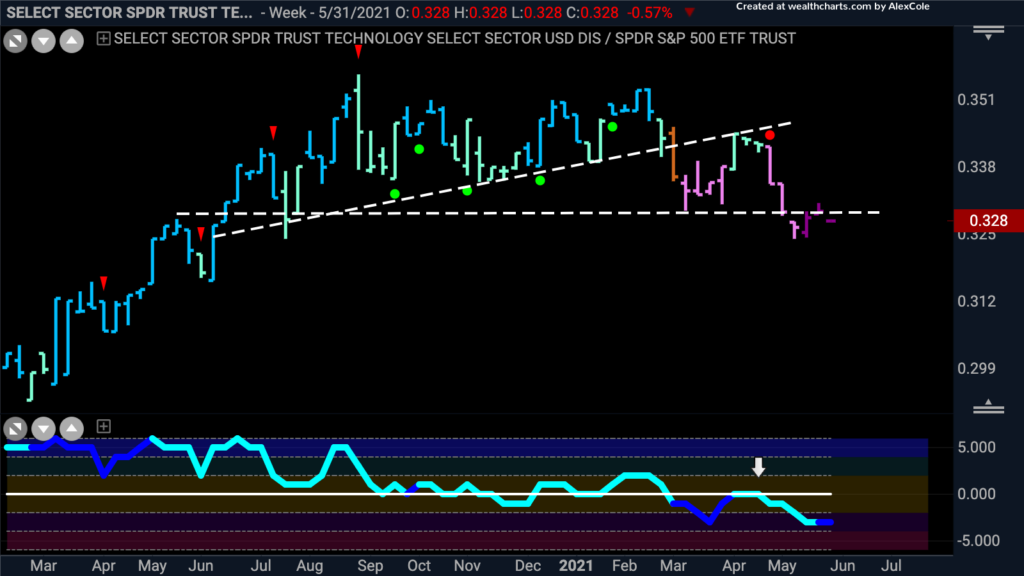
At the other end of the relative strength spectrum, the chart below shows the weekly GoNoGo chart of the $XLK/$SPY.
- Price has made a lower low and a lower high in the last few months
- This price action has coincided with an inability to hold support levels that come from the trend lines on the chart
- During the sideways consolidation that we saw for several months, the GoNoGo Oscillator hovered around the zero line showing a lack of enthusiasm from market participants
- At the last lower high, the oscillator was rejected by the zero and price rolled over, the NoGo Seems to have strengthened
Below is the daily chart for the same ratio, and so we can analyze the GoNoGo Trend of the relationship between technology and the market on a shorter time frame.
- The trend is a “NoGo” although price has rallied mostly over the last week
- The countertrend rally pushed price up against resistance from the lows of March. This is the concept of polarity in full effect
- Although the GoNoGo Oscillator has broken above zero but has already fallen back. It will be important to watch the oscillator here

Fifth Third Bancorp Ready to Move Higher?
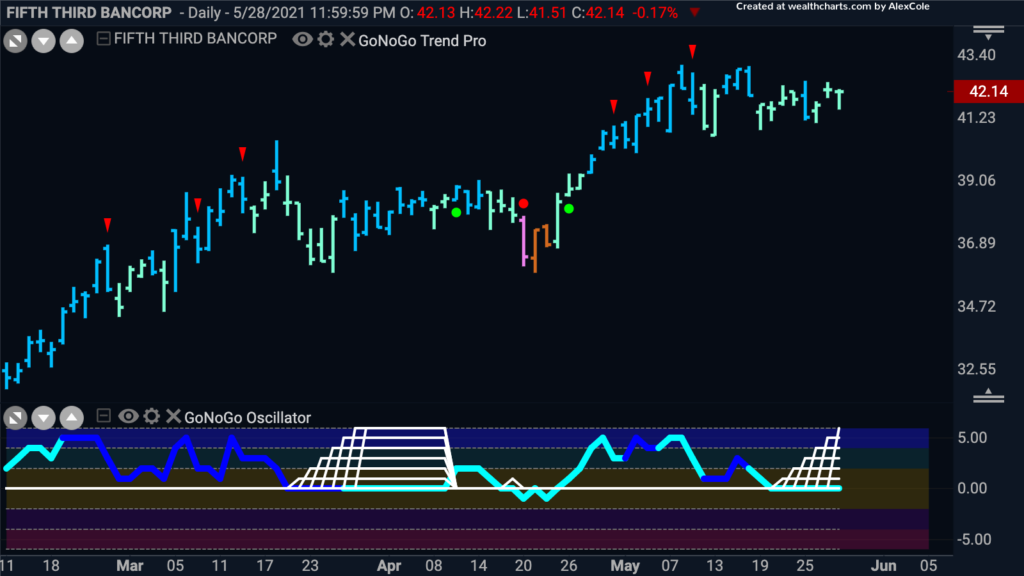
So let’s take a look at some financial companies to see if there are opportunities to capitalize on this sector strength. Below is a daily GoNoGo chart of Fifth Third Bancorp, a bank and financial holding company.
- GoNoGo “Go” trend is in place but currently painting weaker aqua bars
- This consolidation has caused the GoNoGo Oscillator to fall to zero where it is currently finding support by riding the zero line
- If the GoNoGo Oscillator can rally into positive territory that would trigger a Go Trend Continuation icon to appear under the price bar
Ally Financial Inc in Very Strong “GO” Trend
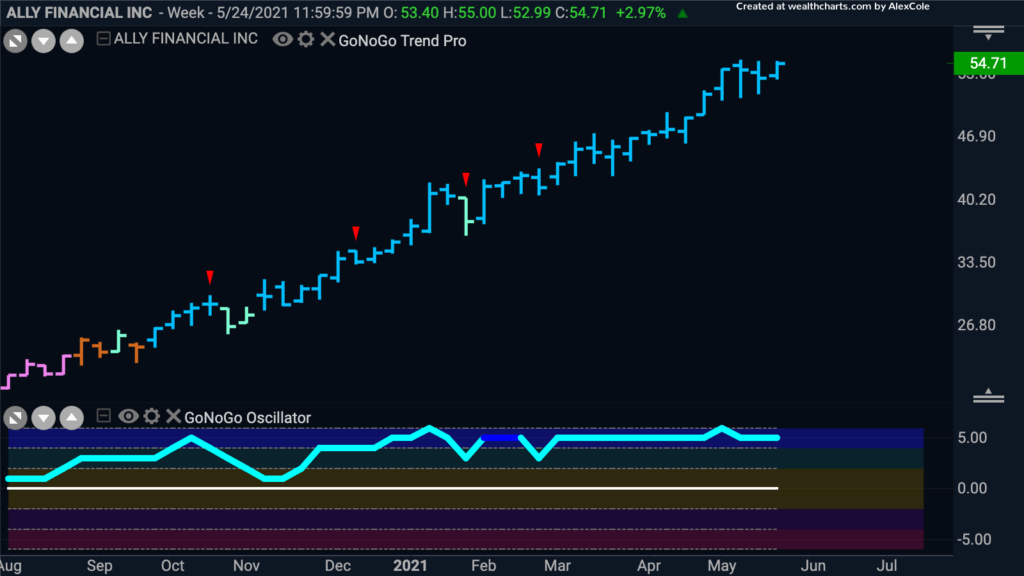
Staying with the financials sector, the below chart is a weekly GoNoGo chart of Ally Financial Inc. Ally Financial Inc is a financial holding company that offers a wide range of digital financial services and insurance products to automotive dealerships and consumers.
- It’s not often you see prices move like this. In fact, we teach that it is unreasonable to expect prices to move in a straight line higher!
- The “Go” trend is incredibly strong with barely an aqua bar in sight
- The GoNoGo Oscillator has been in positive territory and even overbought much of the time, indicating extreme market enthusiasm
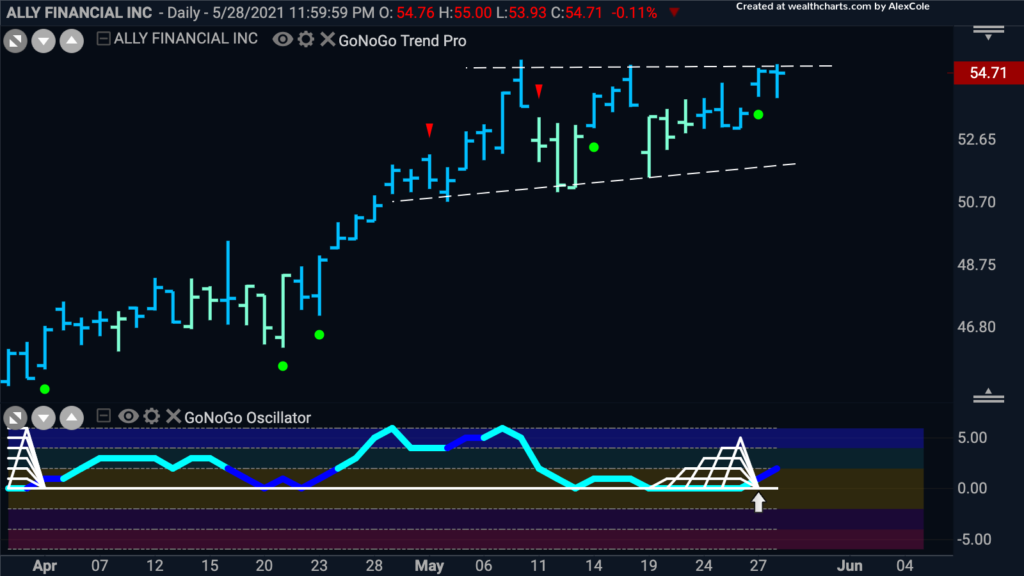
Looking at the daily chart, we can ask if there are still opportunities to participate in the trend.
- The GoNoGo Trend is painting strong blue bars as price approaches the upper bound of an ascending triangle
- We have seen Go Trend Continuation icons during this consolidation that offer low risk entries
- As price has consolidated in this pattern, the GoNoGo Oscillator has mostly been riding the zero line, showing that investors have taken a pause
- A GoNoGo Squeeze was broken to the upside and so we can expect price to make a serious attack on the upper bound of this triangle
Apple Struggling to Bear the Weight of Technology Under Performance
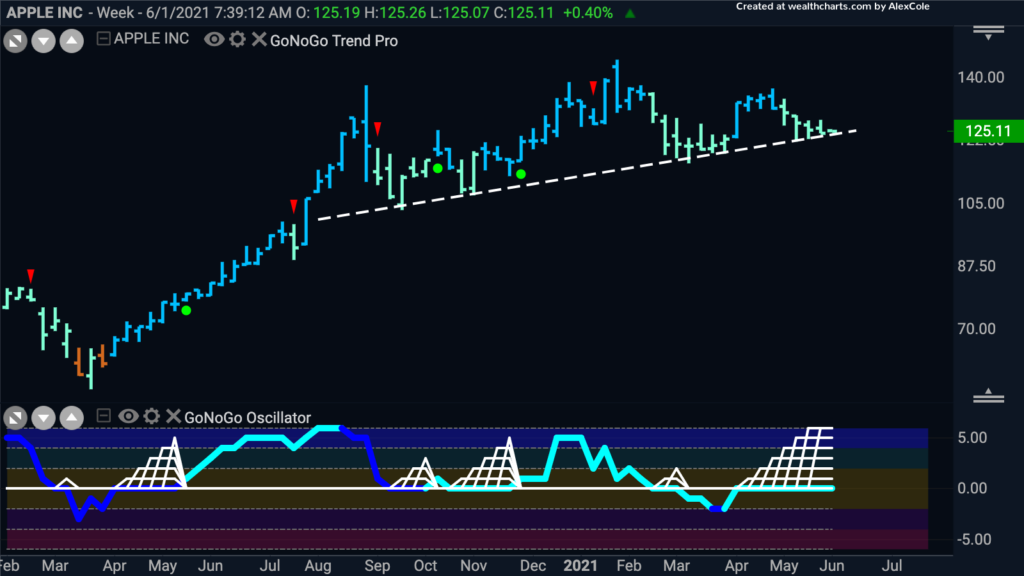
The long term chart of Apple shows the “Go” trend in place but with some early signs of deterioration.
- GoNoGo “Go” trend is in place but currently painting weaker aqua bars after price failed to make a higher high
- After briefly breaking below zero, (not a good sign in a “Go” trend) the GoNoGo Oscillator has been riding the zero line showing uncertainty causing the GoNoGo Squeeze to rise to its max
- We will need to see the oscillator find support at zero and rally into positive territory if this trend is to persist
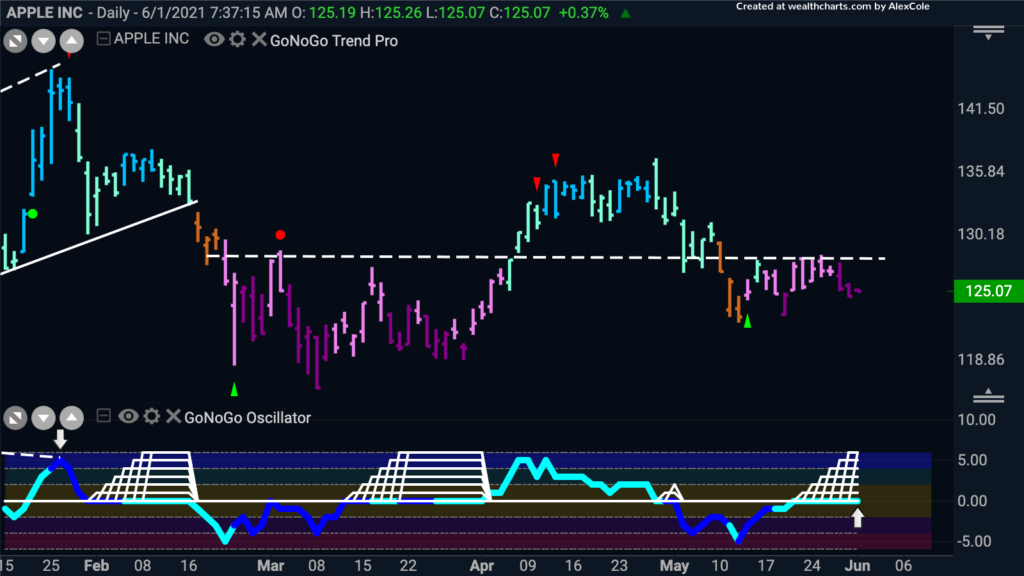
Drilling down into a daily GoNoGo Chart we can see more signs of deterioration for the technology giant.
- GoNoGo “Go” trend is a “NoGo” and strengthened to end the week
- Price was turned away from resistance where there is plenty of supply, as we saw in March
- After breaking below zero on heavy volume a few weeks ago, the GoNoGo Oscillator is riding the zero line allowing a GoNoGo Squeeze to start to build
- We will watch to see the oscillator from this point and if it gets turned away into negative territory then that would trigger a low risk entry into the “NoGo” trend (red circle) to appear above price
