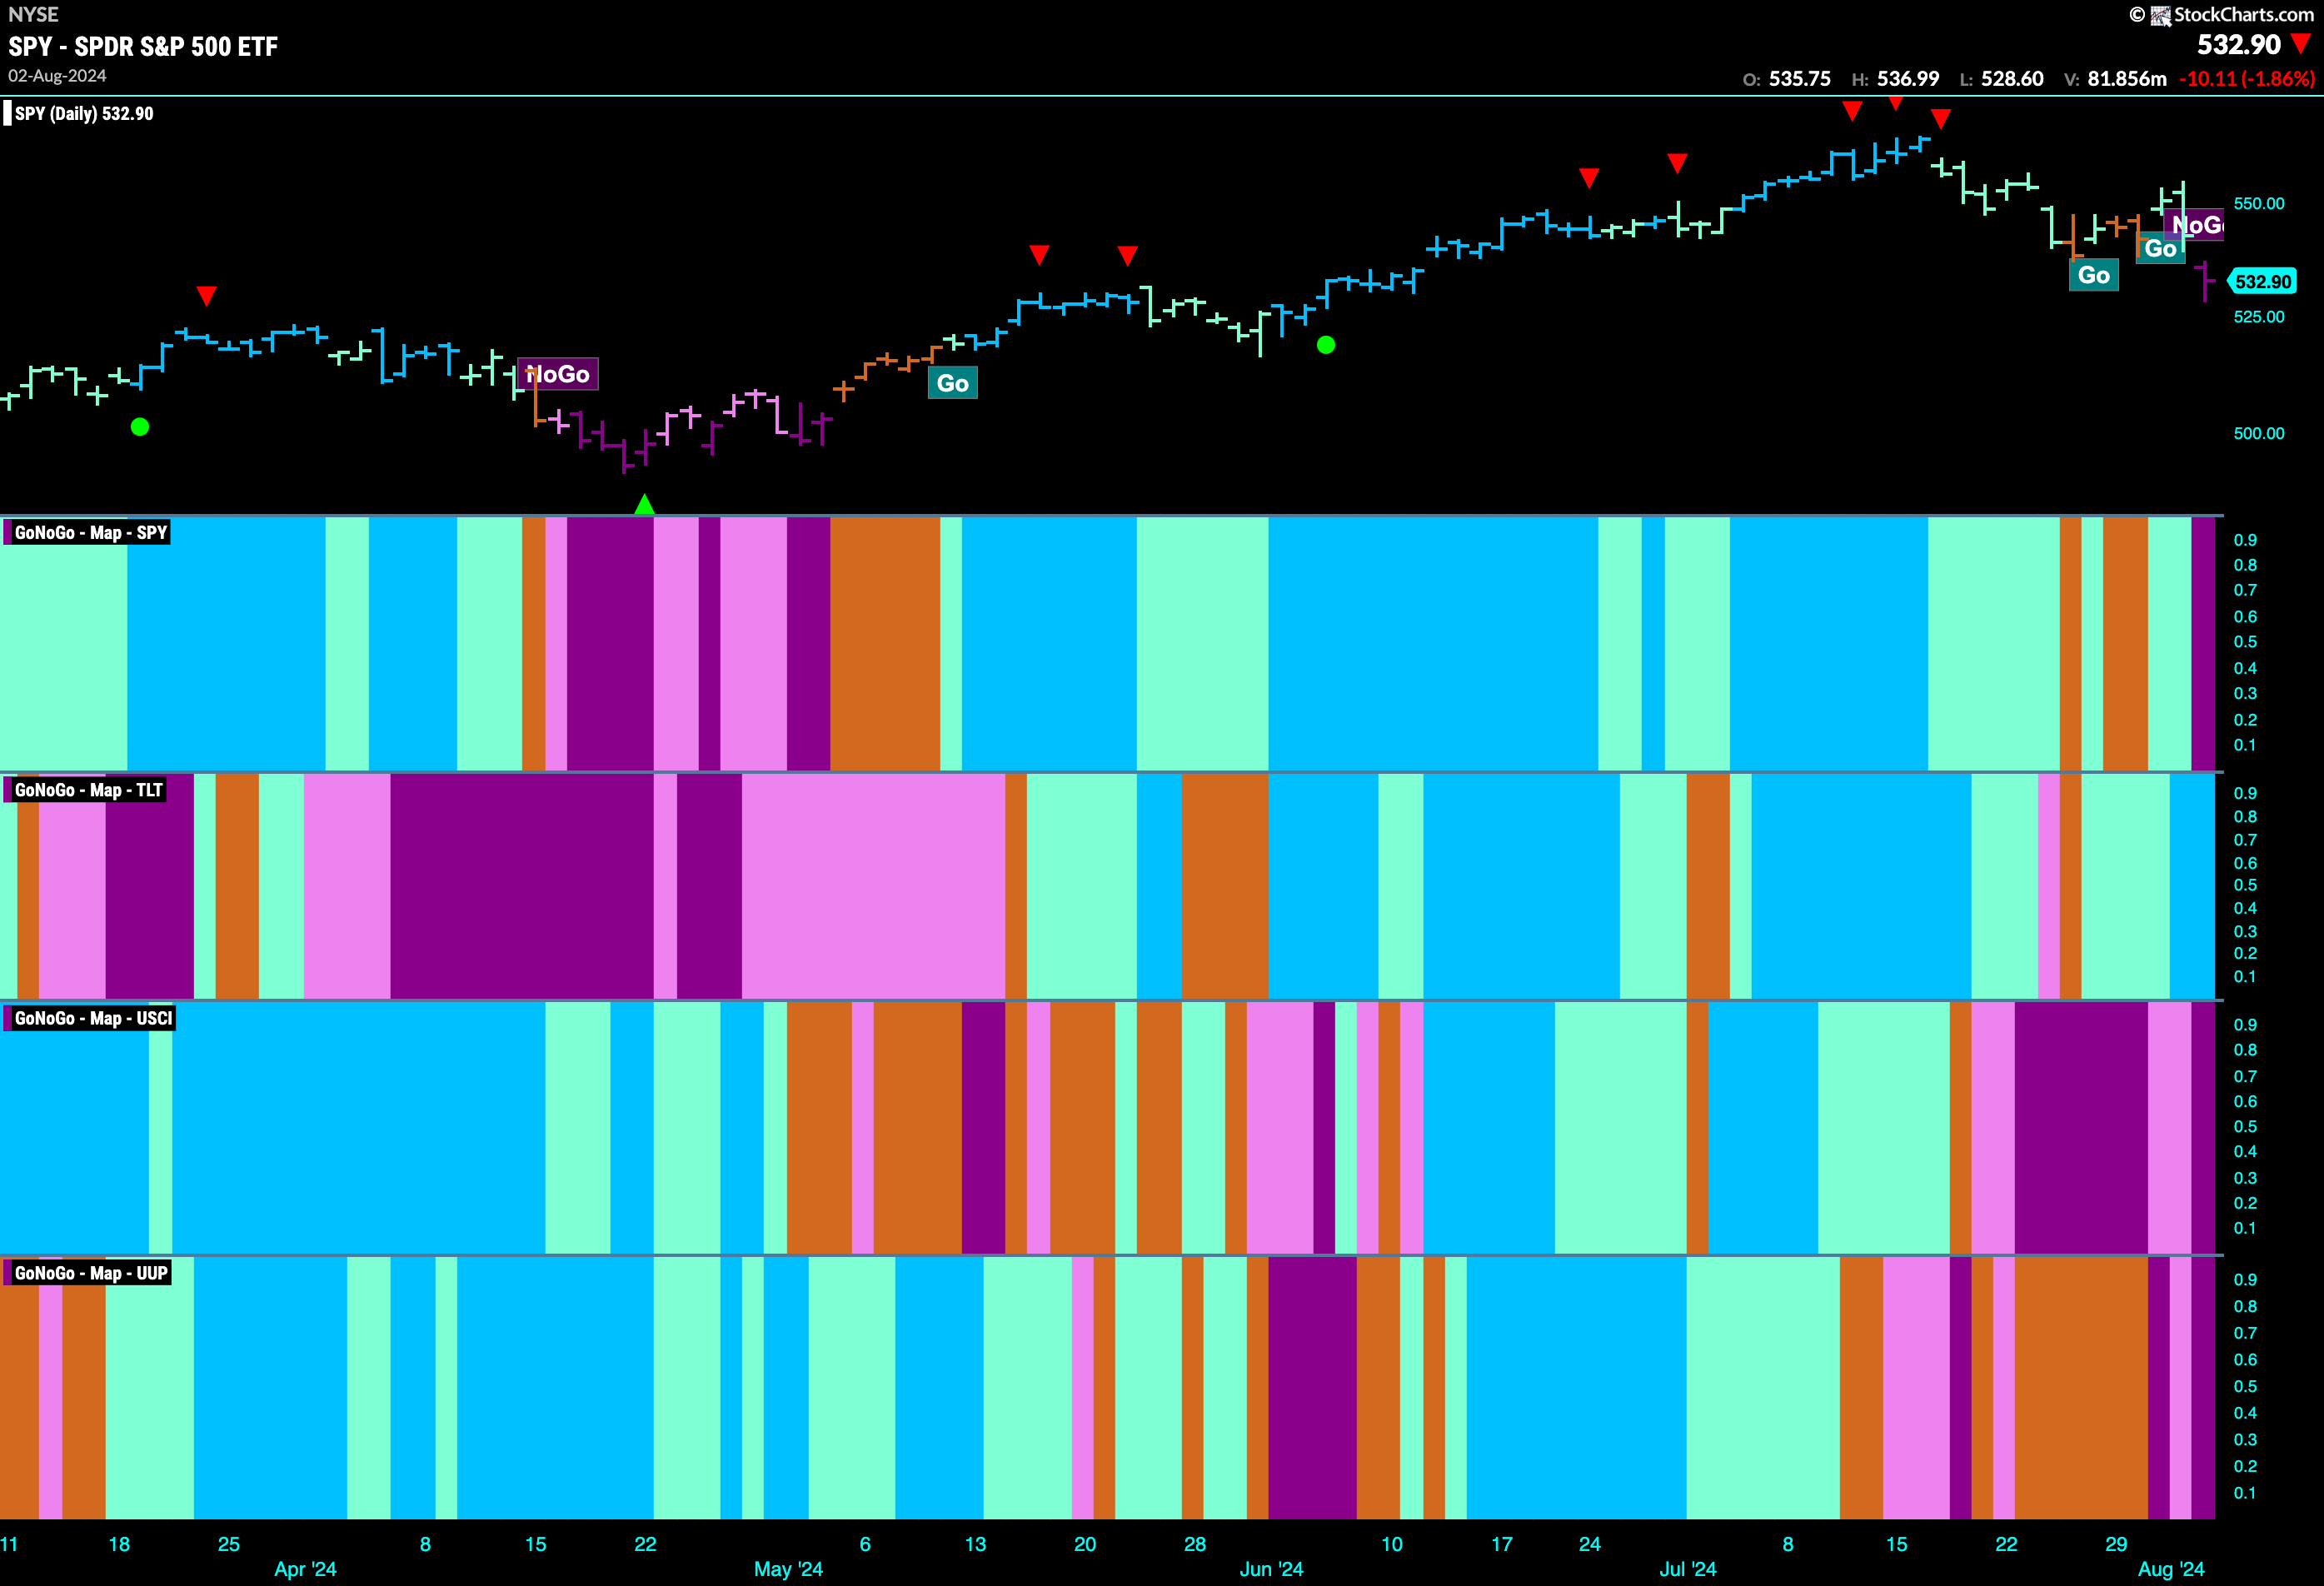
Good morning and welcome to this week’s Flight Path. Equities could not hold onto “Go” colors any longer and we saw a strong purple “NoGo” bar as the trend changed on the last bar of the week. GoNoGo Trend painted strong blue “Go” bars for treasury bond prices while the trend remained a “NoGo” for U.S. commodities and the dollar, both painting strong purple bars as the week came to a close.
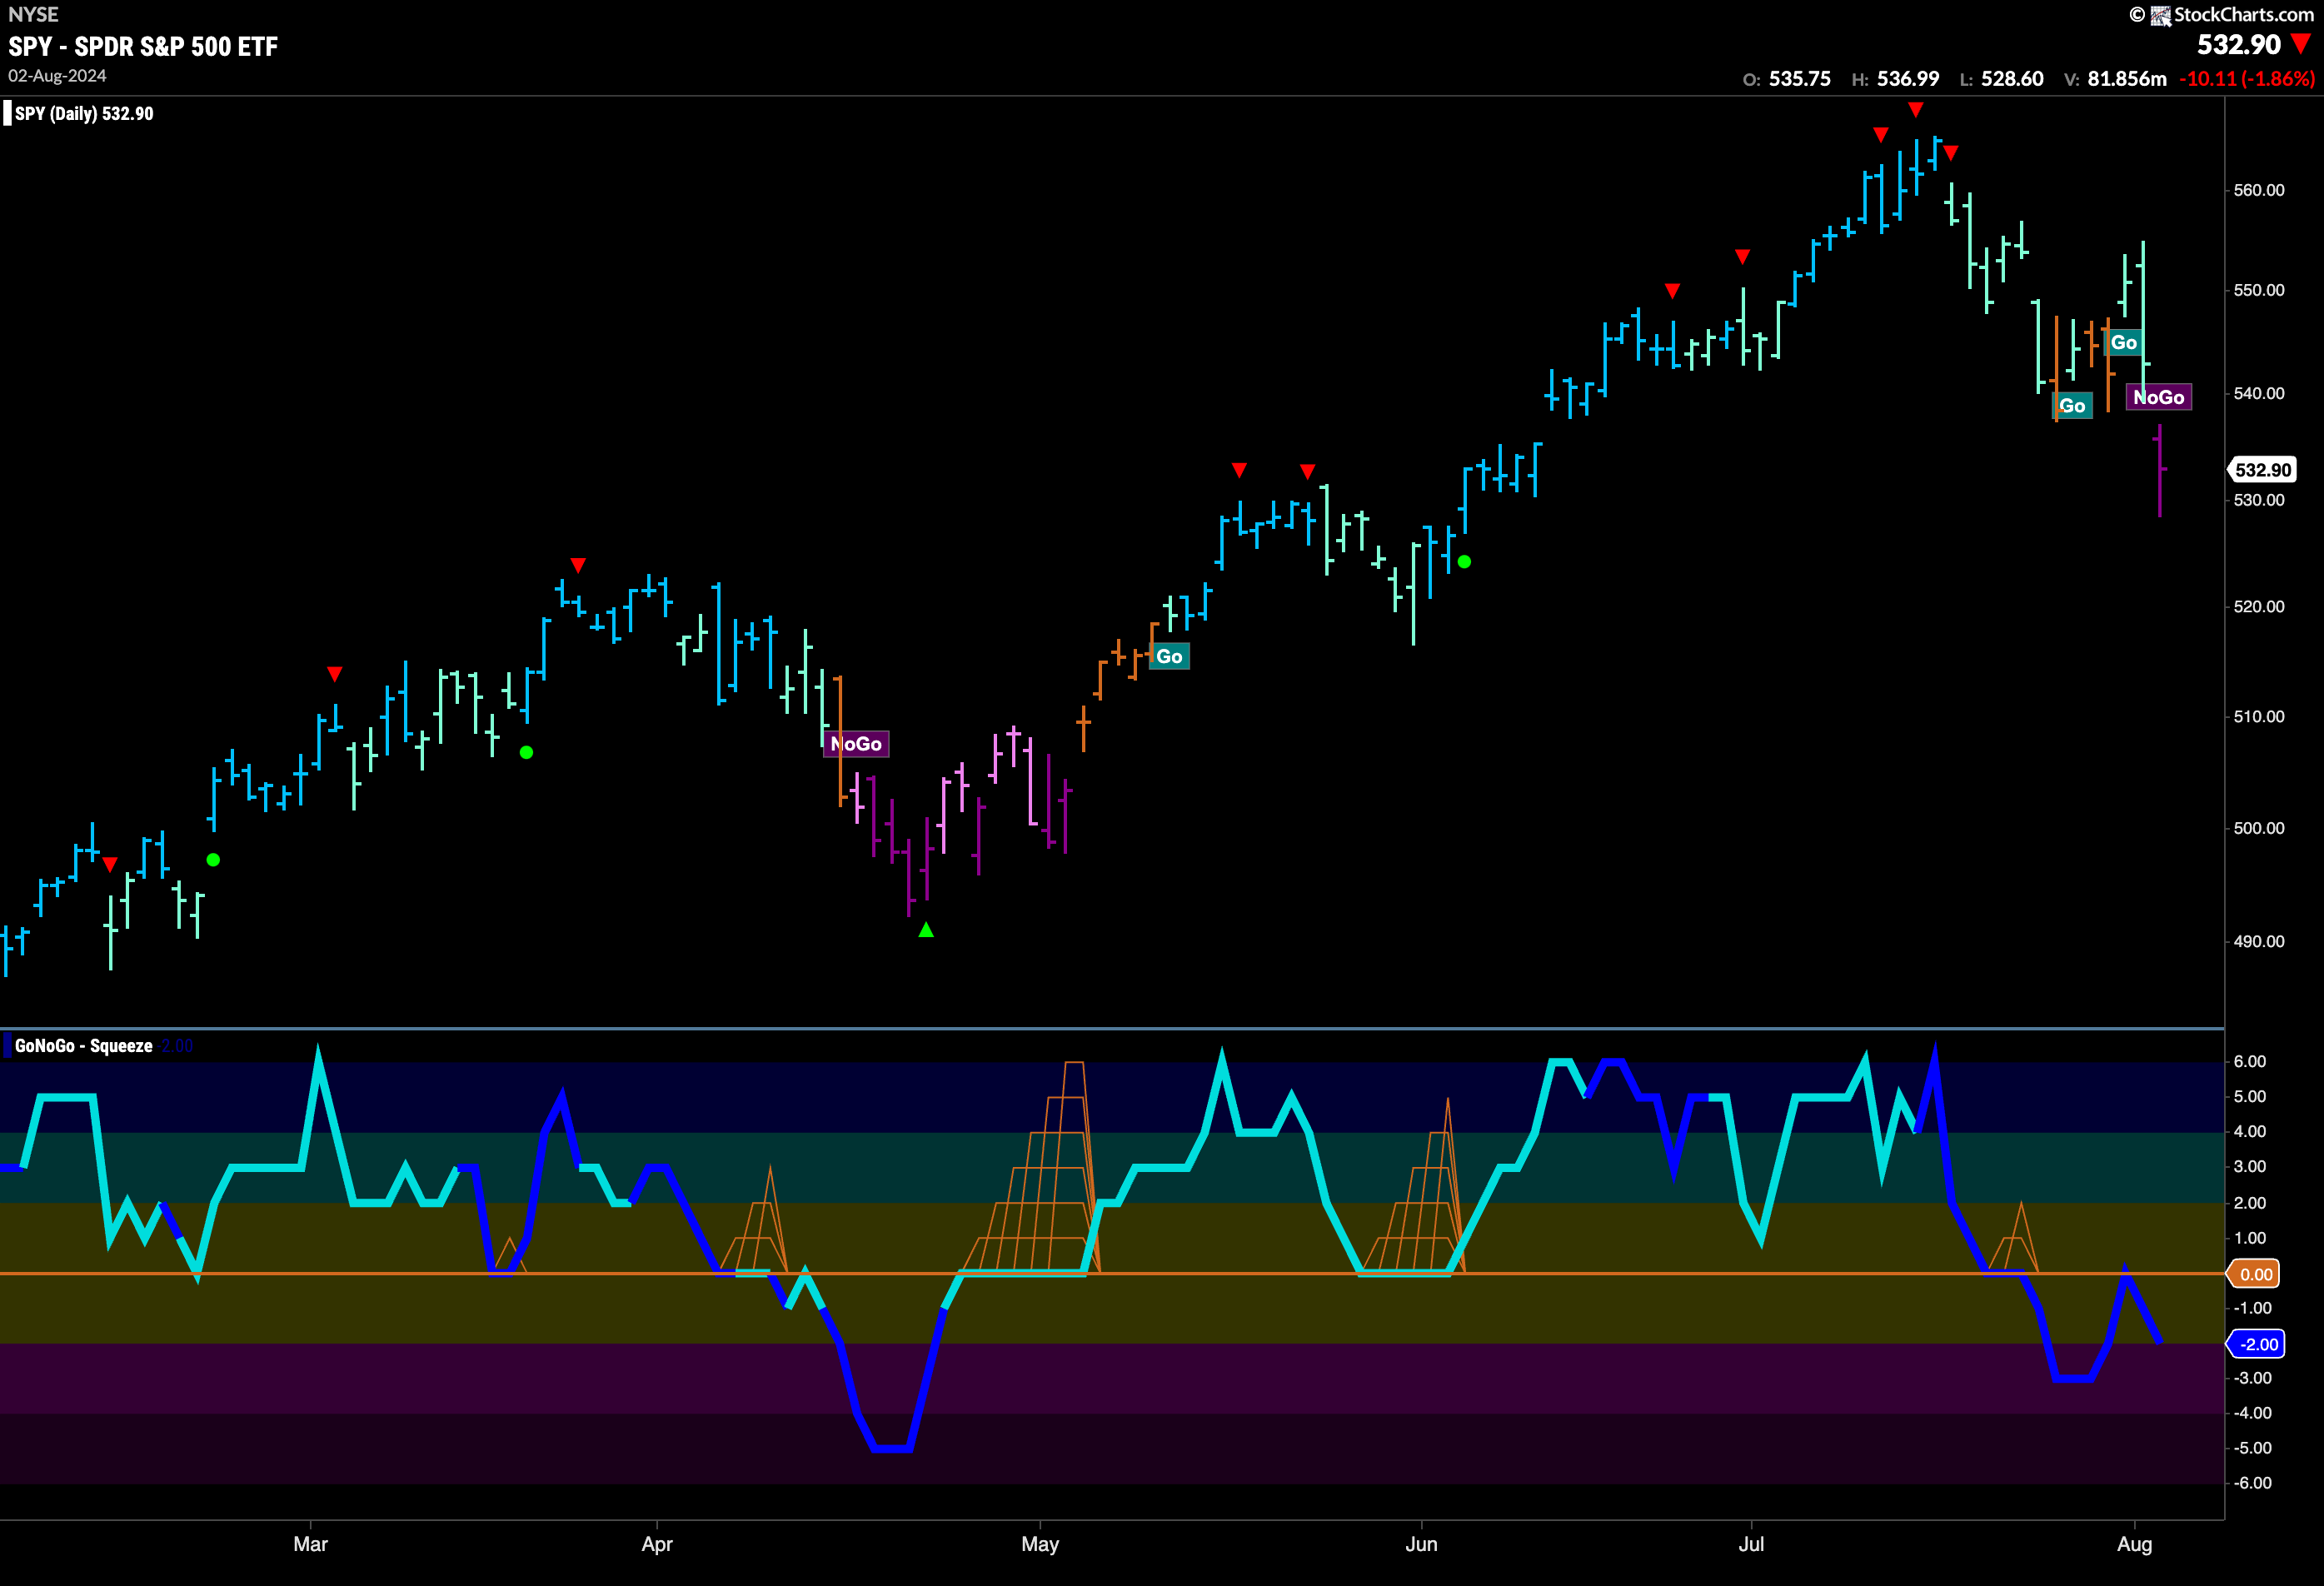
$SPY Falls into Strong “NoGo” Trend
Price gapped lower on Friday, and GoNoGo Trend painted a first strong “NoGo” bar. This came after a week where GoNoGo Oscillator had been below zero on heavy volume. Later in the week we saw the oscillator get rejected at that level as more sellers entered the market. We had also seen uncertainty in the trend with several amber “Go Fish” bars sprinkled in with the weaker aqua trend color. We will watch to see if the oscillator falls further into negative territory this week which would add downward pressure on price.
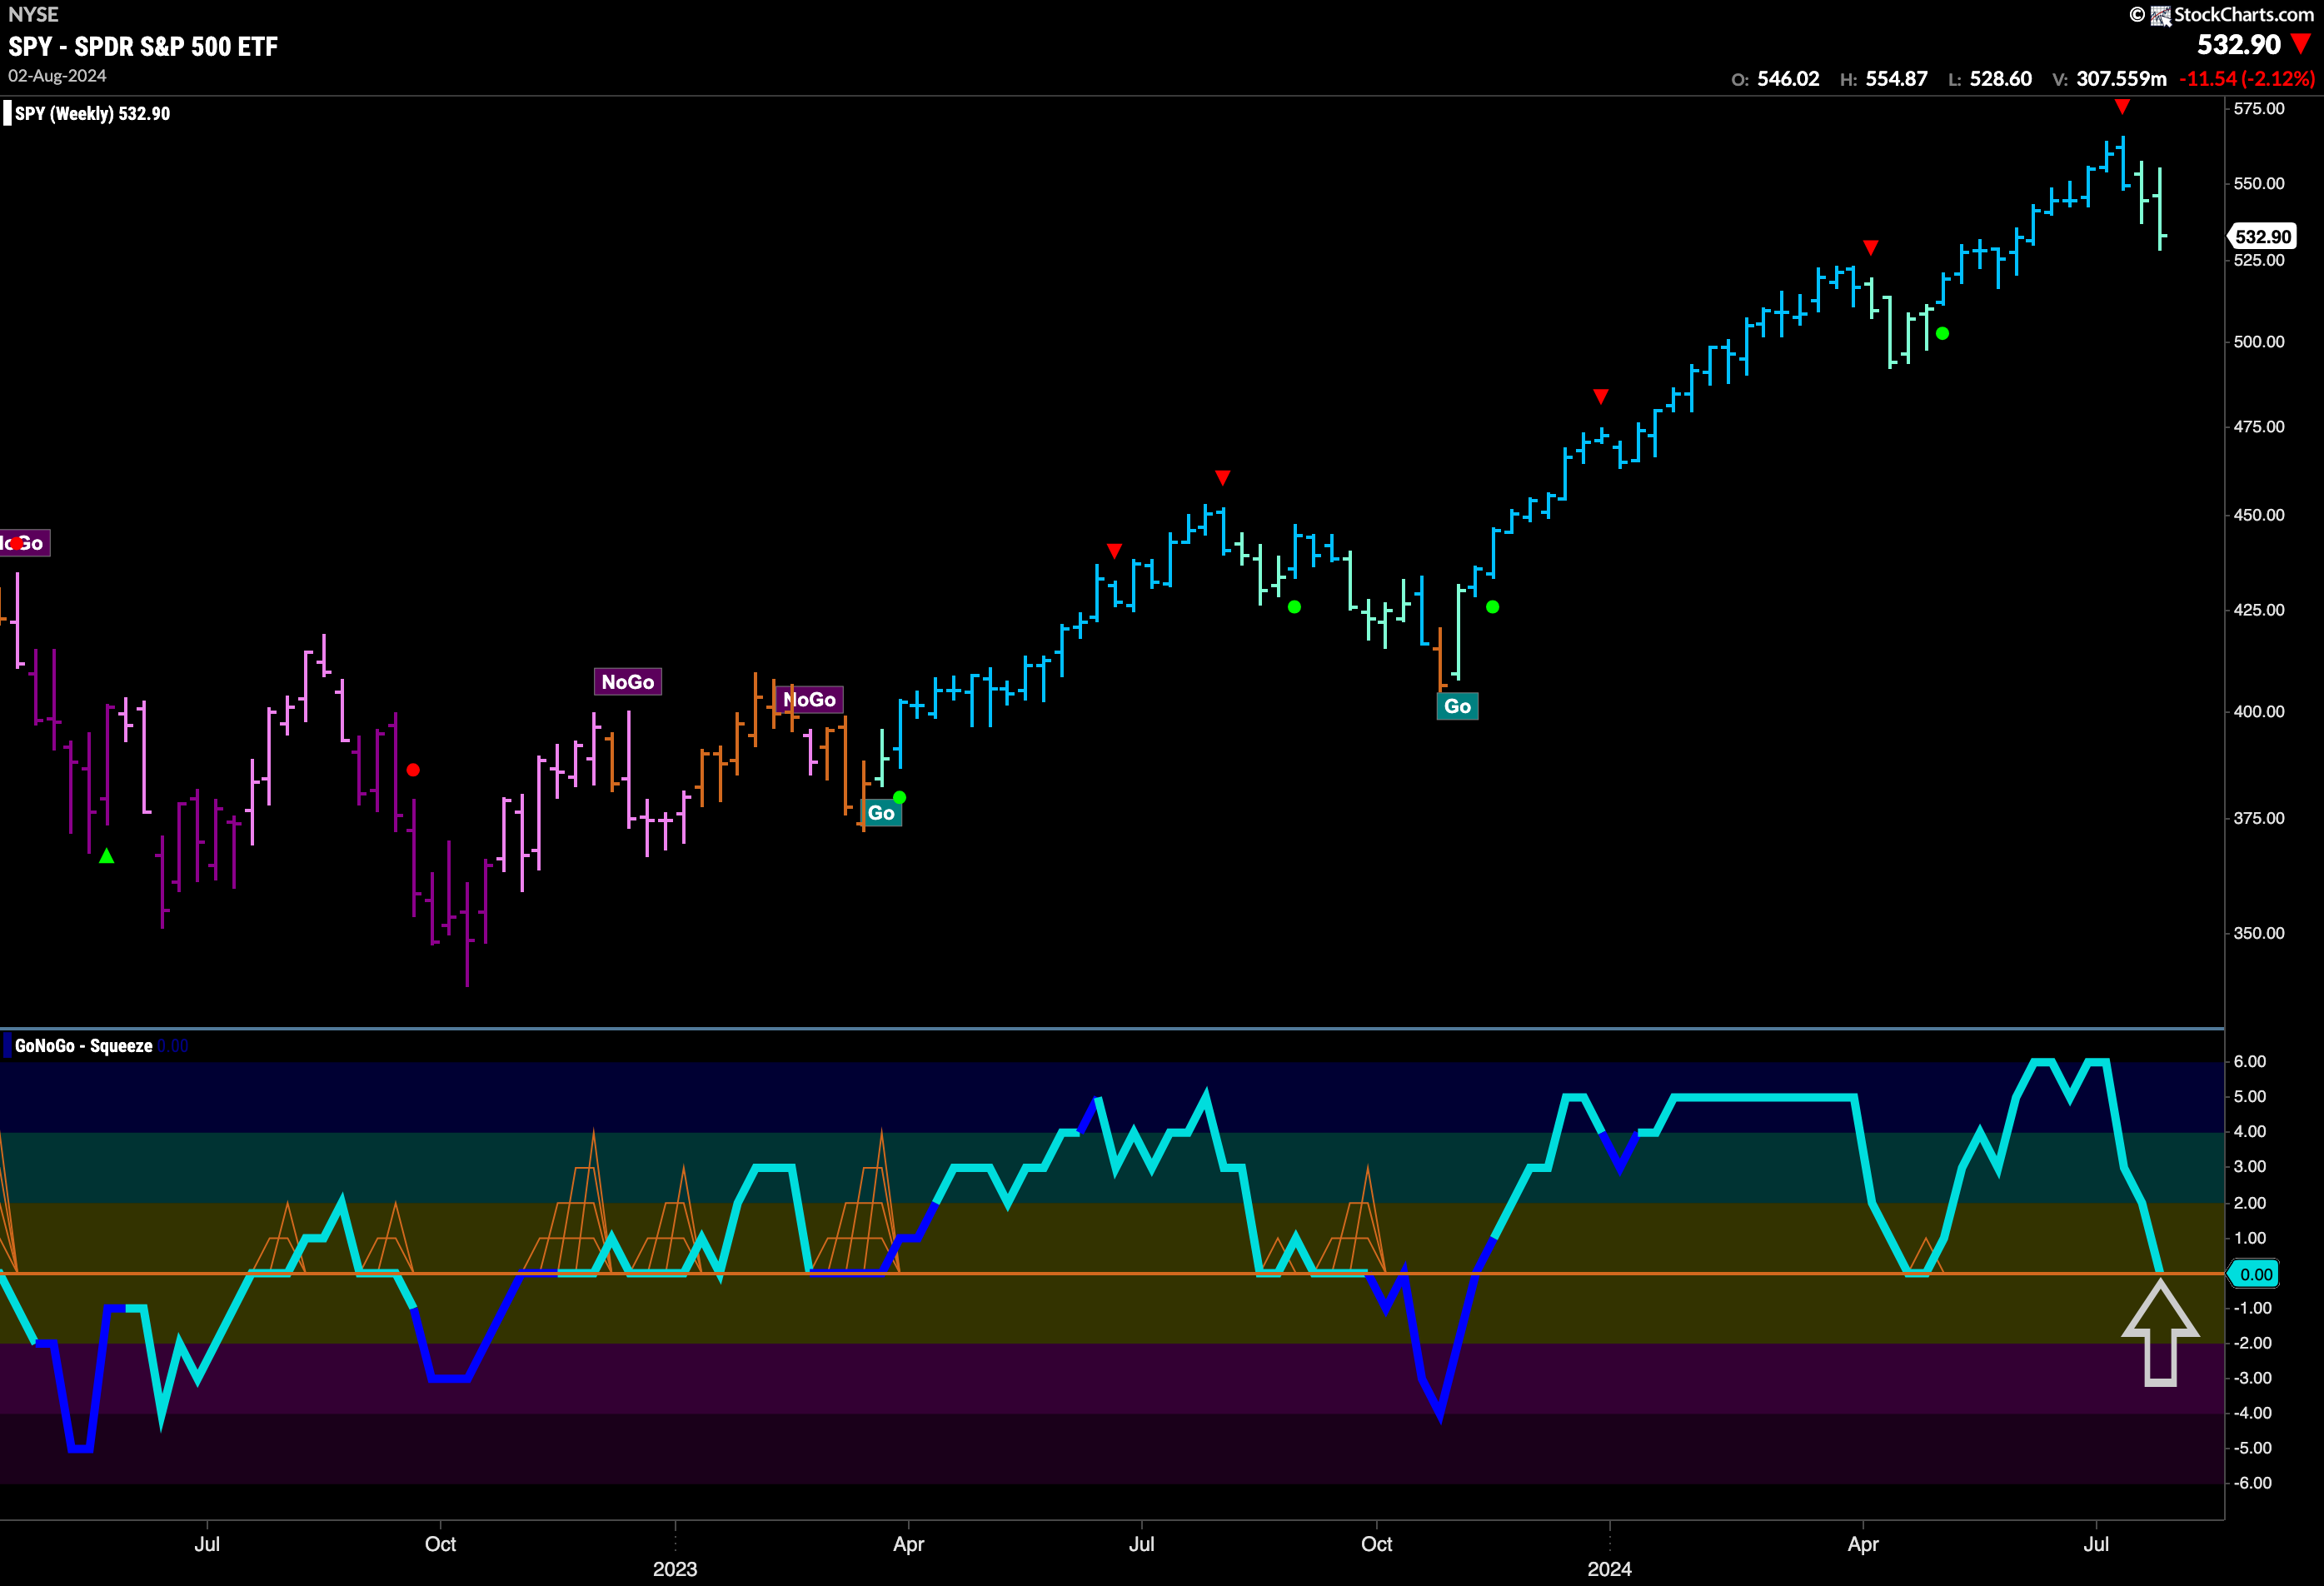
An inflection point has arrived on the weekly chart. A second weaker aqua bar tells us that the longer term trend continues to be weak after the last Go Countertrend Correction Icon (red arrow) told us price may struggle to go higher in the short term. GoNoGo Oscillator has fallen to test the zero line from above and we will watch to see if it finds support here at this level. A break into negative territory would likely signal a deeper correction.
Treasury Rates Crash to New Lows in “NoGo” Trend
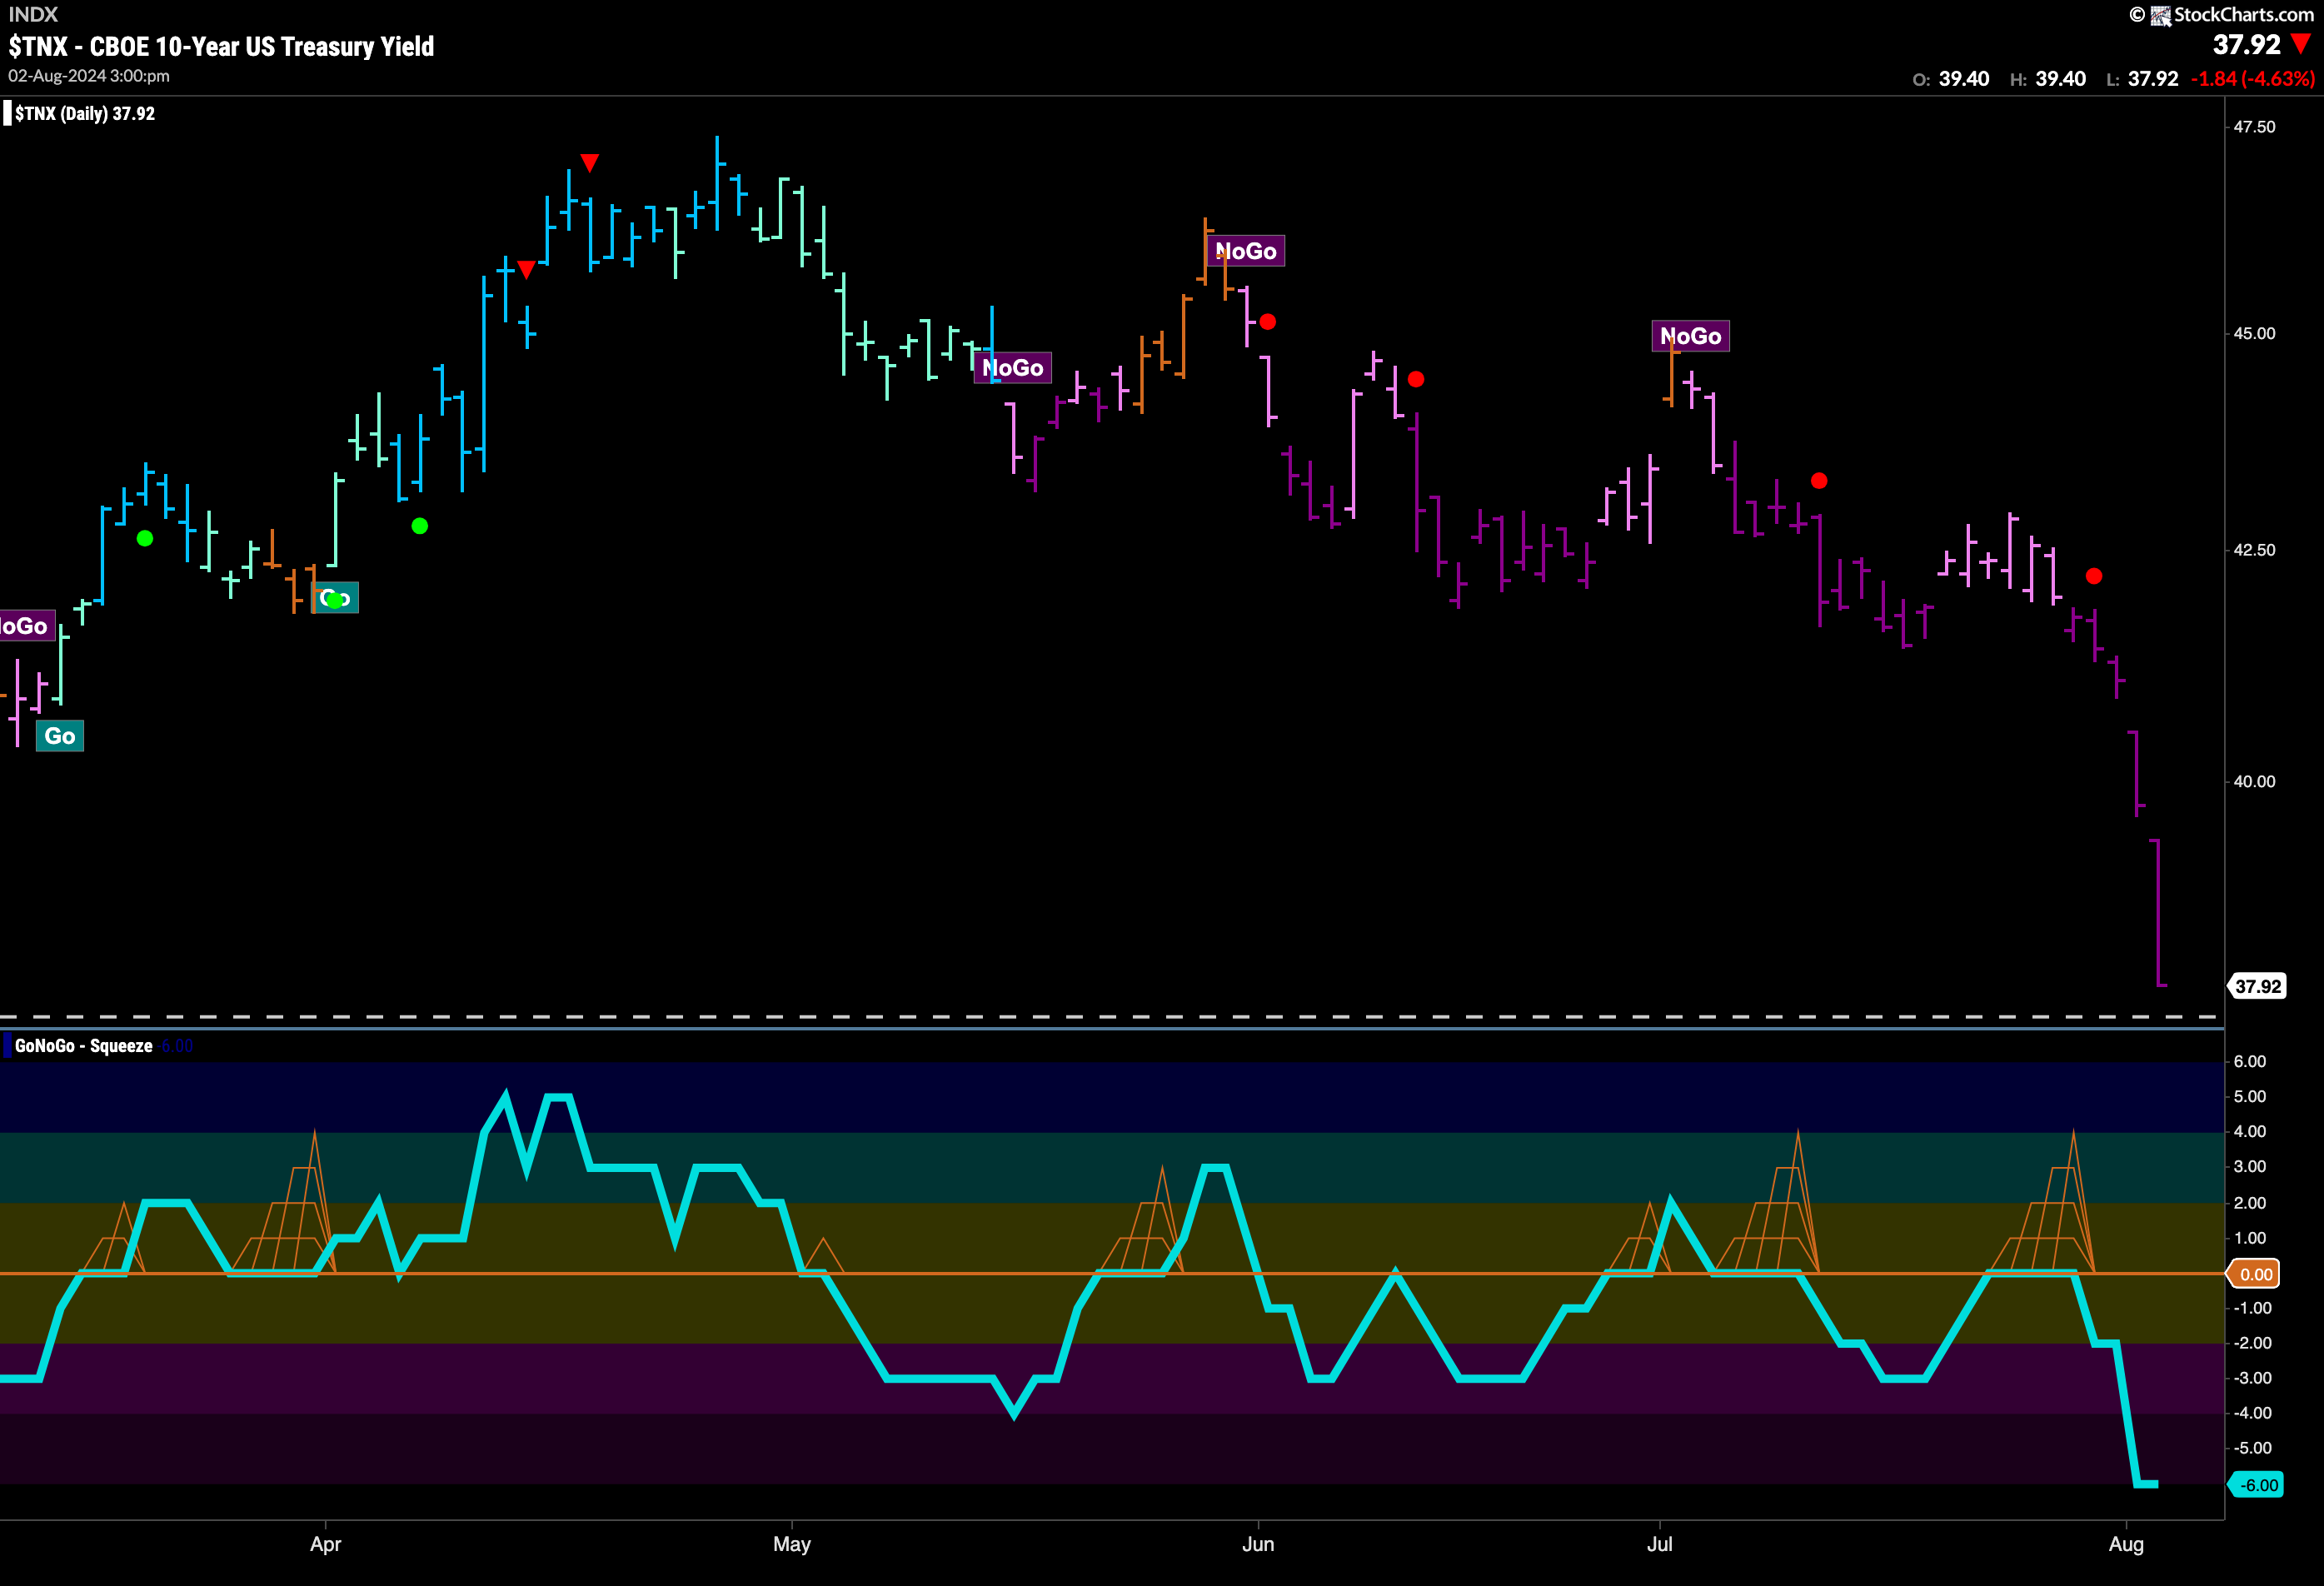
This week we saw another uninterrupted string of purple “NoGo” bars as price fell every single day of the week. As the week progressed price accelerated its move to the downside. We now see that GoNoGo Oscillator is in oversold territory at an extreme value of -6.
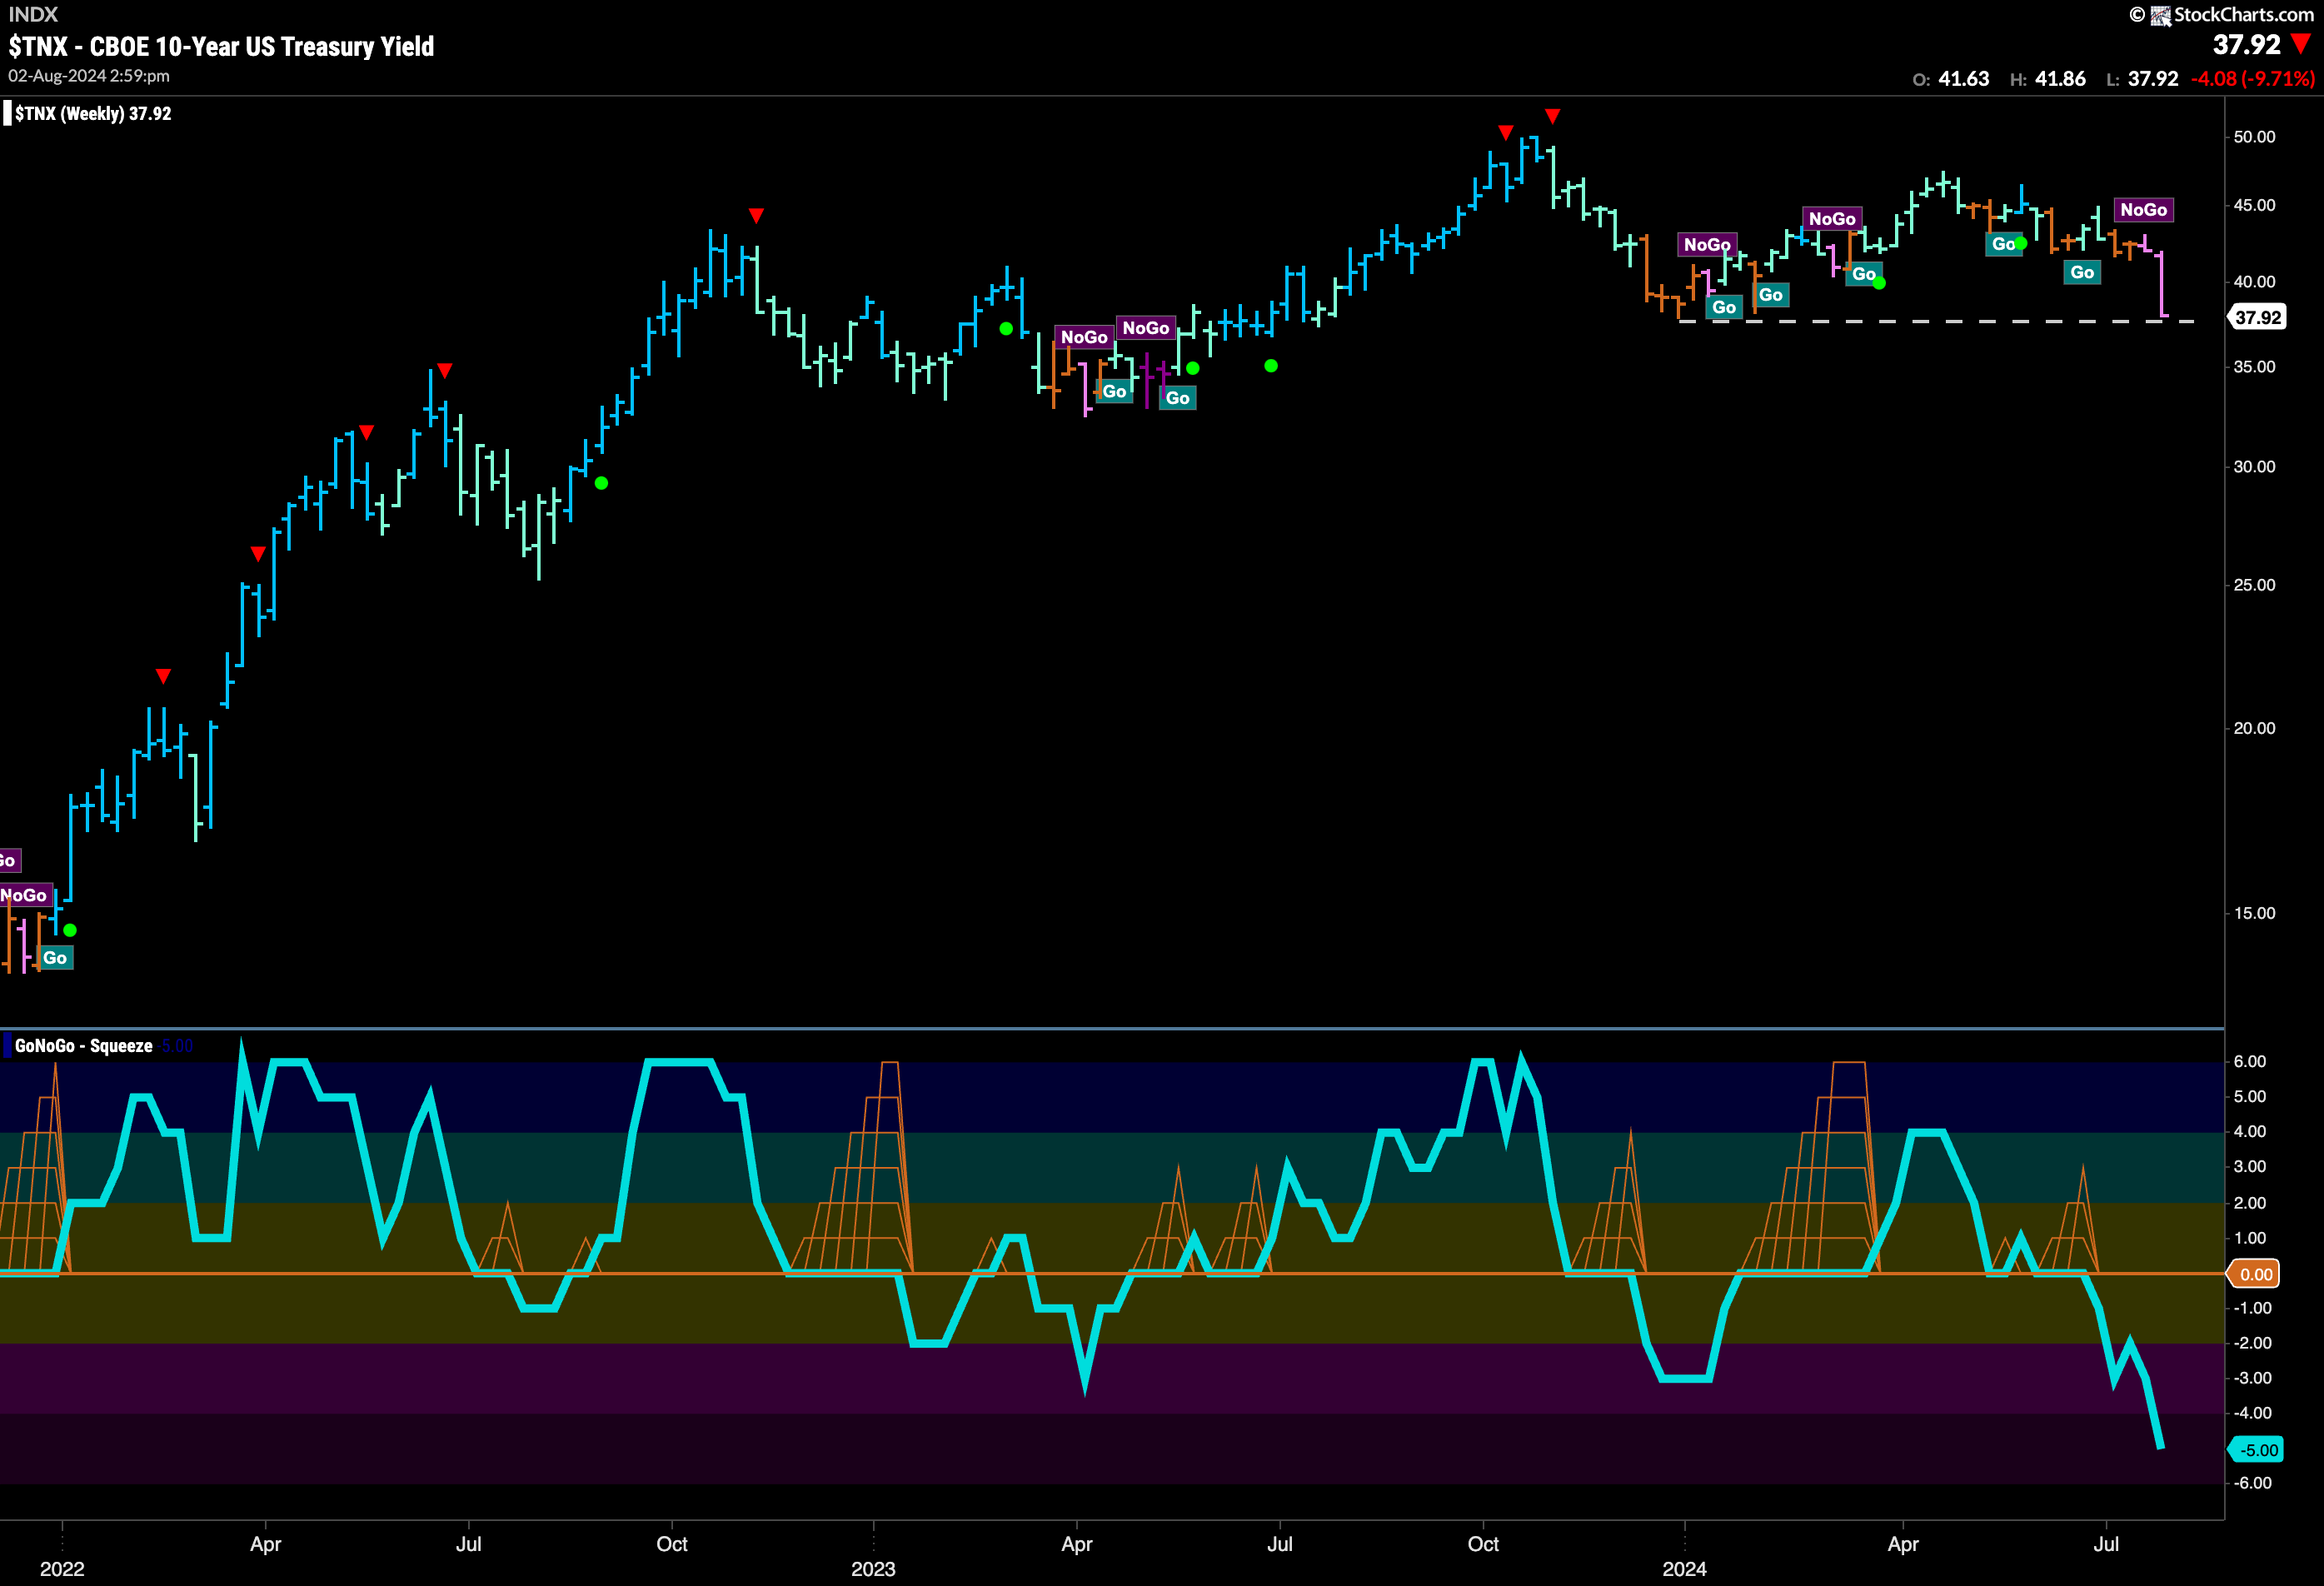
The weekly chart below shows that price has fallen to test prior lows. A second weaker pink “NoGo” bar has pushed price down to horizontal levels that could provide support. We also see that GoNoGo Oscillator has fallen into oversold territory on the weekly chart as well at a value of -5.
The Dollar Reverts Back to “NoGo” Trend
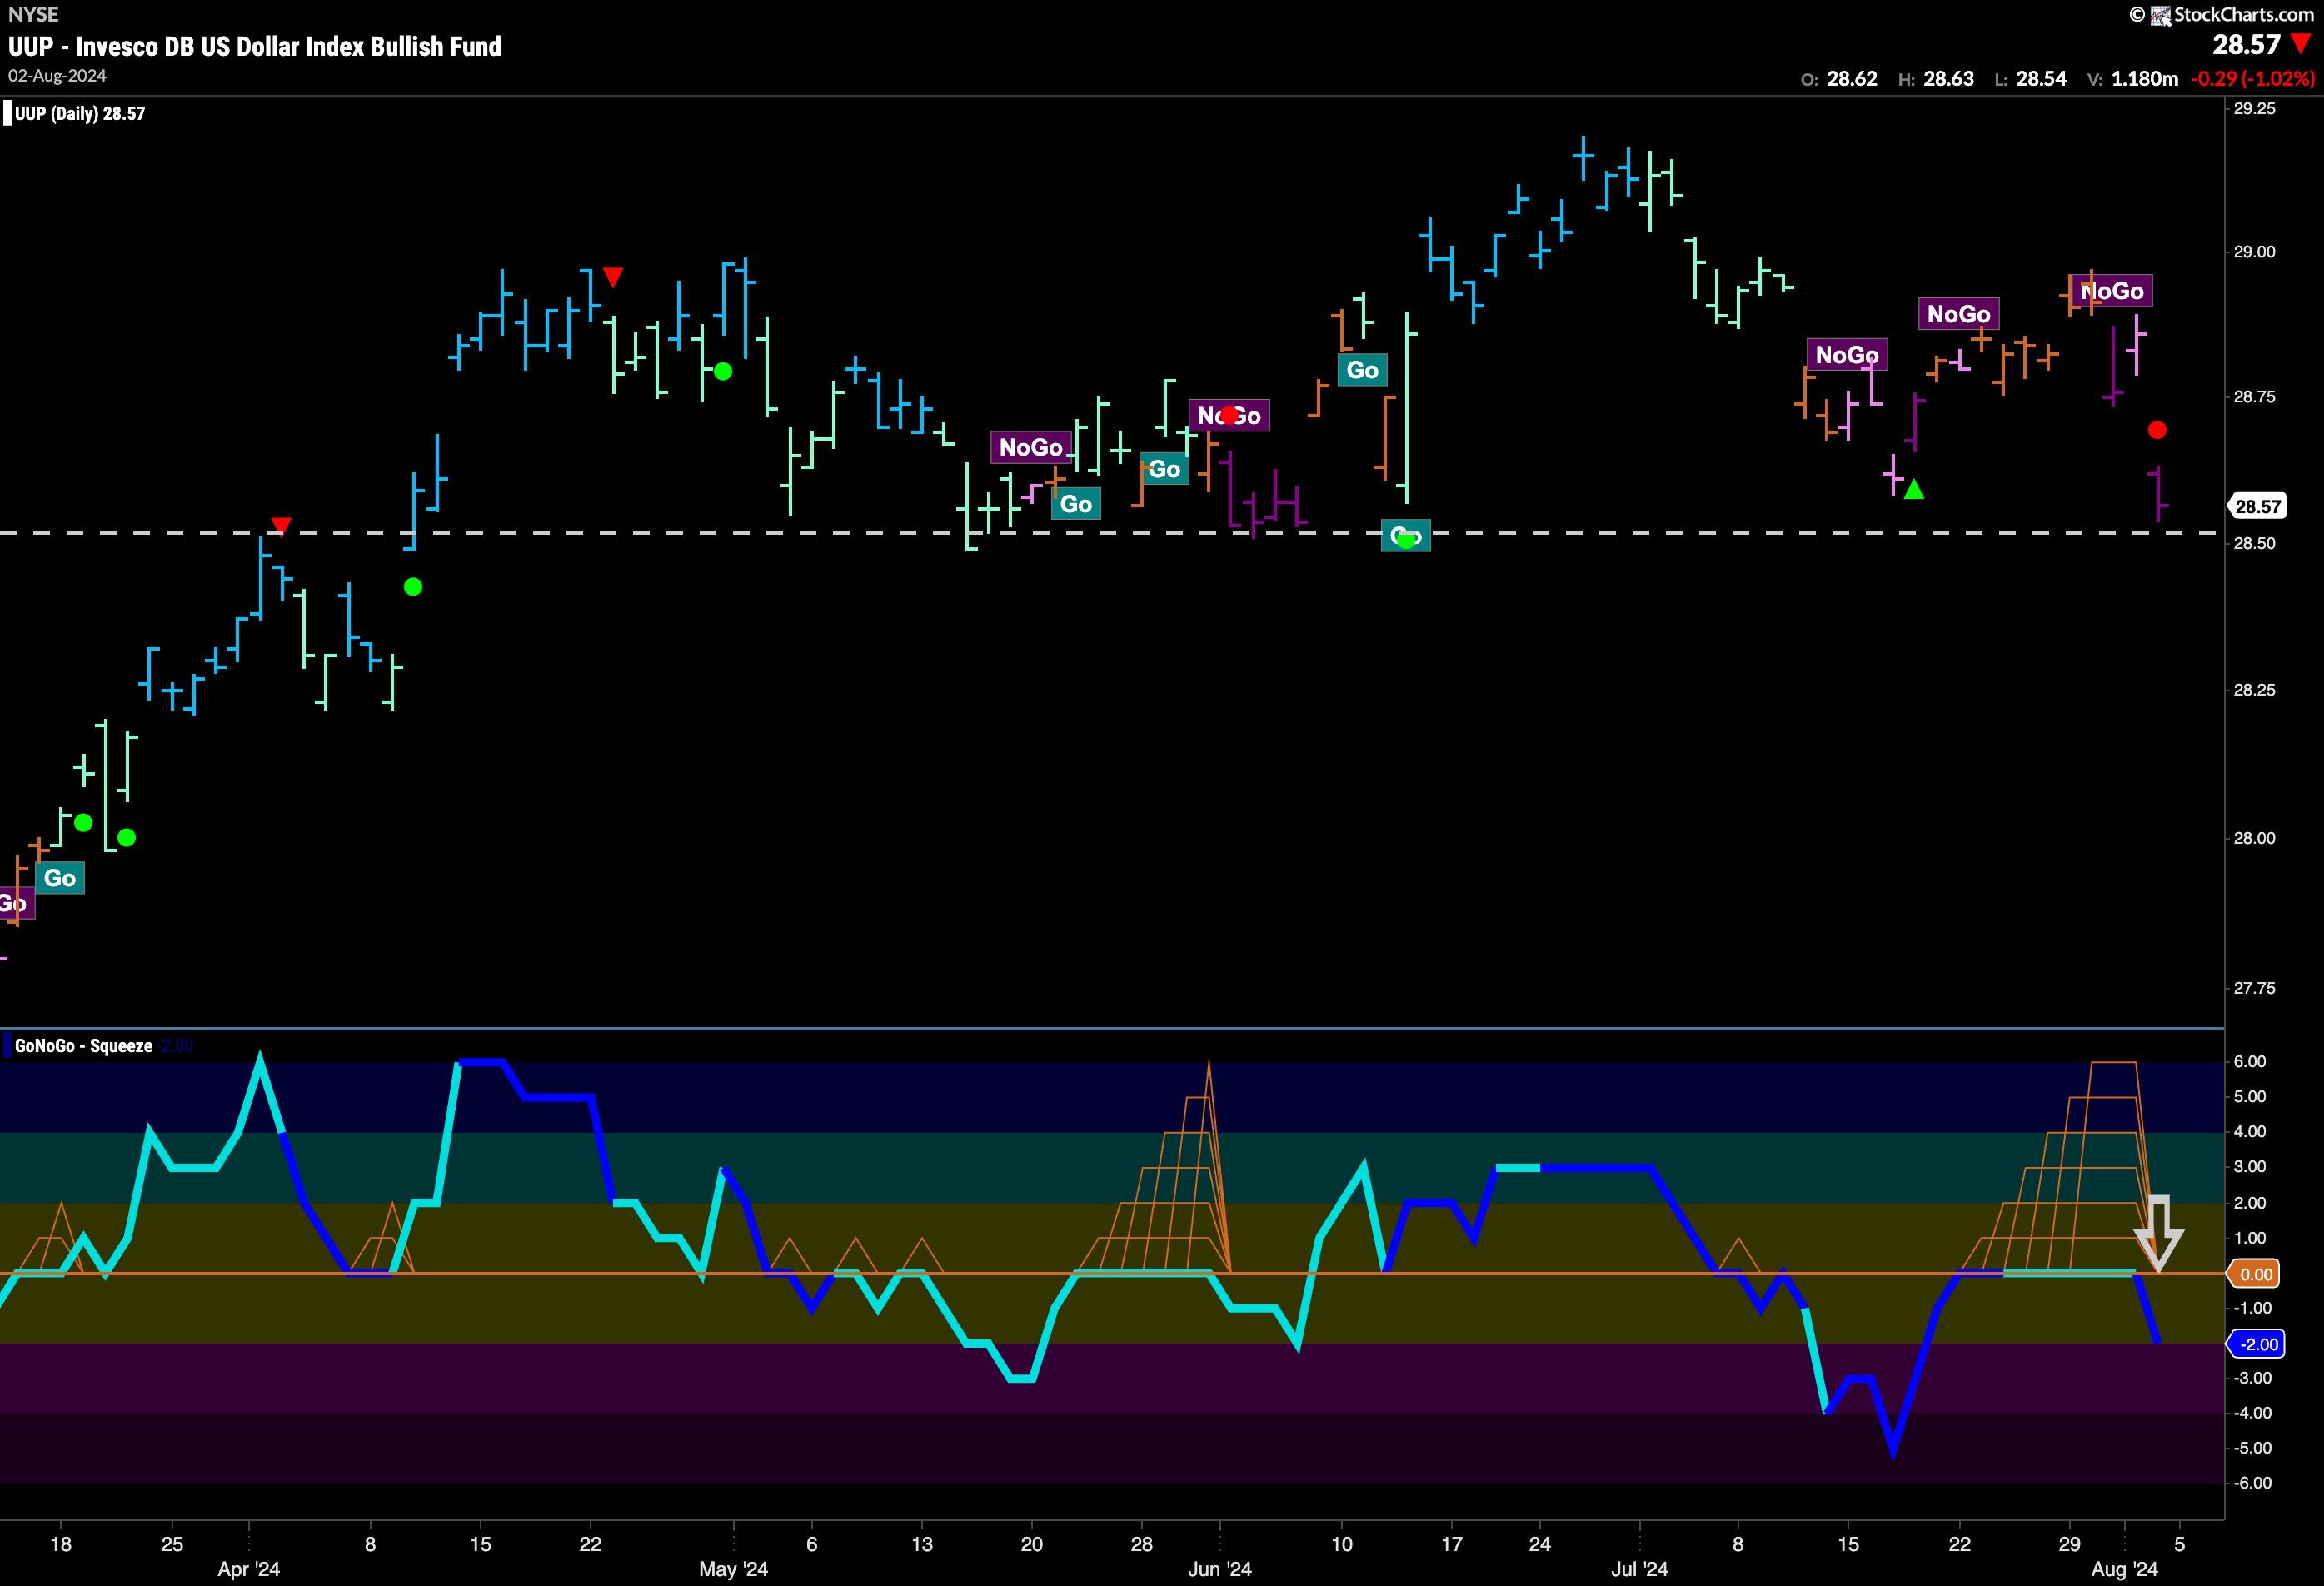
After a lot of uncertainty last week, the dollar fell back into a “NoGo” trend this week with pink and purple bars. On the last day of the week, price gapped lower and is now testing support from earlier lows that we see in the chart. GoNoGo Oscillator broke out of a Max GoNoGo Squeeze on heavy volume as well which tells us that momentum is resurgent in the direction of the “NoGo” trend. We will watch to see if price can fall to new lows this week.
USO Remains in “NoGo” Trend
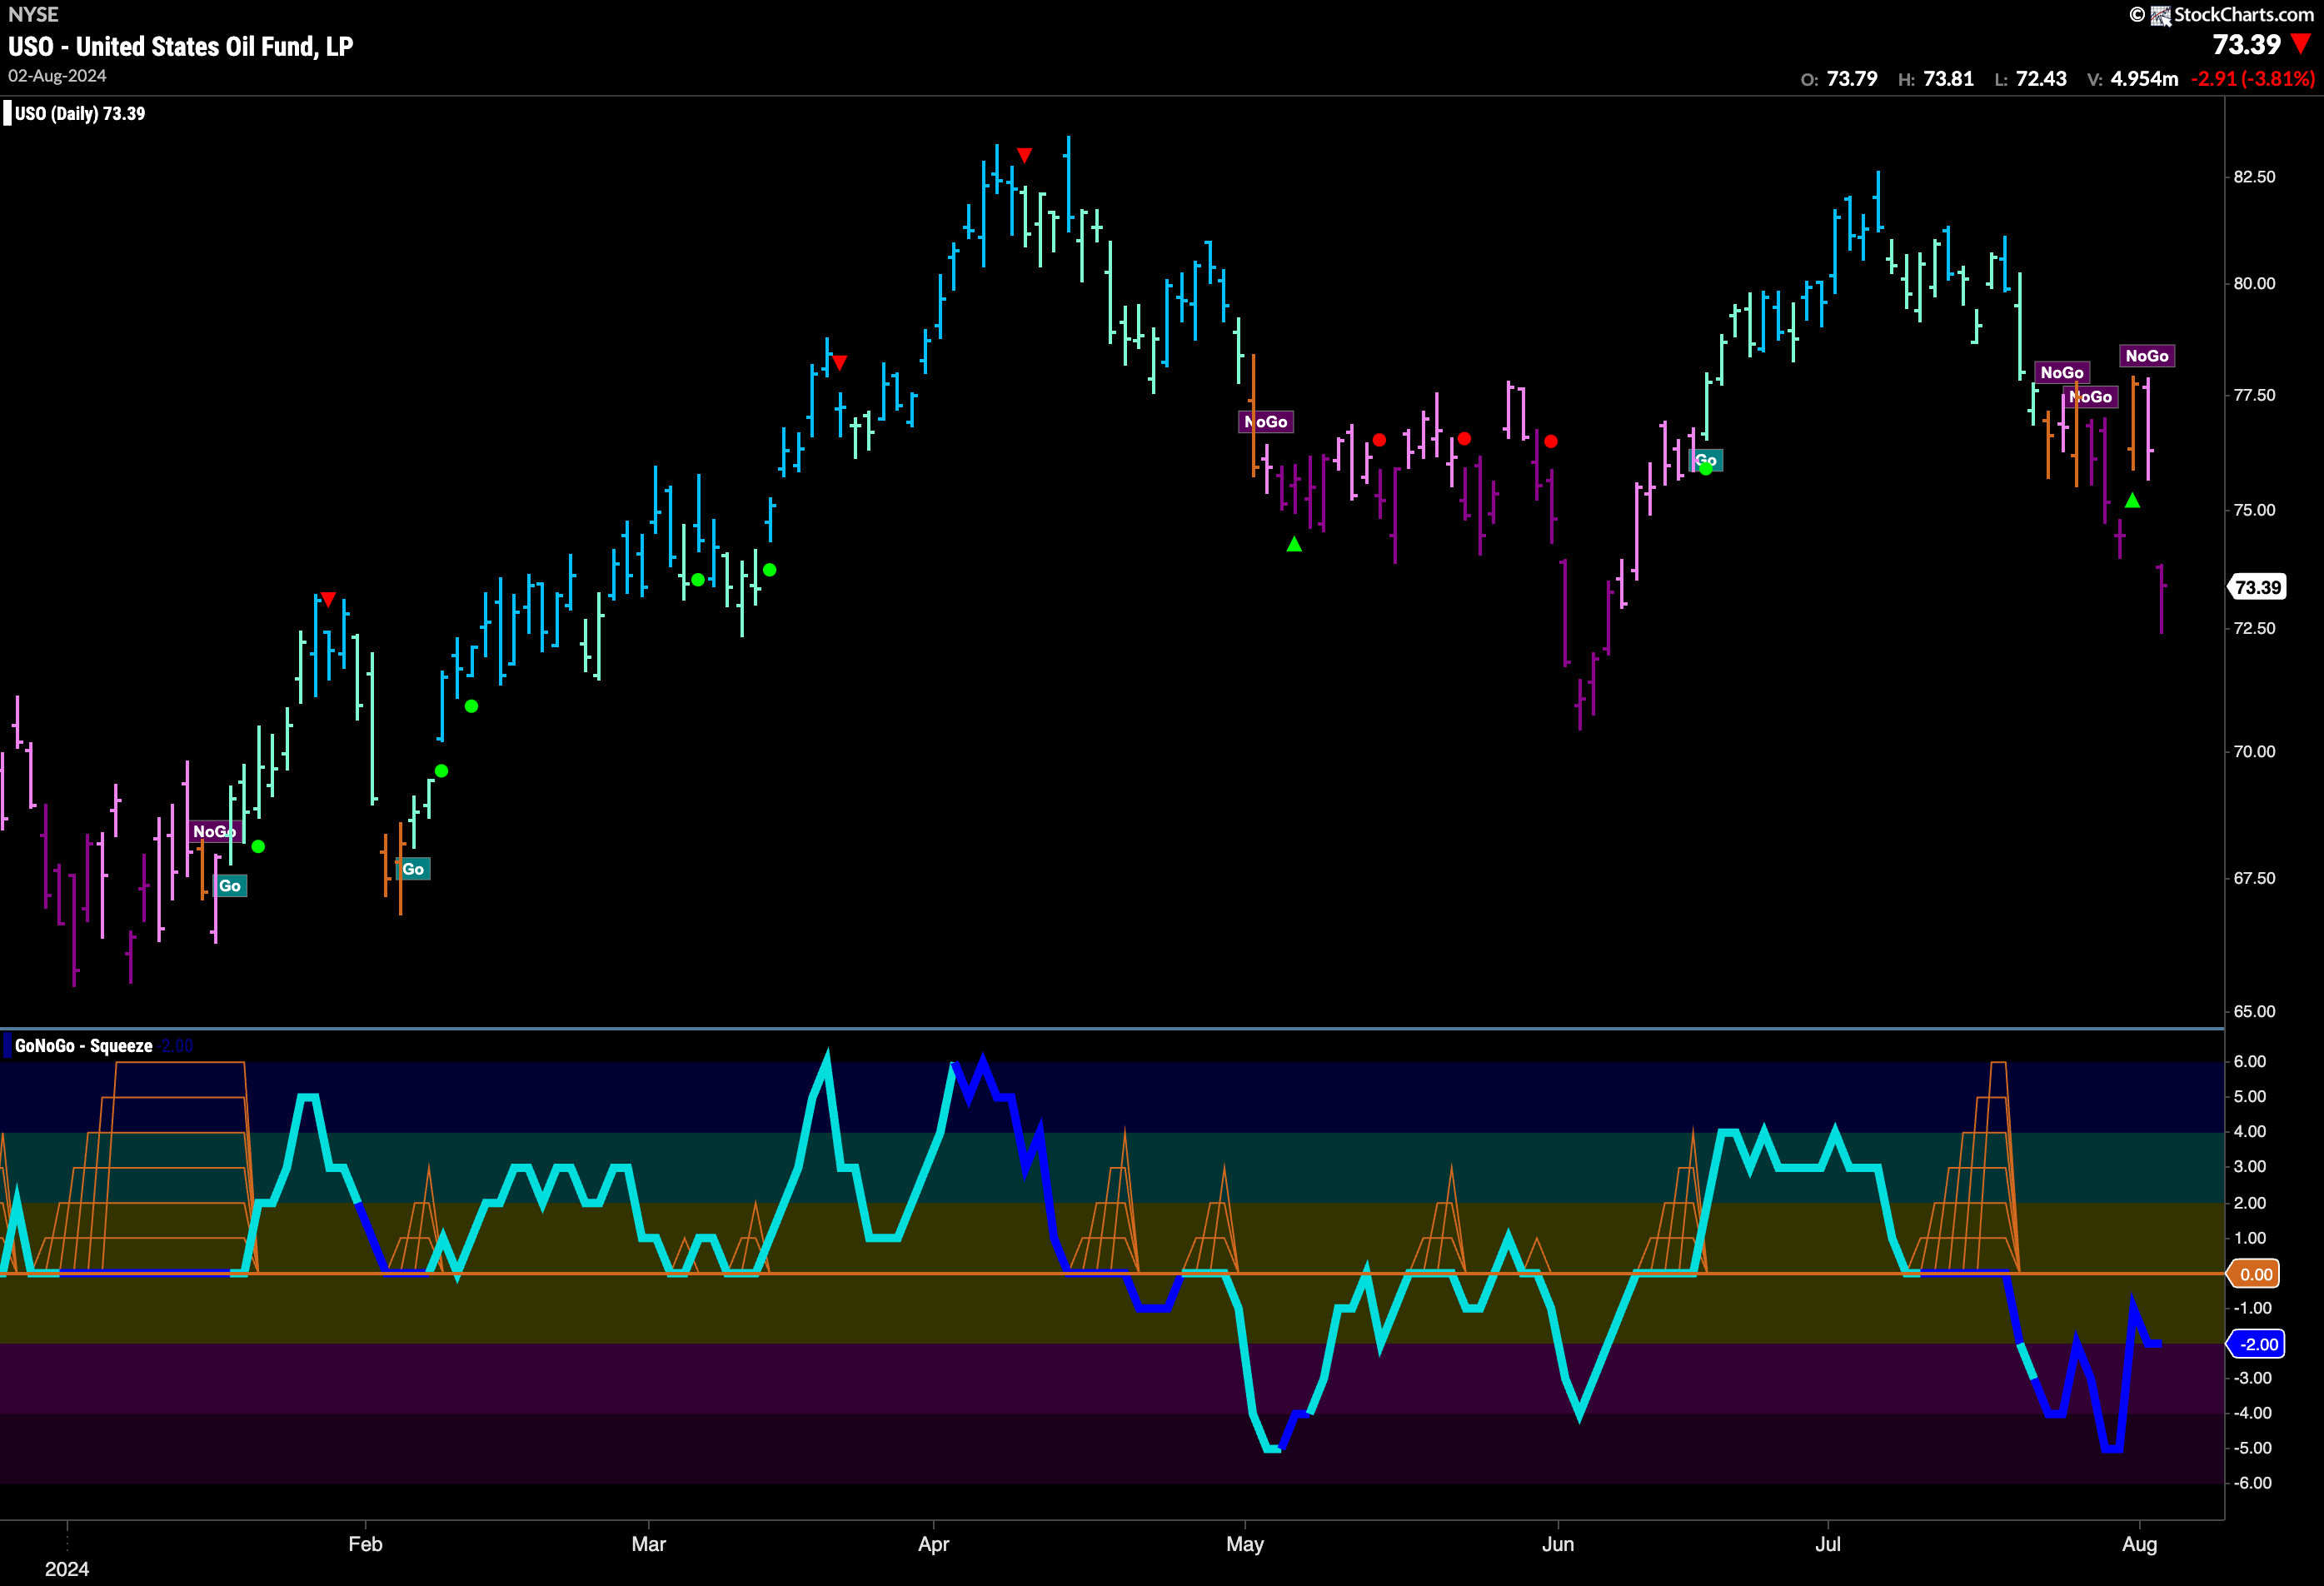
We saw some uncertainty mid week as GoNoGo Trend painted an amber “Go Fish” bar. However, the “NoGo” returned and the week ended with a strong purple “NoGo” bar as price gapped lower. Since breaking out of the Max GoNoGo Squeeze to negative territory, the oscillator has remained below zero and volume is heavy. With momentum on the side of the “NoGo” trend we will watch to see if price can challenge the June lows.
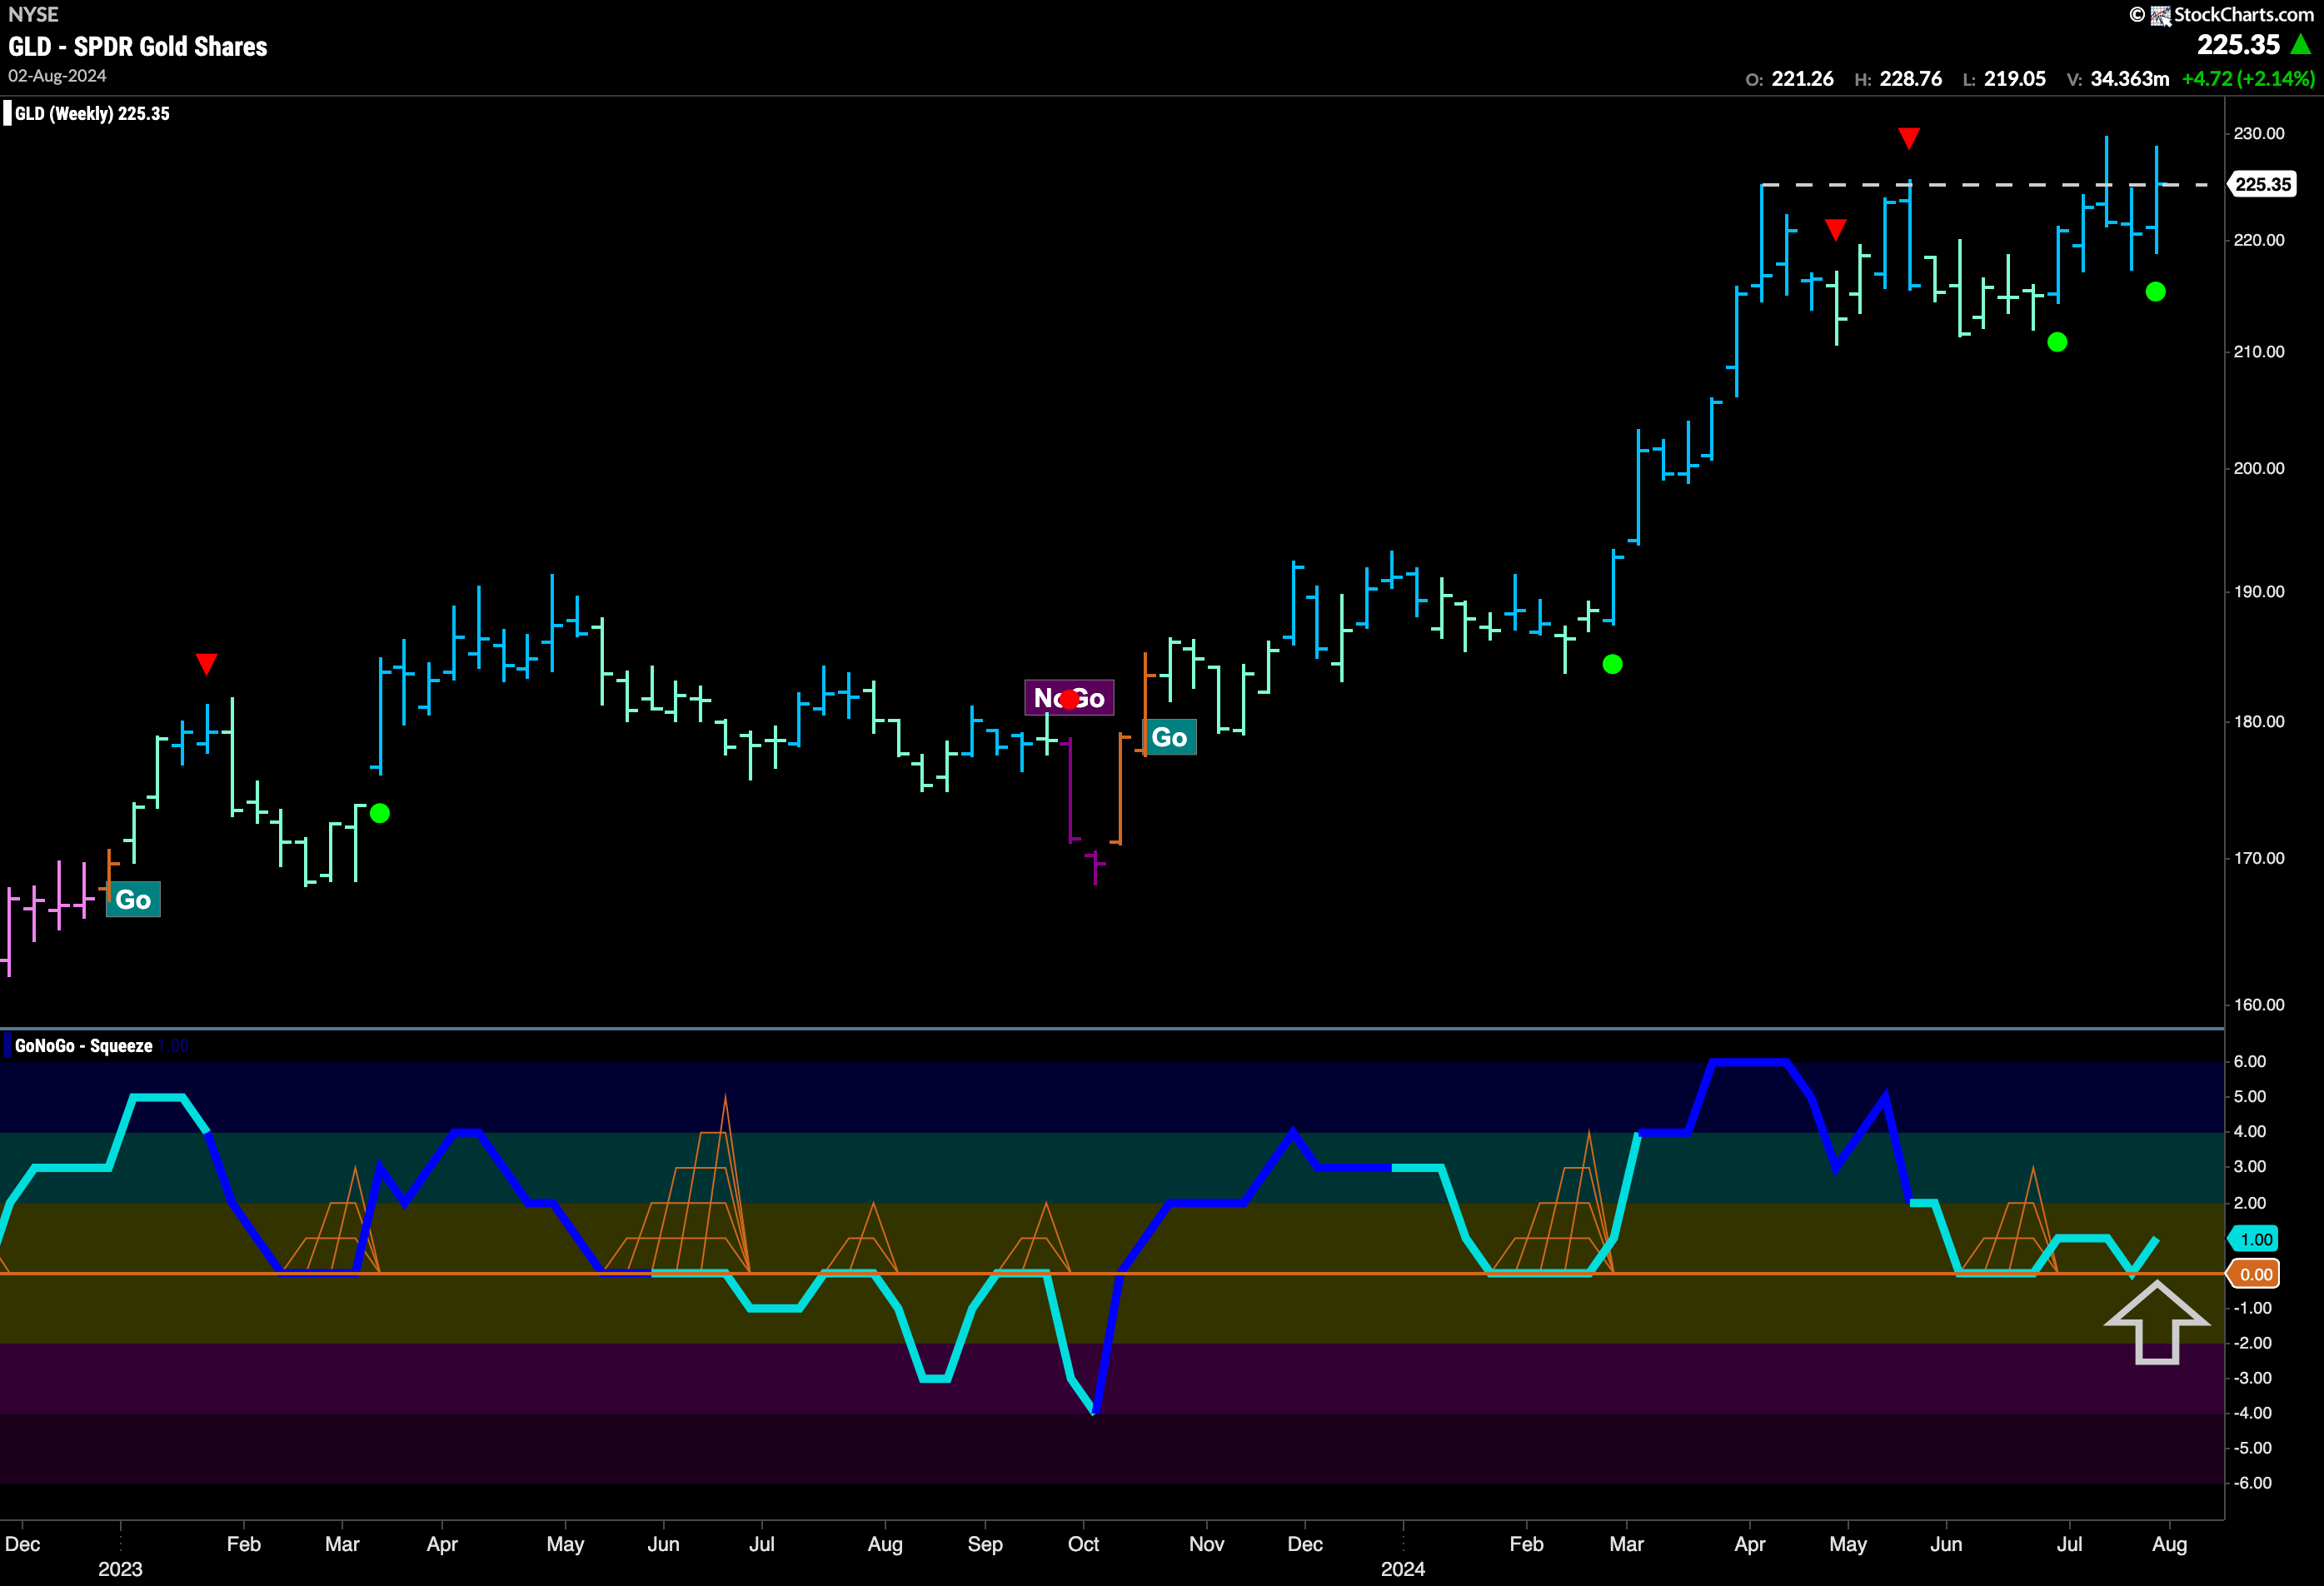
Gold Continues to Attack New Highs
The weekly chart of Gold shows that the trend remains a strong “Go”. However, we note that it is having difficulty moving past the horizontal resistance that we see on the chart. GoNoGo Oscillator continues to find support at the zero line and that has triggered a second Go Trend Continuation Icon (green circle) under the price bar telling us that momentum remains in the direction of the “Go” trend. We will watch to see if price can break to new highs in the upcoming weeks.
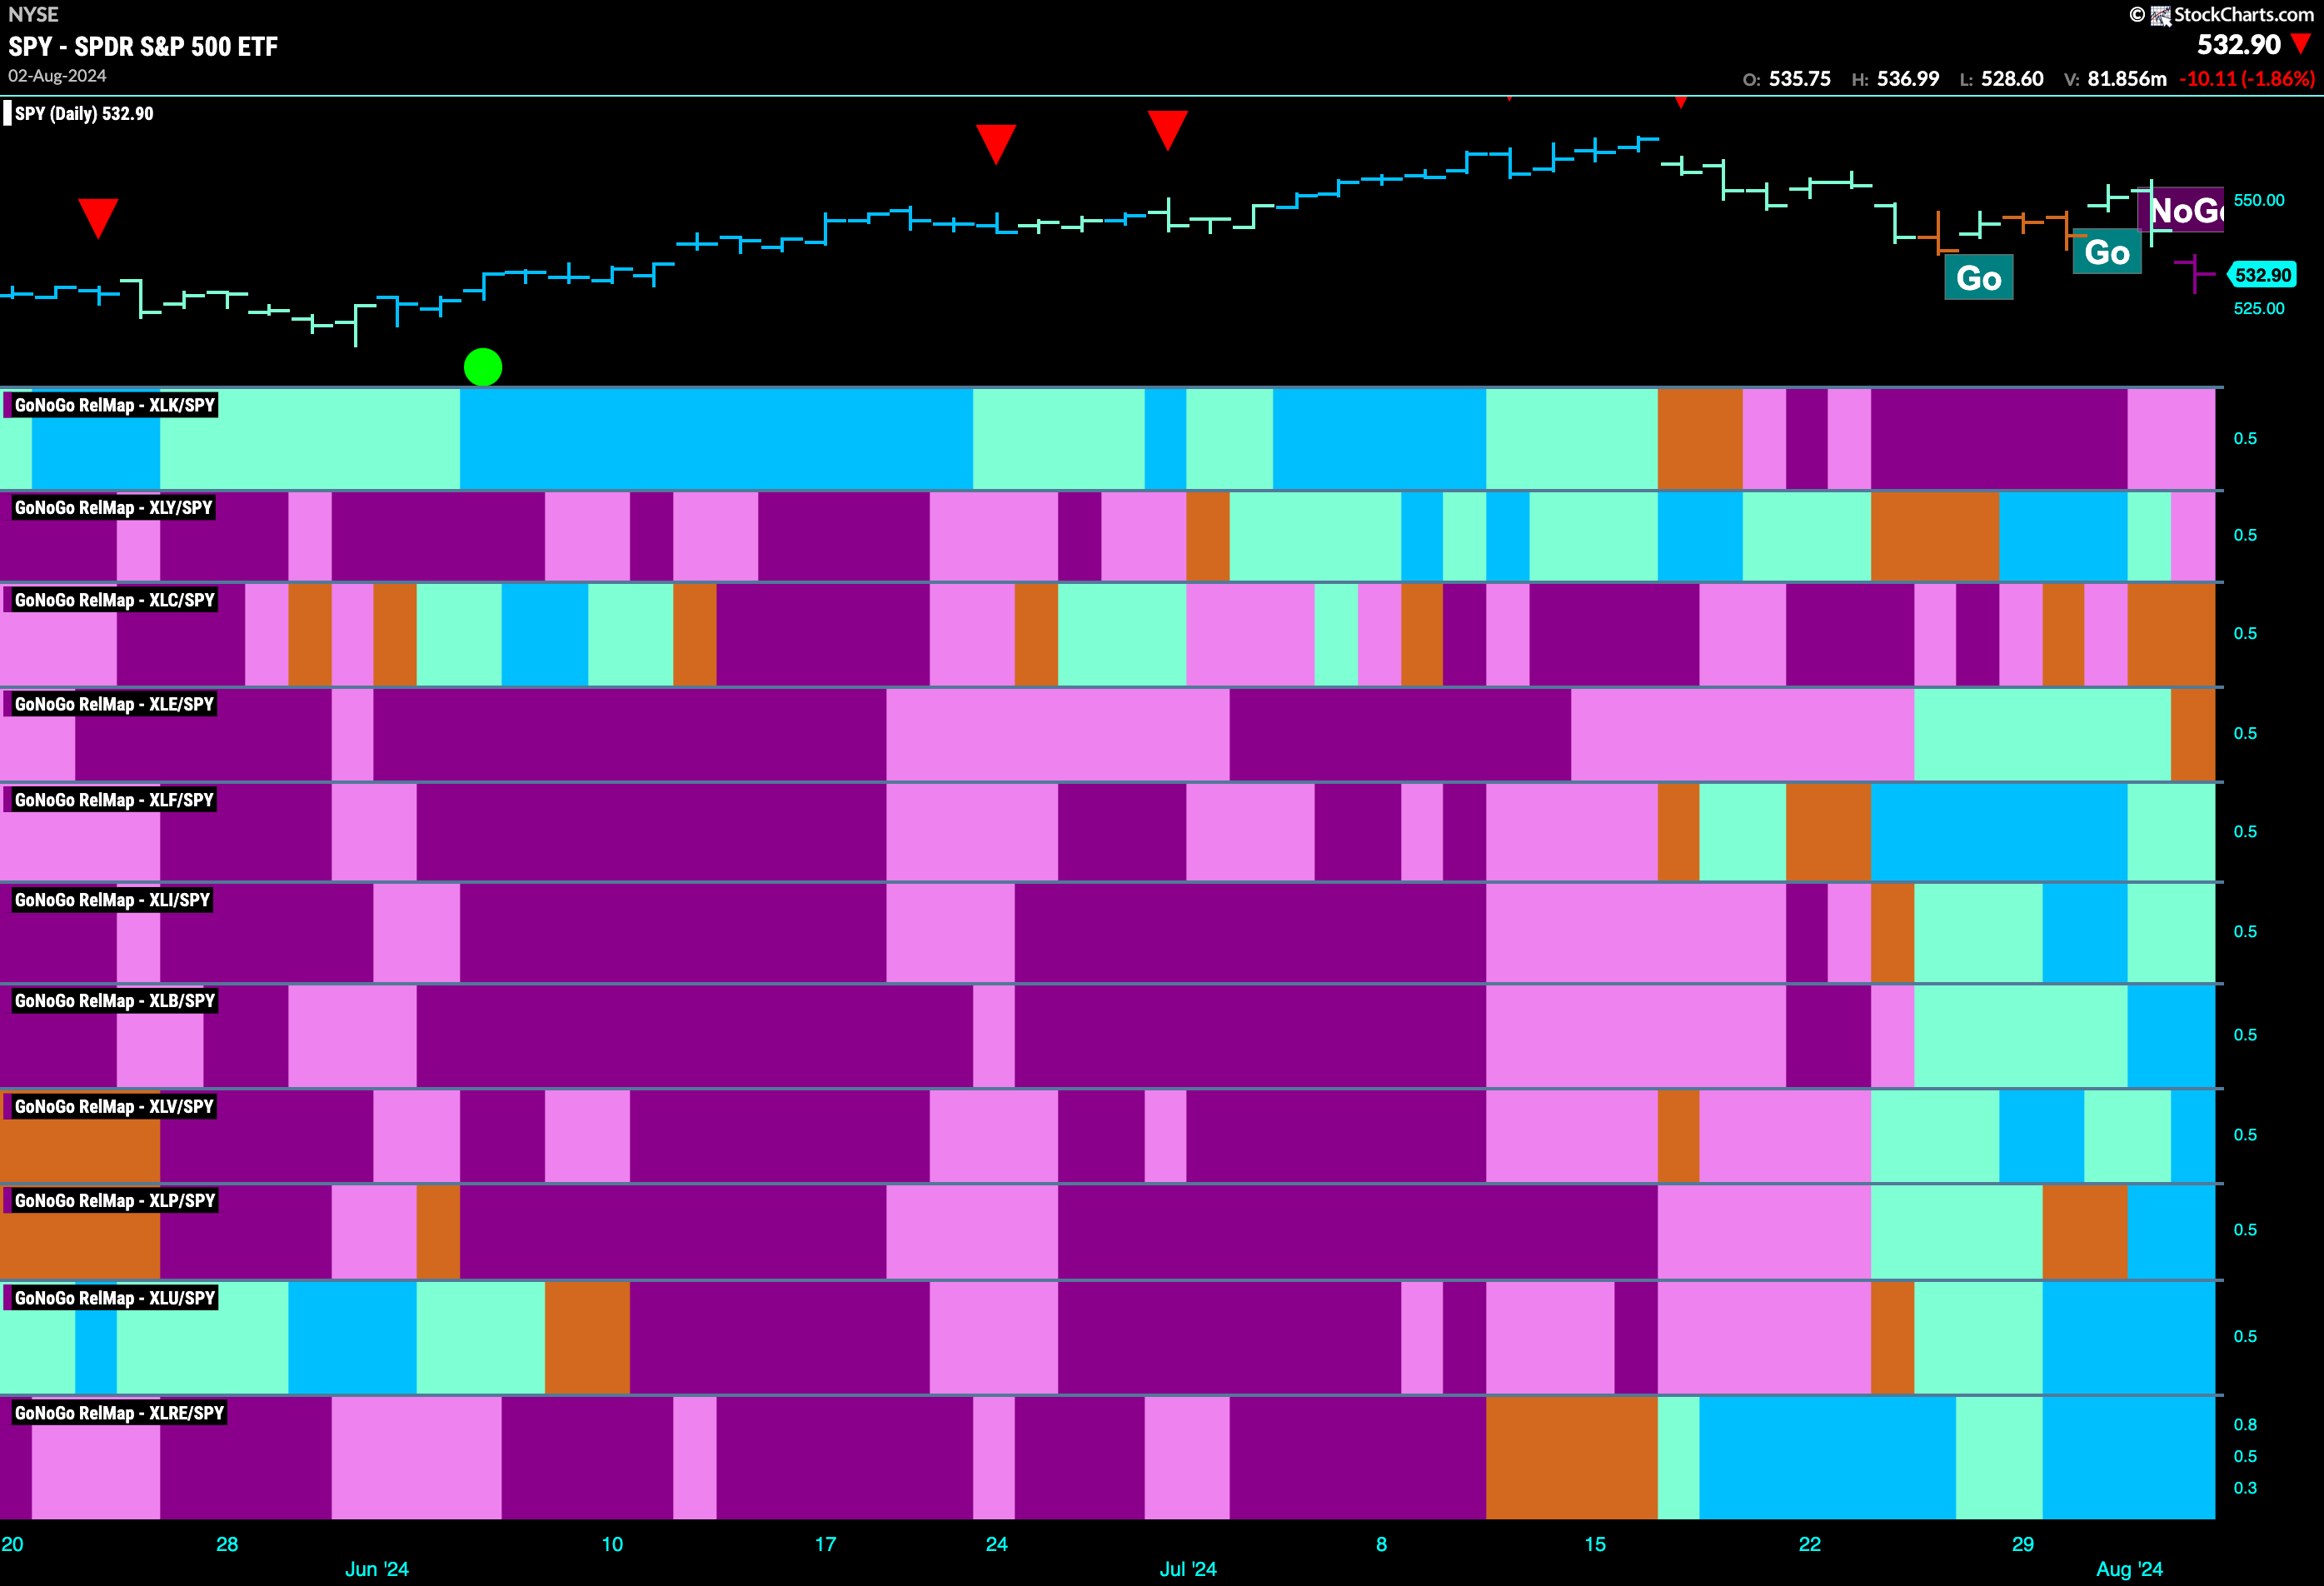
Sector RelMap
Below is the GoNoGo Sector RelMap. This GoNoGo RelMap applies the GoNoGo Trend to the relative strength ratios of the sectors to the base index. Looking at the map, we can see that 7 sectors are outperforming the base index this week. $XLF, $XLI, $XLB, $XLV, $XLP, $XLU and $XLRE are painting relative “Go” bars.
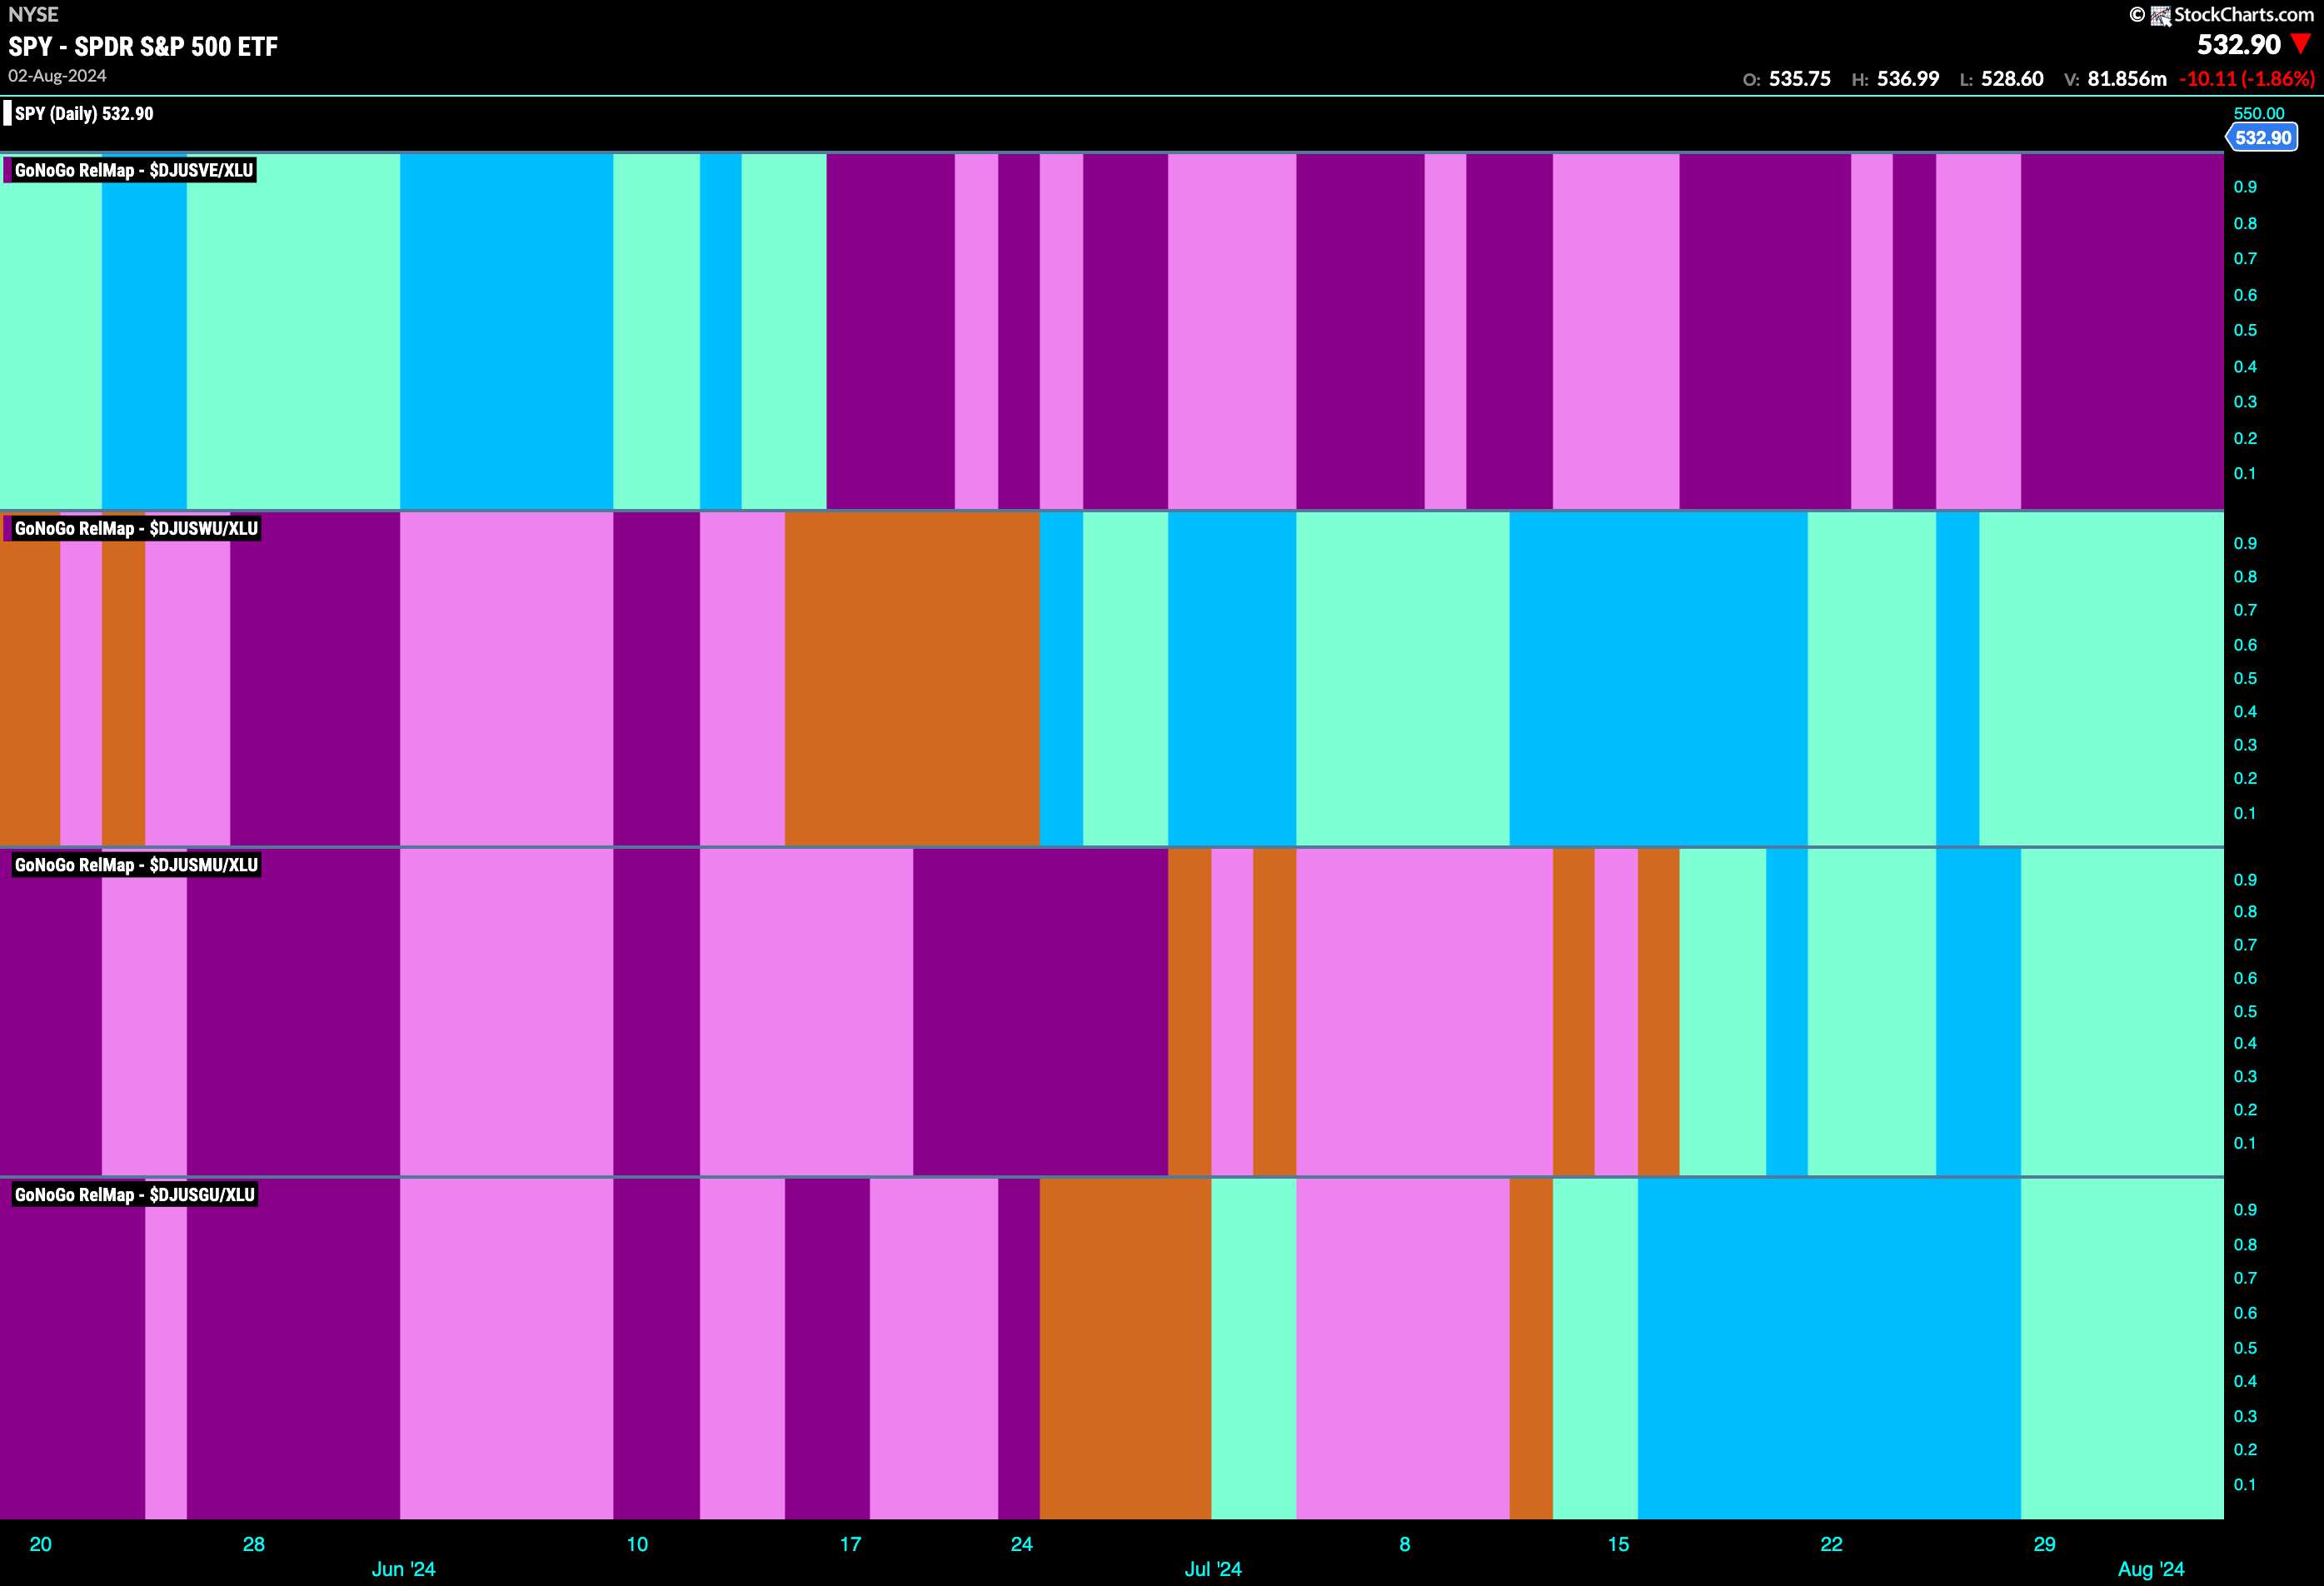
Utilities Sub-Group RelMap
On a relative basis, we saw in the above GoNoGo Sector RelMap that the utilities sector is painting strong relative “Go” bars. With equity markets struggling it is no surprise that leadership is among the defensive sectors. Below, we can see that three of the four sub groups, including water utilities, are relatively strong.
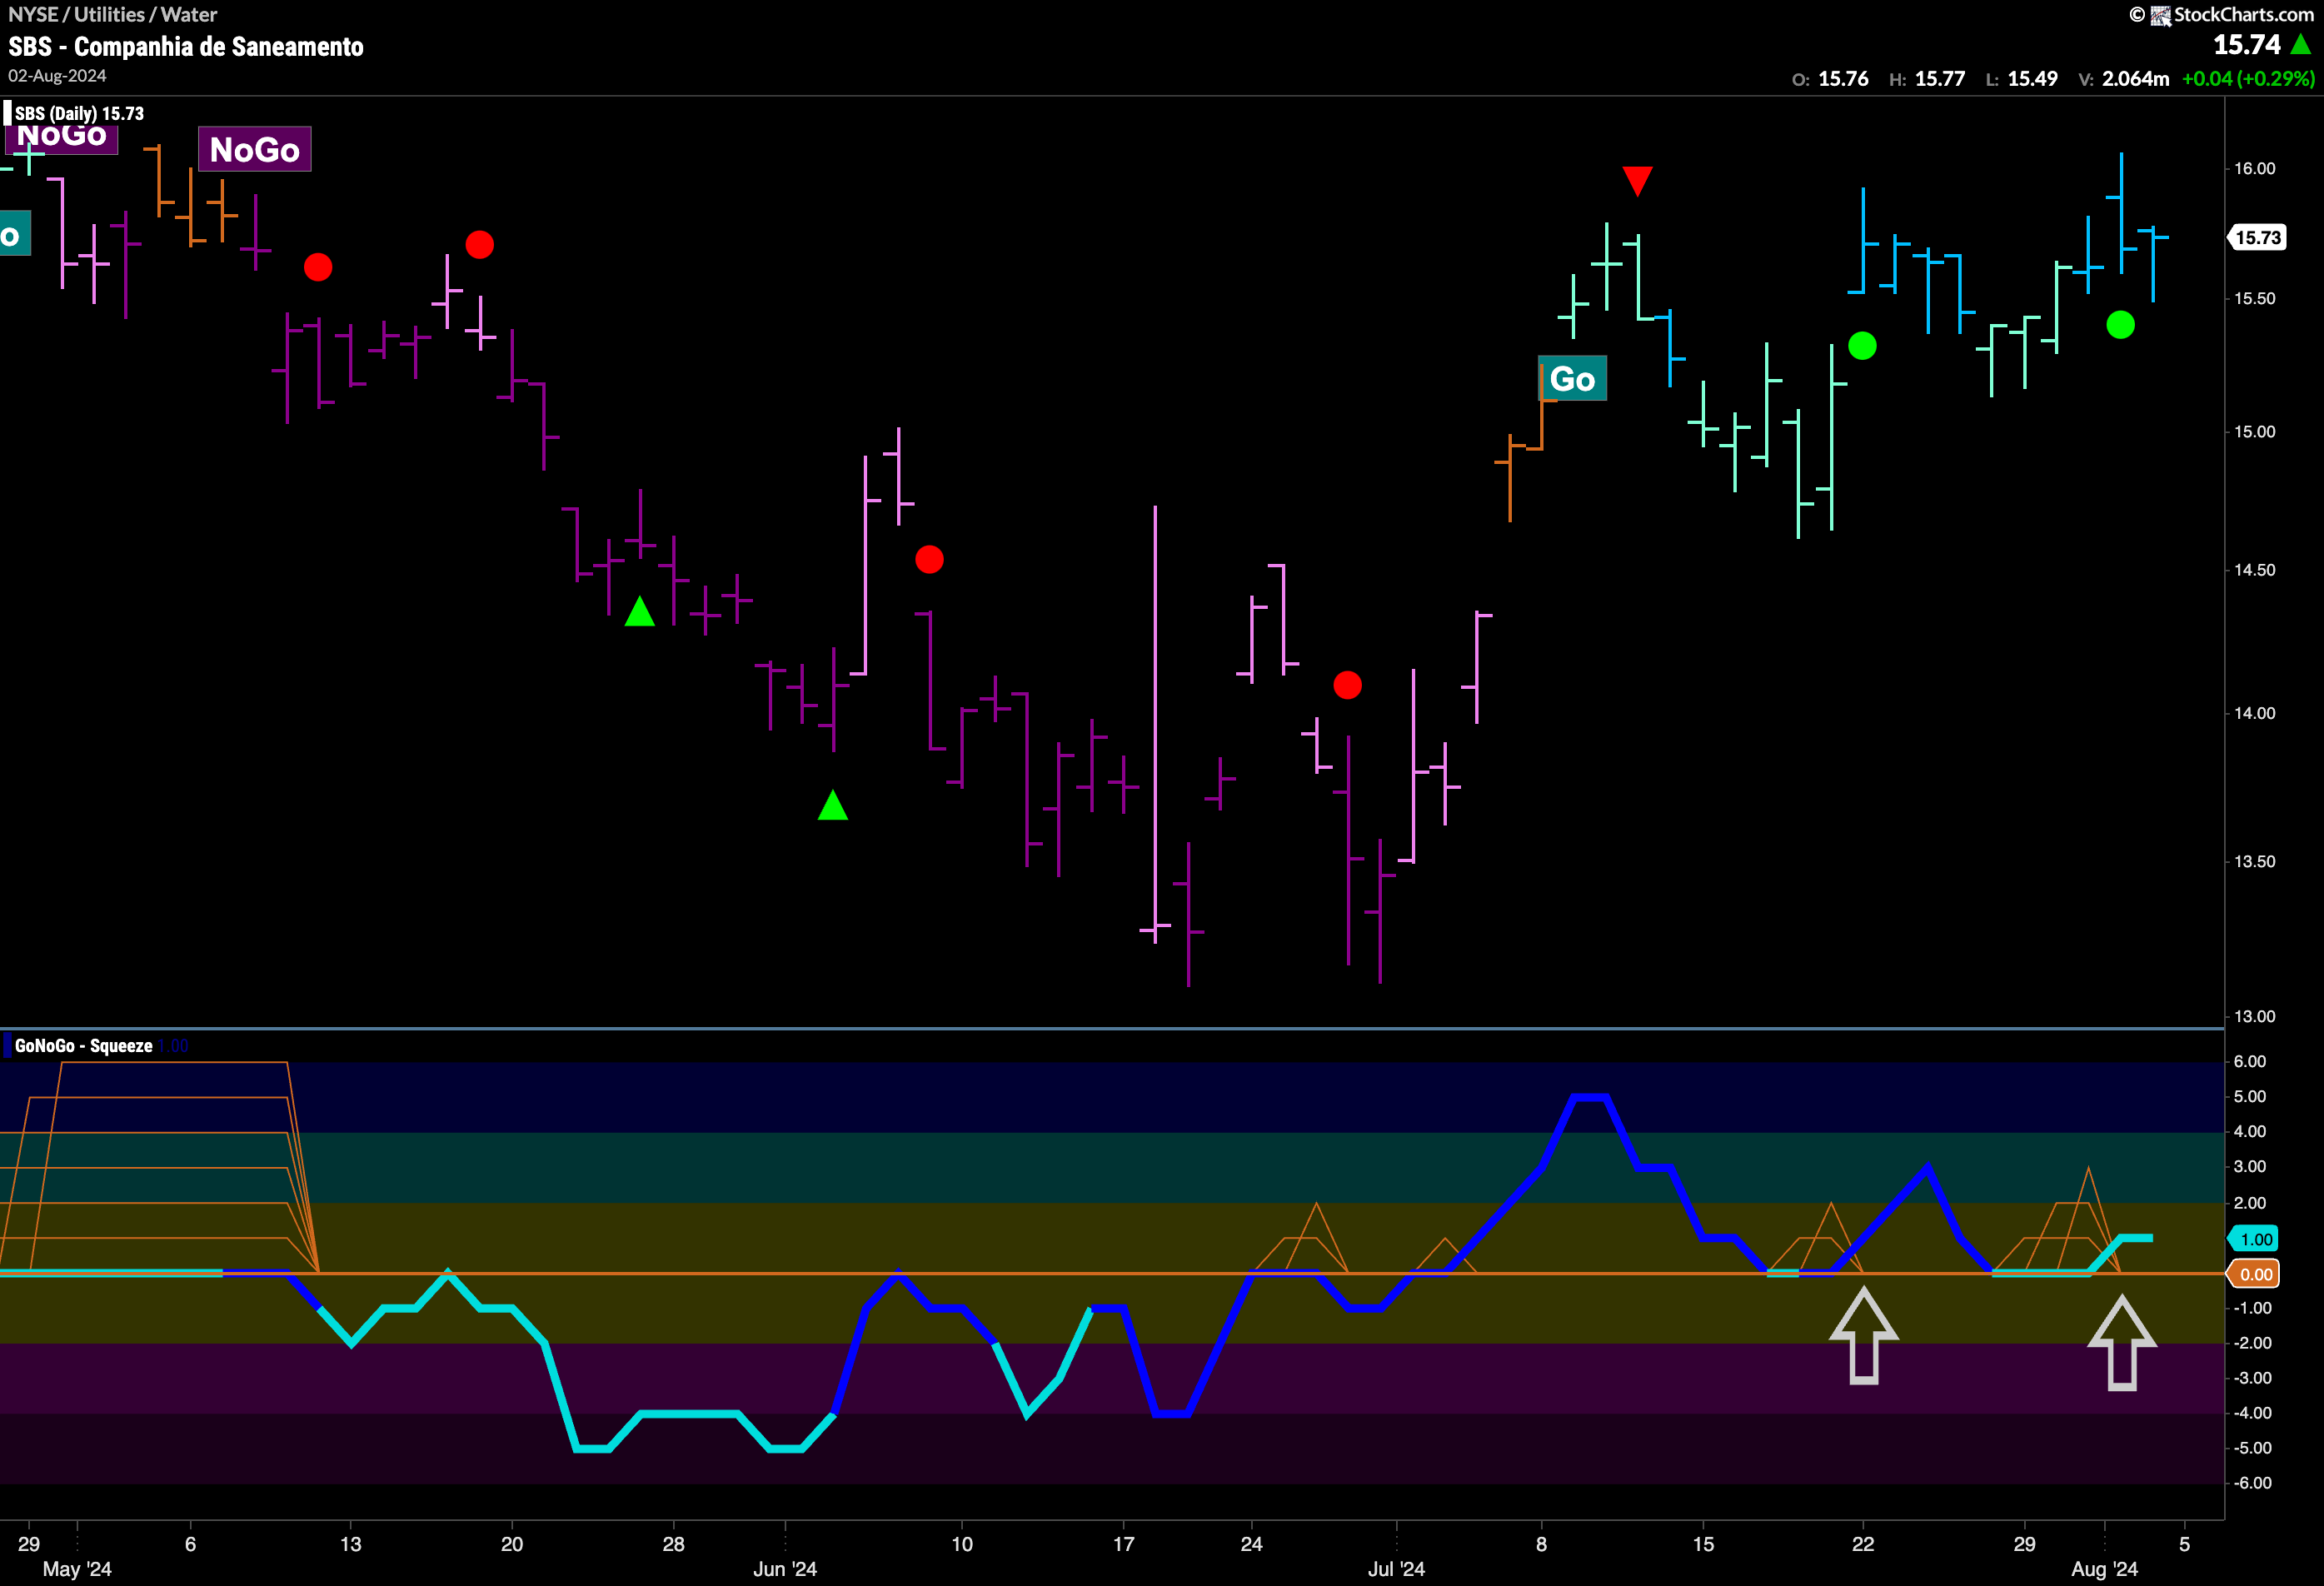
$SBS in “Go” Trend Looking For New Highs
$SBS has been in a “Go” trend now for almost a month. We have seen higher highs and higher lows as price rallied from the lows in June. As July hit, GoNoGo Oscillator broke into positive territory on heavy volume and it has been at or above zero since. Price is trying to make new highs, and GoNoGo Oscillator is so far finding support at the zero level. With GoNoGo Trend painting strong blue “Go” bars, and momentum resurgent in the direction of the underlying trend, we will look for a new high to be made.
$WTRG Tests Prior Highs
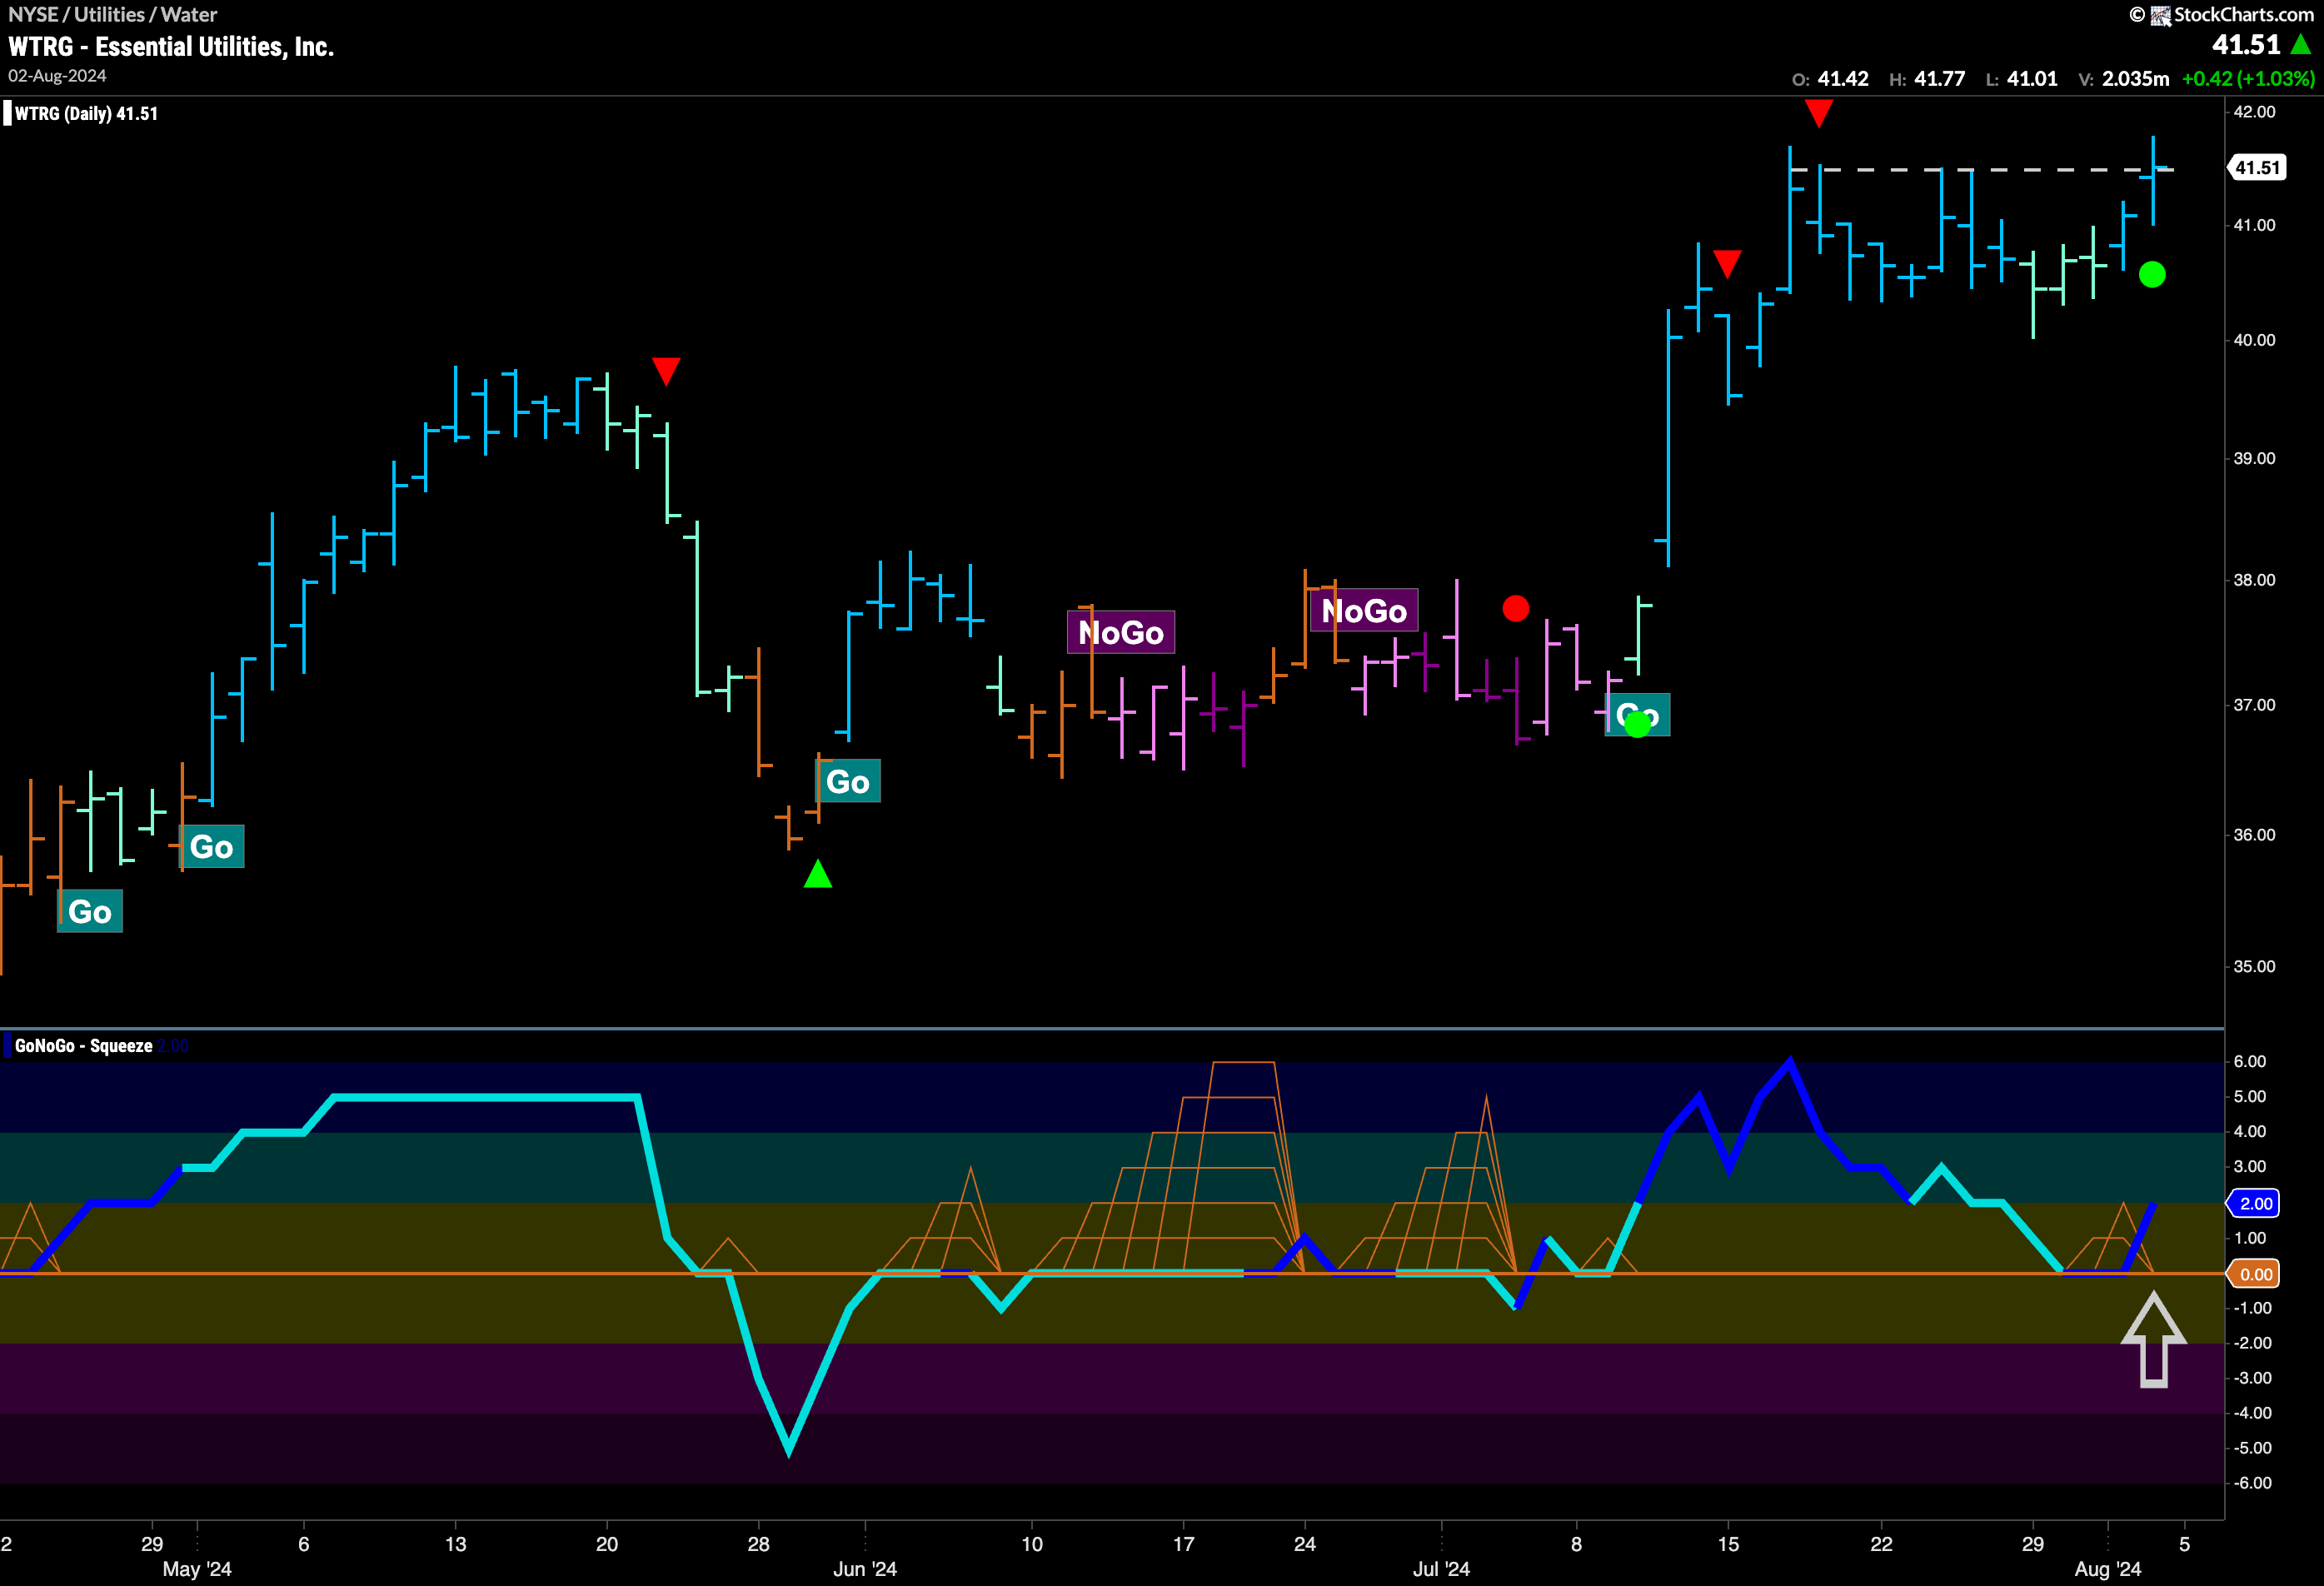
$WTRG is also looking strong as we can see on the daily chart below. Price is in a strong “Go” trend as it pushes up against resistance from recent highs. After the Go Countertrend Correction Icon (red arrow) we saw price move mostly sideways and the Trend indicator painted a few weaker aqua bars. The trend held, and now we see GoNoGo Trend painting strong blue bars once again. GoNoGo Oscillator during this sideways movement fell to test the zero line from below where it quickly found support on heavy volume. With momentum resurgent in the direction of the “Go” trend we will look for price to climb from here.
