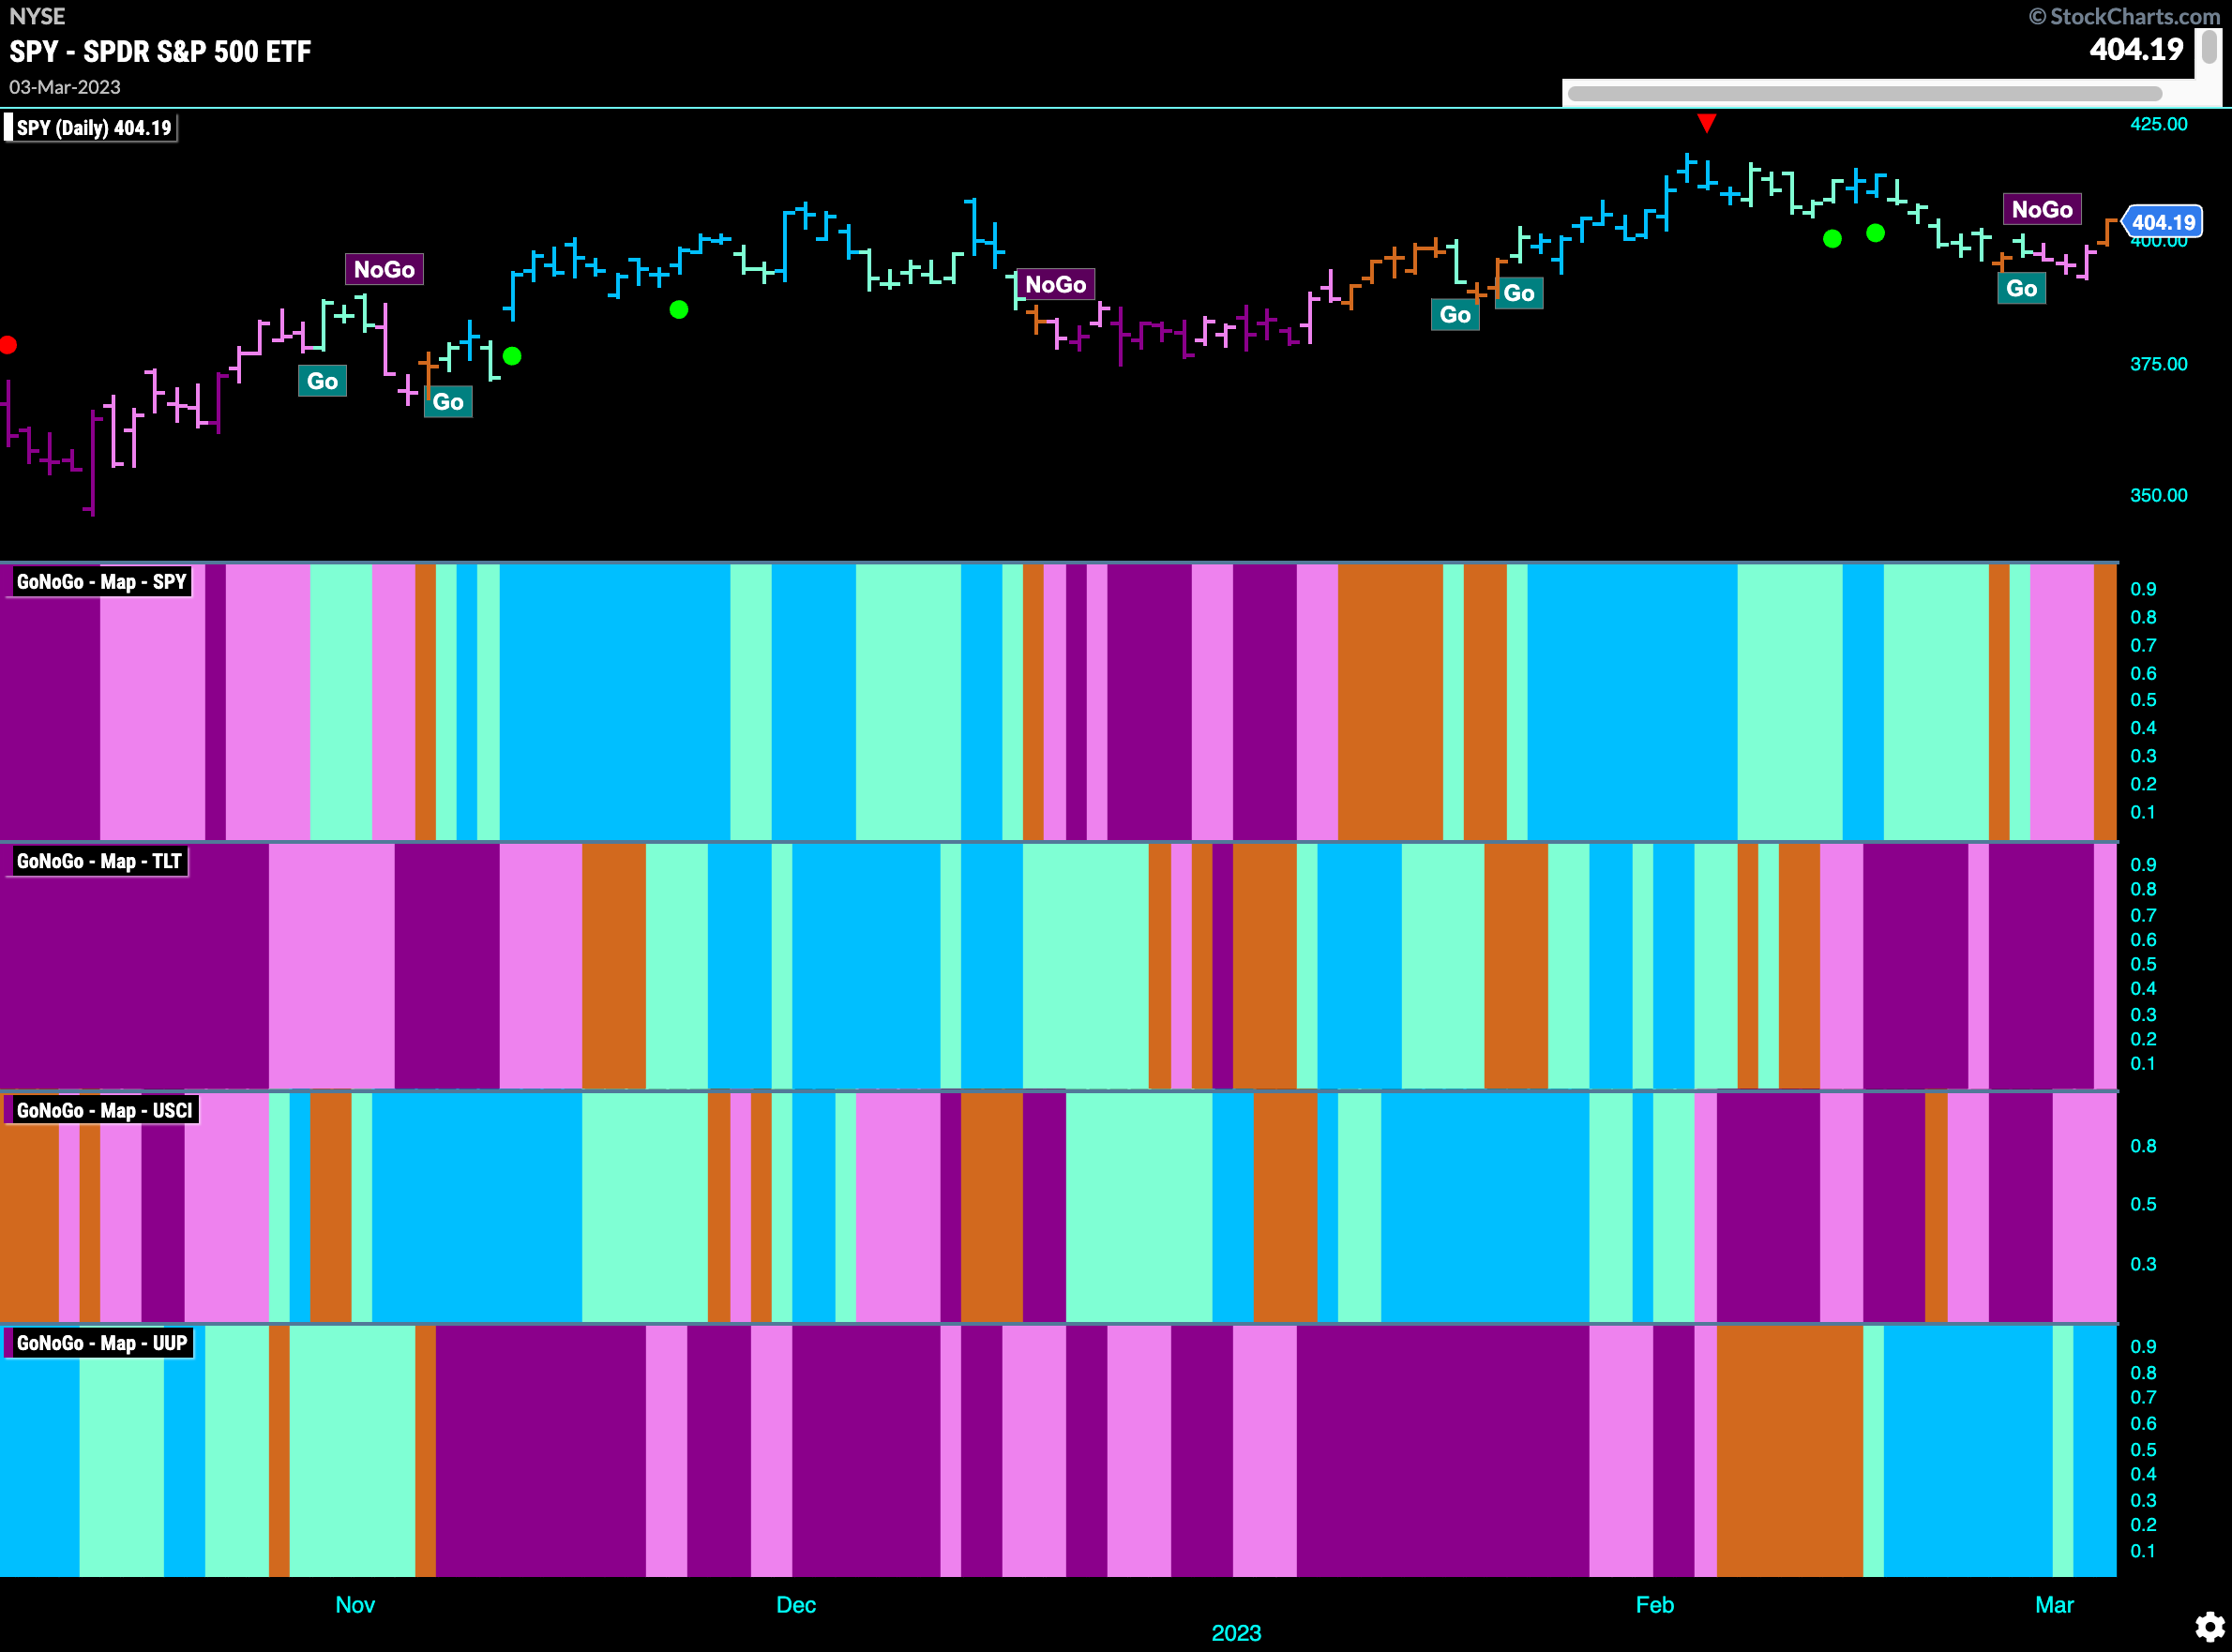
Good morning and welcome to this week’s Flight Path. Let’s take a look at the GoNoGo Asset map below. We saw a strong rally to end the week in equity prices as GoNoGo Trend relinquished its new “NoGo” trend and painted an amber “Go Fish” bar. Treasury bond prices and commodities remain in “NoGo” trends but paint weaker pink bars. The dollar stands alone as the only “Go” trend this week.
Equities Quickly Moved Higher to End Week with “Go Fish”
A strong Friday saw GoNoGo Trend paint an amber “Go Fish” bar as the new “NoGo” proved short lived. If this is a new higher low that would be a good sign for the bulls as we’d look for GoNoGo Trend to identify a “Go” trend. First, GoNoGo Oscillator will need to break back into positive territory. Currently, it is in negative territory but rising on heavy volume. 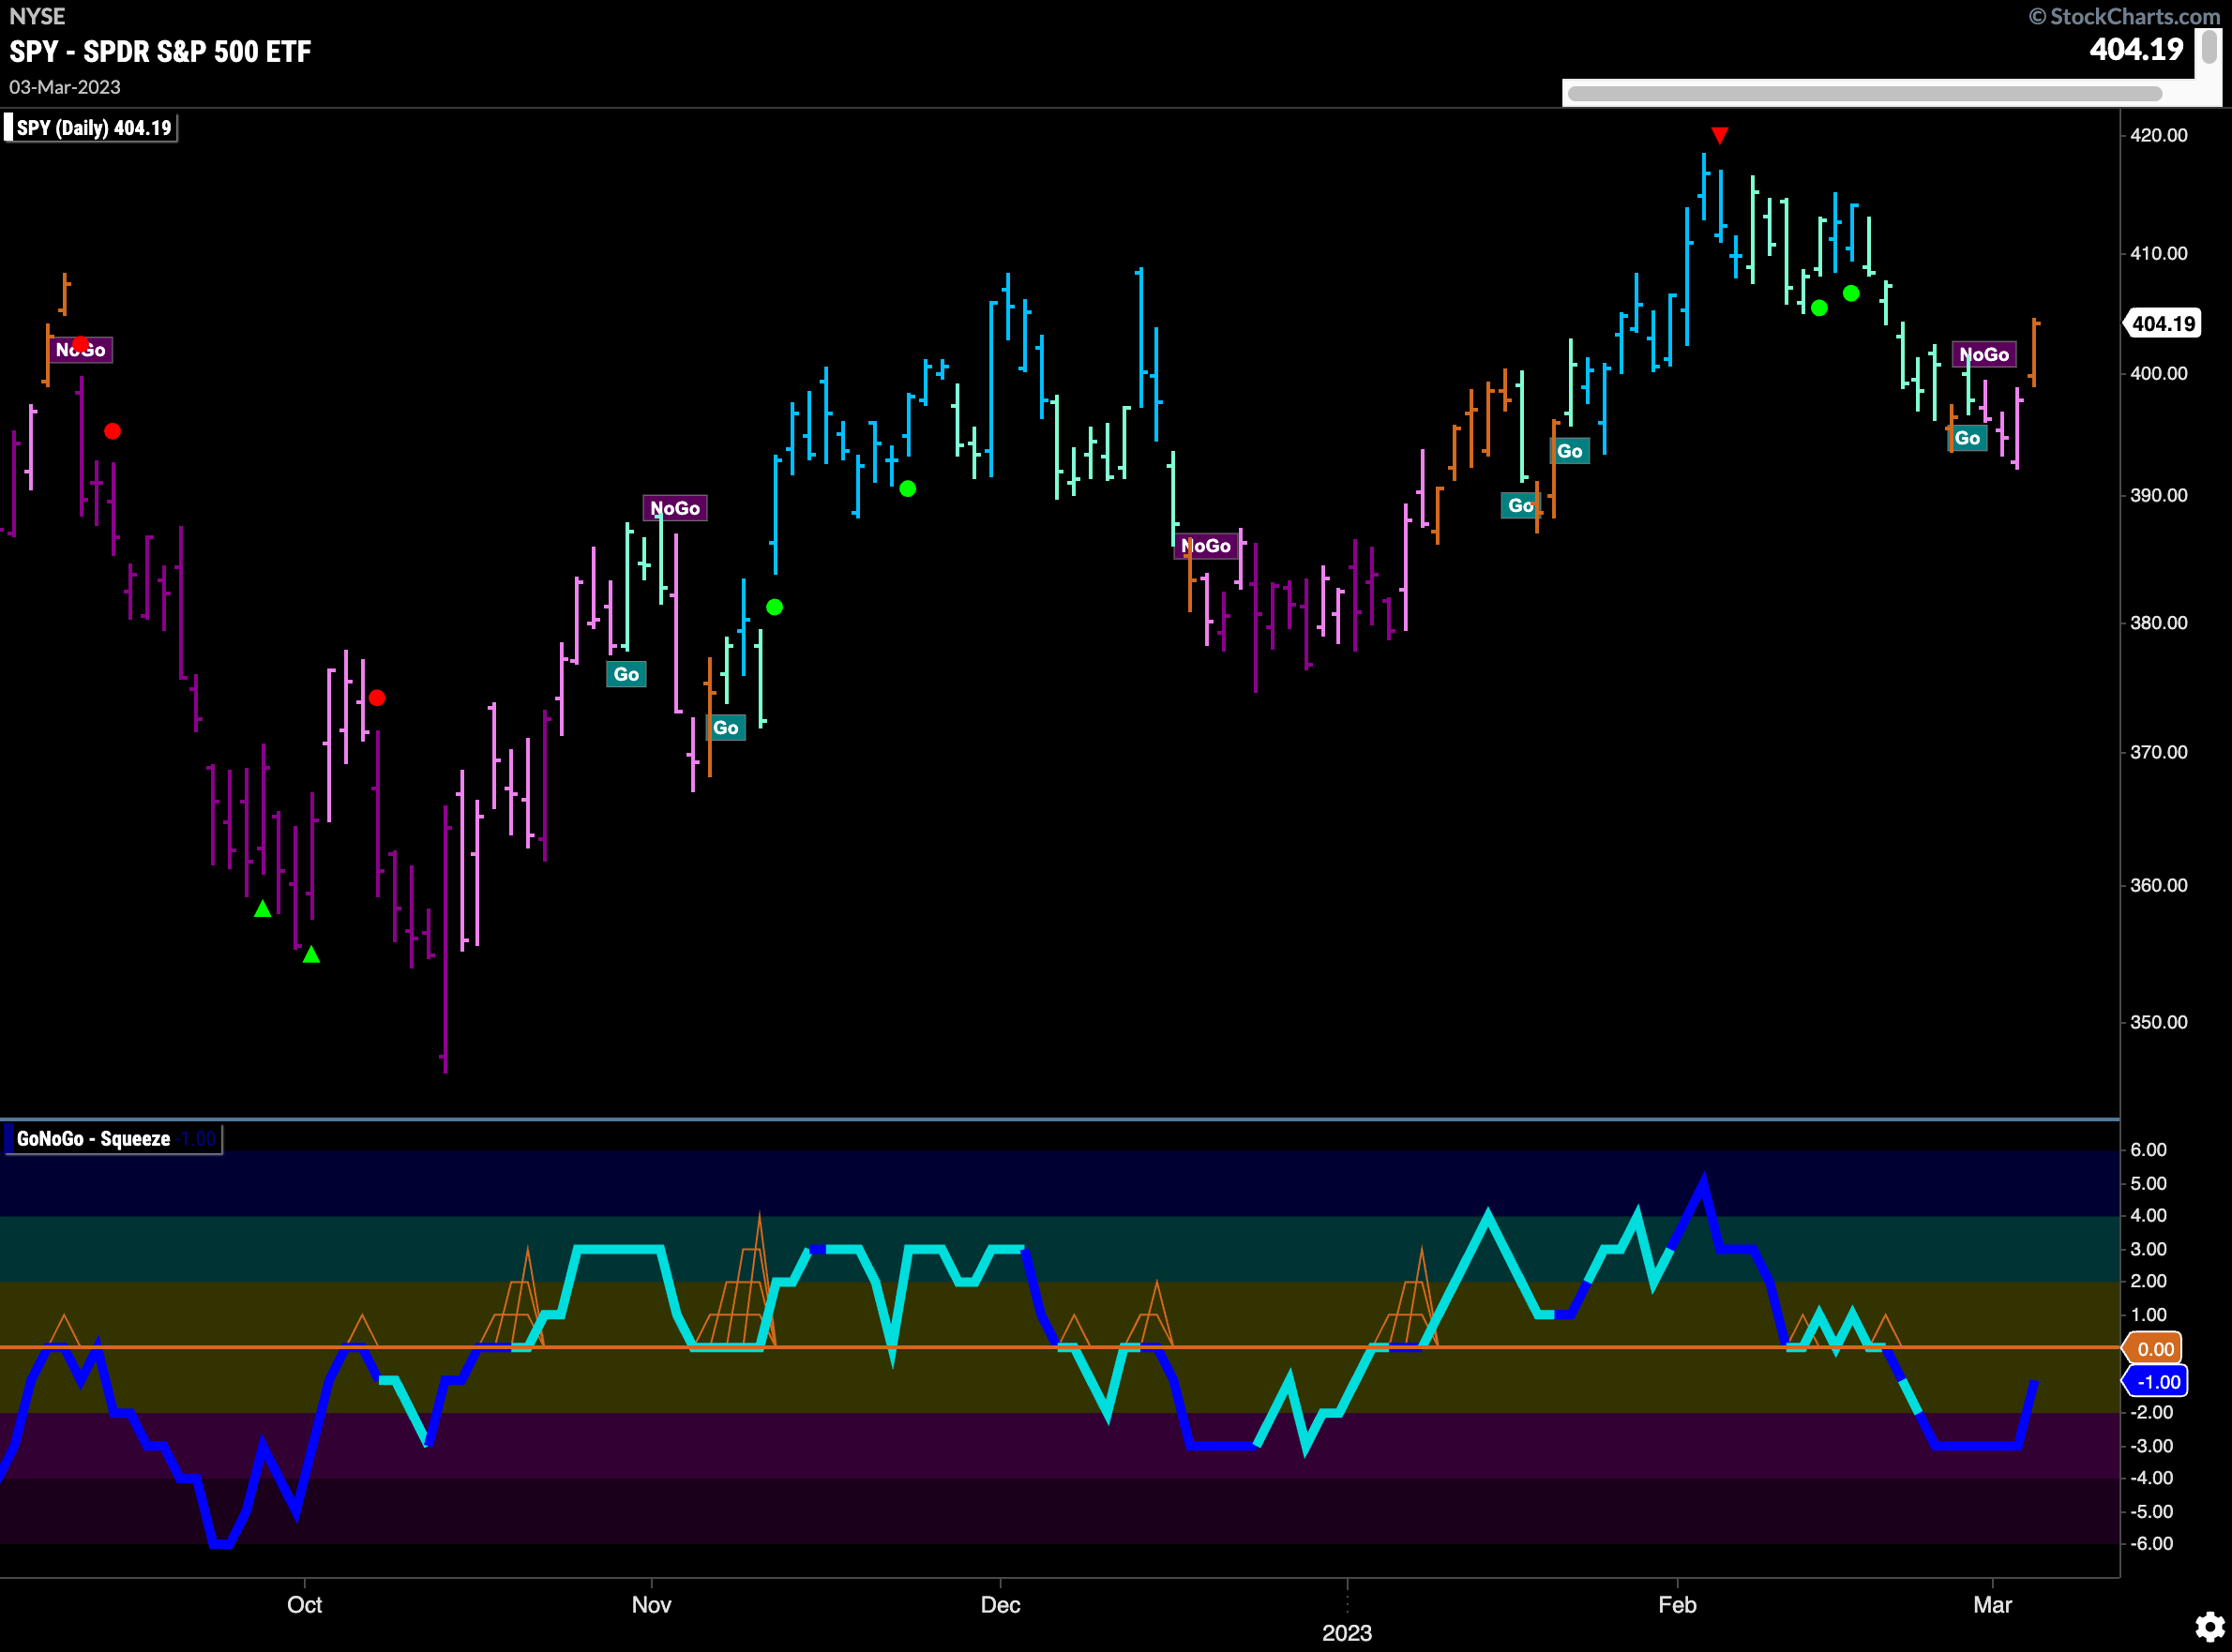
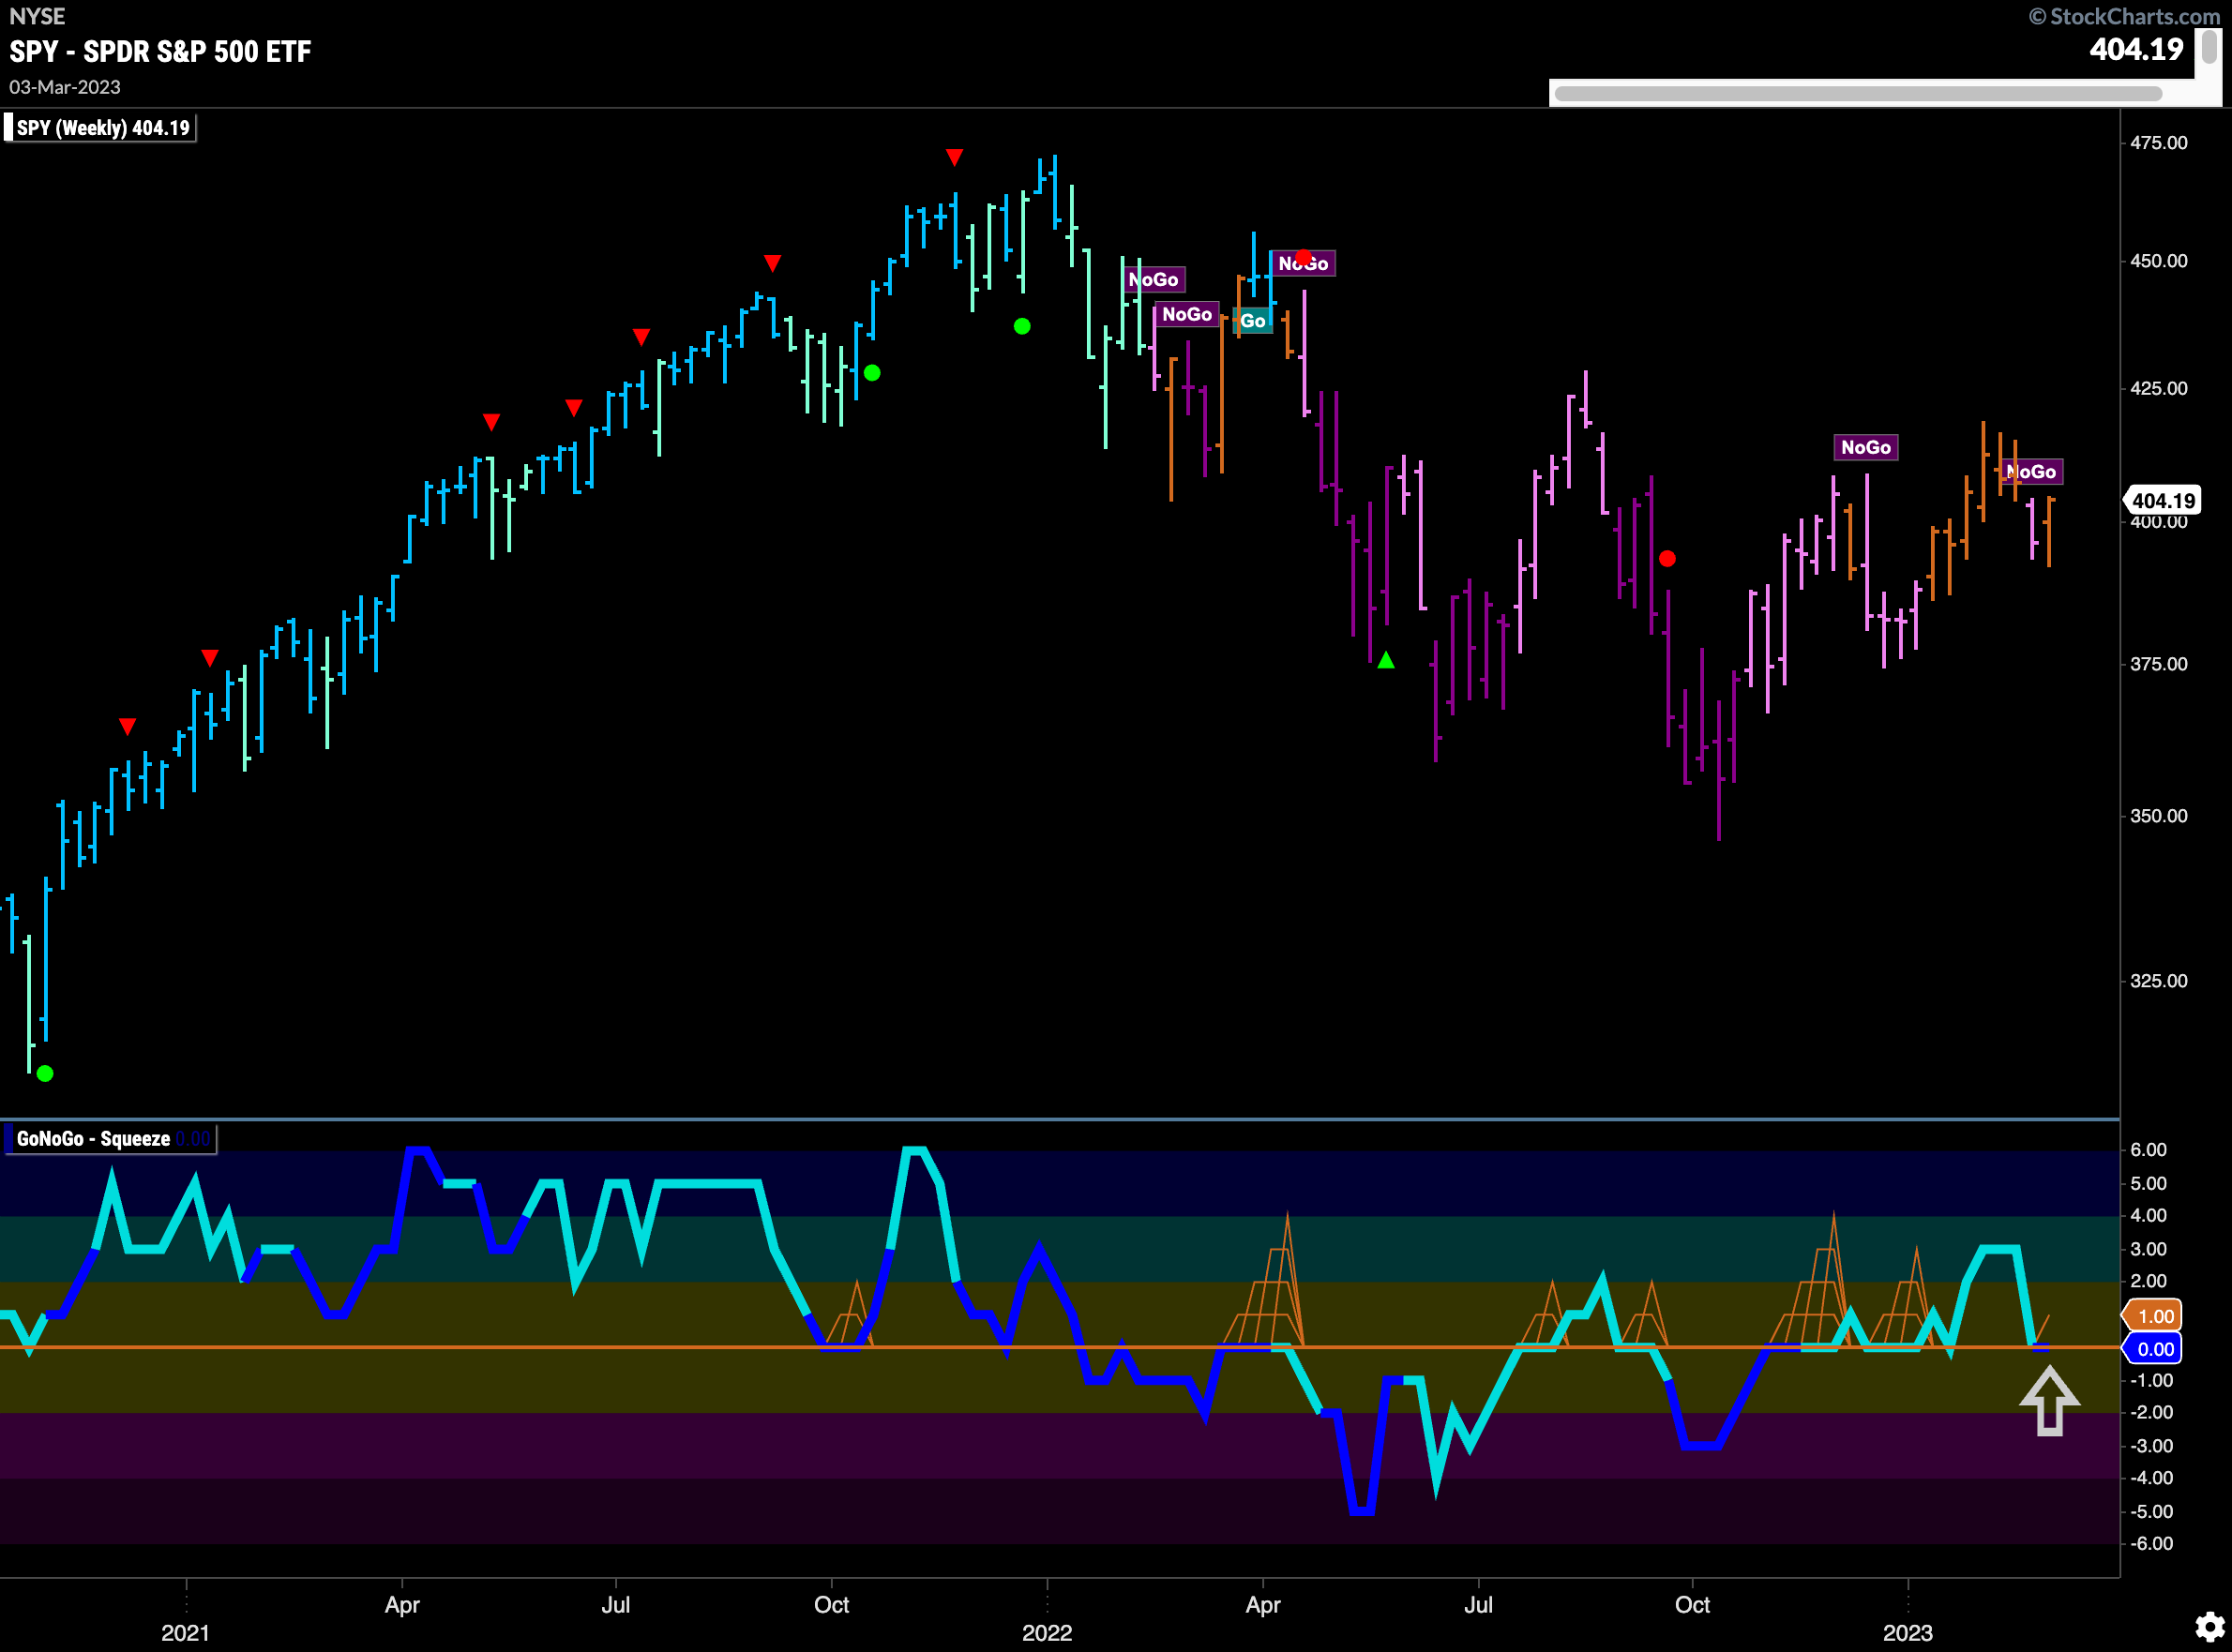
The longer term weekly chart shows that the strength we saw on the daily chart has allowed the weekly to paint an amber “Go Fish” bar as well. Price has failed to test the depths of the October lows and this would be second higher low if it holds. We will look for price to get above $420 which would be a new higher high. GoNoGo Oscillator is testing the zero line from above where we will look to see if it finds support.
Treasury Rates Paint Weaker Aqua “Go” Bar
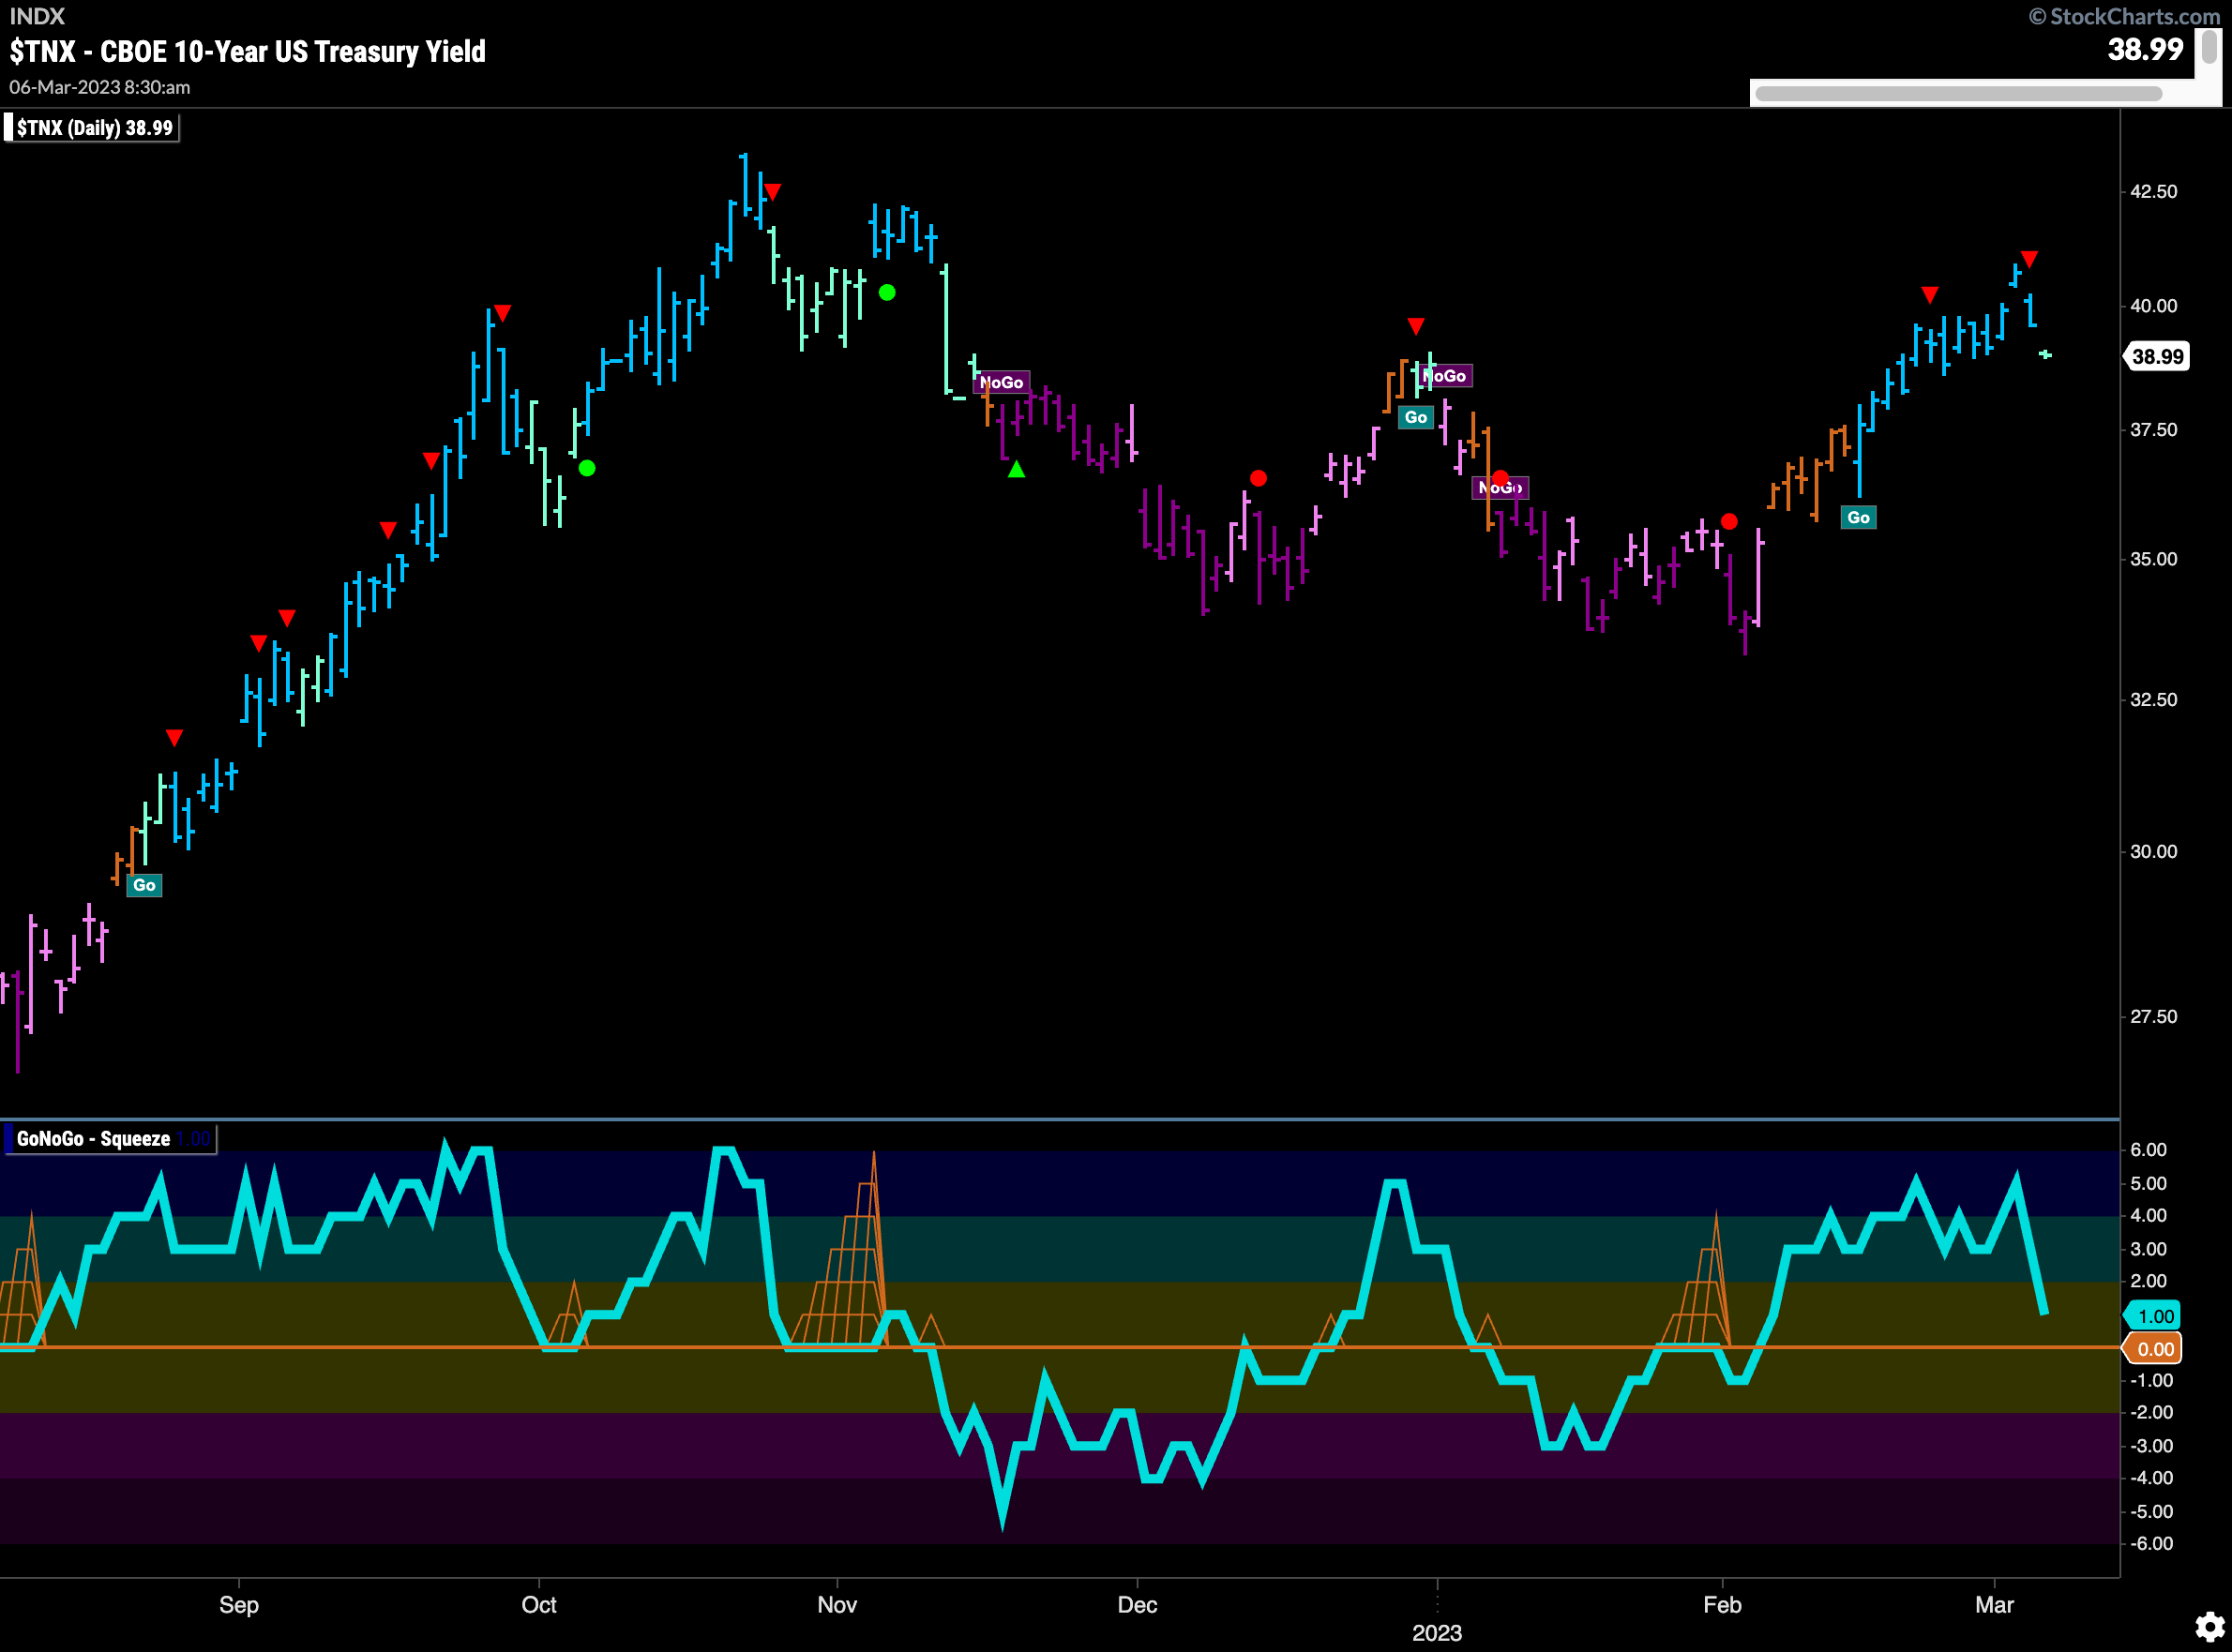
Treasury rates fell back at the end of the week as equity prices rose. Still in a “Go” trend however with GoNoGo Oscillator above the zero line we will watch to see if they continue to provide headwinds for U.S. Equities. We must also remember that rates are rising on the larger time frame as GoNoGo Trend paints “Go” bars on the weekly chart.
The Dollar Remains in “Go” Trend
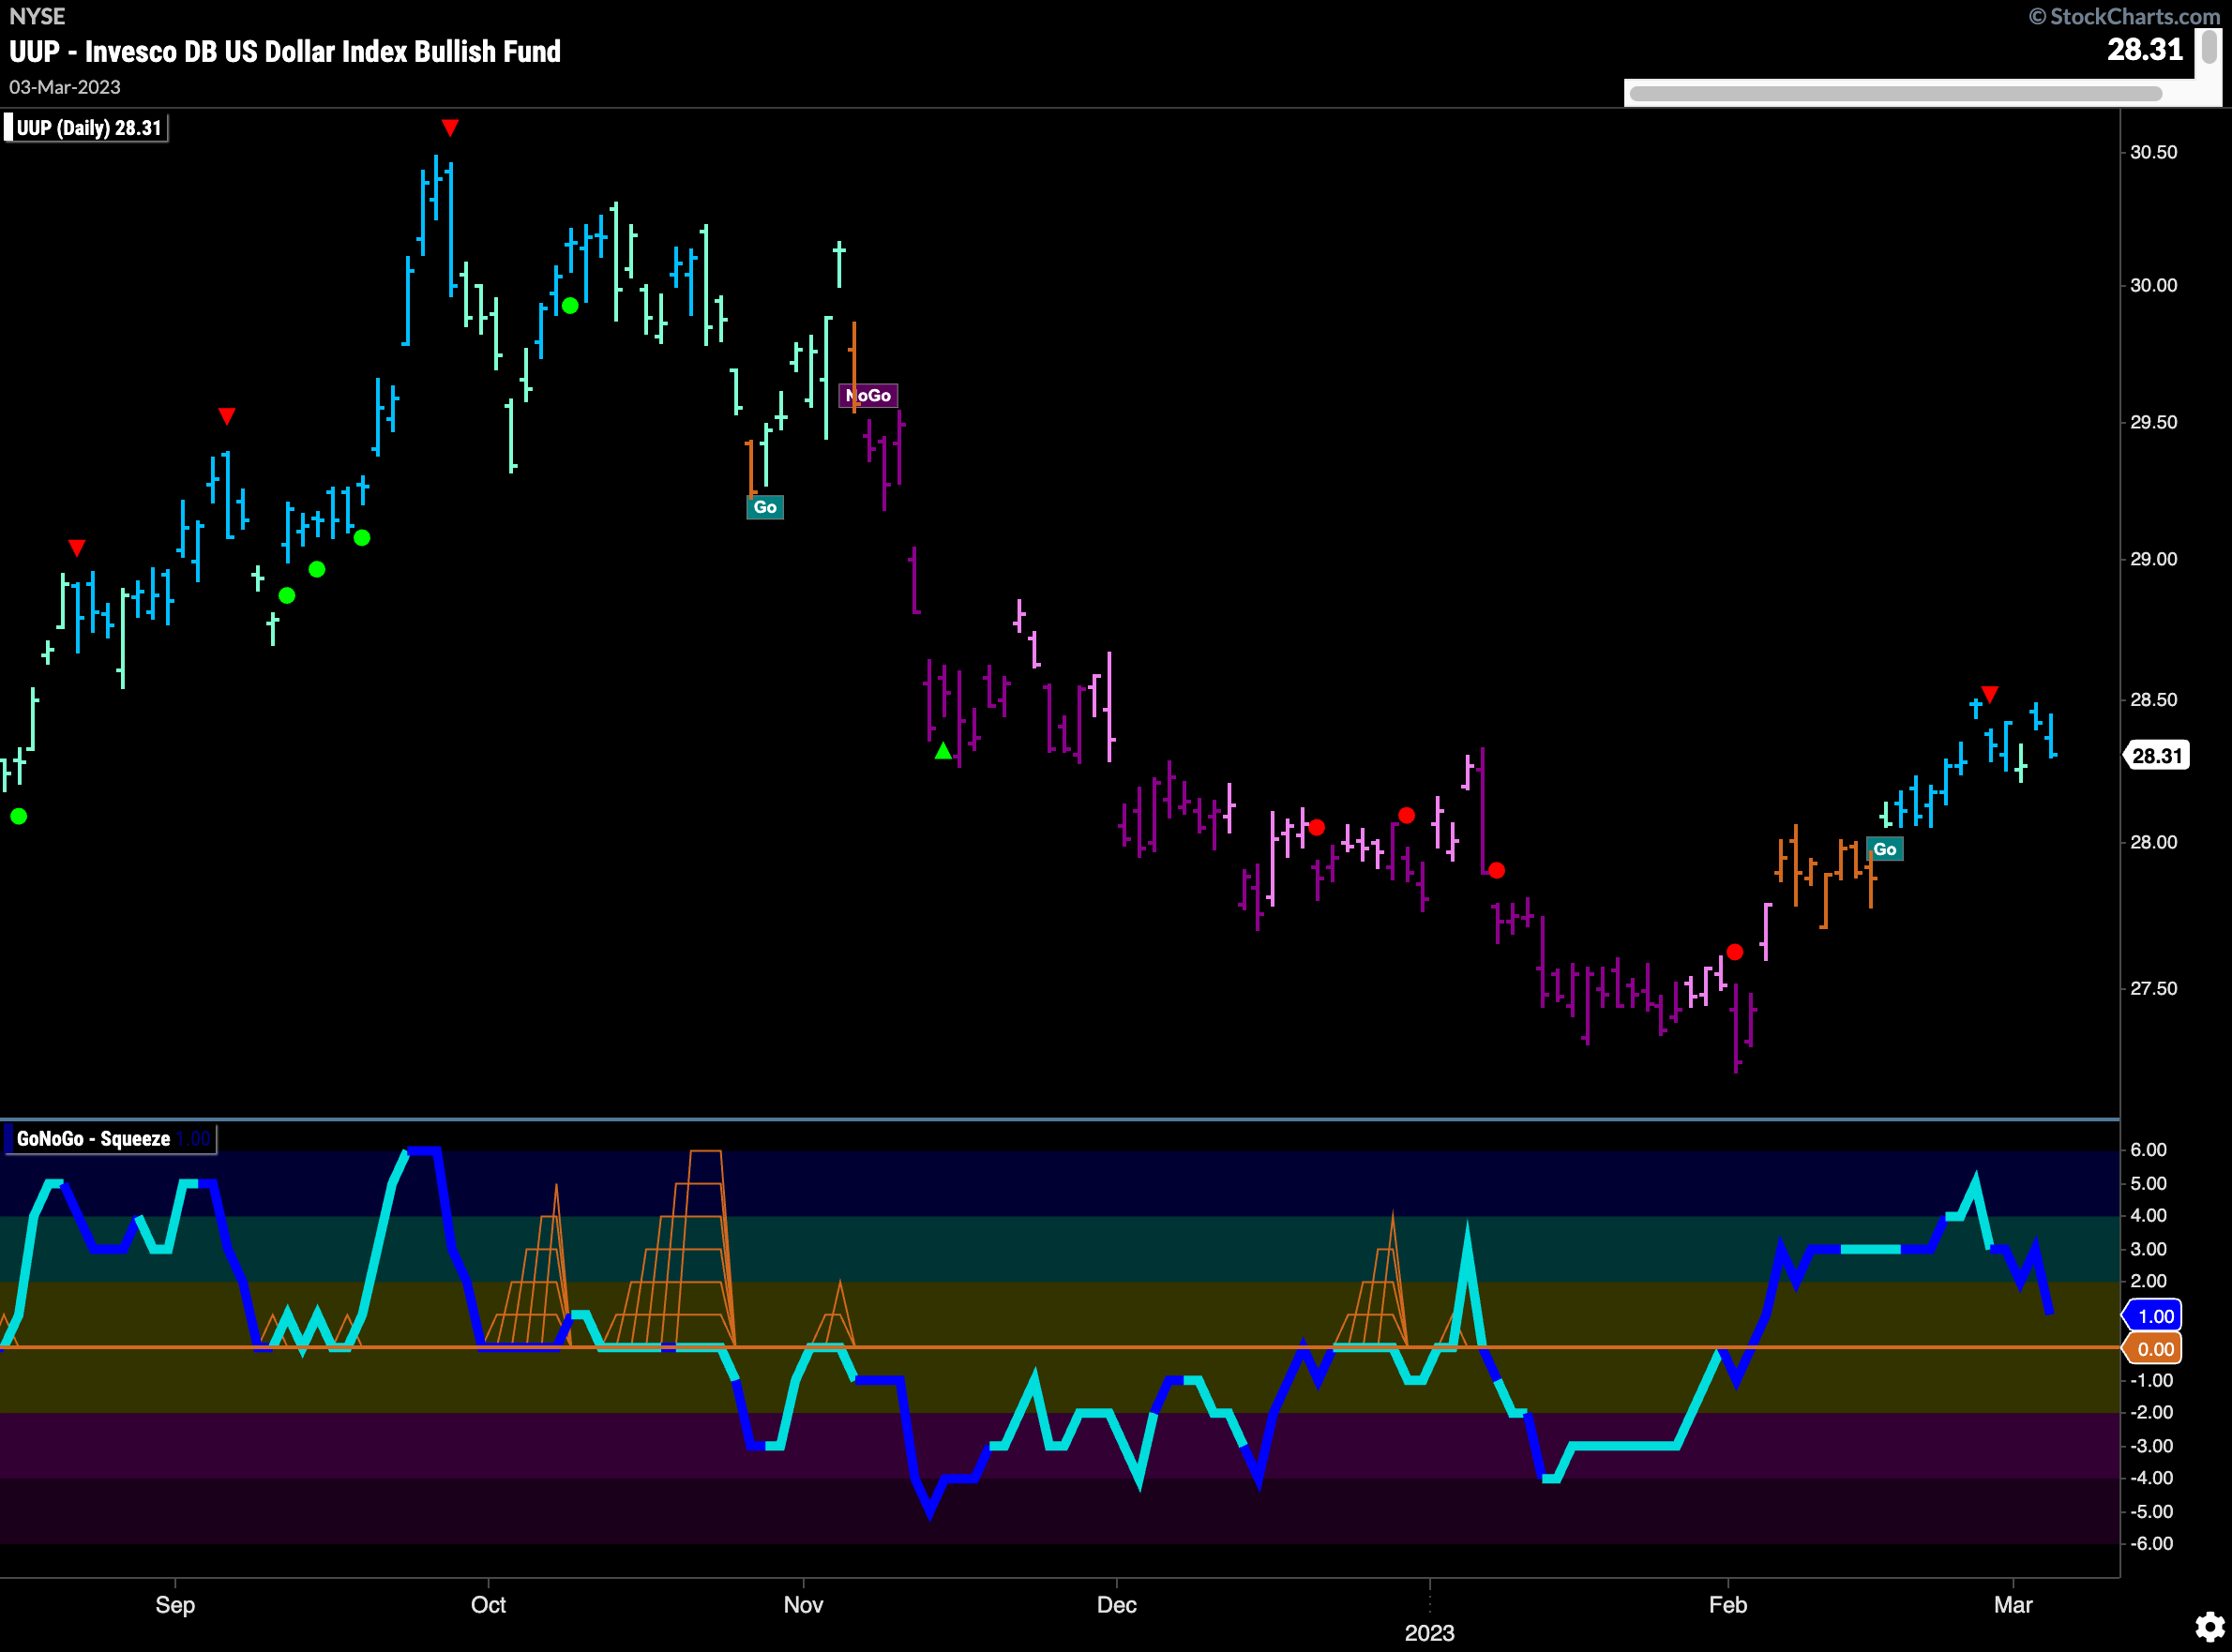
A “Go” trend persists for the dollar this week. Moving mostly sideways, the greenback was able to end the week with strong blue “Go” bars even as it closed lower. GoNoGo Oscillator is in positive territory but approaching zero on heavy volume. We will watch to see if that level provides support for the relatively new “Go” trend.
Gold Sees “NoGo” Trend Testing Resistance
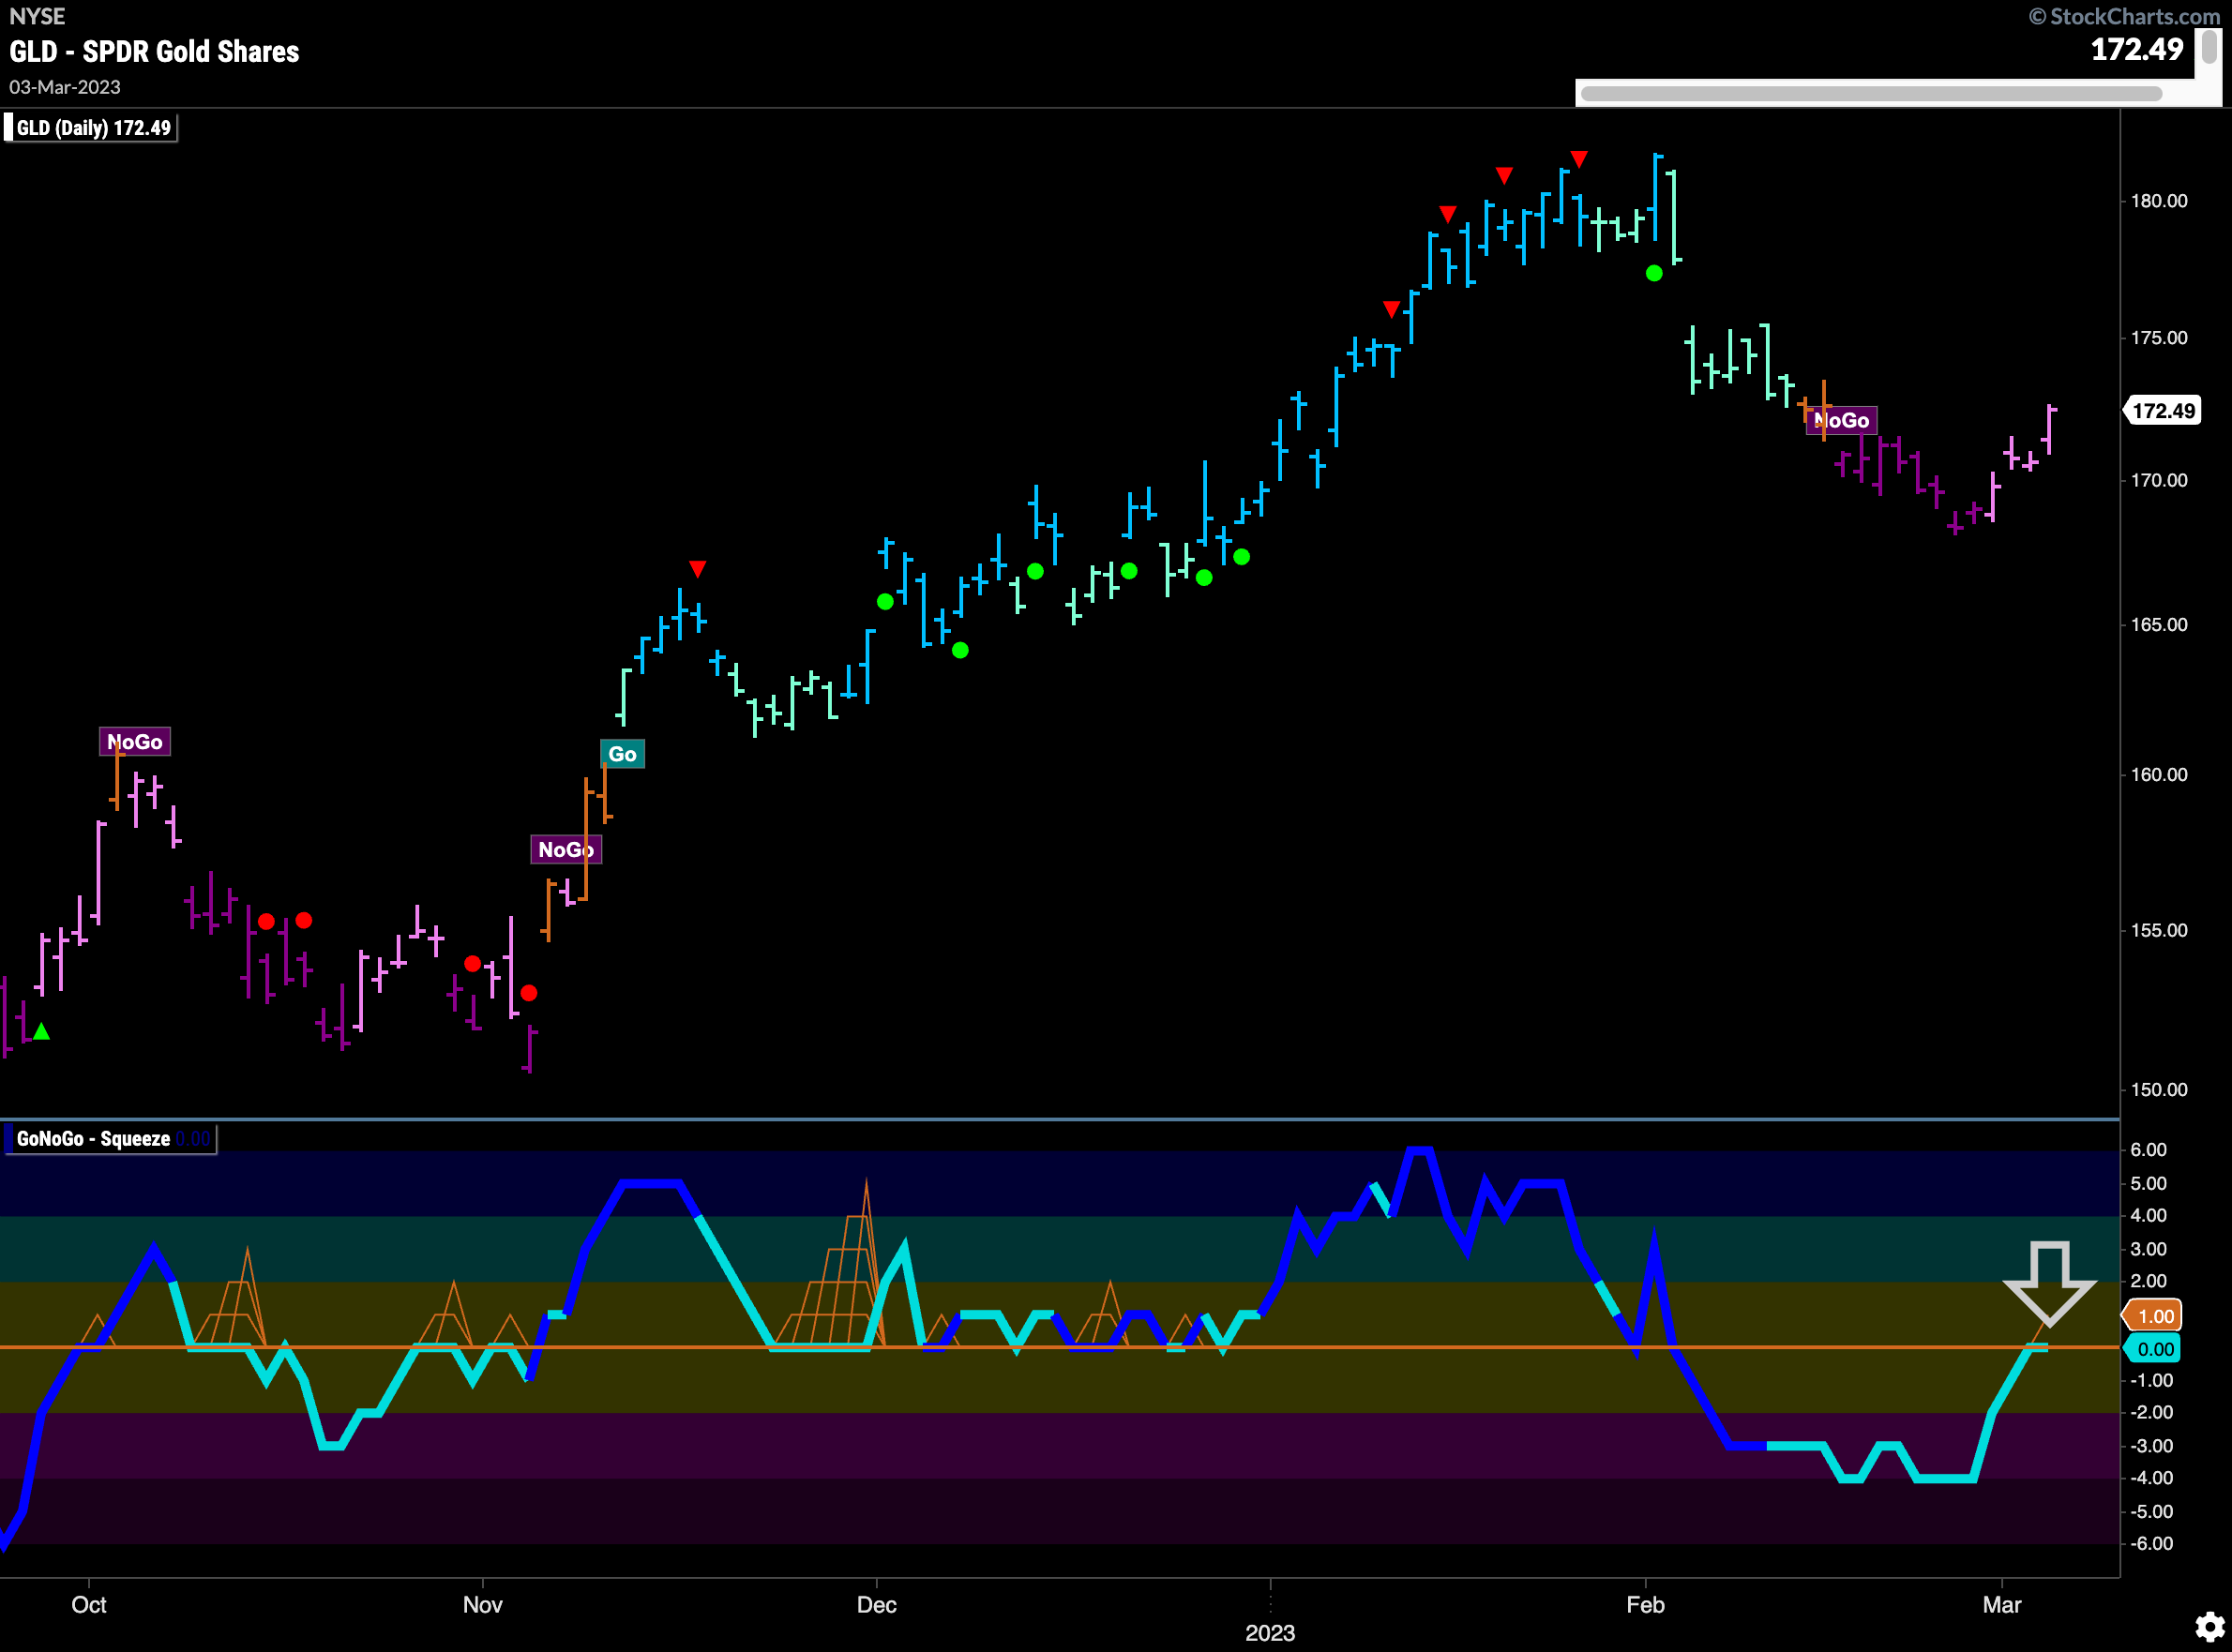
Gold prices have rallied this week and we have seen a string of weaker pink “NoGo” bars. We are now testing resistance from the support we saw at the end of the last “Go” trend and more importantly, GoNoGo Oscillator is testing the zero line from below. If this “NoGo” trend is to survive, we know that this level should act as resistance. We will watch to see if the oscillator gets turned away here.
Oil Faces Continued Downward Pressure
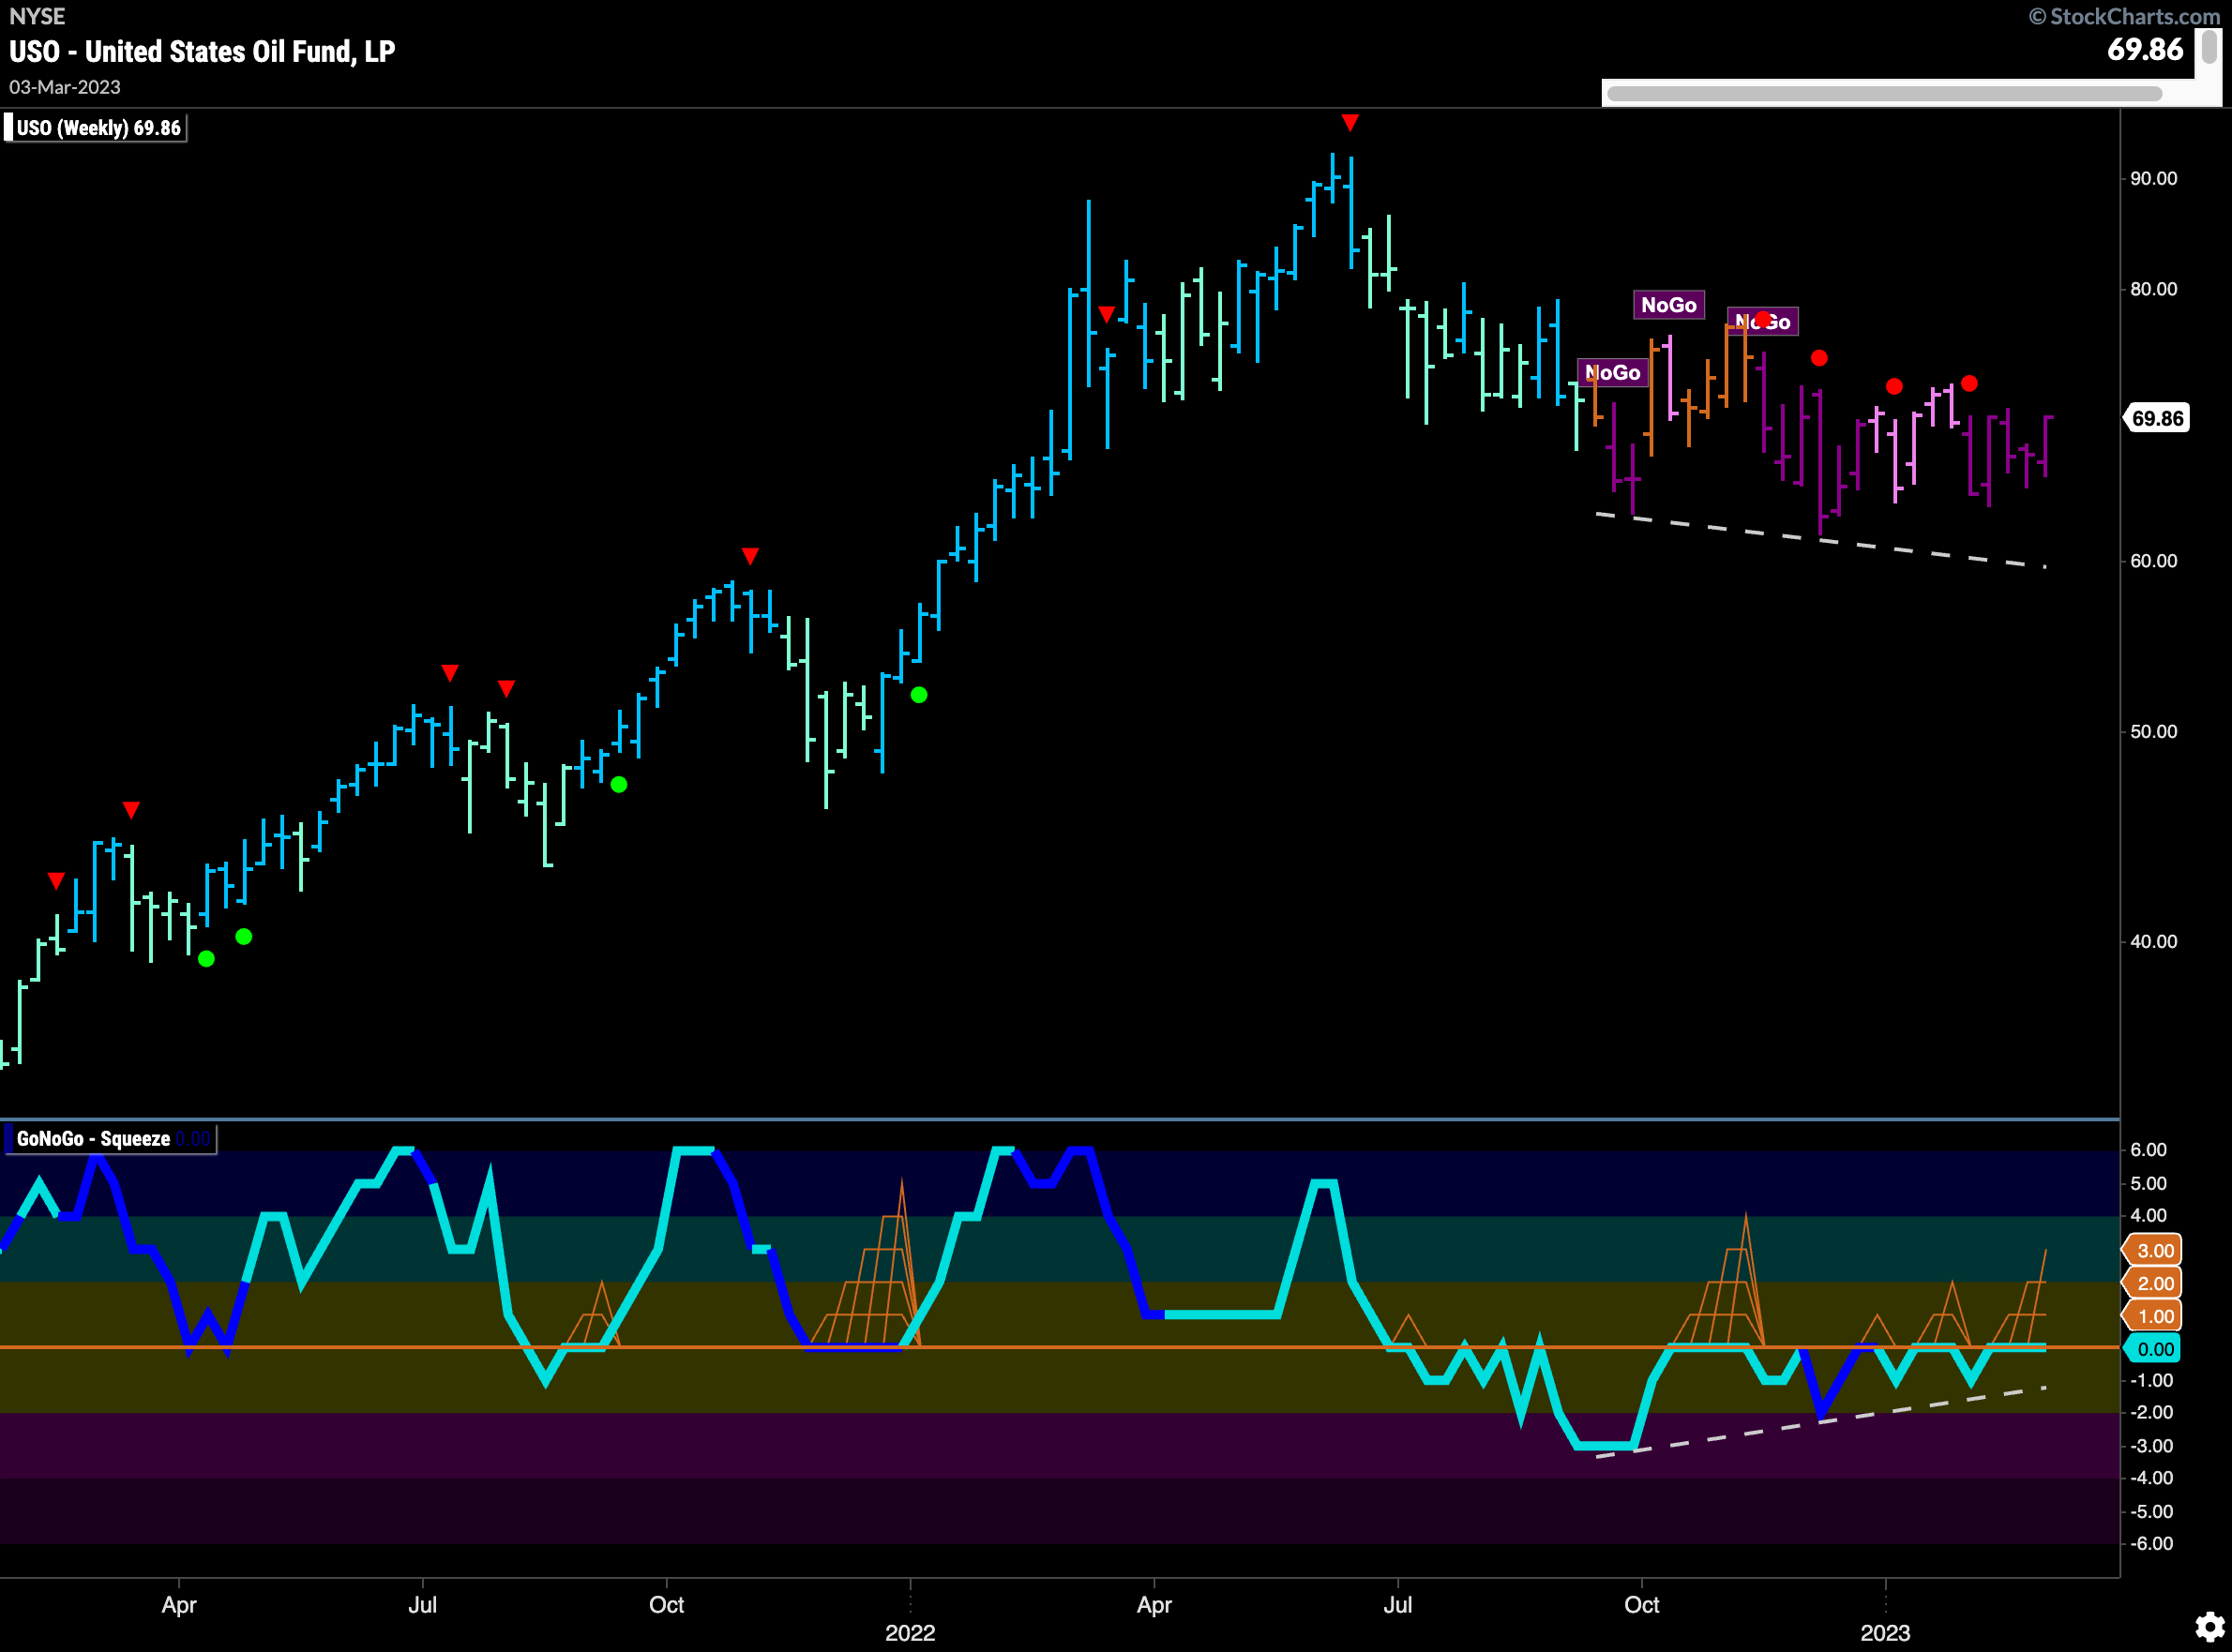
Is it time to talk about the bullish divergence we are seeing on this chart? As price has been edging lower and we have seen the GoNoGo Trend indicator paint consistent “NoGo” bars, its also true that GoNoGo Oscillator has been making higher lows. Each week we have watched to see if GoNoGO Oscillator finds resistance at zero and so far it has. We are there again, with GoNoGo Oscillator riding the zero line as a GoNoGo Squeeze begins to build. We will watch to see if this time it can break into positive territory.
 Sector RelMap
Below is the GoNoGo Sector RelMap. This GoNoGo RelMap applies the GoNoGo Trend to the relative strength ratios of the sectors to the base index. Looking at this map, we can quickly see where the relative outperformance is coming from as well as which sectors are lagging on a relative basis. 4 sectors are outperforming the base this week. $XLK, $XLY, $XLI, and $XLB are painting “Go” bars. The middle of the chart appears to be changing trend. 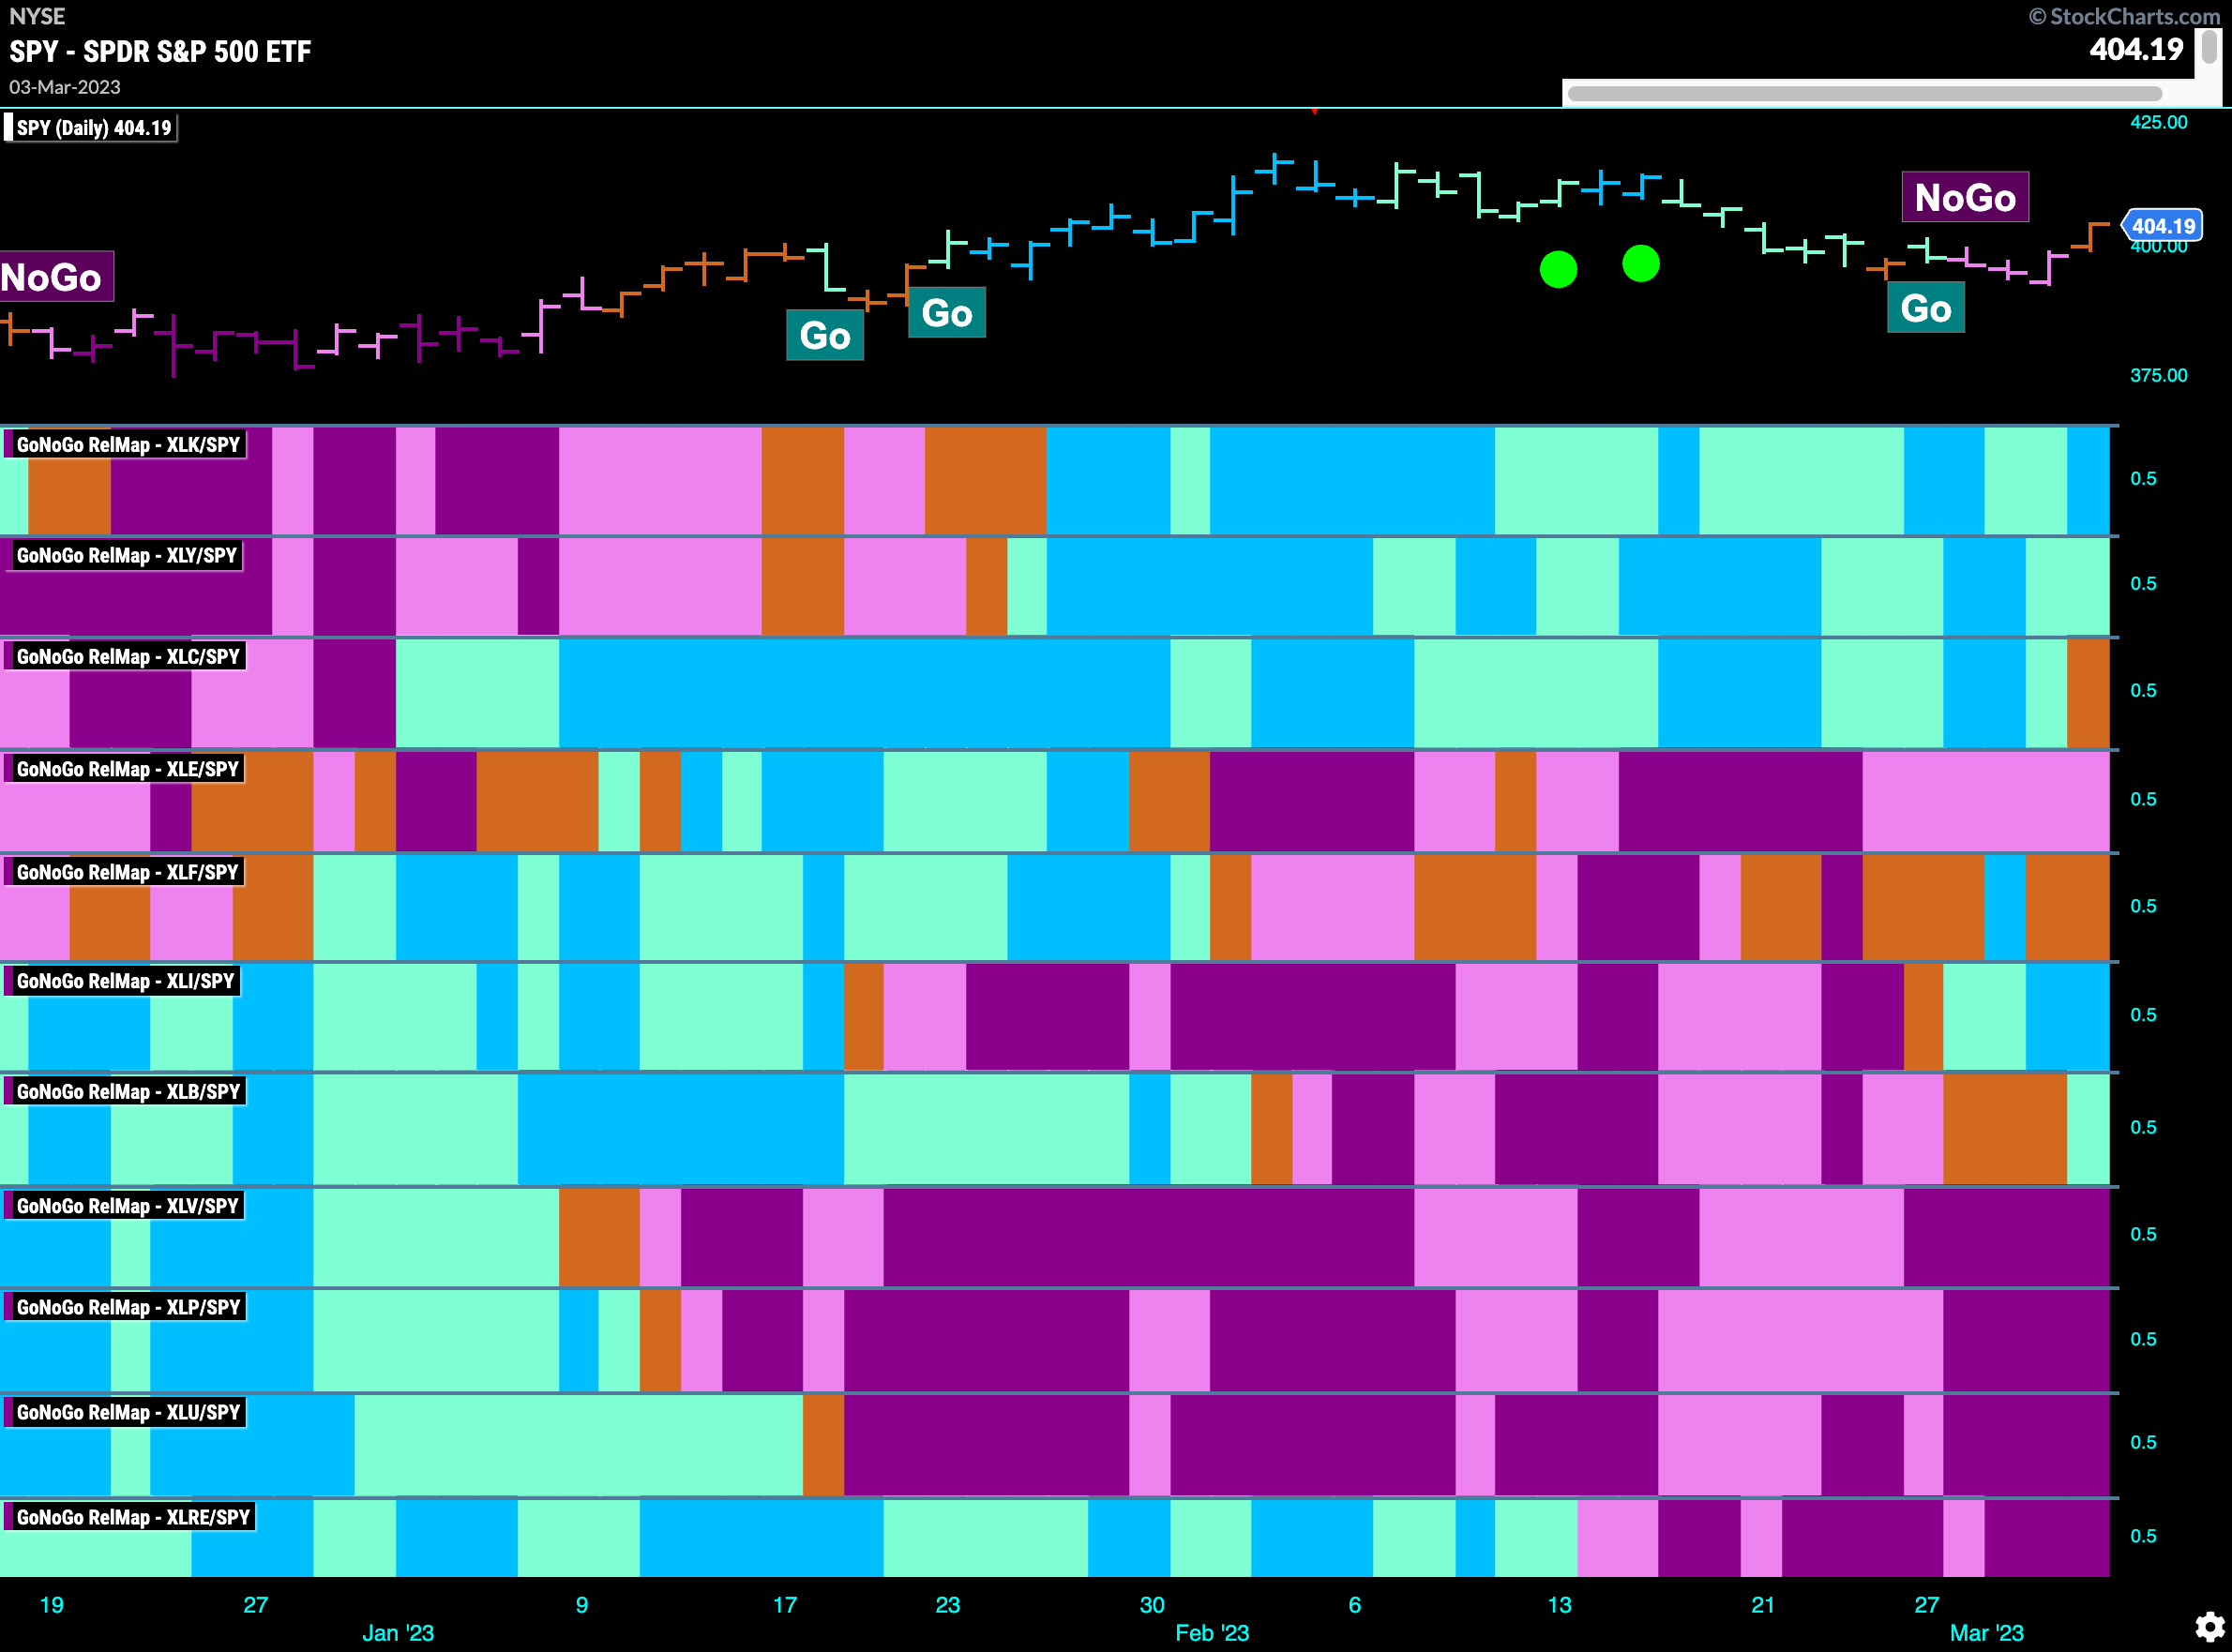
Breaking Down Materials ($XLB)
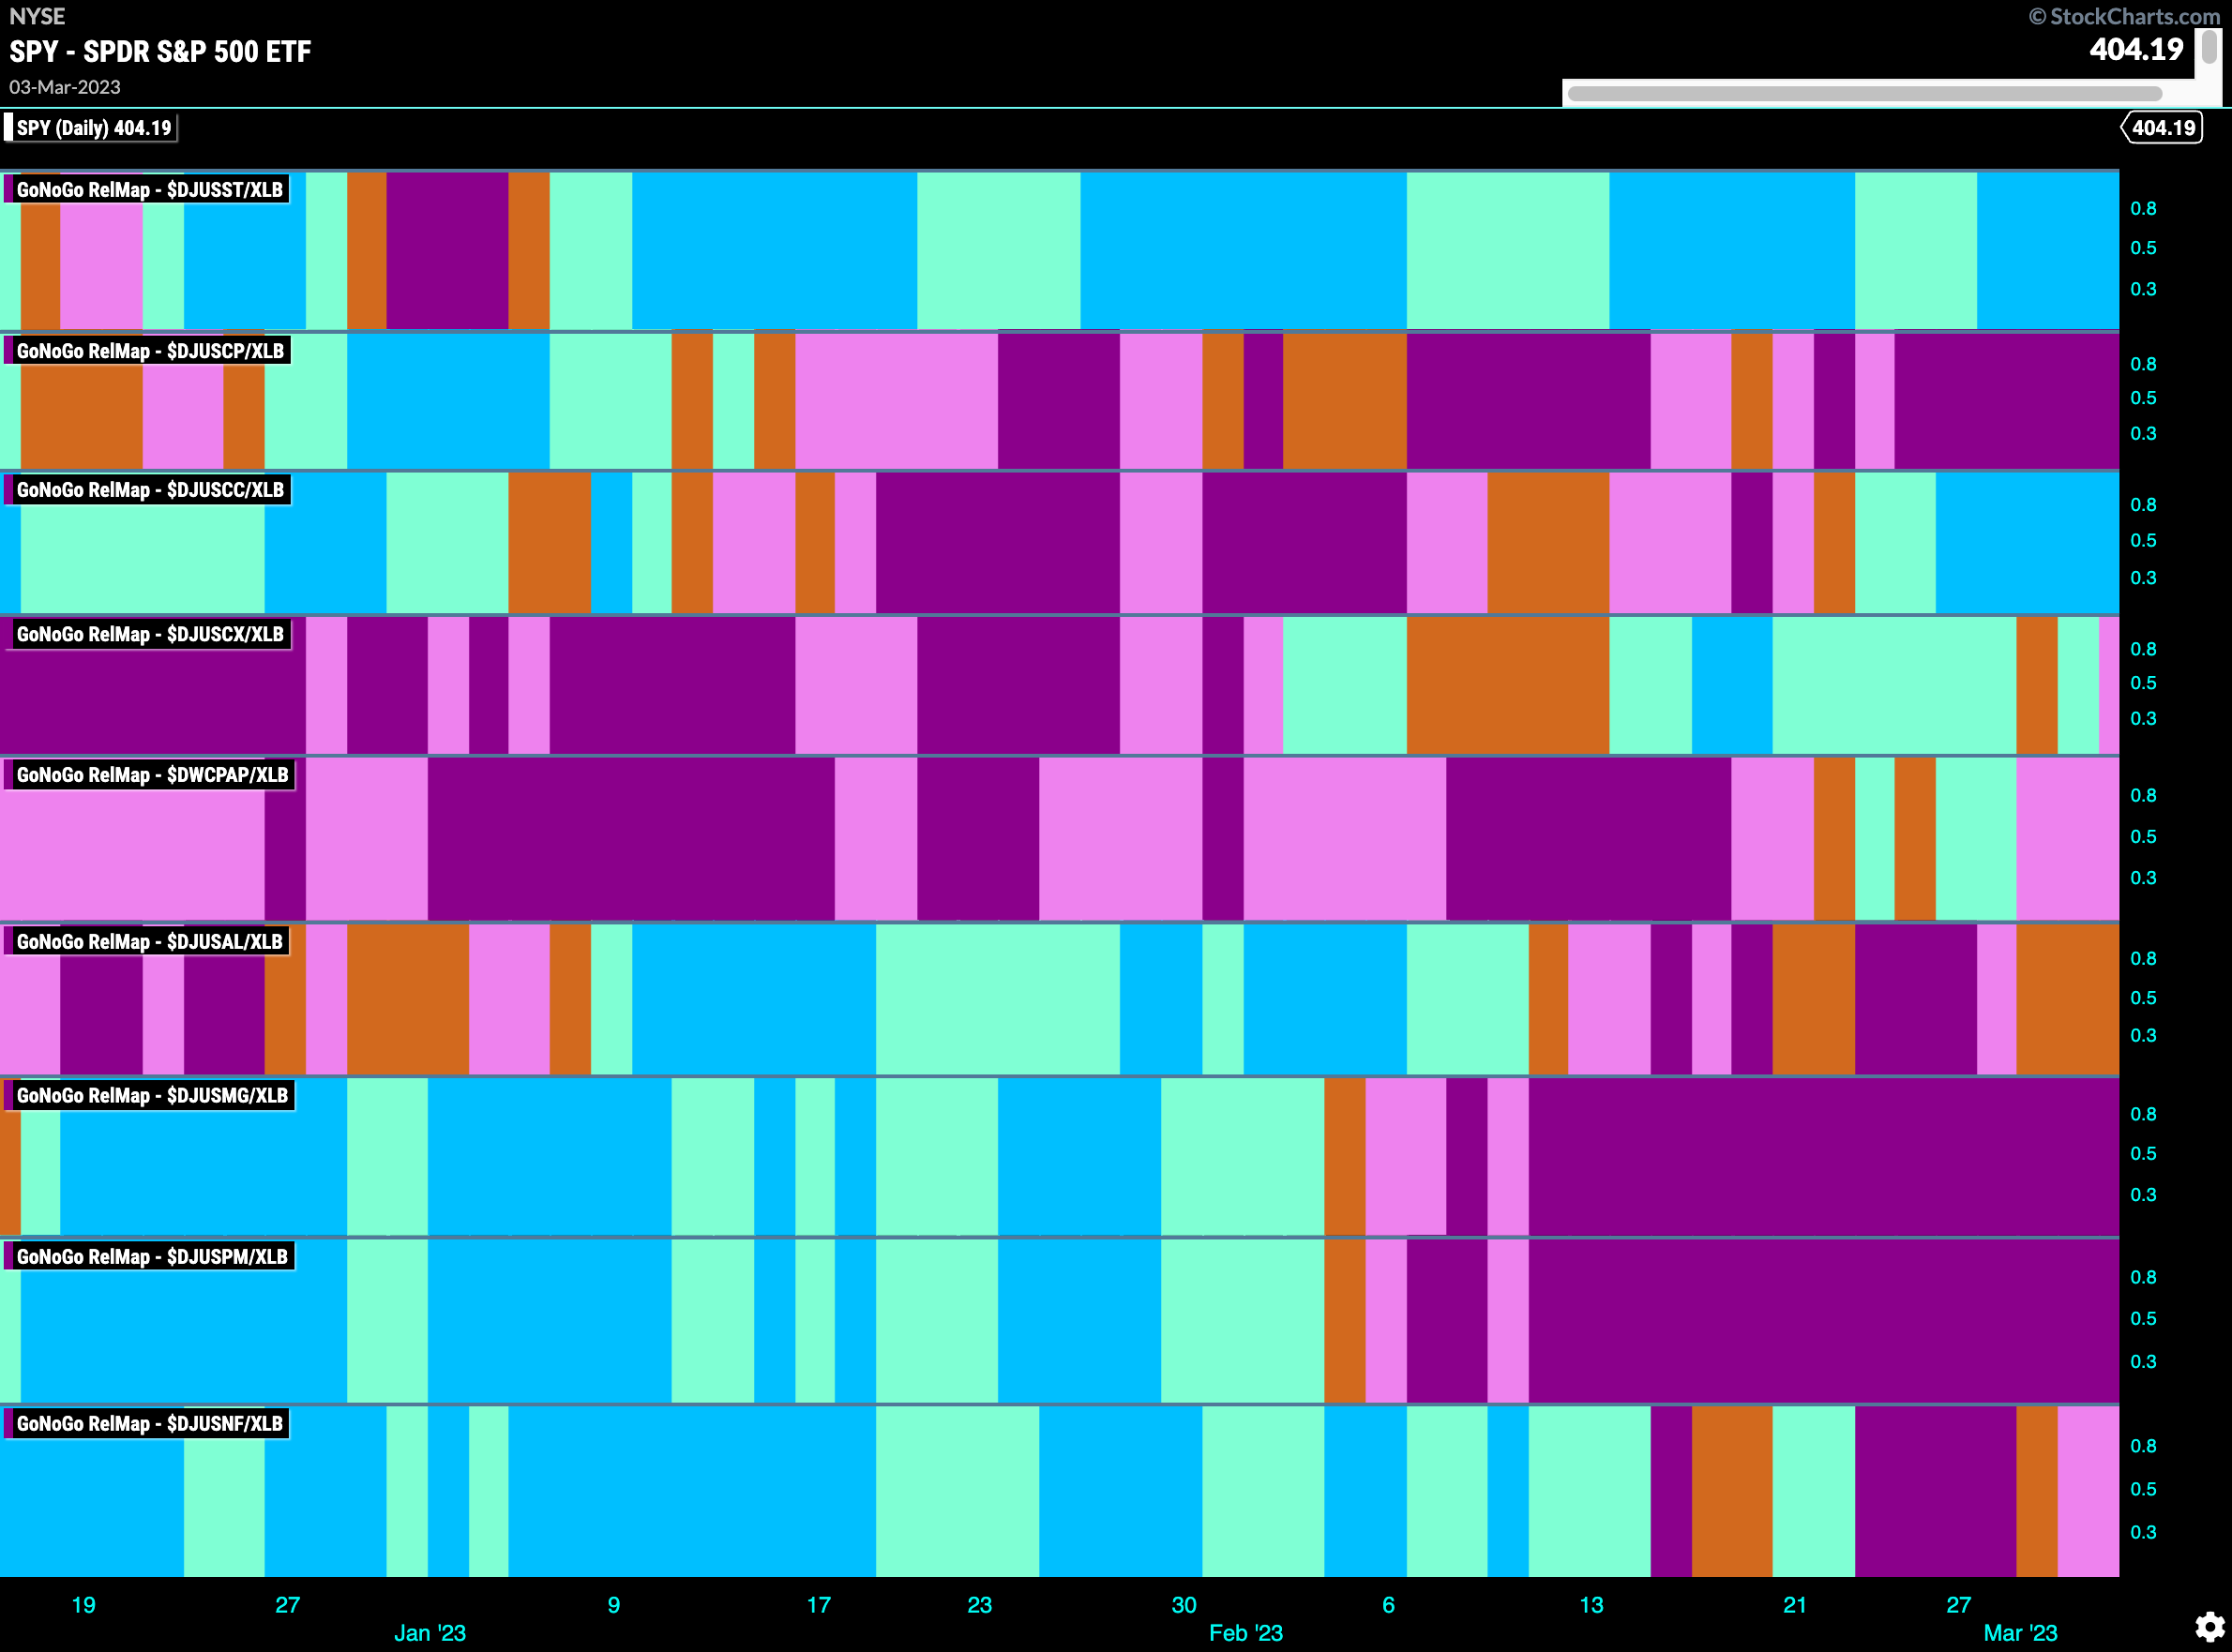
The GoNoGo Sector RelMap above shows how the materials sector has returned to a relative “Go” trend versus the base index so let’s take a look within that sector at where the performance is coming from. Interestingly, we see that it is from a few specific areas. That is the beauty of being able to quickly assess the trends of the sub groups within an outperforming sector. The sub group that clearly should have had our attention was $DJUSST, US Steel Index. GoNoGo Trend has been in a persistent “Go” trend for several weeks. That is not the case for the rest of the sector.
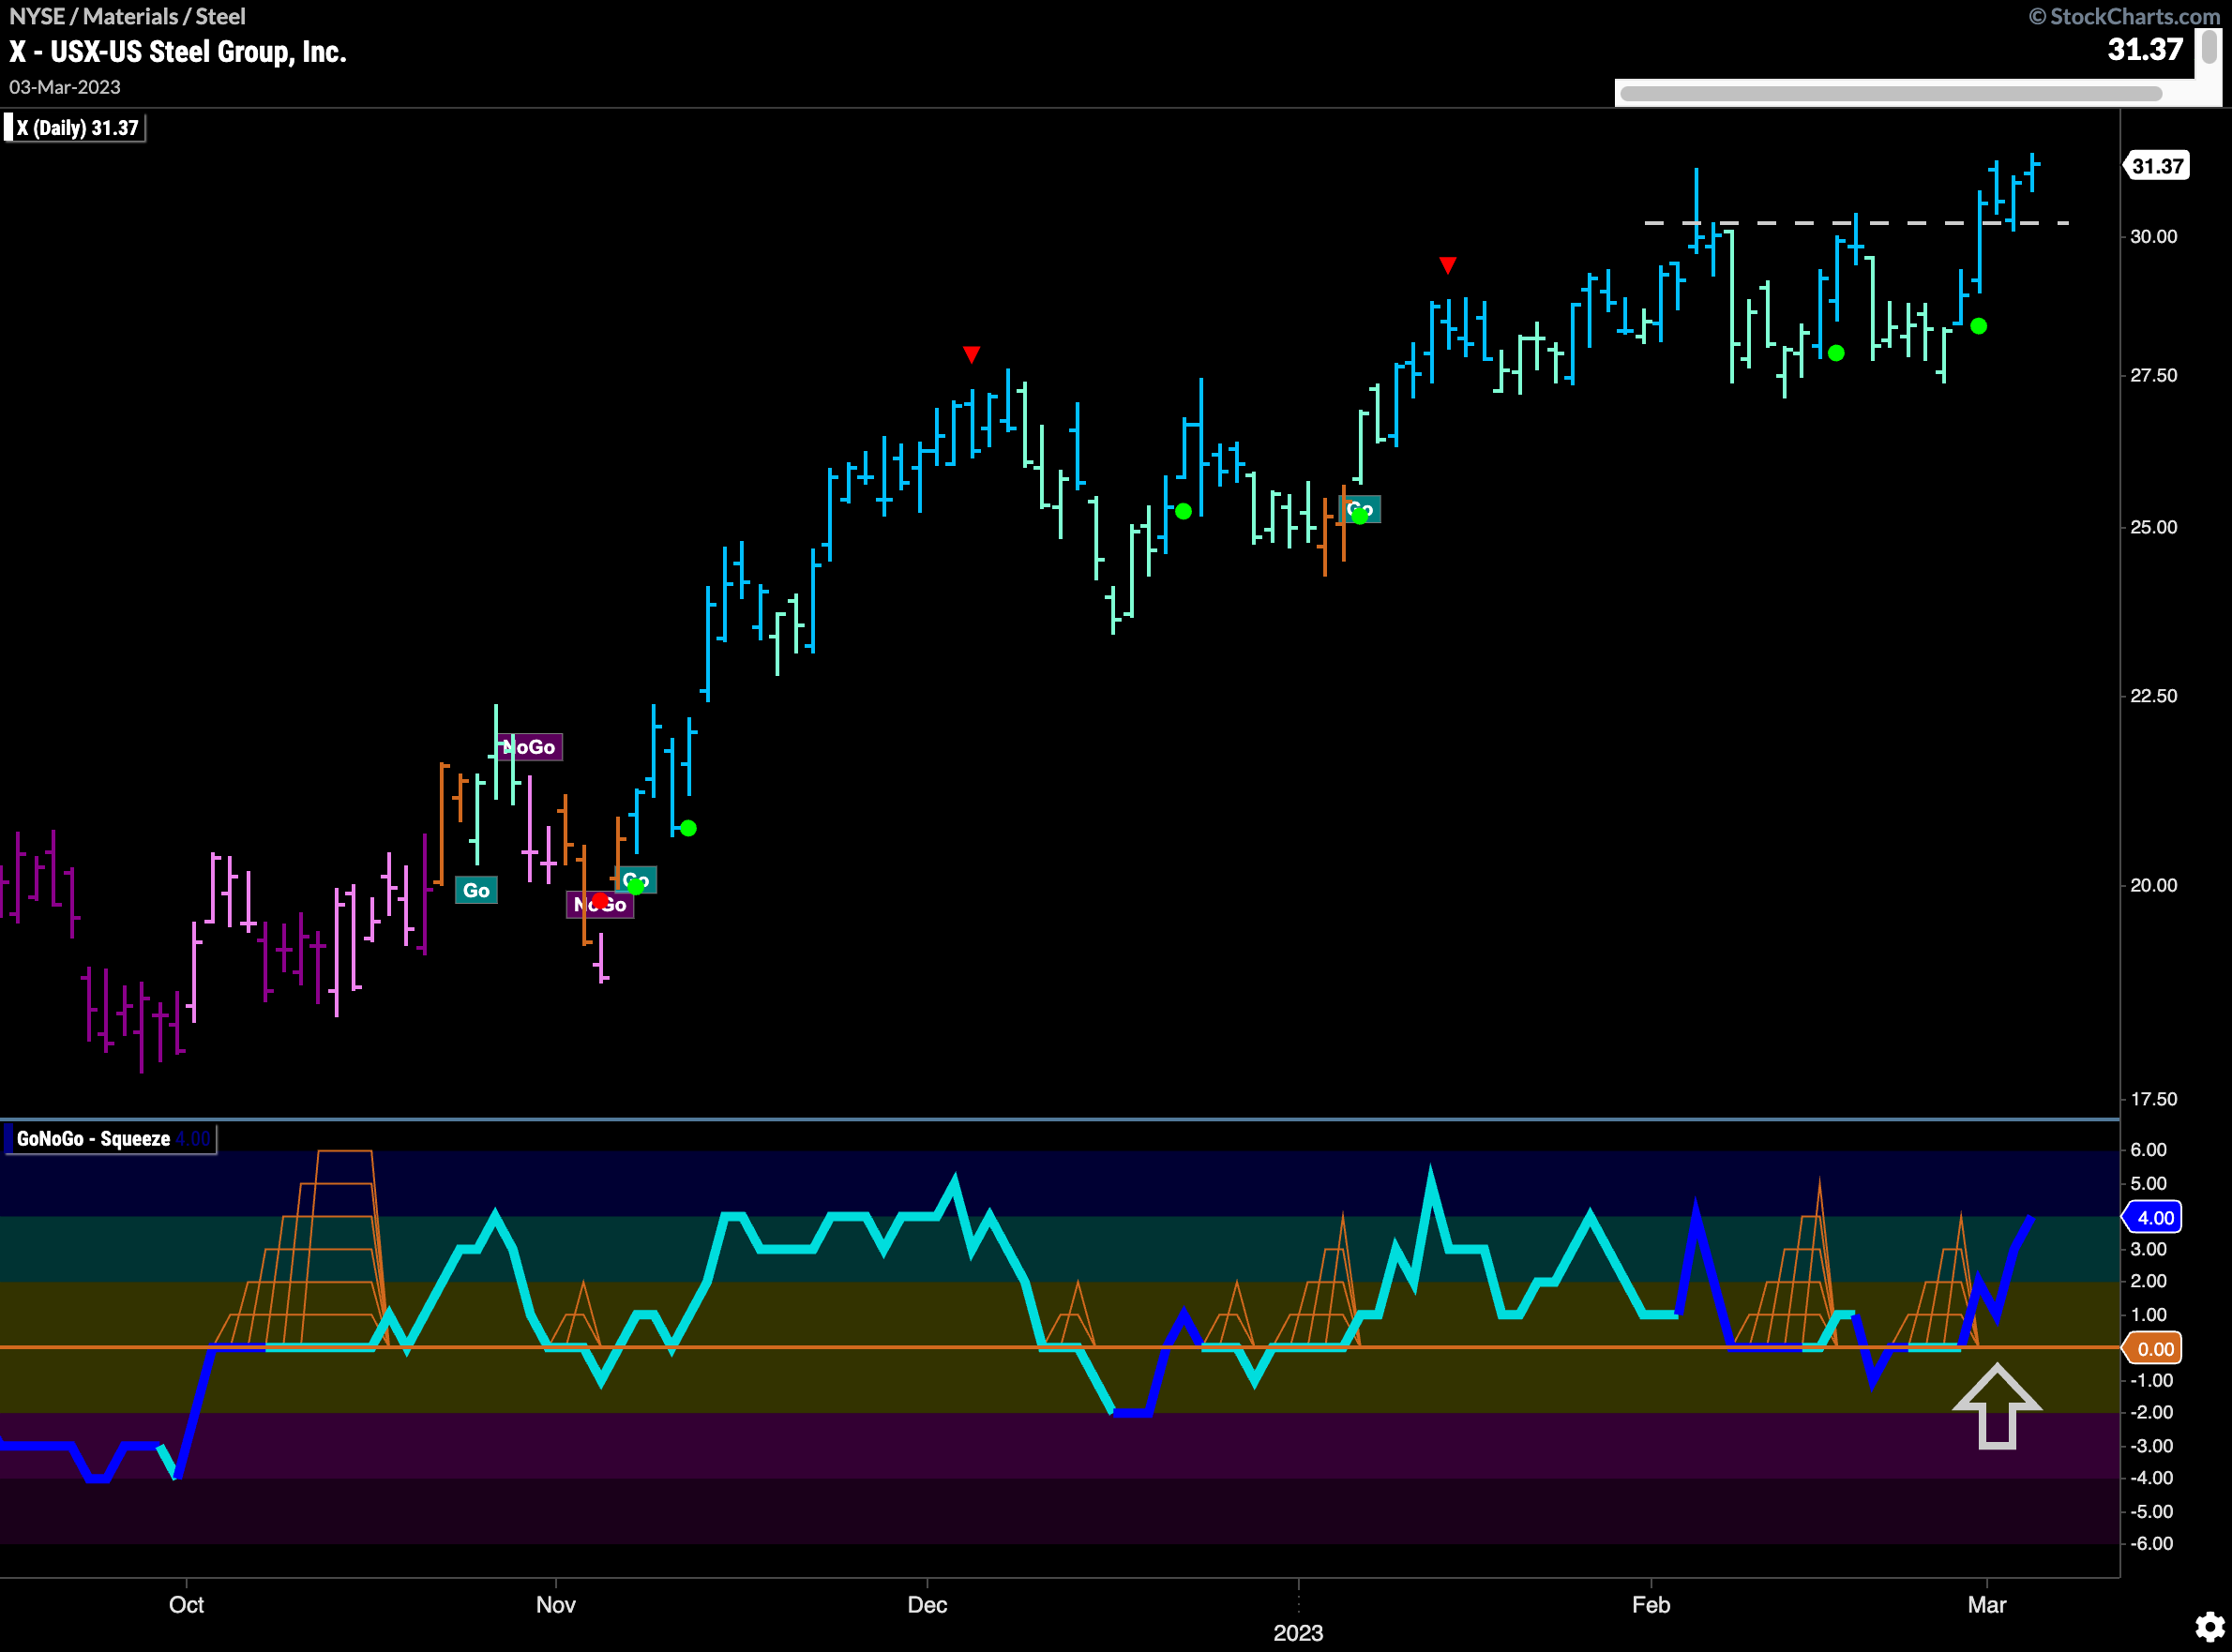
$X Breaks Out to New Highs
U.S. Steel Group has been one of the drivers of the subgroup outperformance. We see that the “Go” trend really took hold in November of last year and hasn’t given up yet with a series of higher highs and higher lows. After moving sideways for most of February, we saw GoNoGo Oscillator fall to and struggle to be free of the zero line. Recently, it has broken out of a GoNoGo Squeeze into positive territory on heavy volume. That gave price the push it needed to climb to new highs. With no recent overhead resistance, perhaps price can continue higher.
