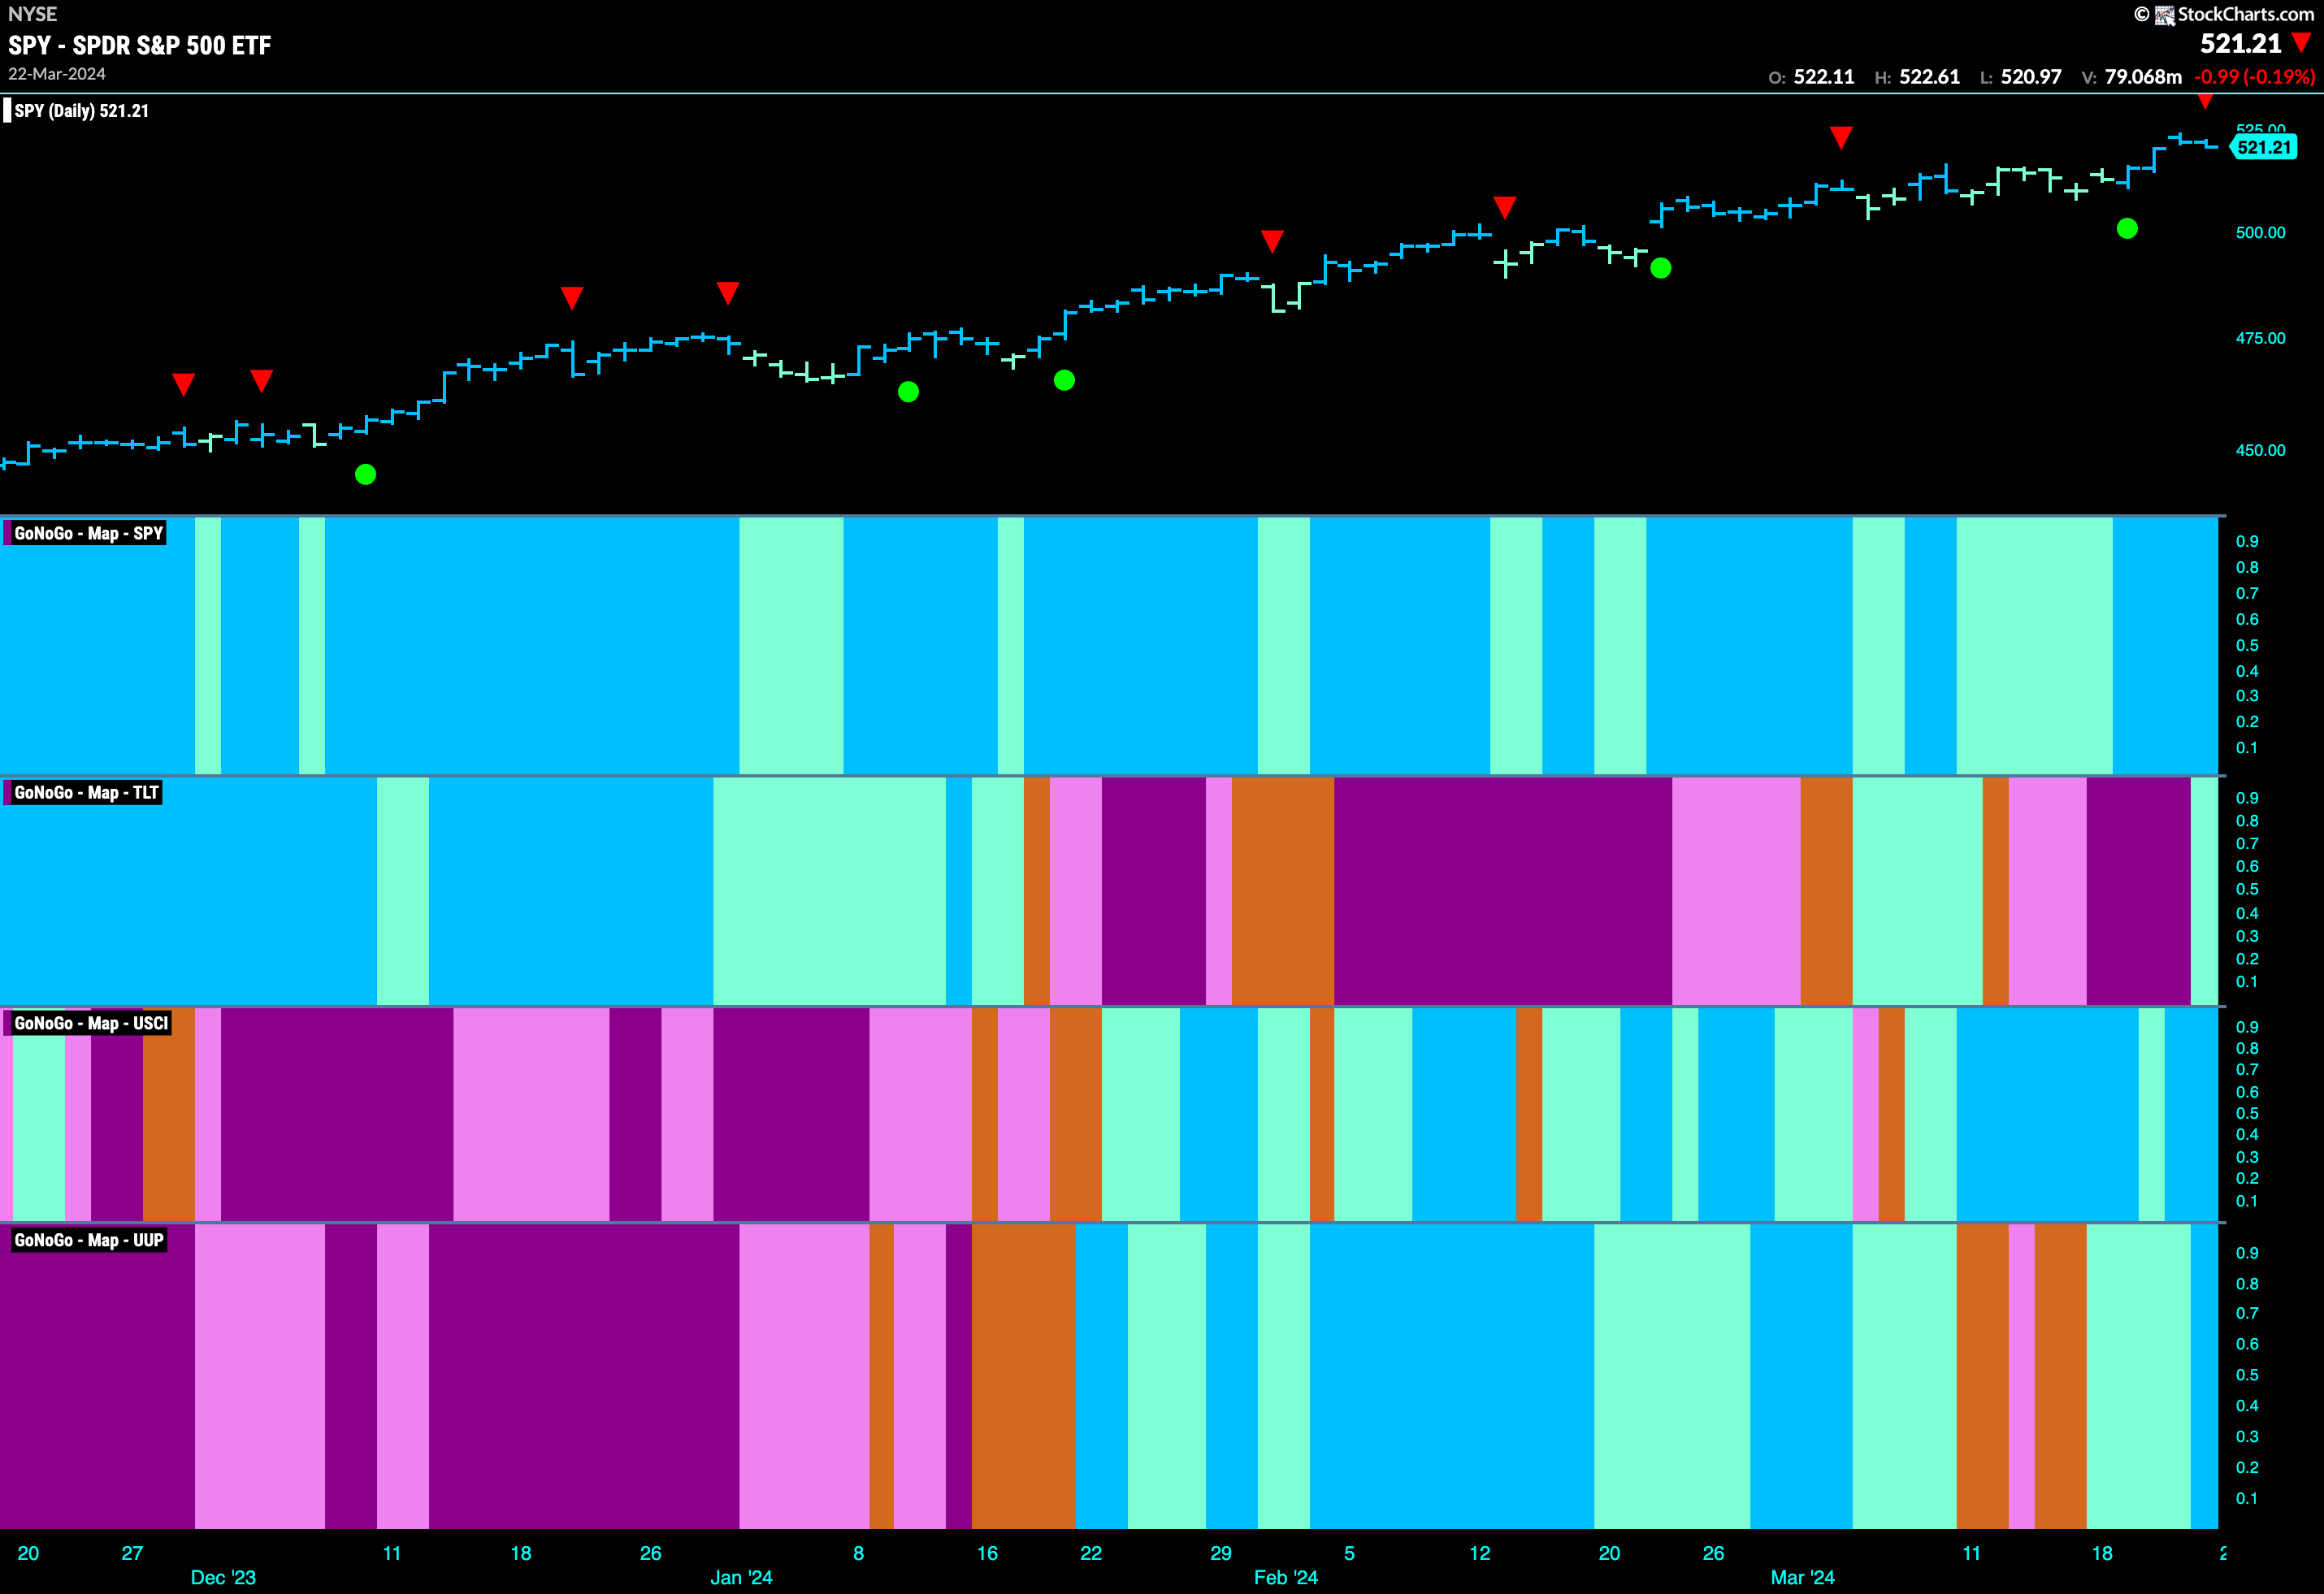
Good morning and welcome to this week’s Flight Path. The equity “Go” trend not only survived this week but strengthened as we saw strong blue “Go” bars return and price hit another higher high. We saw treasury bond prices flirt with a new “Go” trend at the end of the week as GoNoGo Trend paints a weak aqua bar. The commodity index remained in its “Go” trend and we can see that the last few bars of the week were strong blue “Go” bars. We have been paying close attention to the dollar for a few weeks and this week we saw some strength return to the “Go” trend at the end of the week even as it encounters strong overhead resistance.
Any Stopping U.S. Equities?
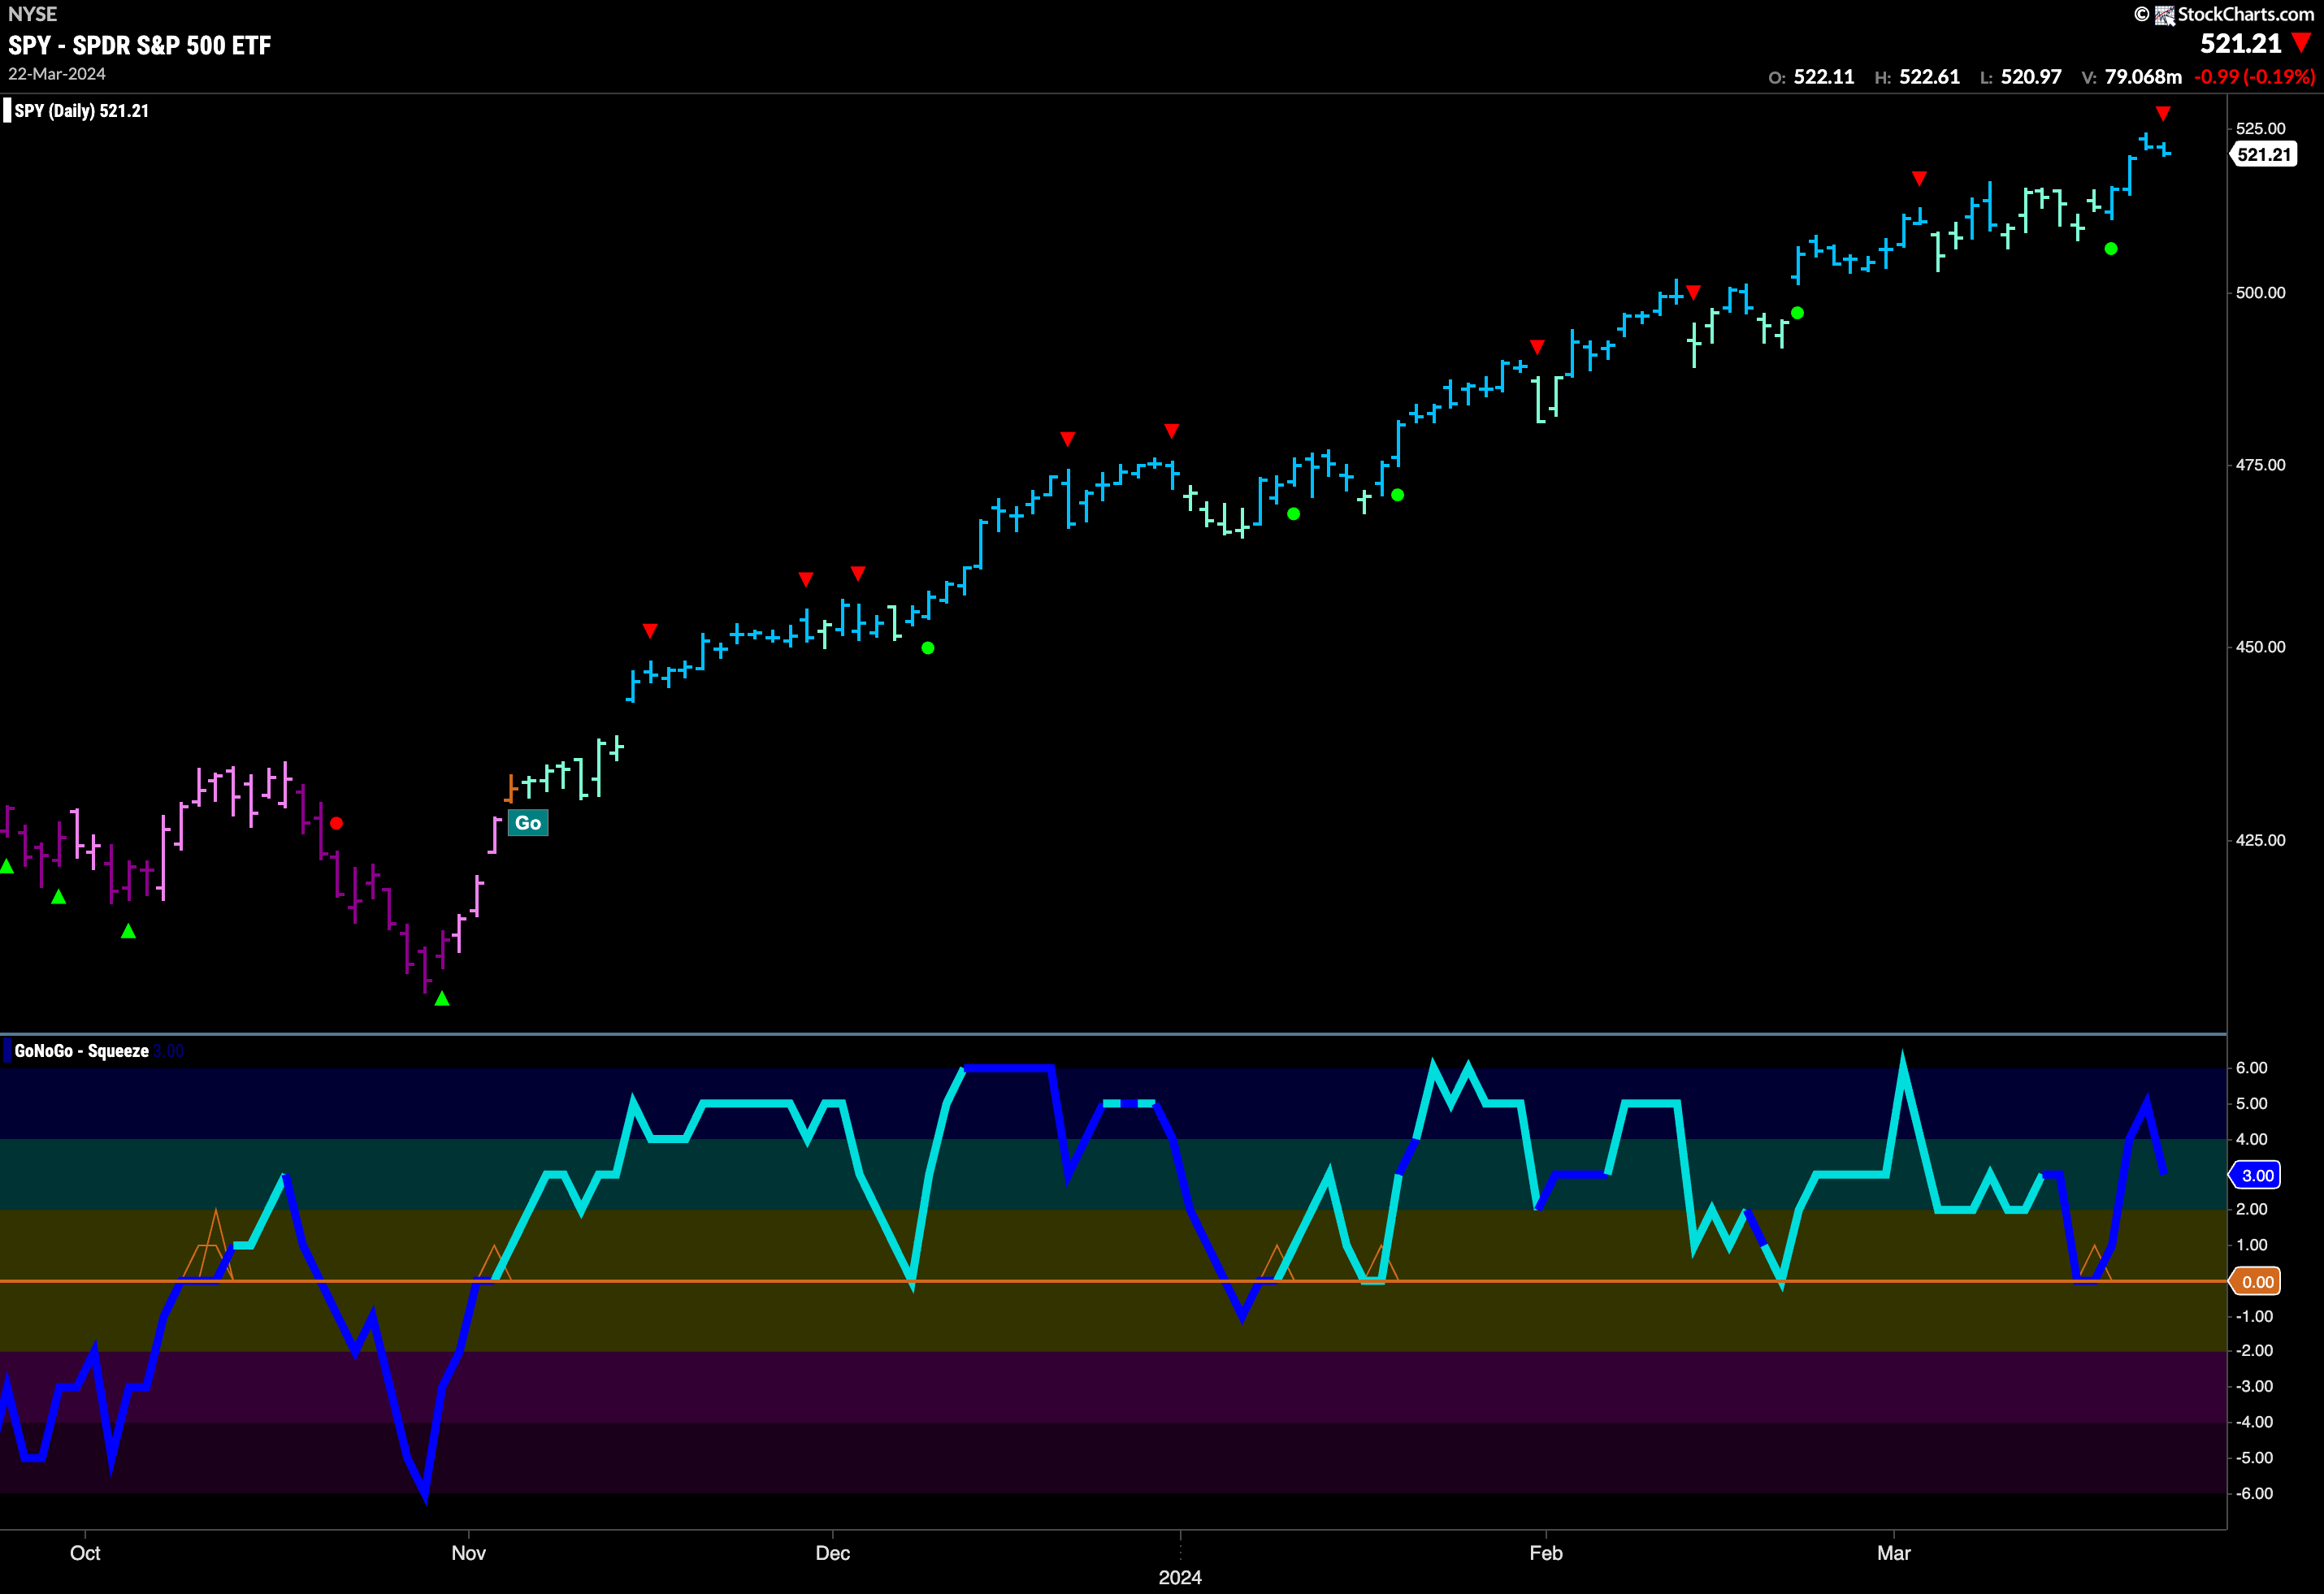
Another week, another string of “Go” bars as price races to another new high. Doubters were pushed aside again this week and we see that price is painting strong blue “Go” bars. We do see a Go Countertrend Correction Icon (red arrow) above the price bar indicating that in the short term price may struggle to go higher. GoNoGo Oscillator is coming out of overbought territory and falling toward the zero line and volume is heavy. We will watch the oscillator closely and if it approaches zero we will look for support.
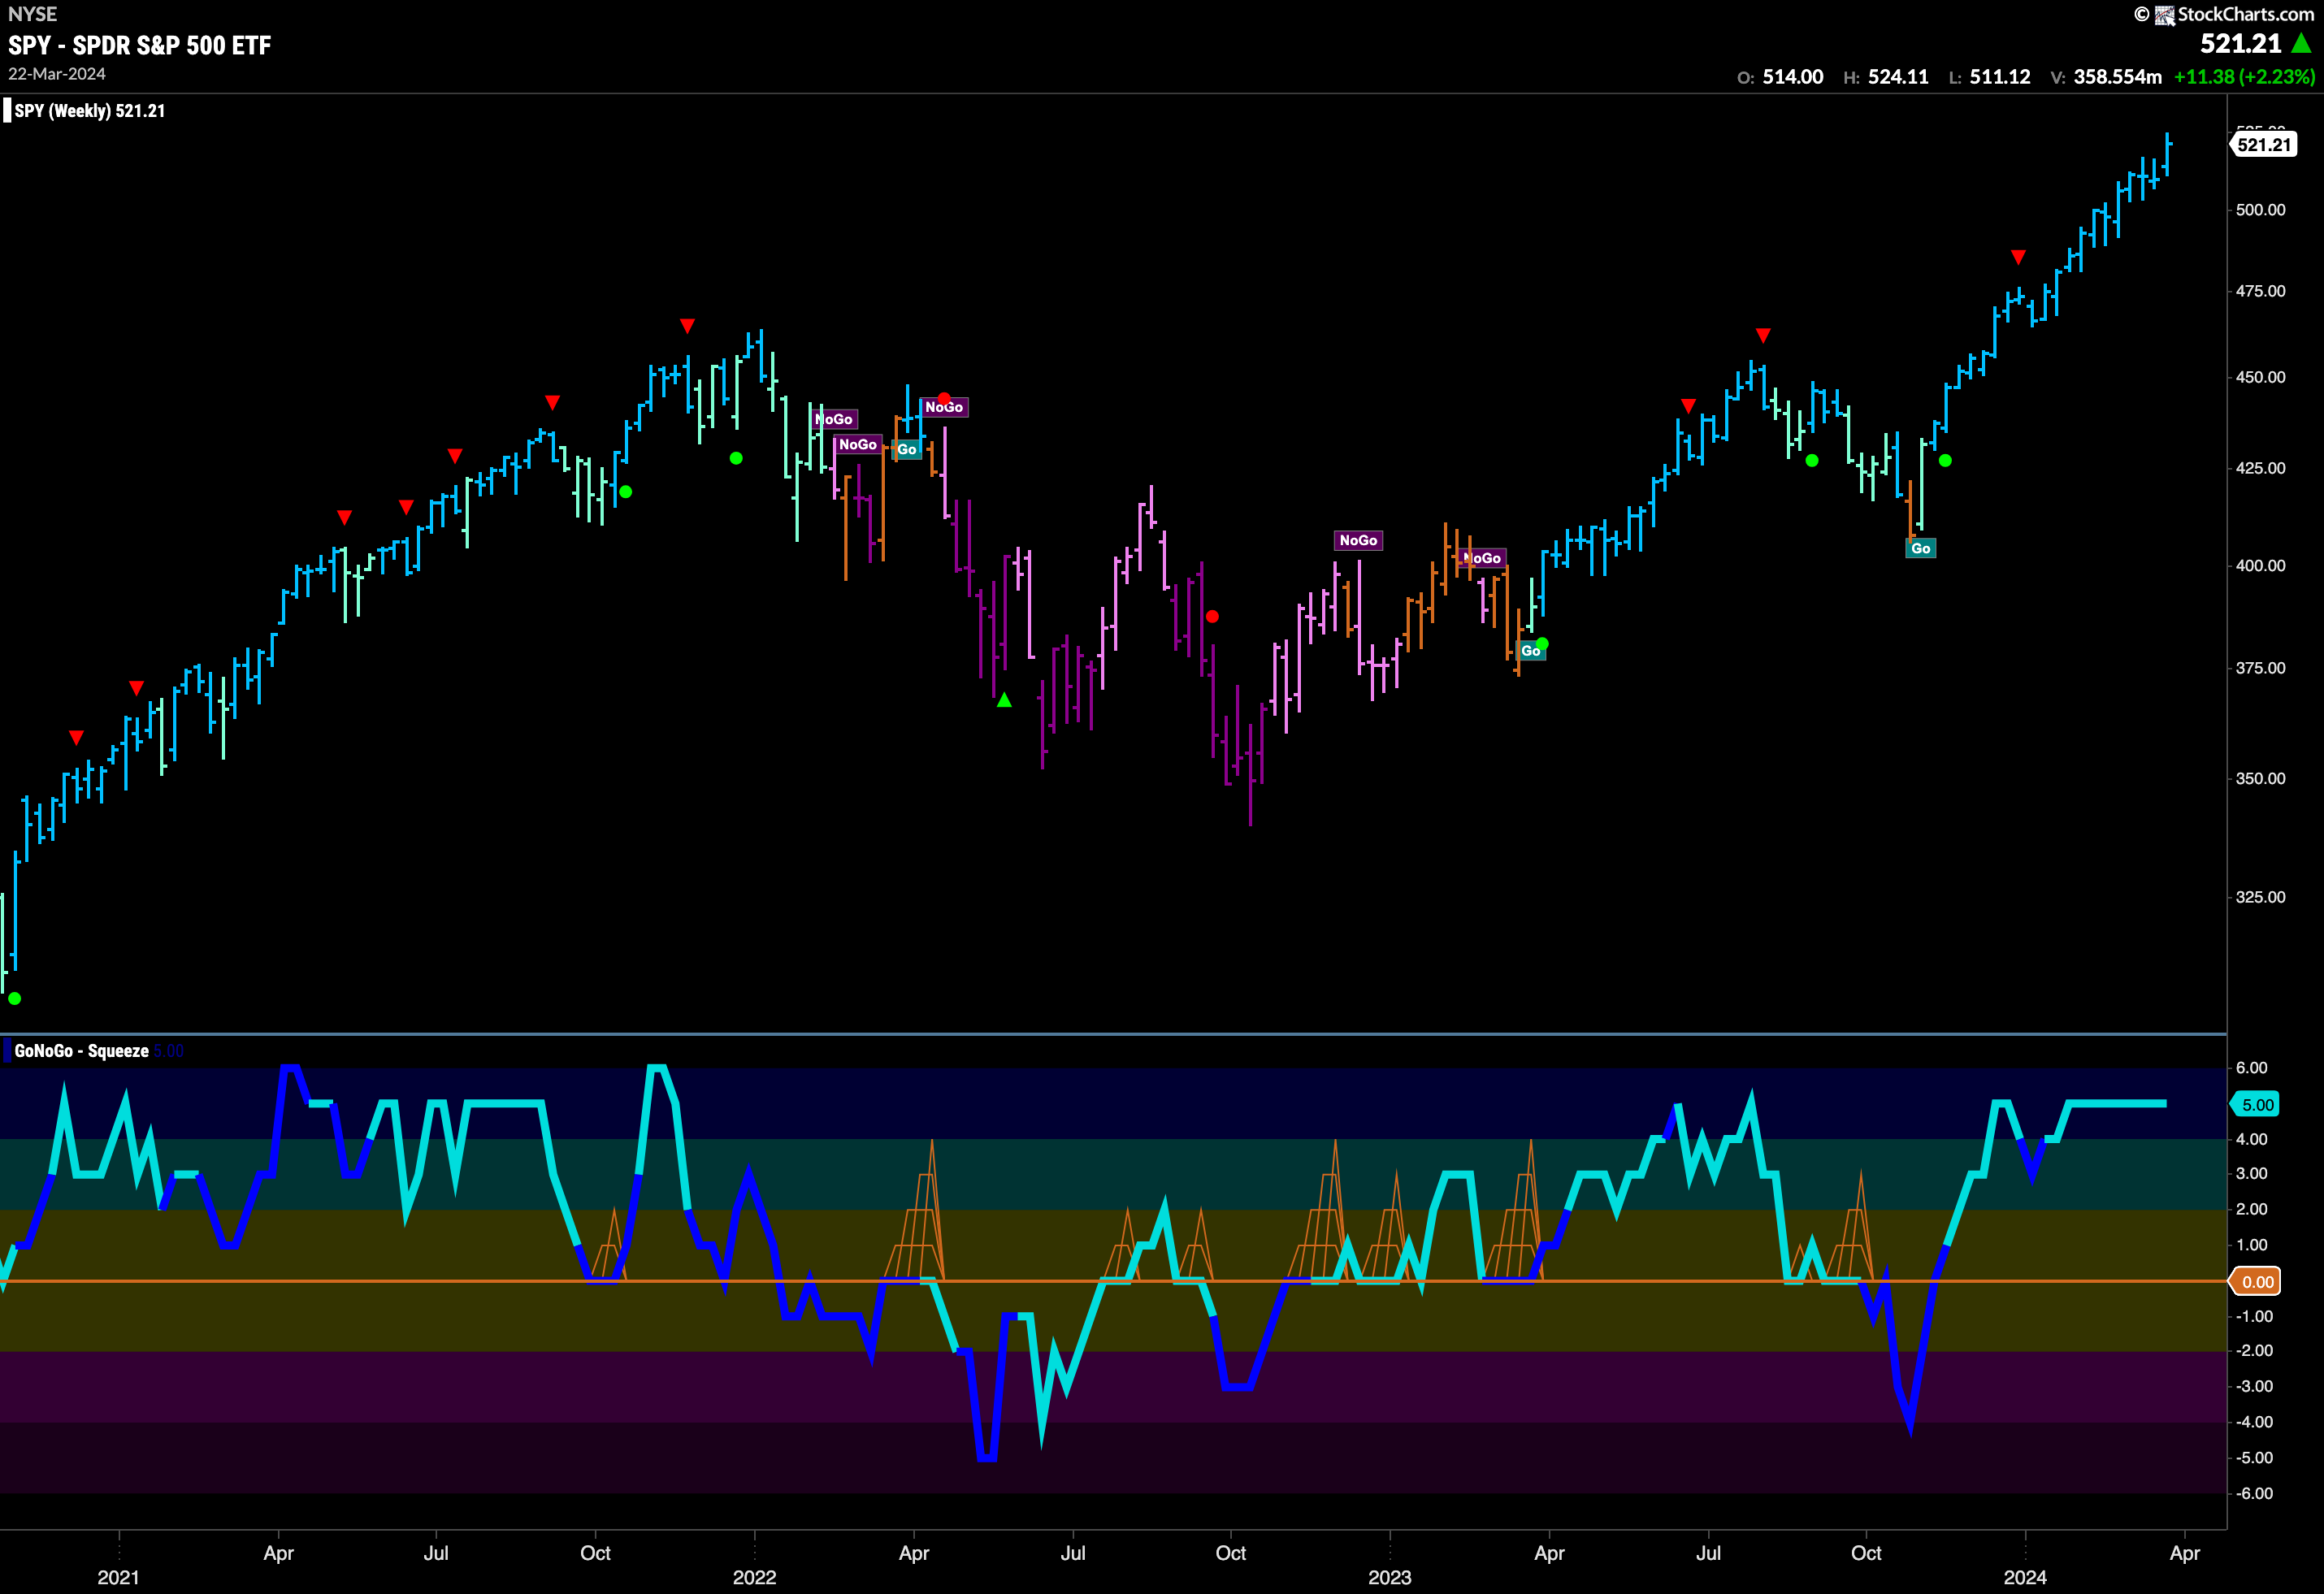
The weekly chart shows that the trend is very strong. How many times can I write that? We saw a higher close this week as price overcame the last two lower weekly closes. GoNoGo Oscillator is overbought and remains that way as the oscillator is stuck at a value of 5. We will look for a Go Countertrend Correction Icon (red arrow) if the oscillator drops from here and that would suggest at least a pause in the trend.
Rates Hit Resistance in “Go” Trend
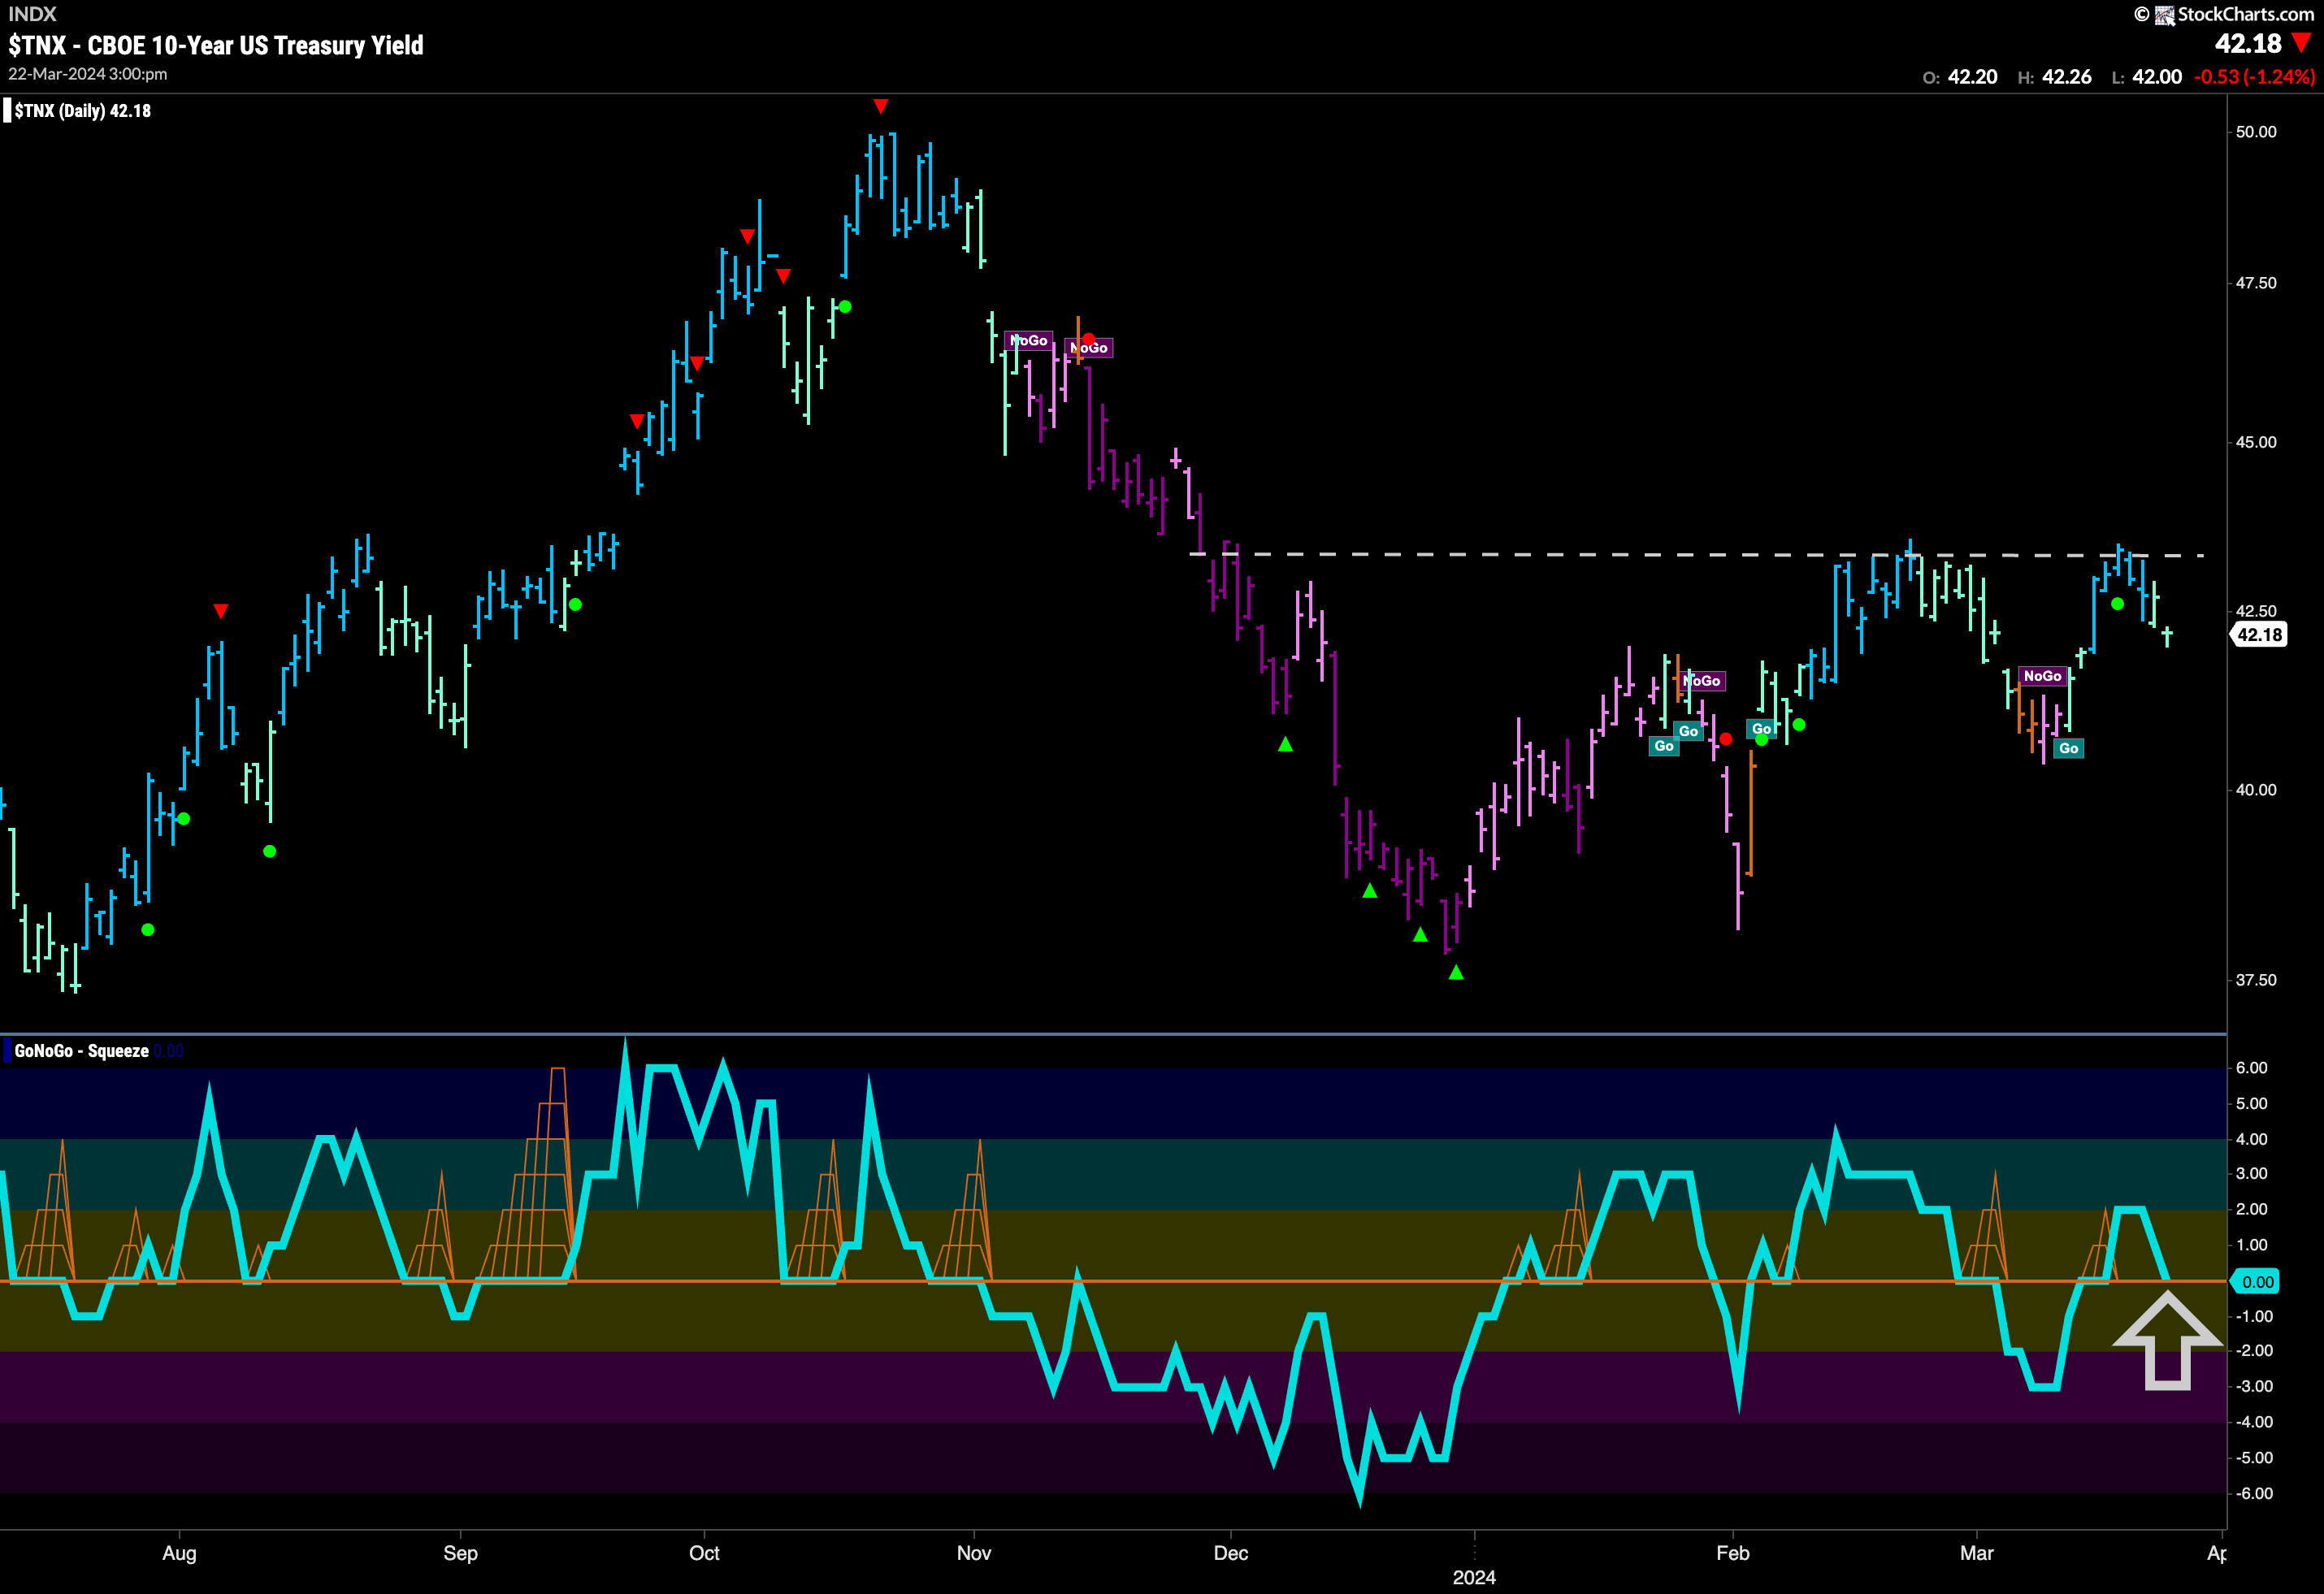
Treasury rates saw the “Go” trend challenged this week as price ran up against horizontal resistance. We saw weaker aqua bars at the end of the week as price continued to fall away from its recent high. GoNoGo Oscillator which had managed to rally into positive territory reversed quickly and is now testing the zero line from above. For this “Go” trend to remain healthy the oscillator will need to find support here. If GoNoGo Oscillator can rally back into positive territory that might give price the push it needs to make a new higher high.
Dollar Breaks to New High
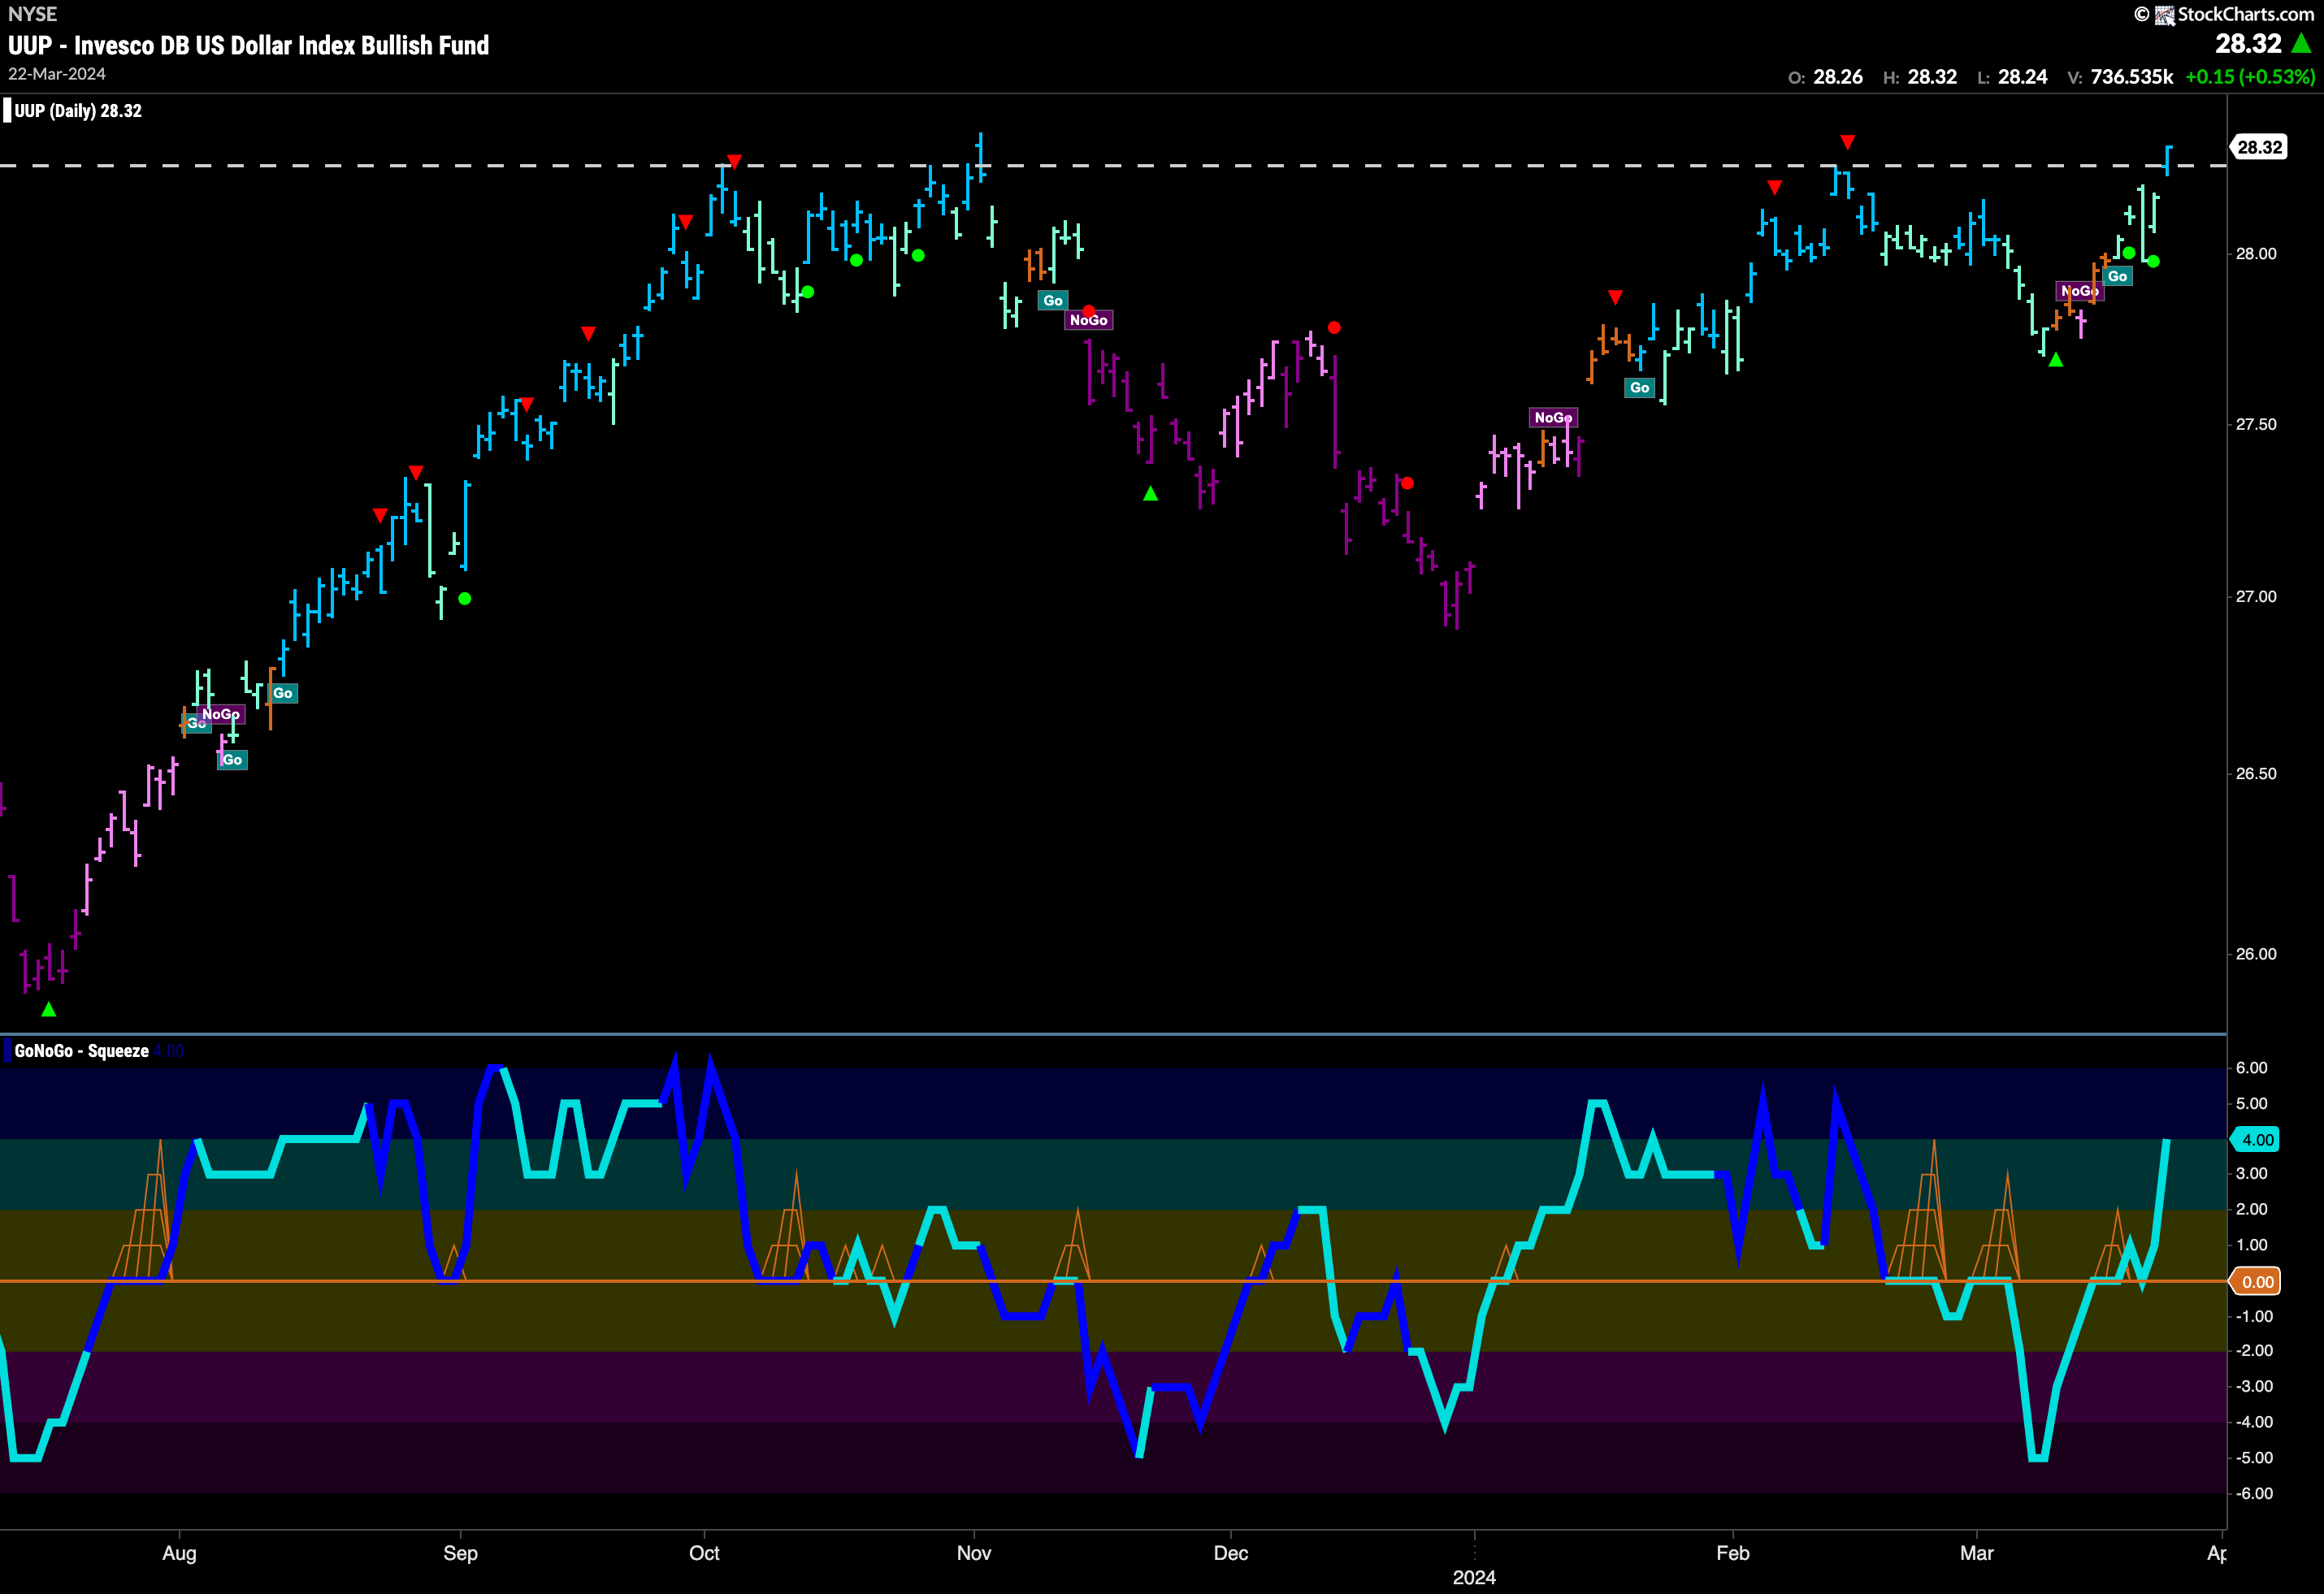
The dollar had a strong week and on the last bar painted a strong blue “Go” bar. This came as price seems to have broken above horizontal resistance. GoNoGo Oscillator found support at the zero line quickly retesting that level after breaking into positive territory a week ago. With momentum in positive territory but not yet overbought, we can say that momentum is surging in the direction of the “Go” trend and we will look for price to consolidate at these levels.
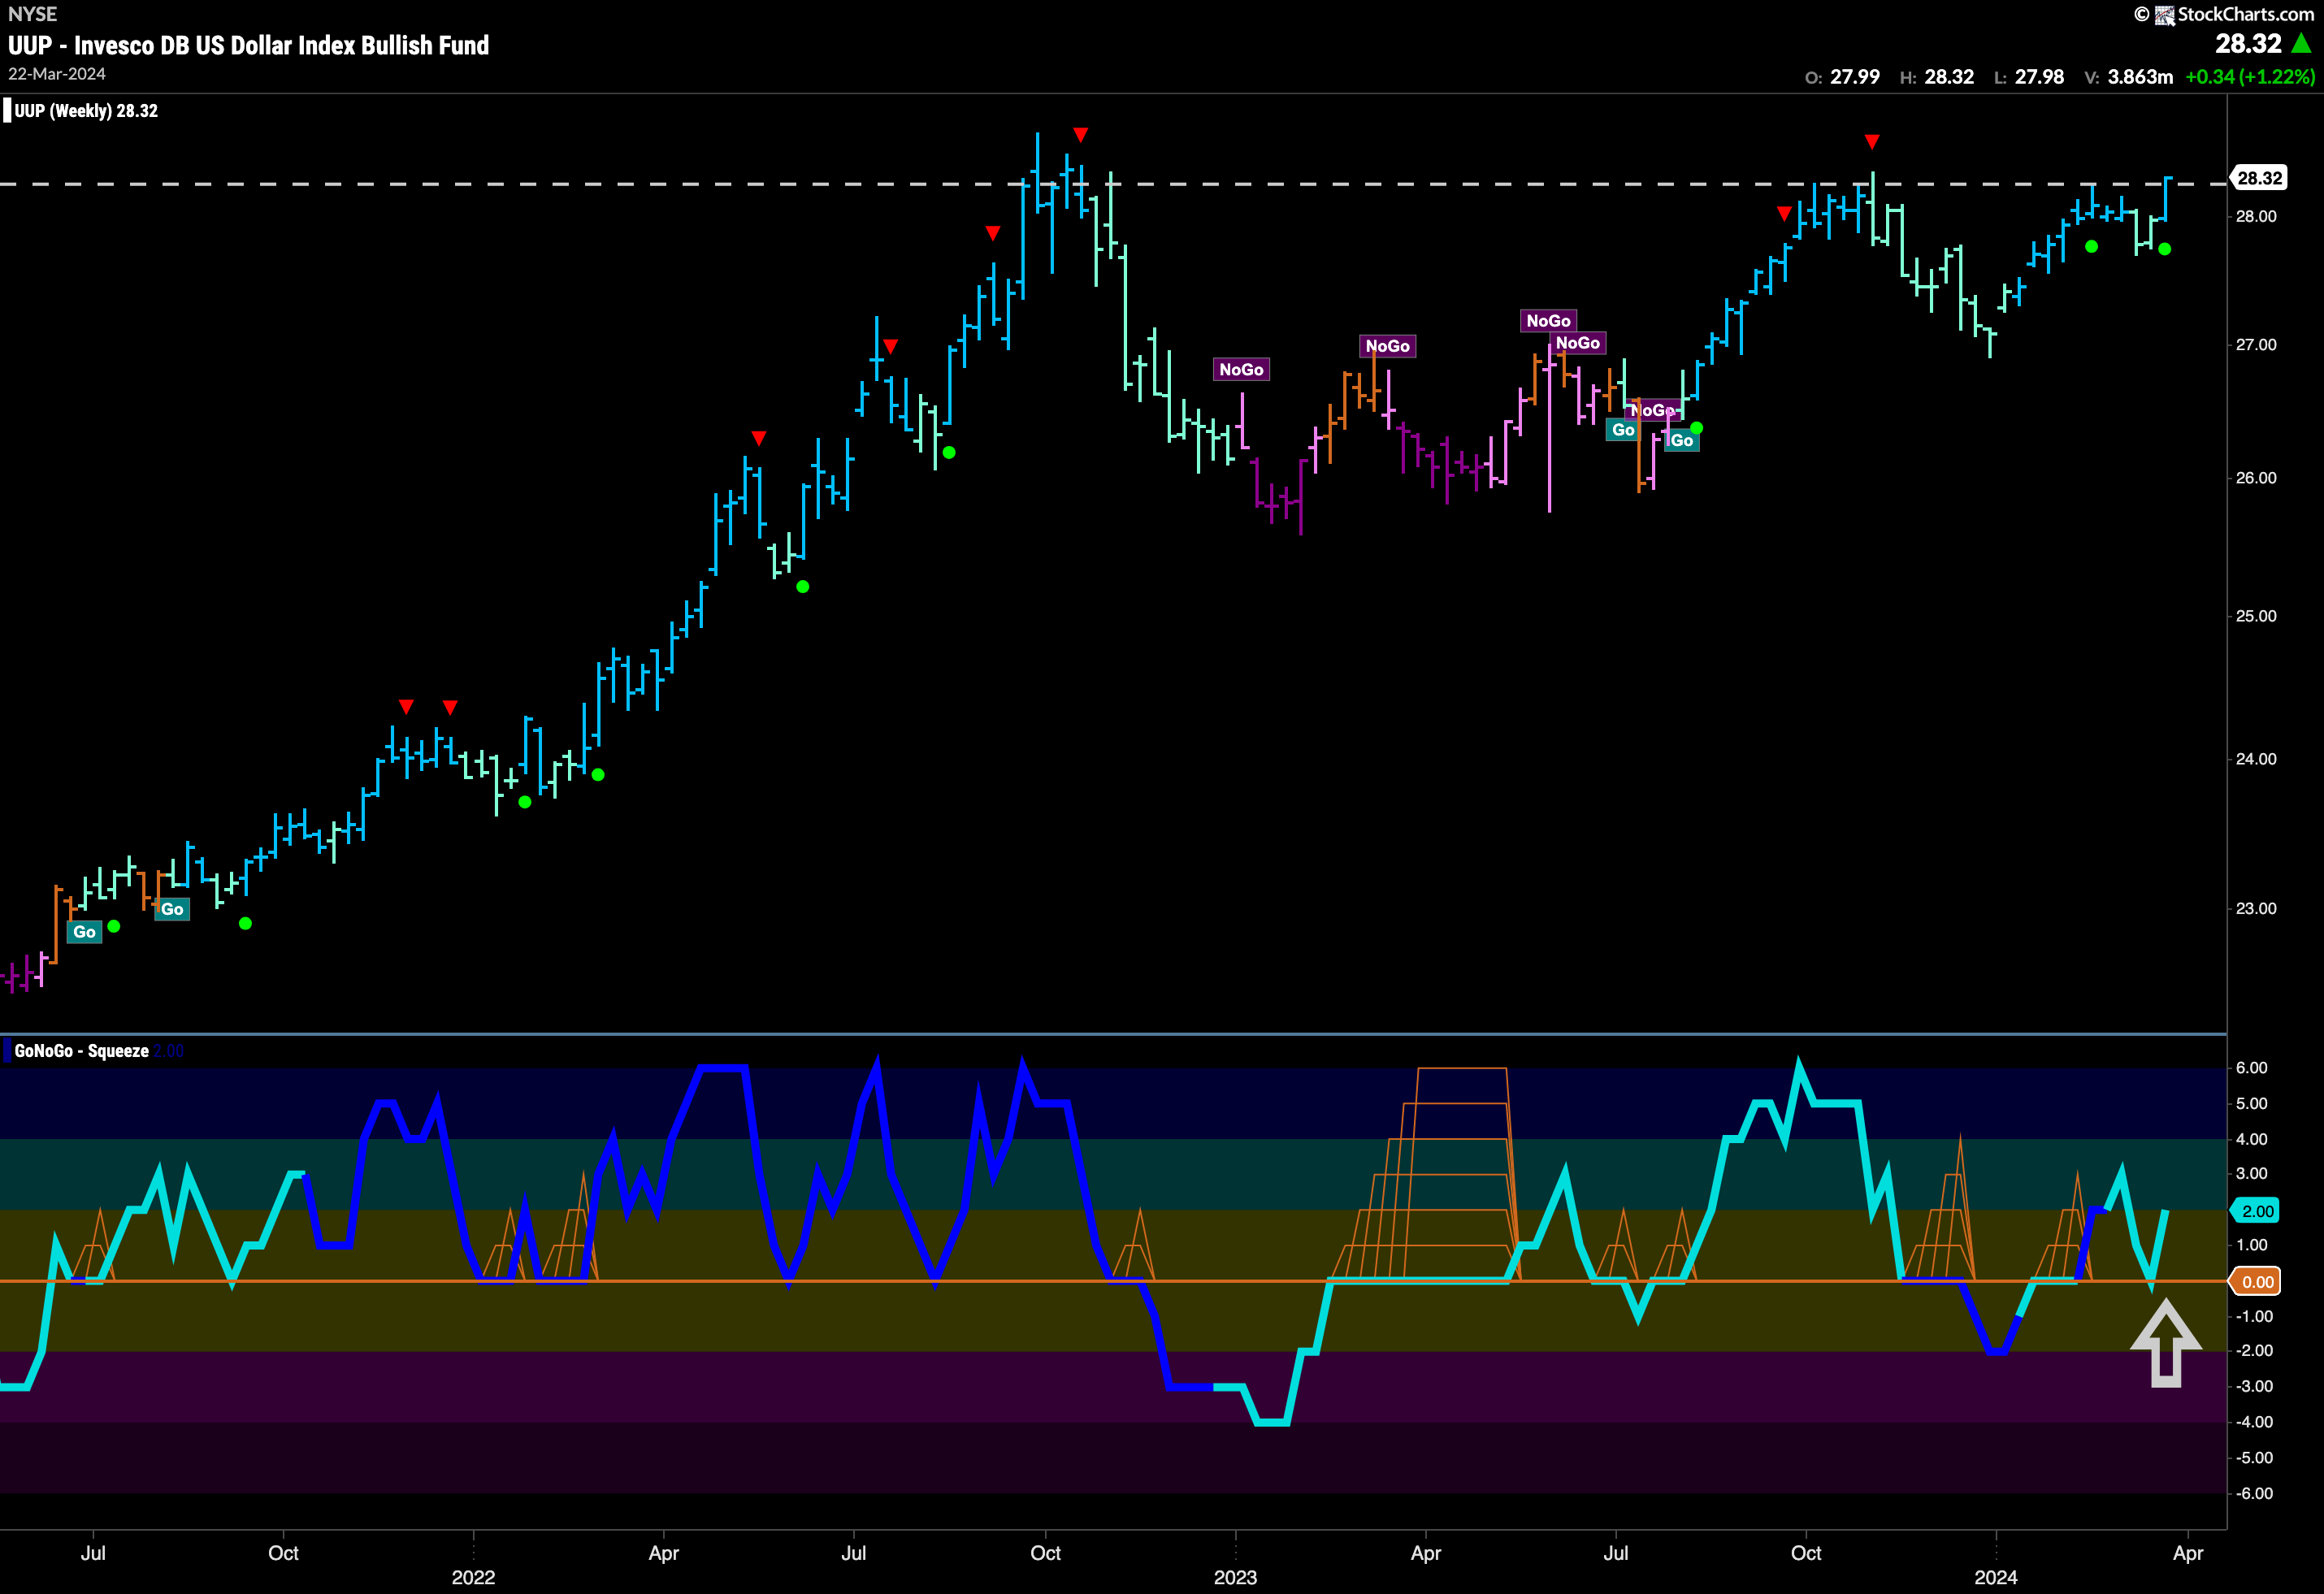
The longer term chart shows that there is still some work to do however if we are to see any further price gains. There is a lot of overhead supply that comes from further back in the chart. It will be important to see if price can hold these levels and consolidate as we mentioned when looking at the daily chart above. GoNoGo Oscillator has bounced off the zero line on this weekly chart which is a good sign for dollar bulls as this tells us that momentum is resurgent in the direction of the “Go” trend. Perhaps with momentum on its side we will see price make another leg higher.
Oil Sets New High
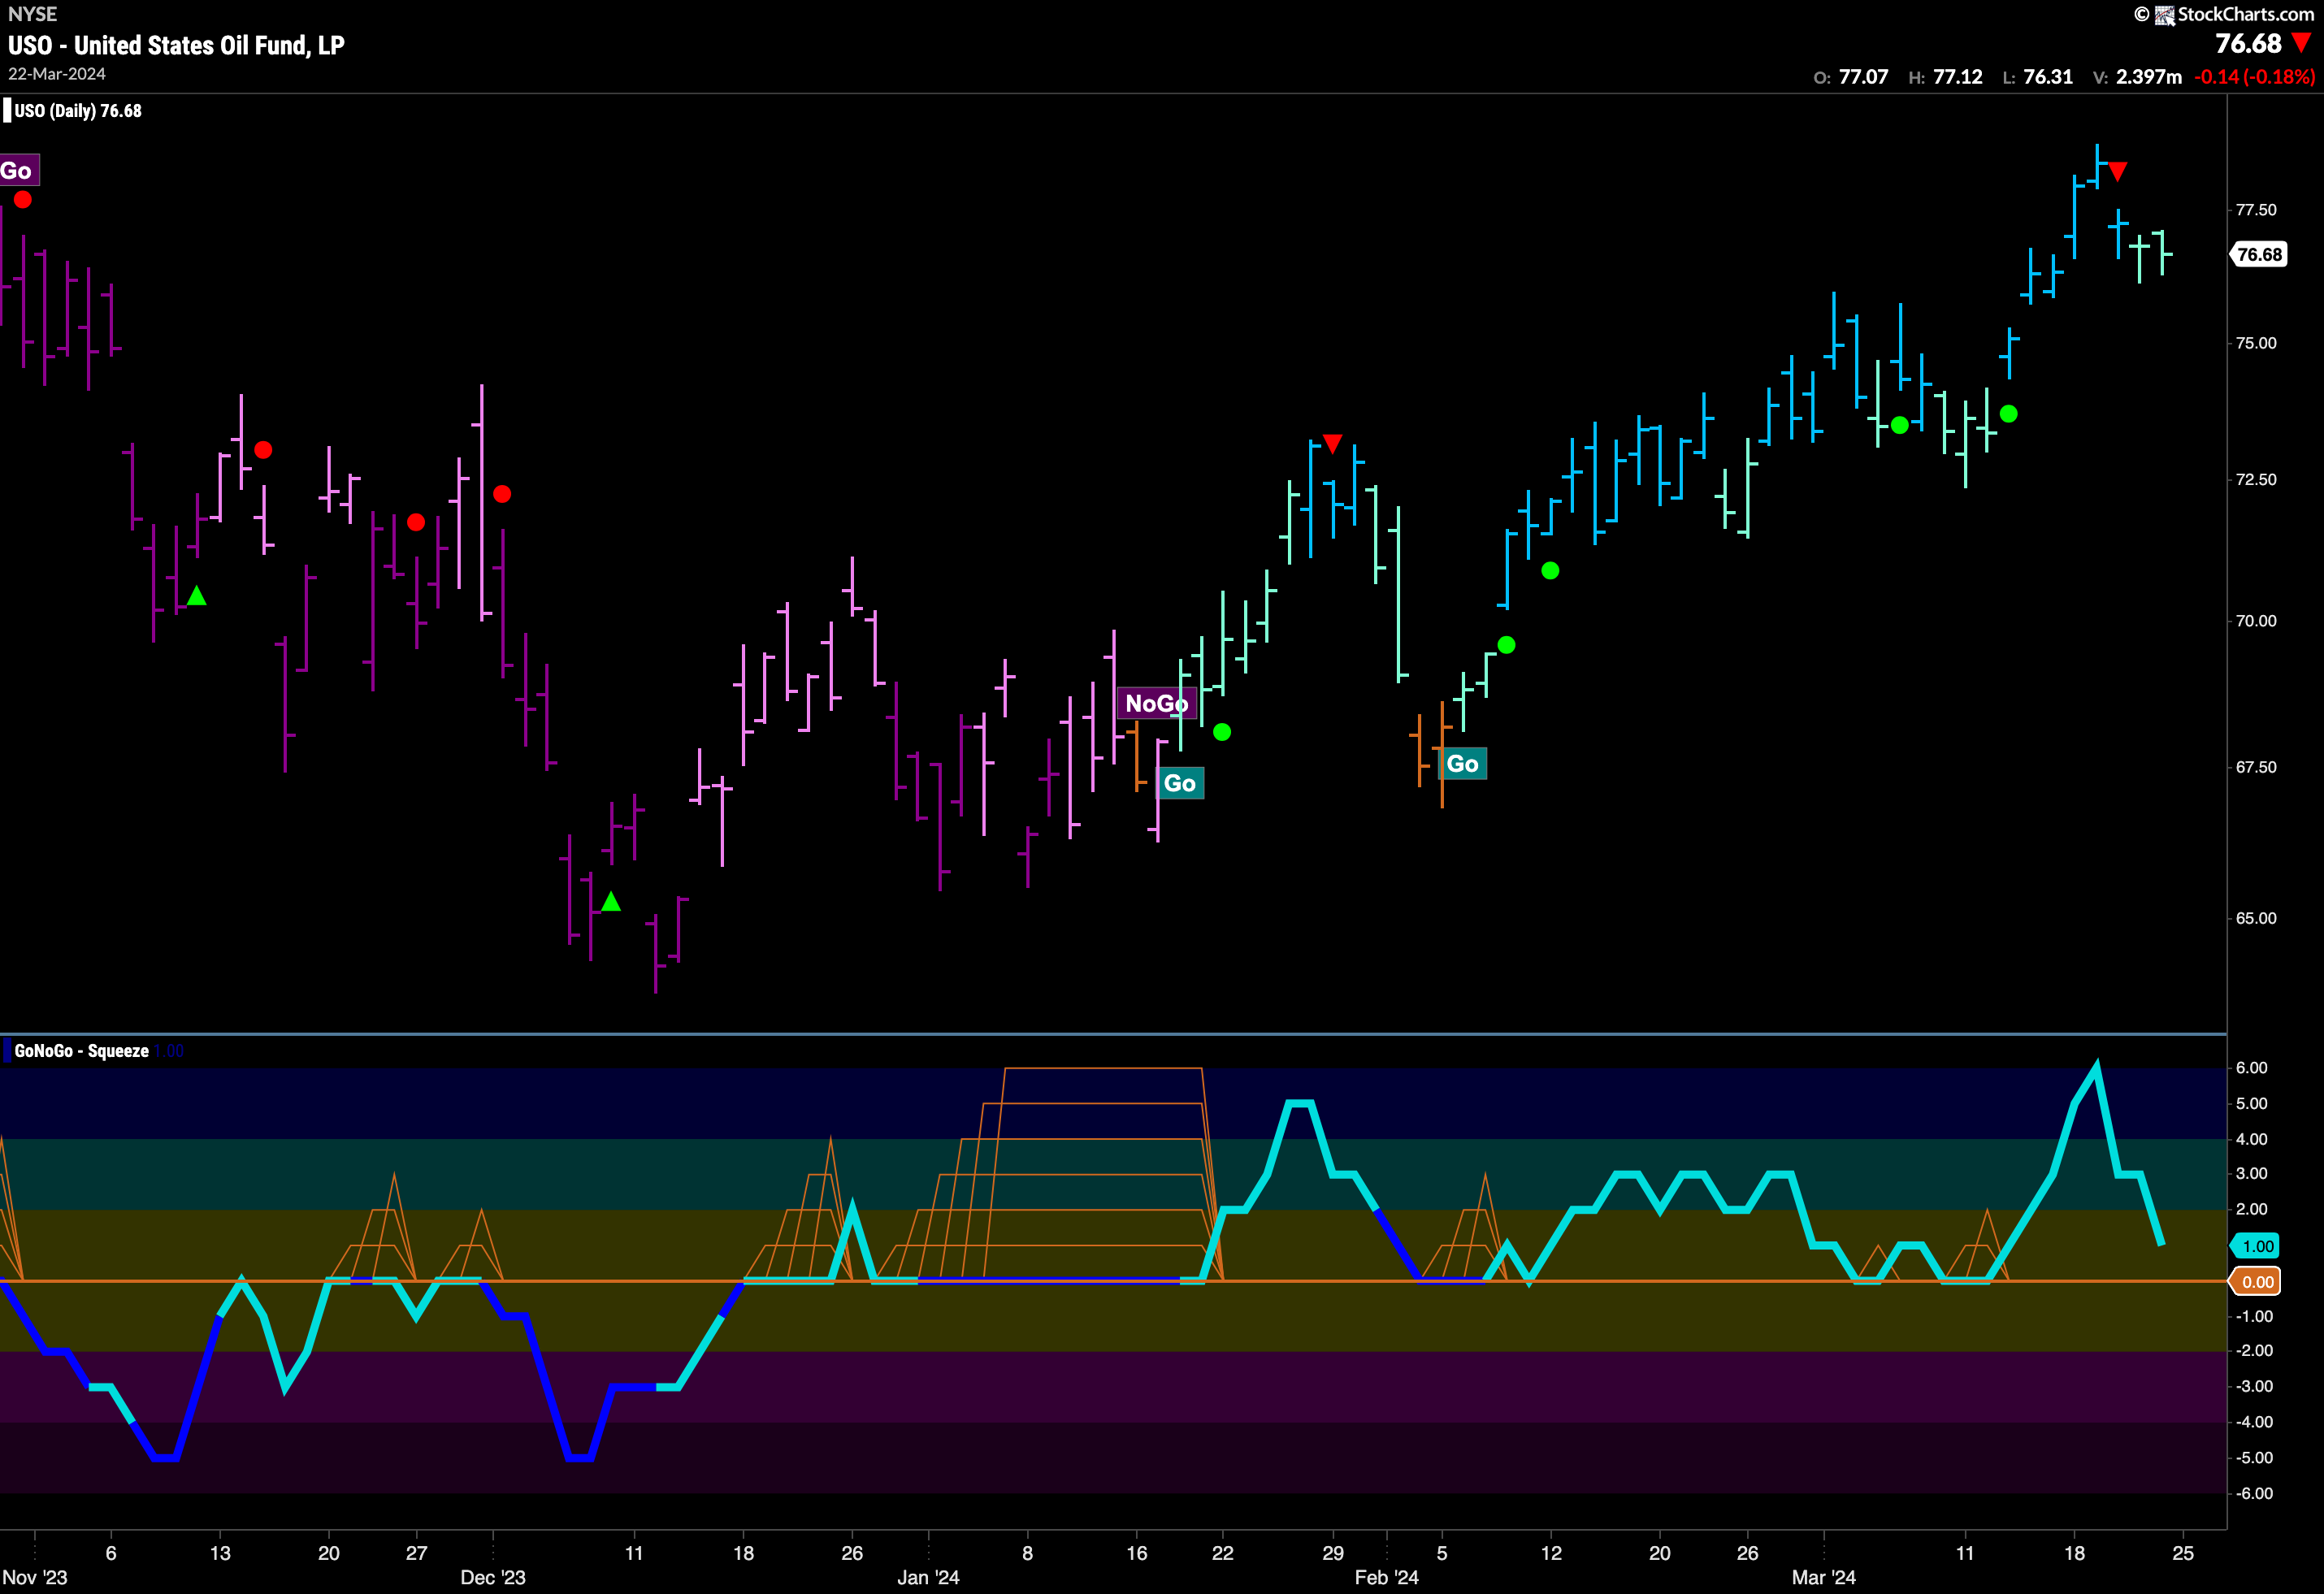
Oil continues to paint “Go” bars and this past week saw a new higher high. GoNoGo Trend painted mostly strong blue “Go” bars as price ran higher. After the high, we saw a Go Countertrend Correction Icon (red arrow) that told us that in the short term price may struggle to go higher. Indeed, GoNoGo Trend then painted a couple of weaker aqua bars to end the week and we see GoNoGo Oscillator falling to test the zero line.
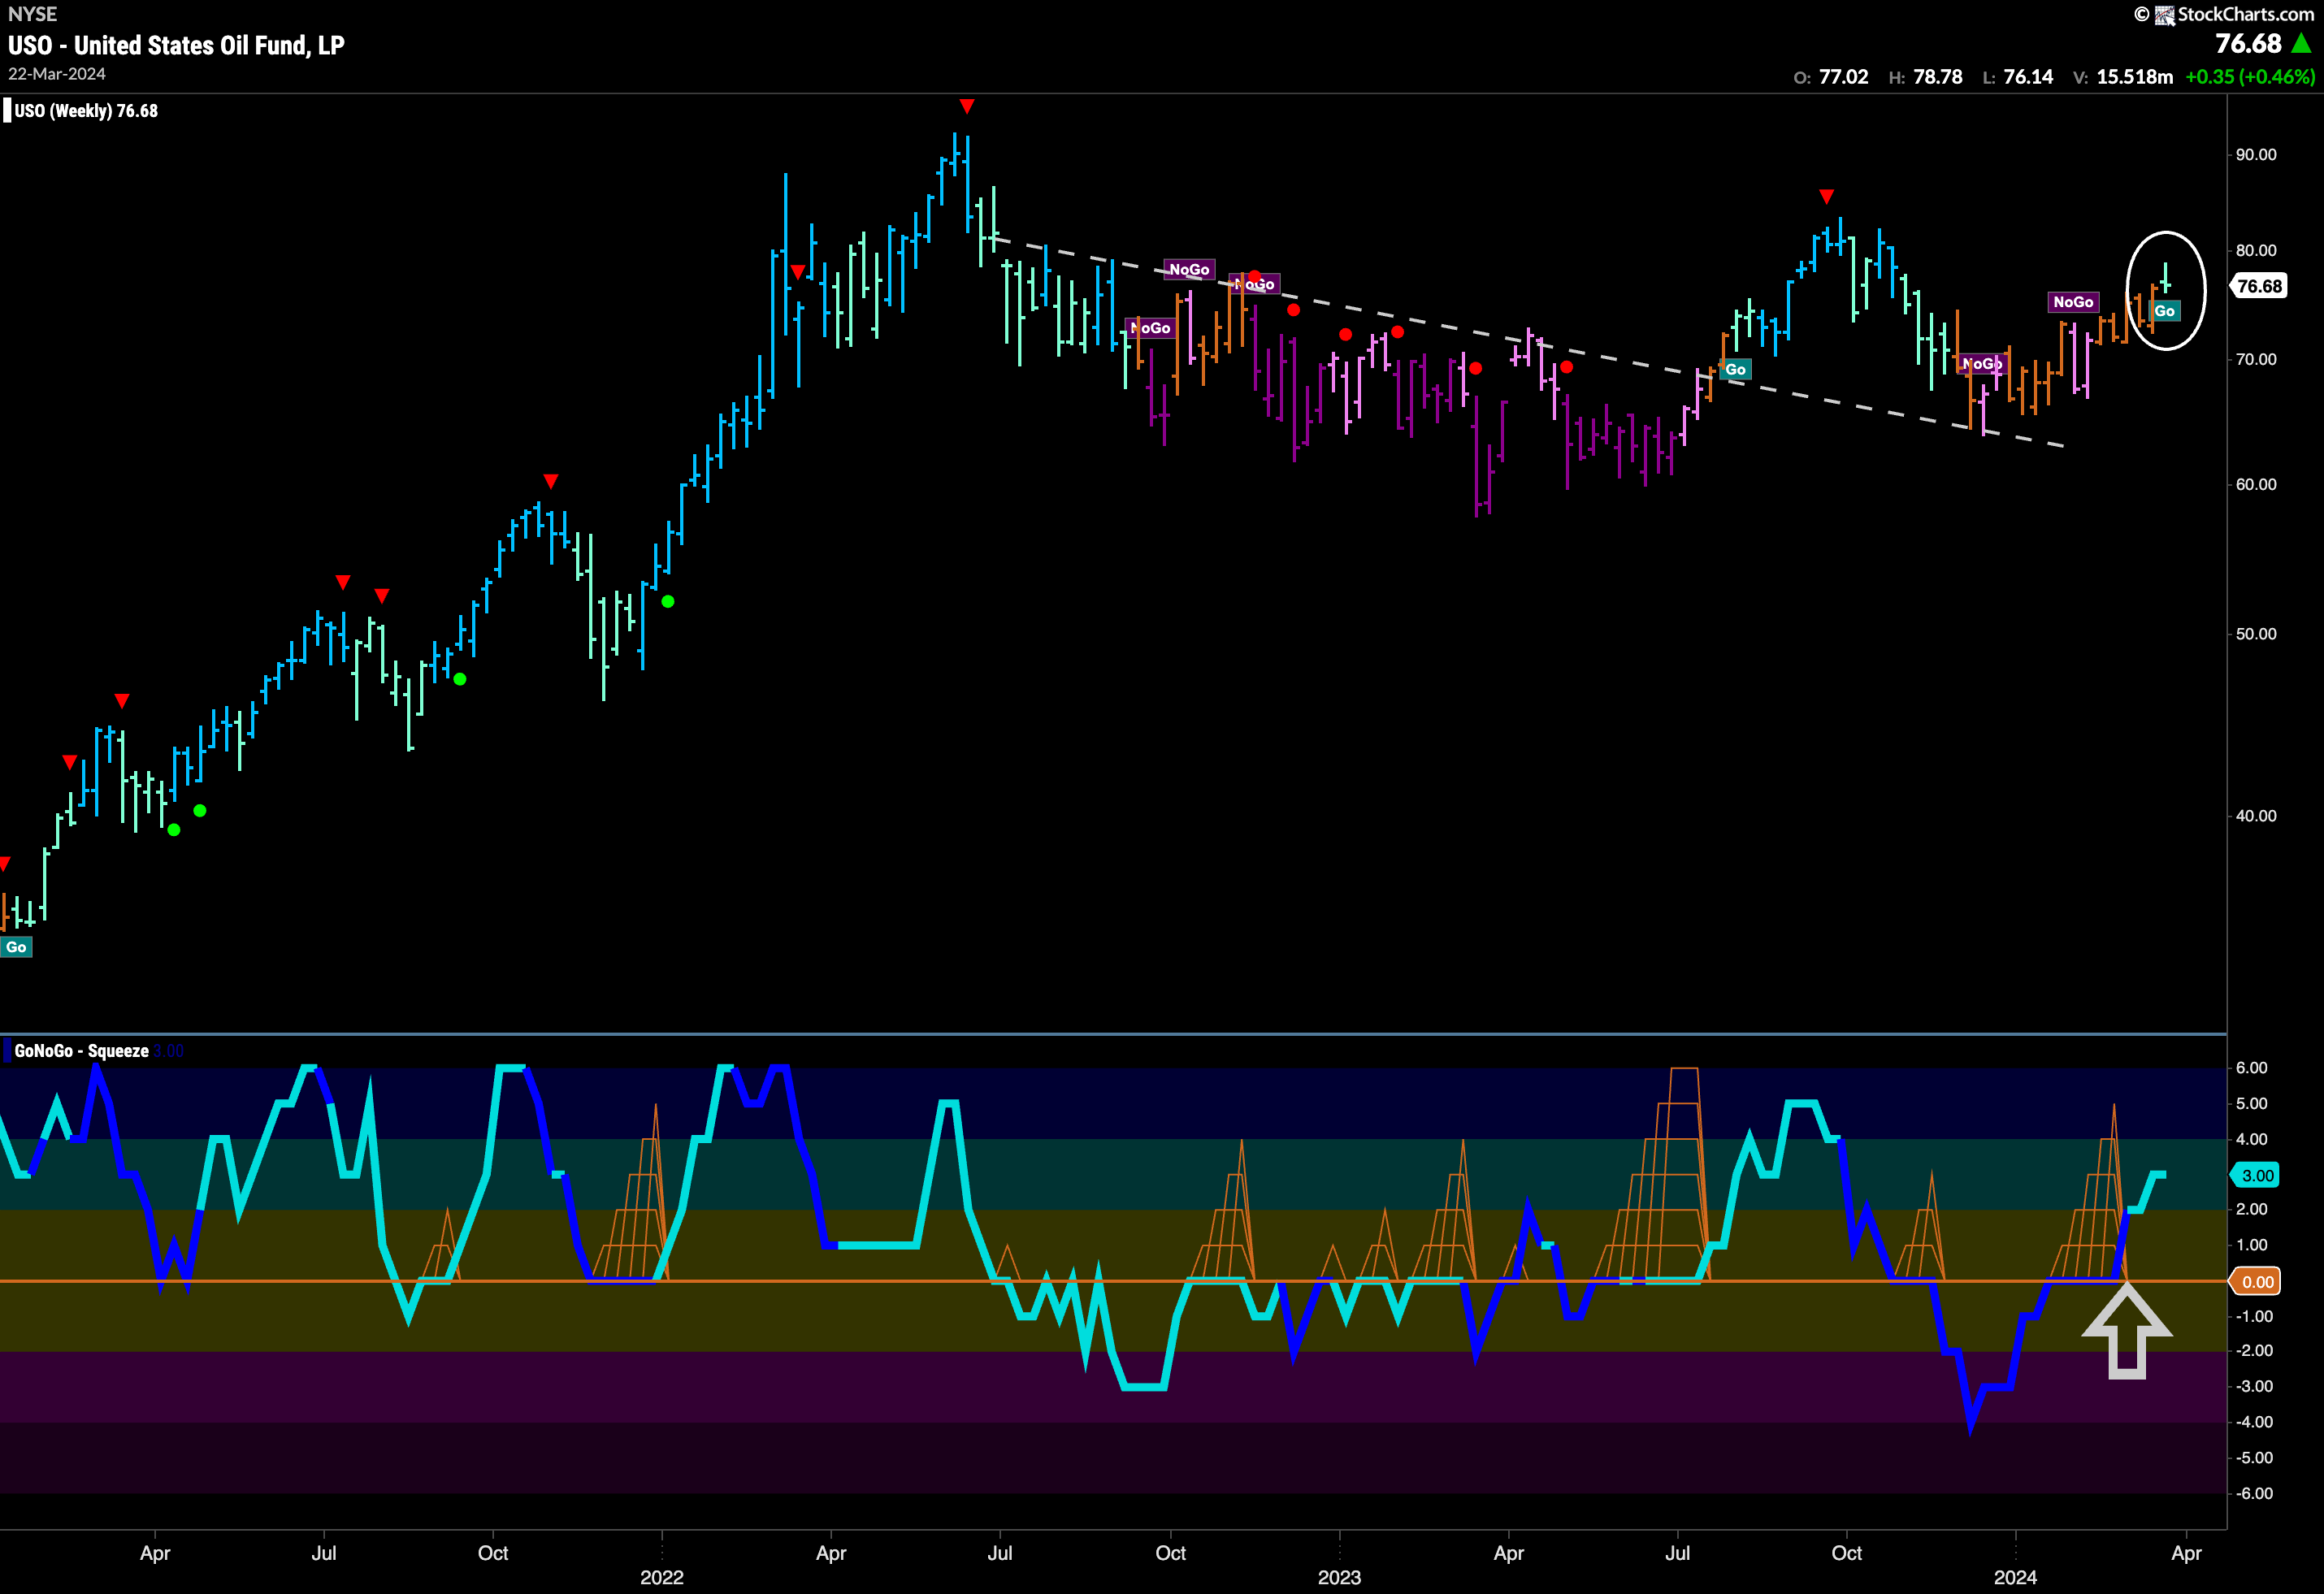
The weekly chart is now flagging a “Go” trend. After a majority of amber “Go Fish” bars of uncertainty that have dominated for the past few months we see a first aqua “Go” bar. This comes after GoNoGo Oscillator has burst out of a GoNoGo Squeeze into positive territory. We can now say that momentum is in line with the new “GO” trend and we will look for price to move higher from here.
Gold Consolidates at New Highs
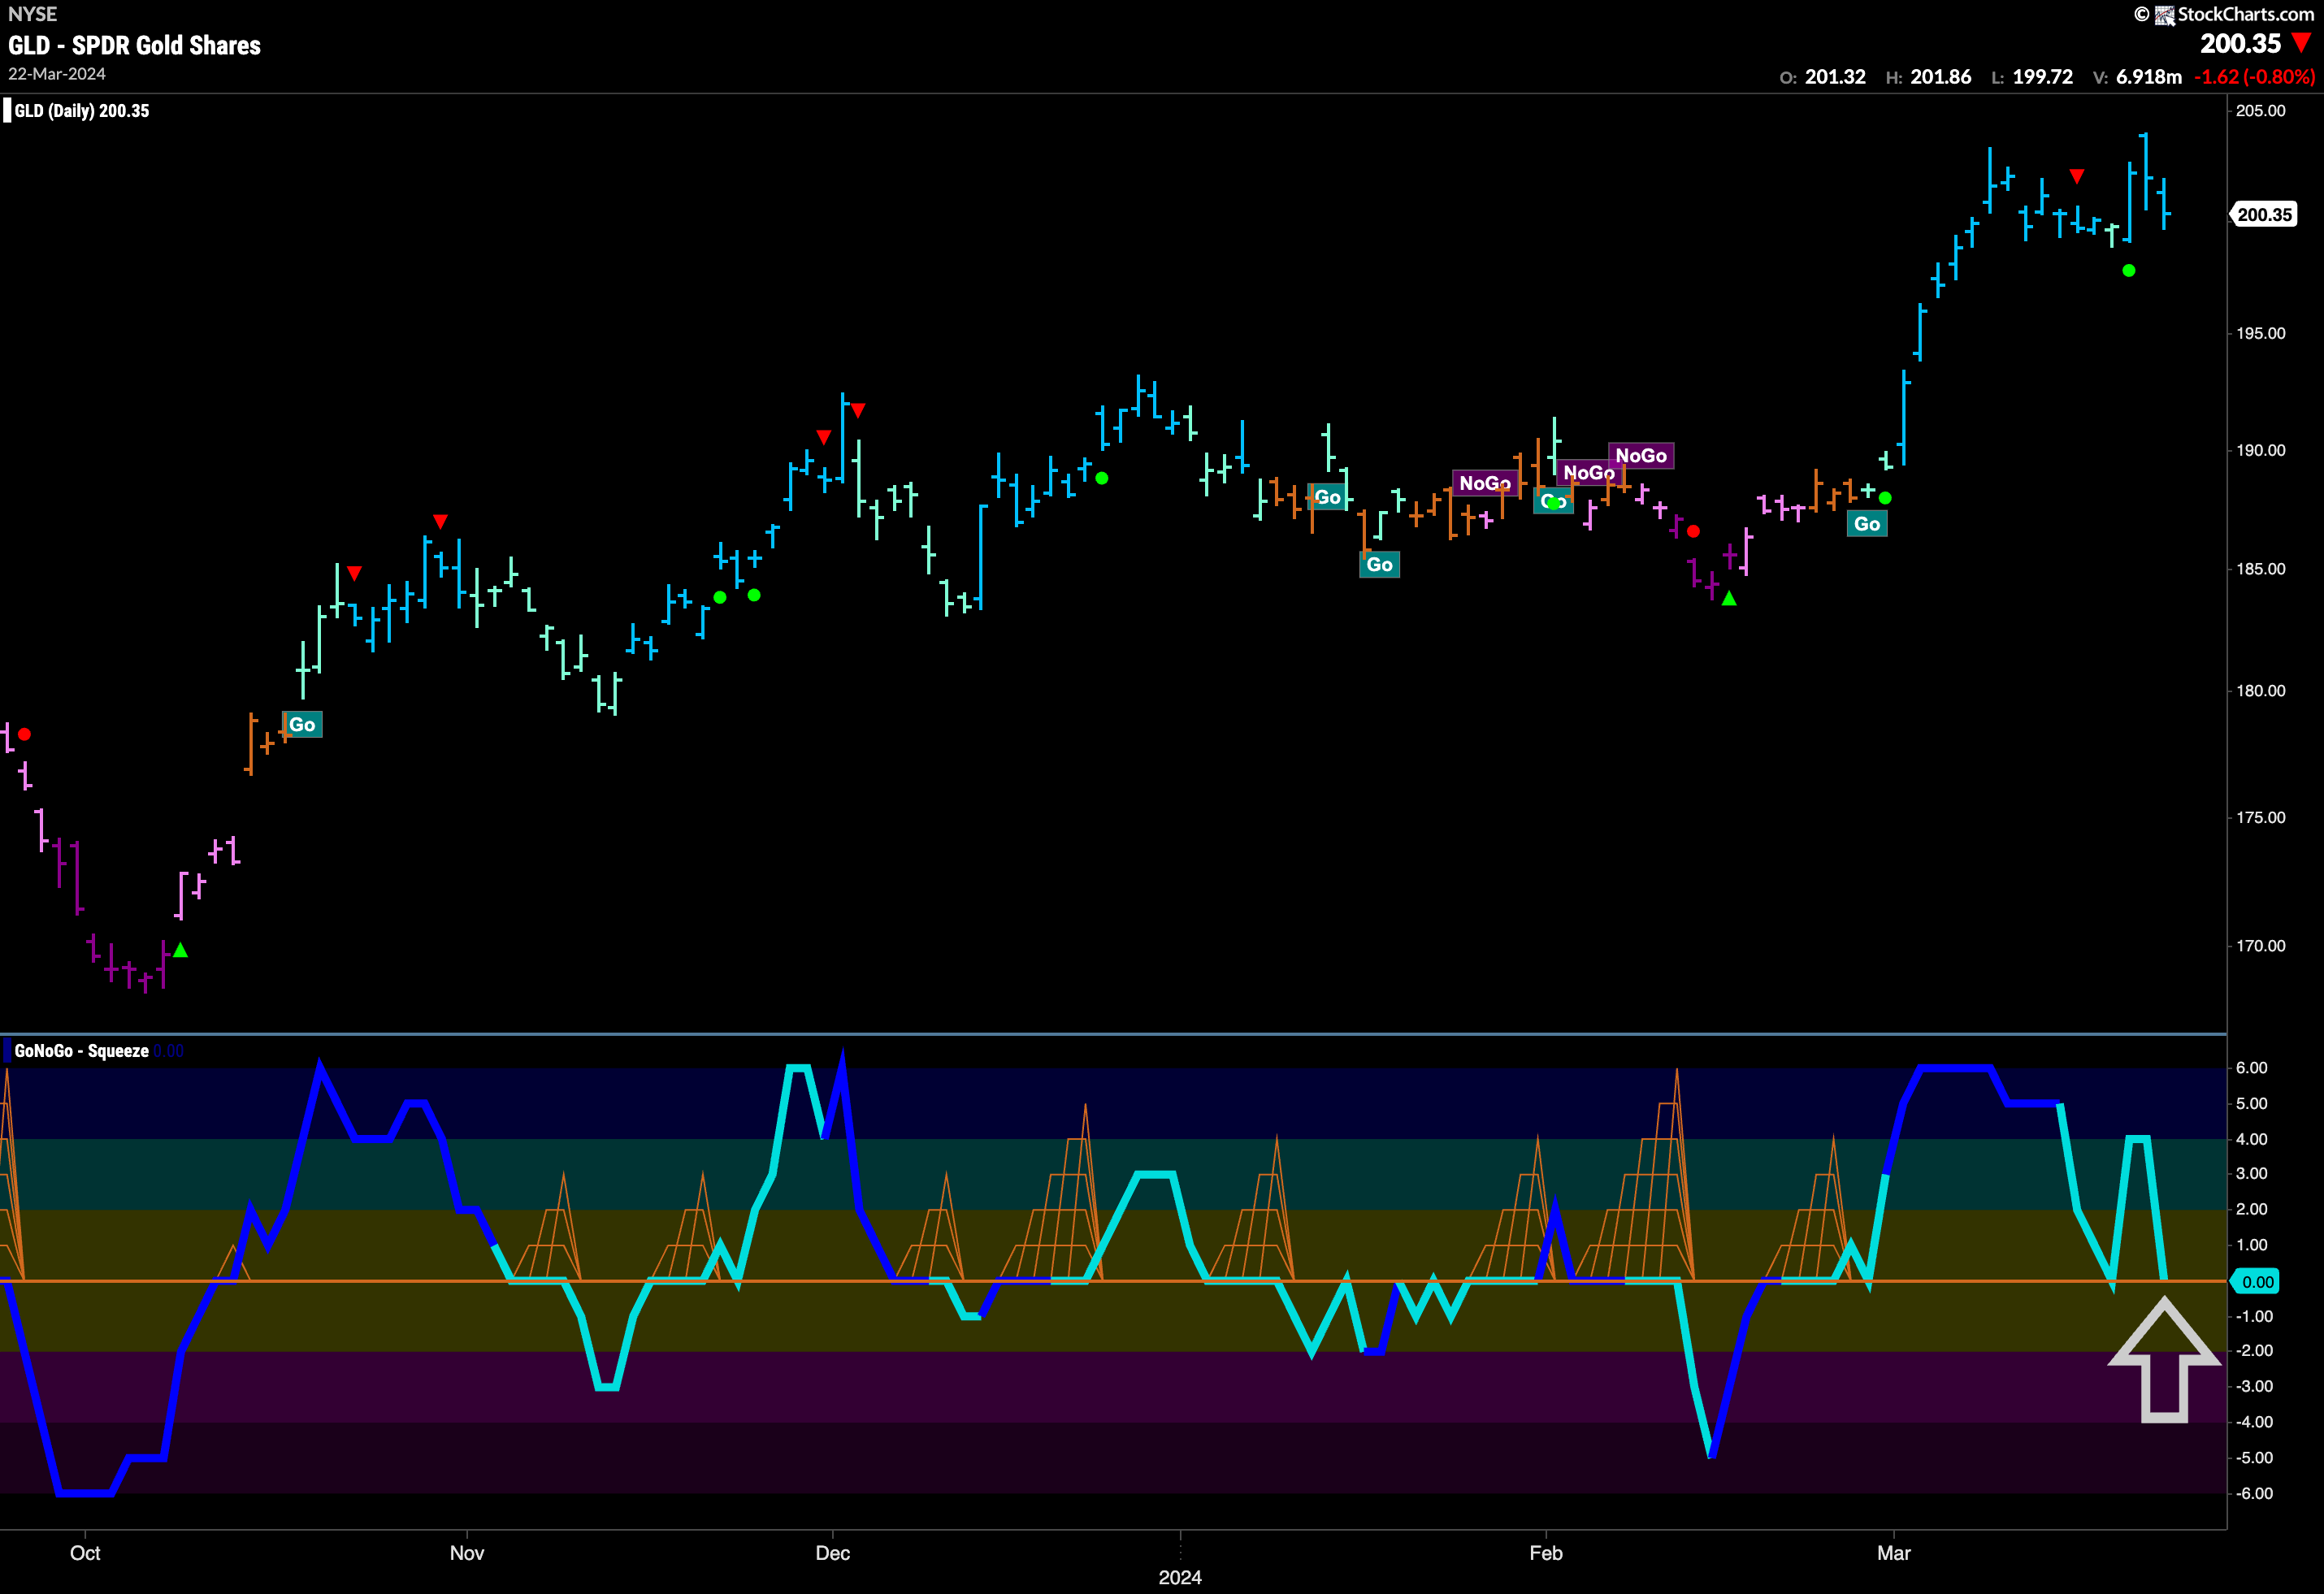
The “Go” trend remains in gold and we saw predominantly strong blue “Go” bars again this week. After briefly hitting an intraday high price fell back and we are now looking for a reason to push higher. GoNoGo Oscillator has fallen again to test the zero line and we will need to see continued support at this level. If we rally back into positive territory again then we will look for that increasing momentum in the direction of the “Go” trend to push price to new highs.
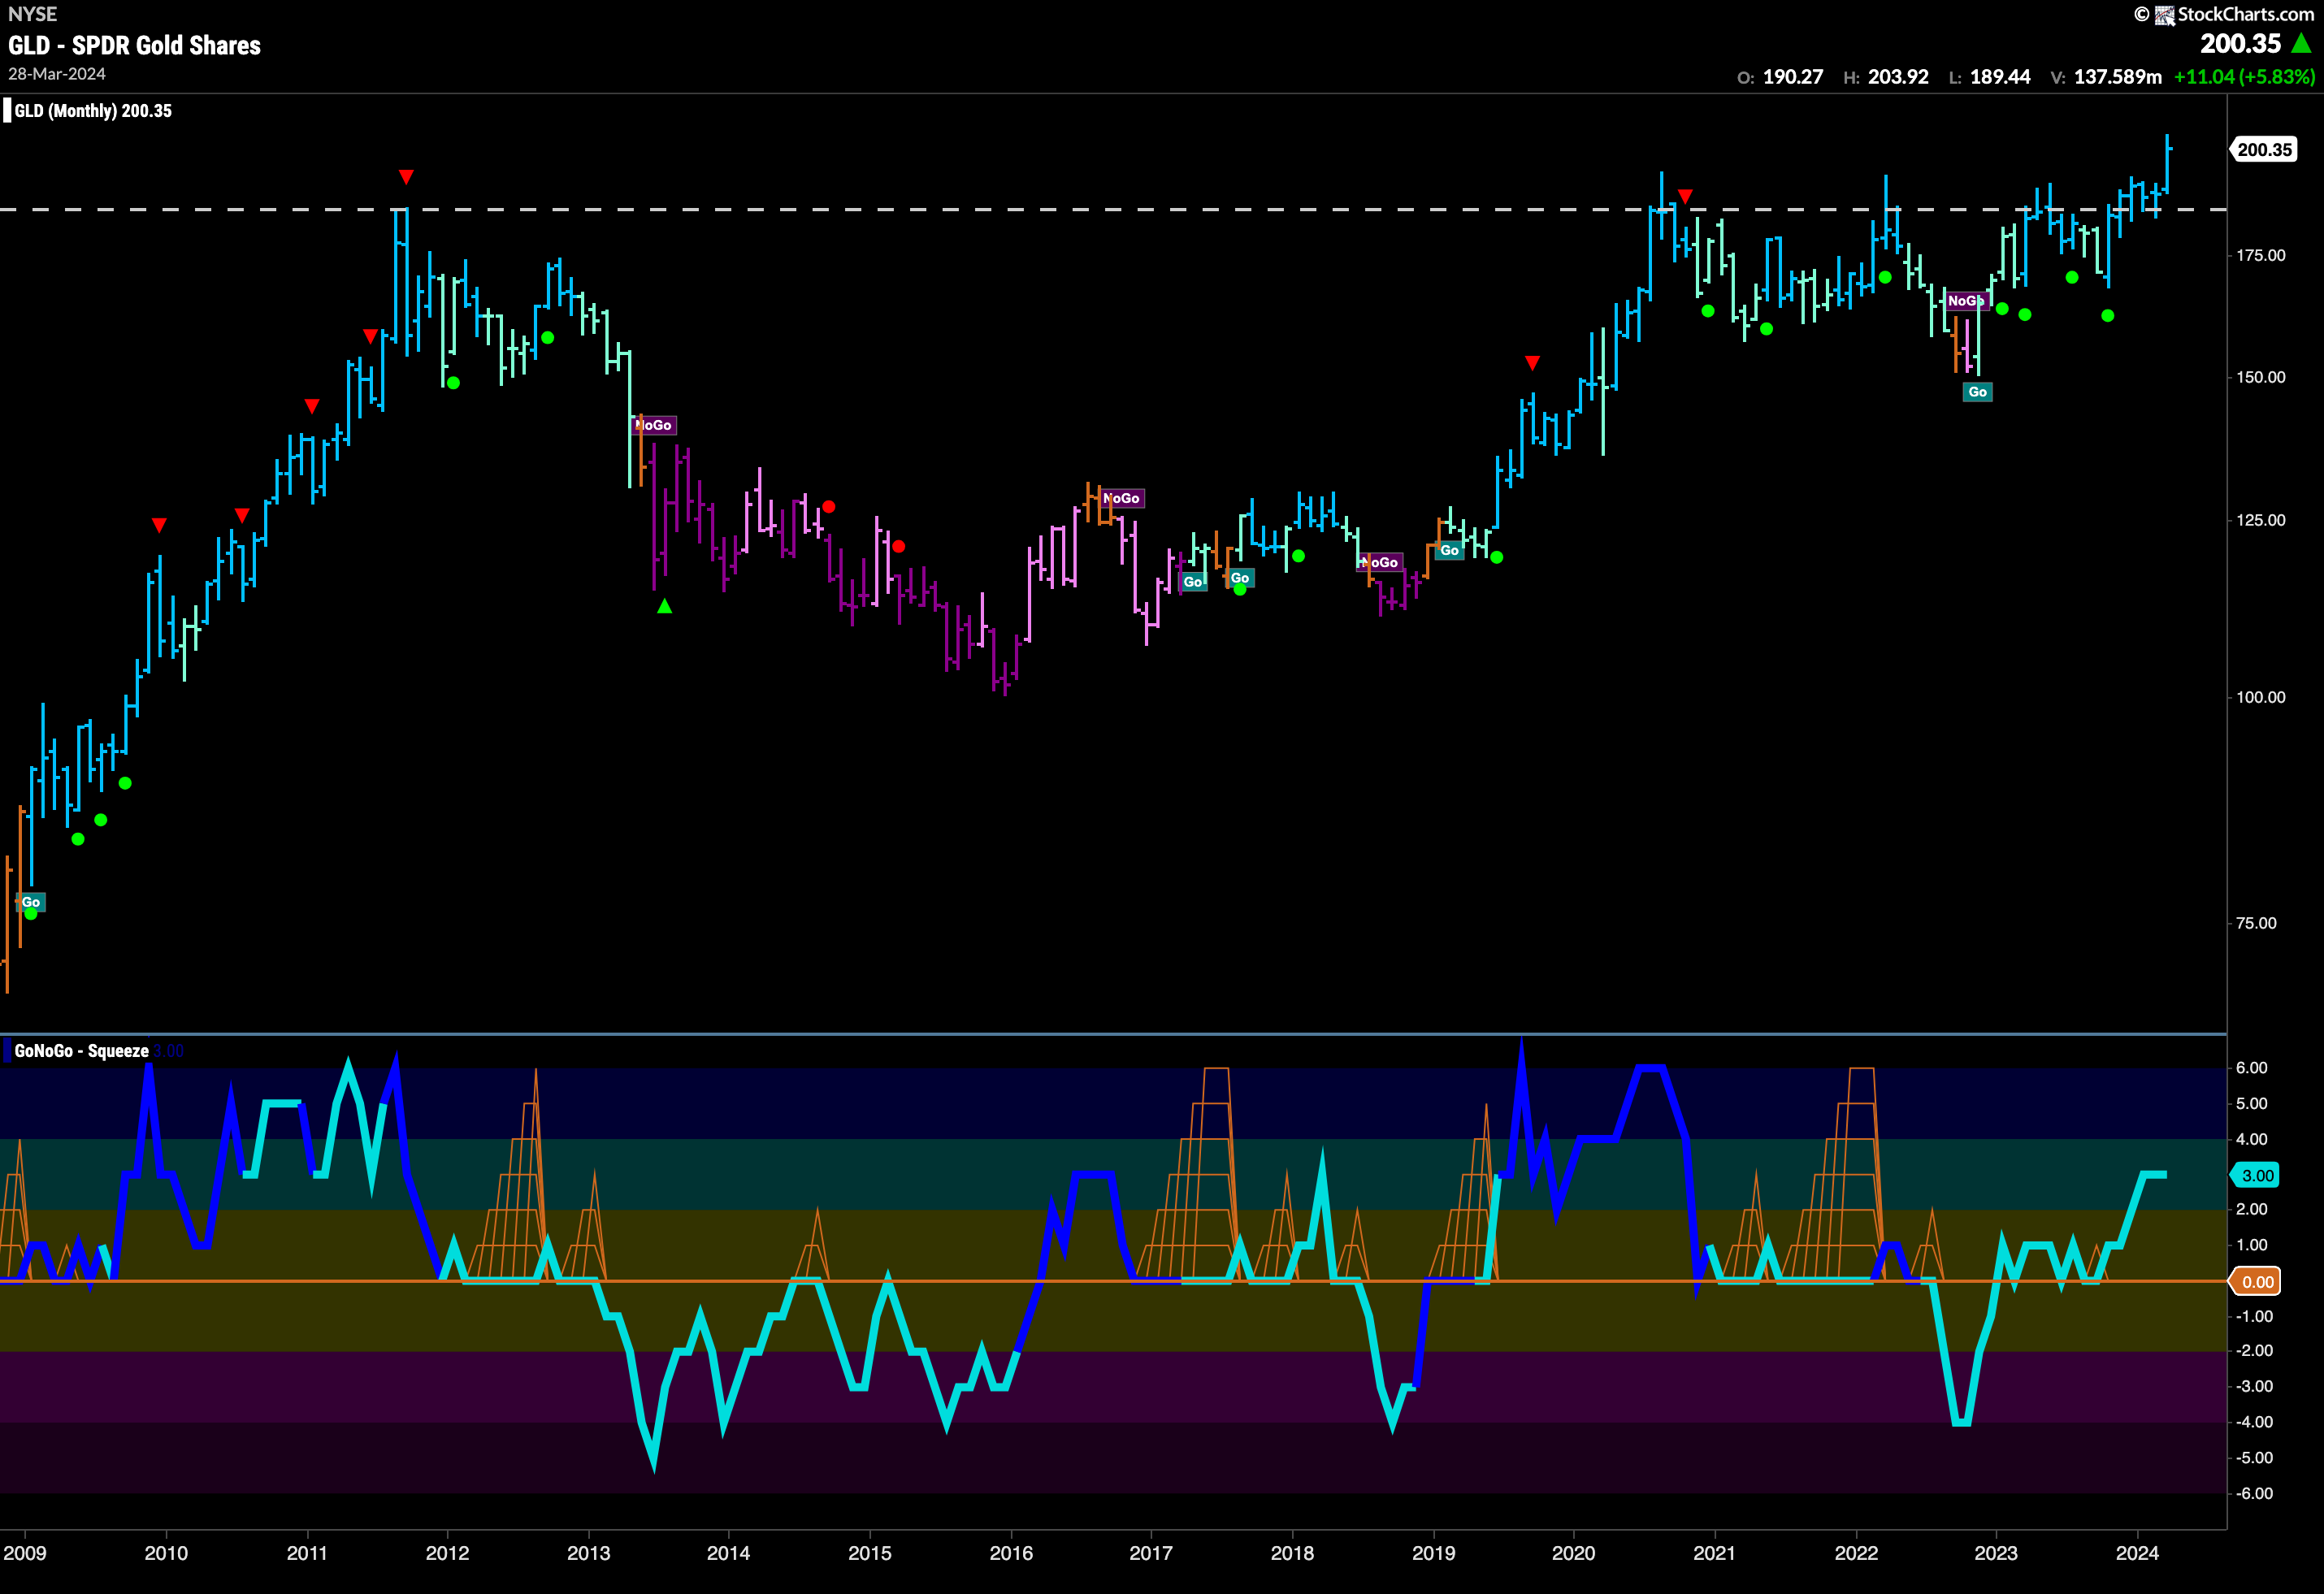
The monthly chart shows that in the long term price is still in good shape. With a week left in this month of trading, it would take quite a drop for price to fall below the horizontal level we have on the chart. The monthly bar is likely to finish a strong blue “Go” bar and close at new highs. GoNoGo Oscillator is in positive territory at a value of 3 and there appears to be some room to run.
Sector RelMap
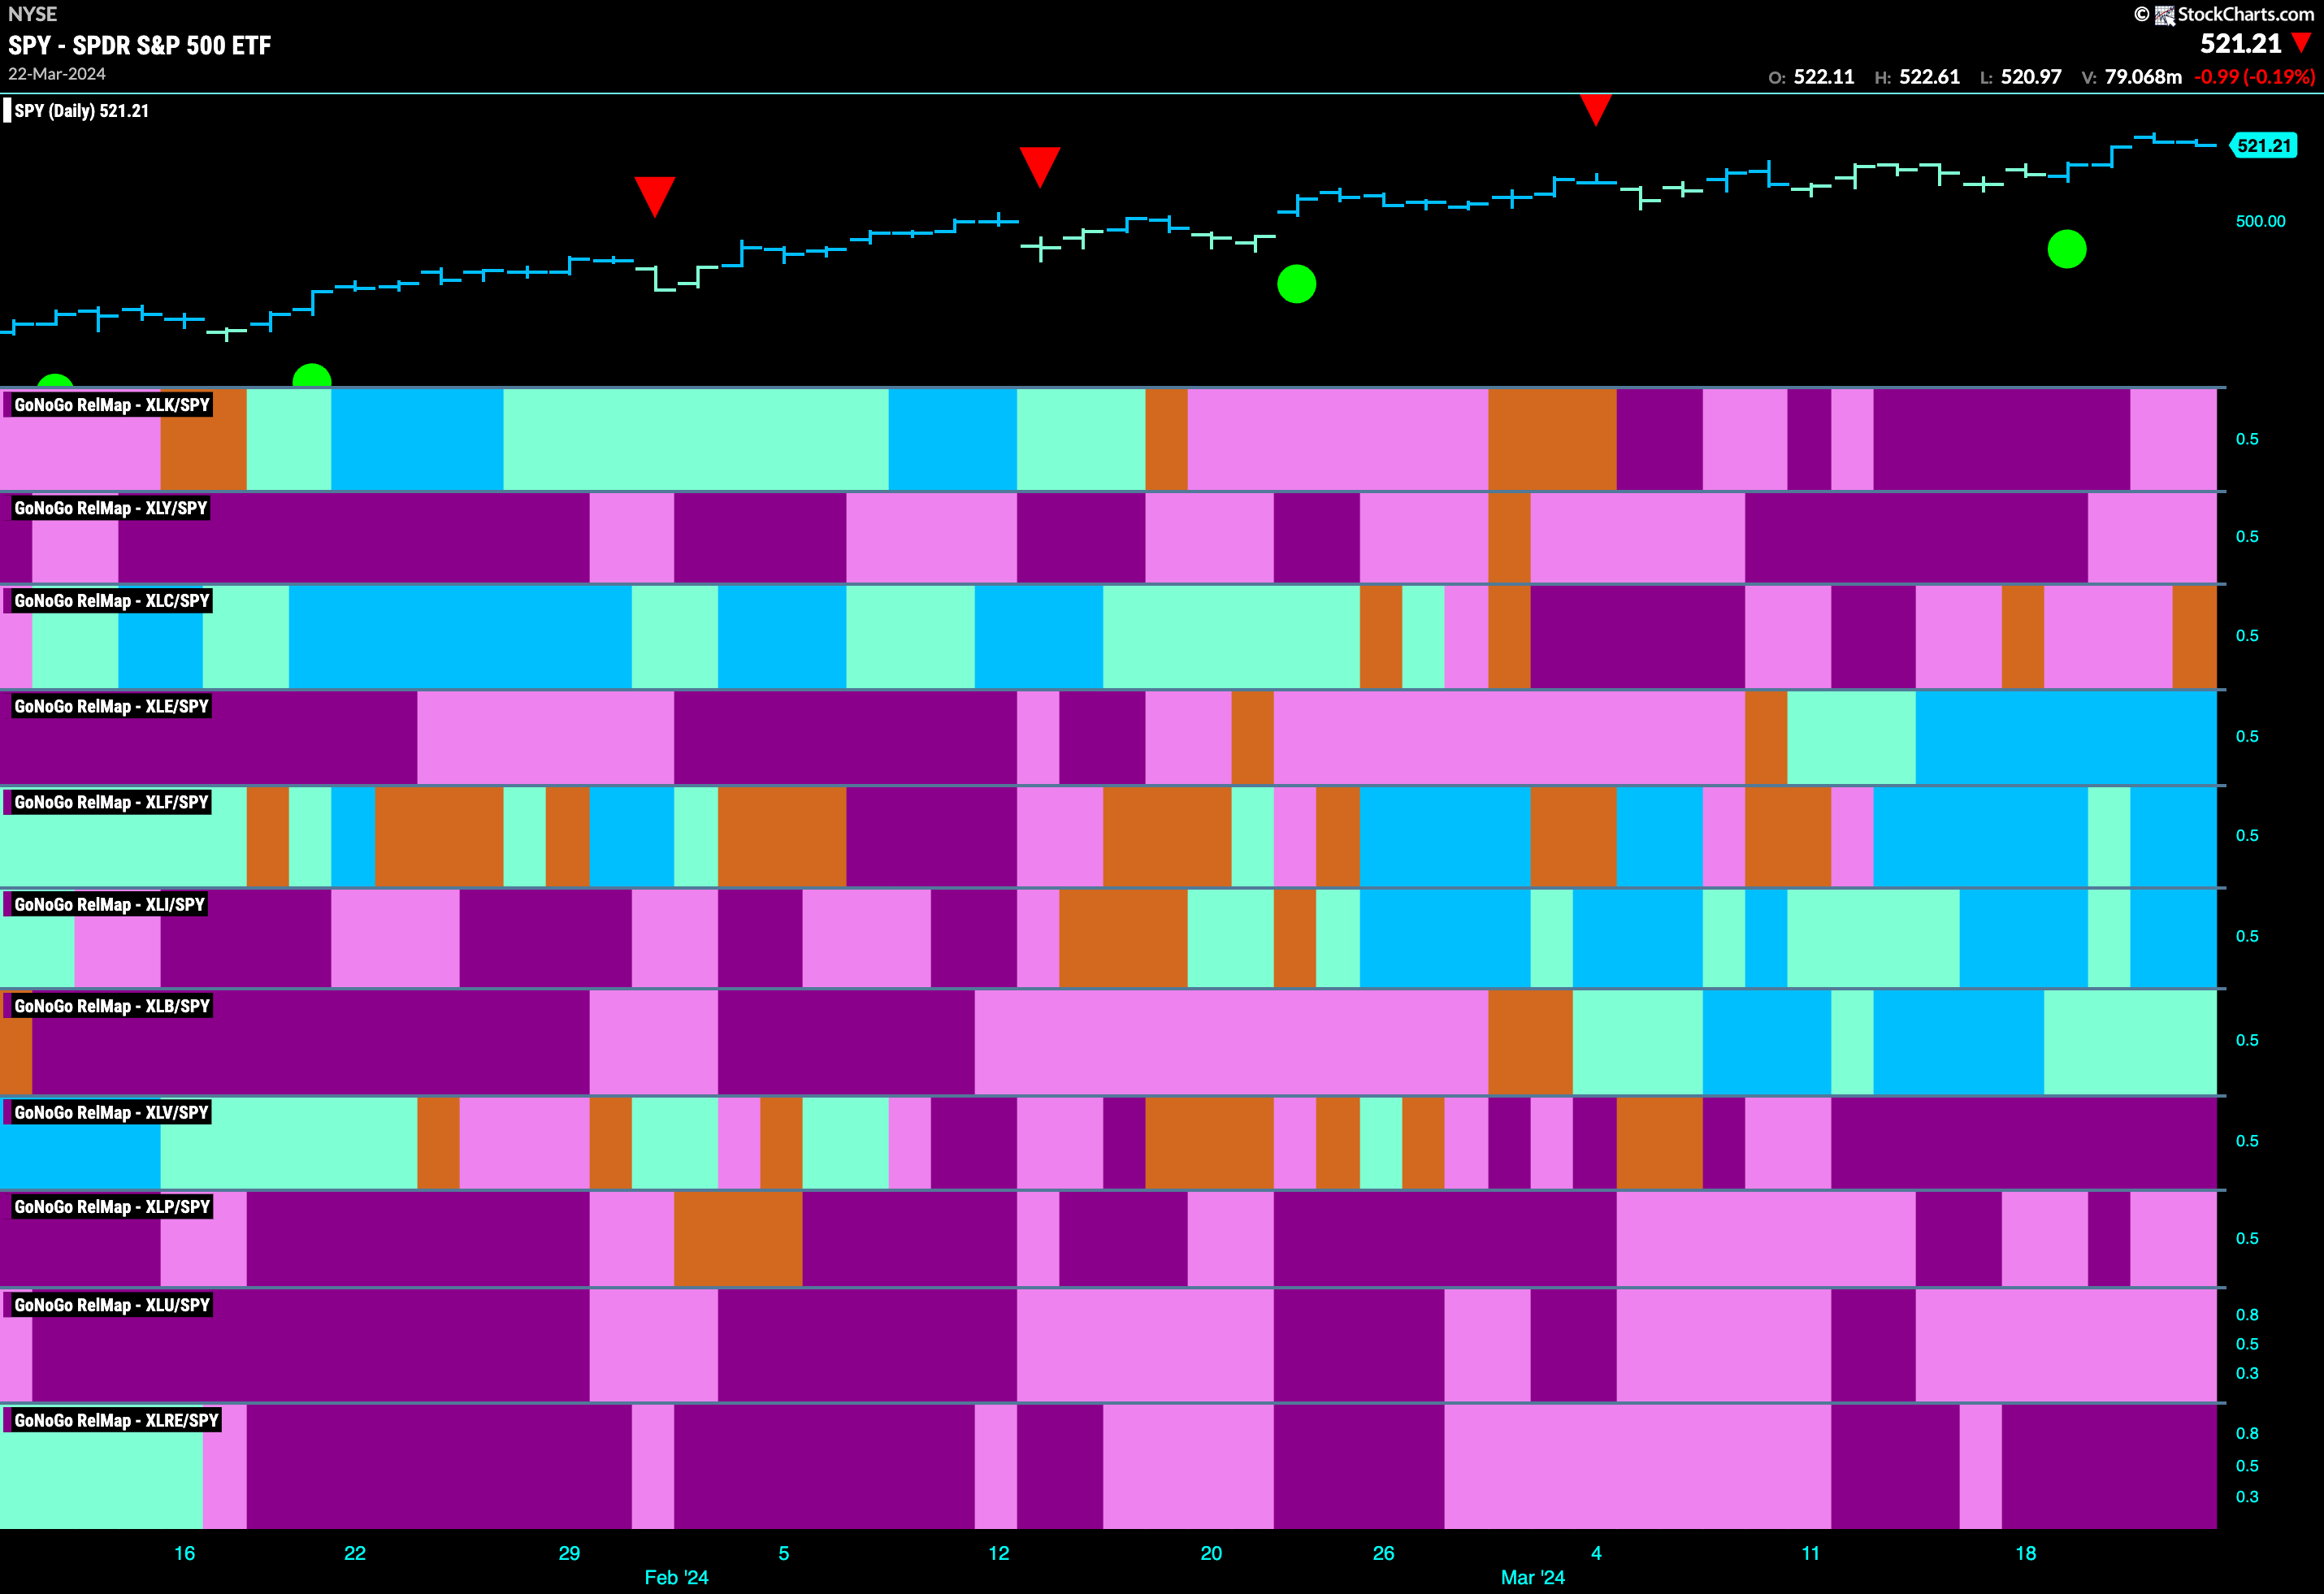
Below is the GoNoGo Sector RelMap. This GoNoGo RelMap applies the GoNoGo Trend to the relative strength ratios of the sectors to the base index. Looking at this map, we can quickly see where the relative outperformance is coming from as well as which sectors are lagging on a relative basis. 4 sectors are outperforming the base index this week. $XLE, $XLF, $XLI, and $XLB are painting relative “Go” bars.
Financials Sub-Group RelMap
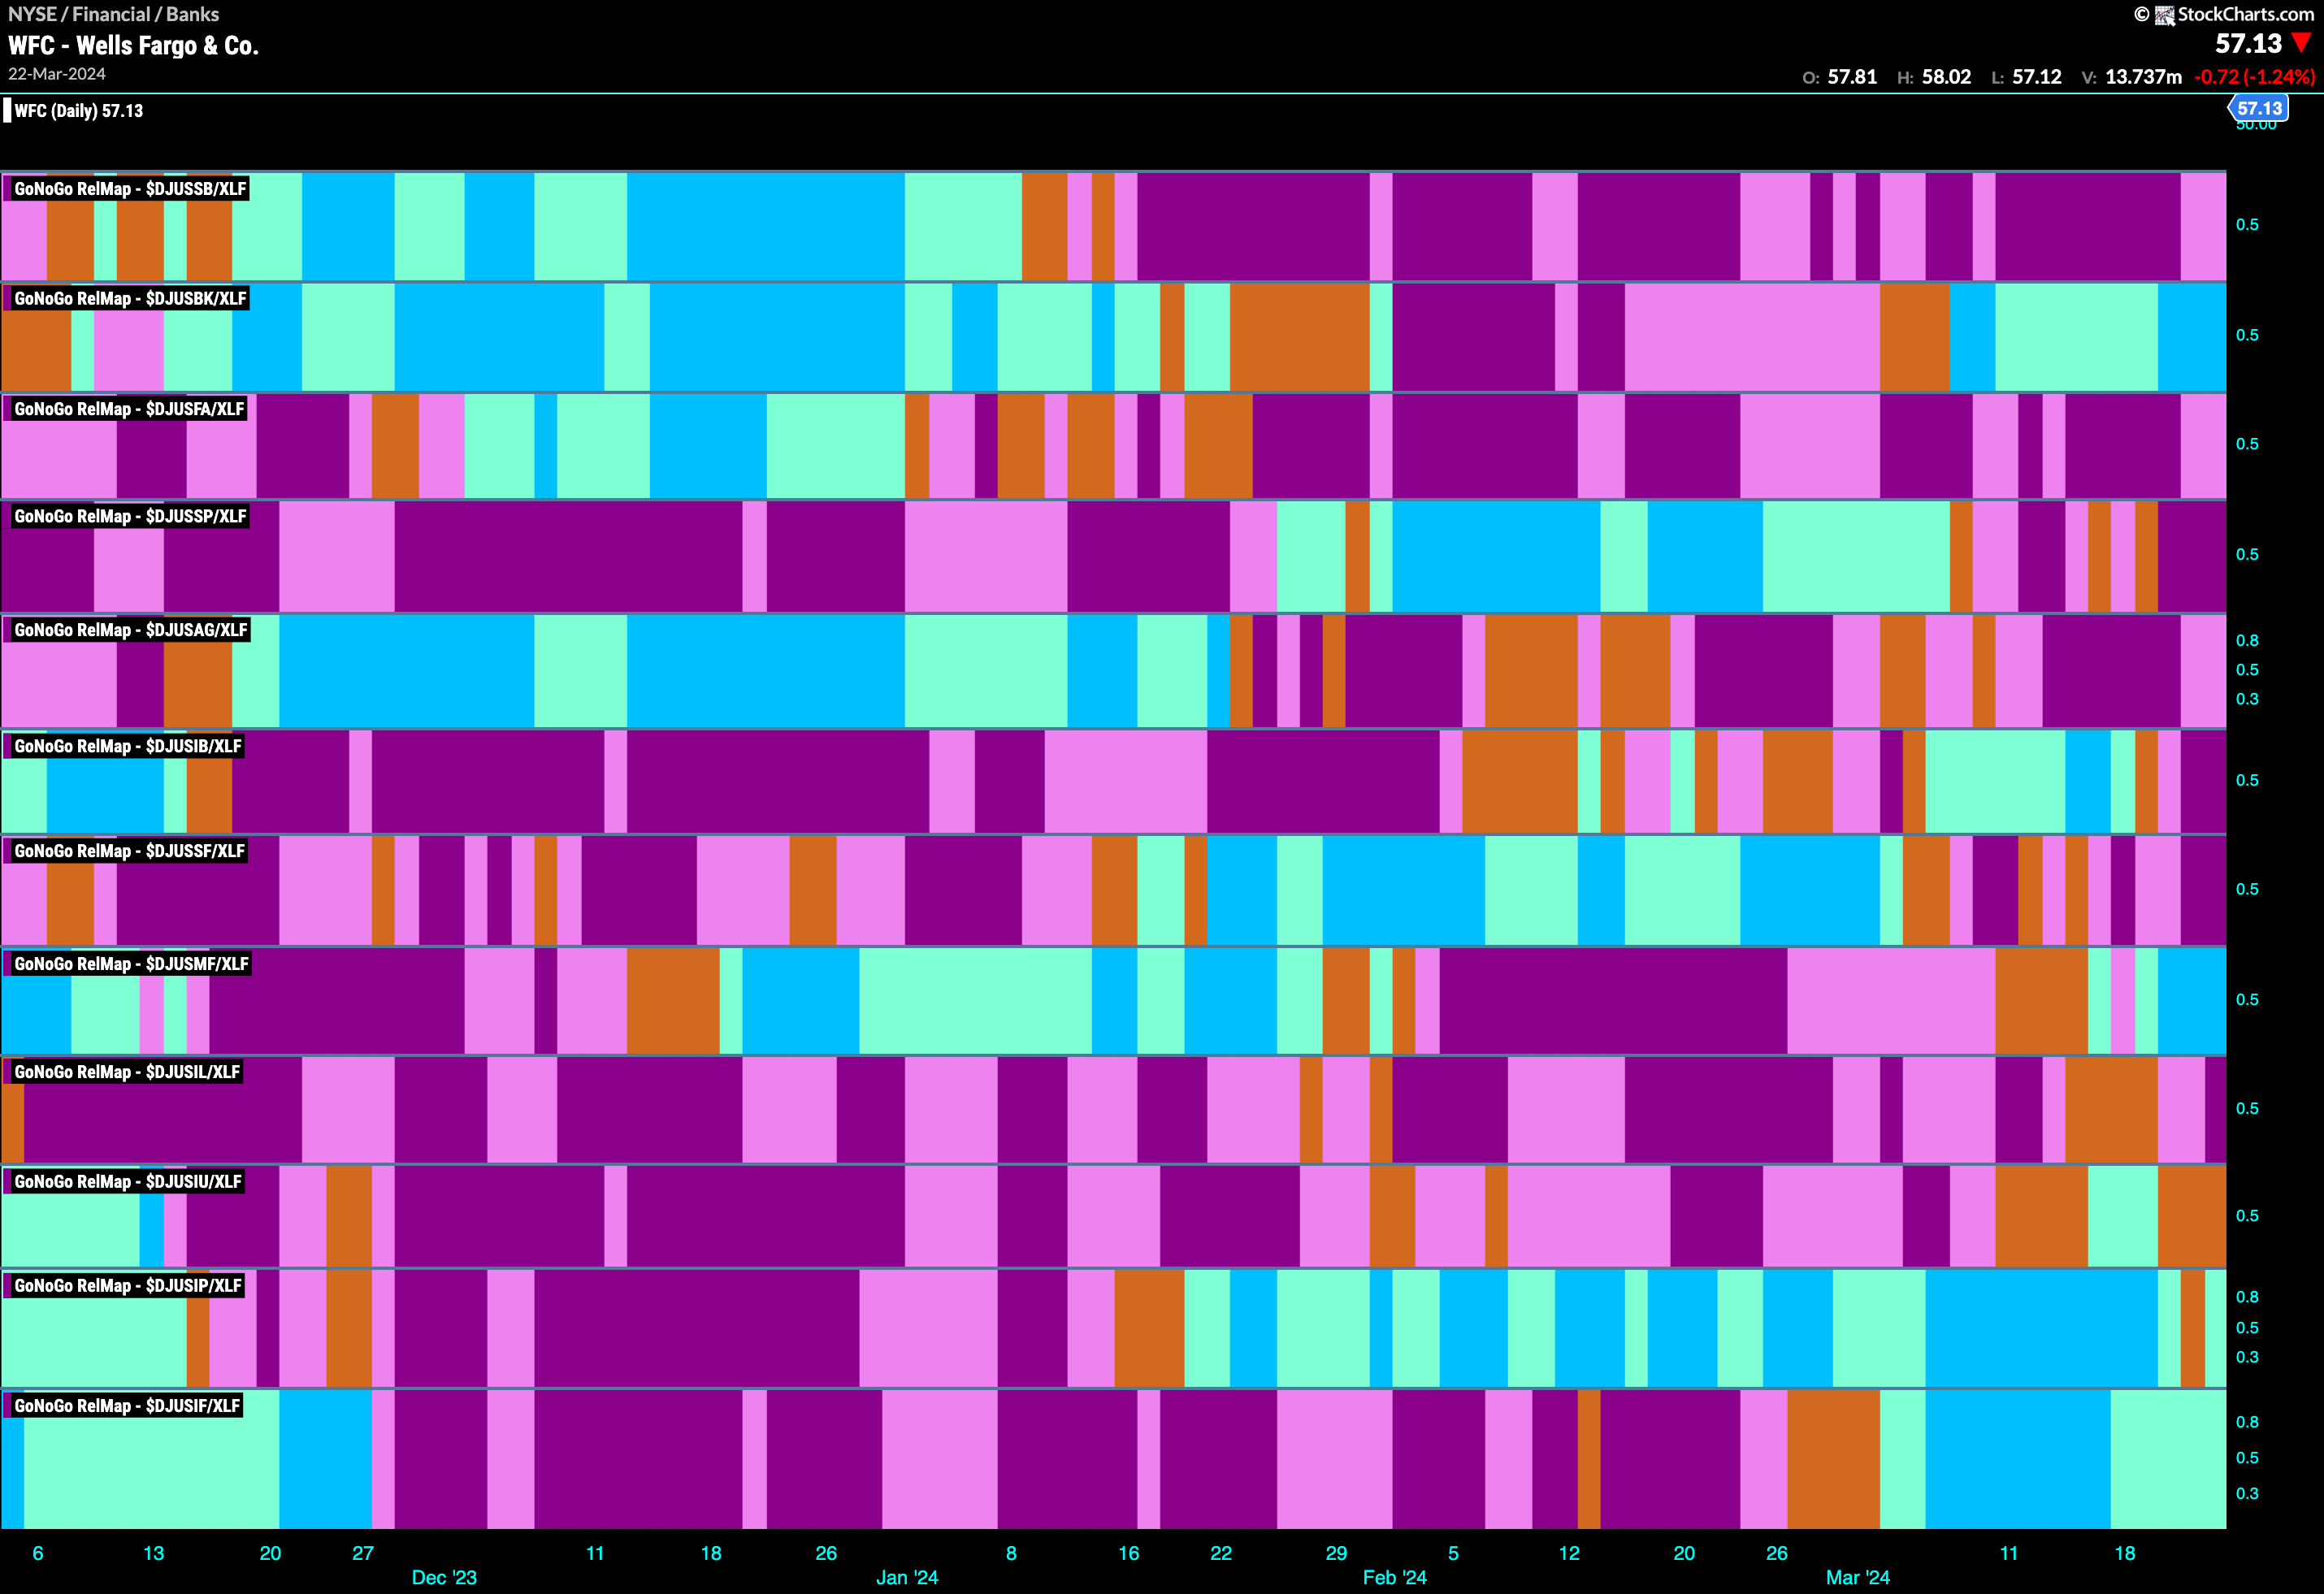
The GoNoGo Sector RelMap above shows that the financials sector continued to outperform the index as a whole this week. We continue to see the rotation emerge here as it is the middle of the map that is leading. Energy, financials, industrials, and materials in relative “Go” trends. Below, we see the individual groups of the financials sector relative to the sector itself. We apply the GoNoGo Trend to those ratios to understand where the relative outperformance is coming from within a sector. We see that it is thin leadership in this sector but it is banks that have painted strong relative “Go” bars as this past week ended and have been in this relative “Go” trend now for a second week.
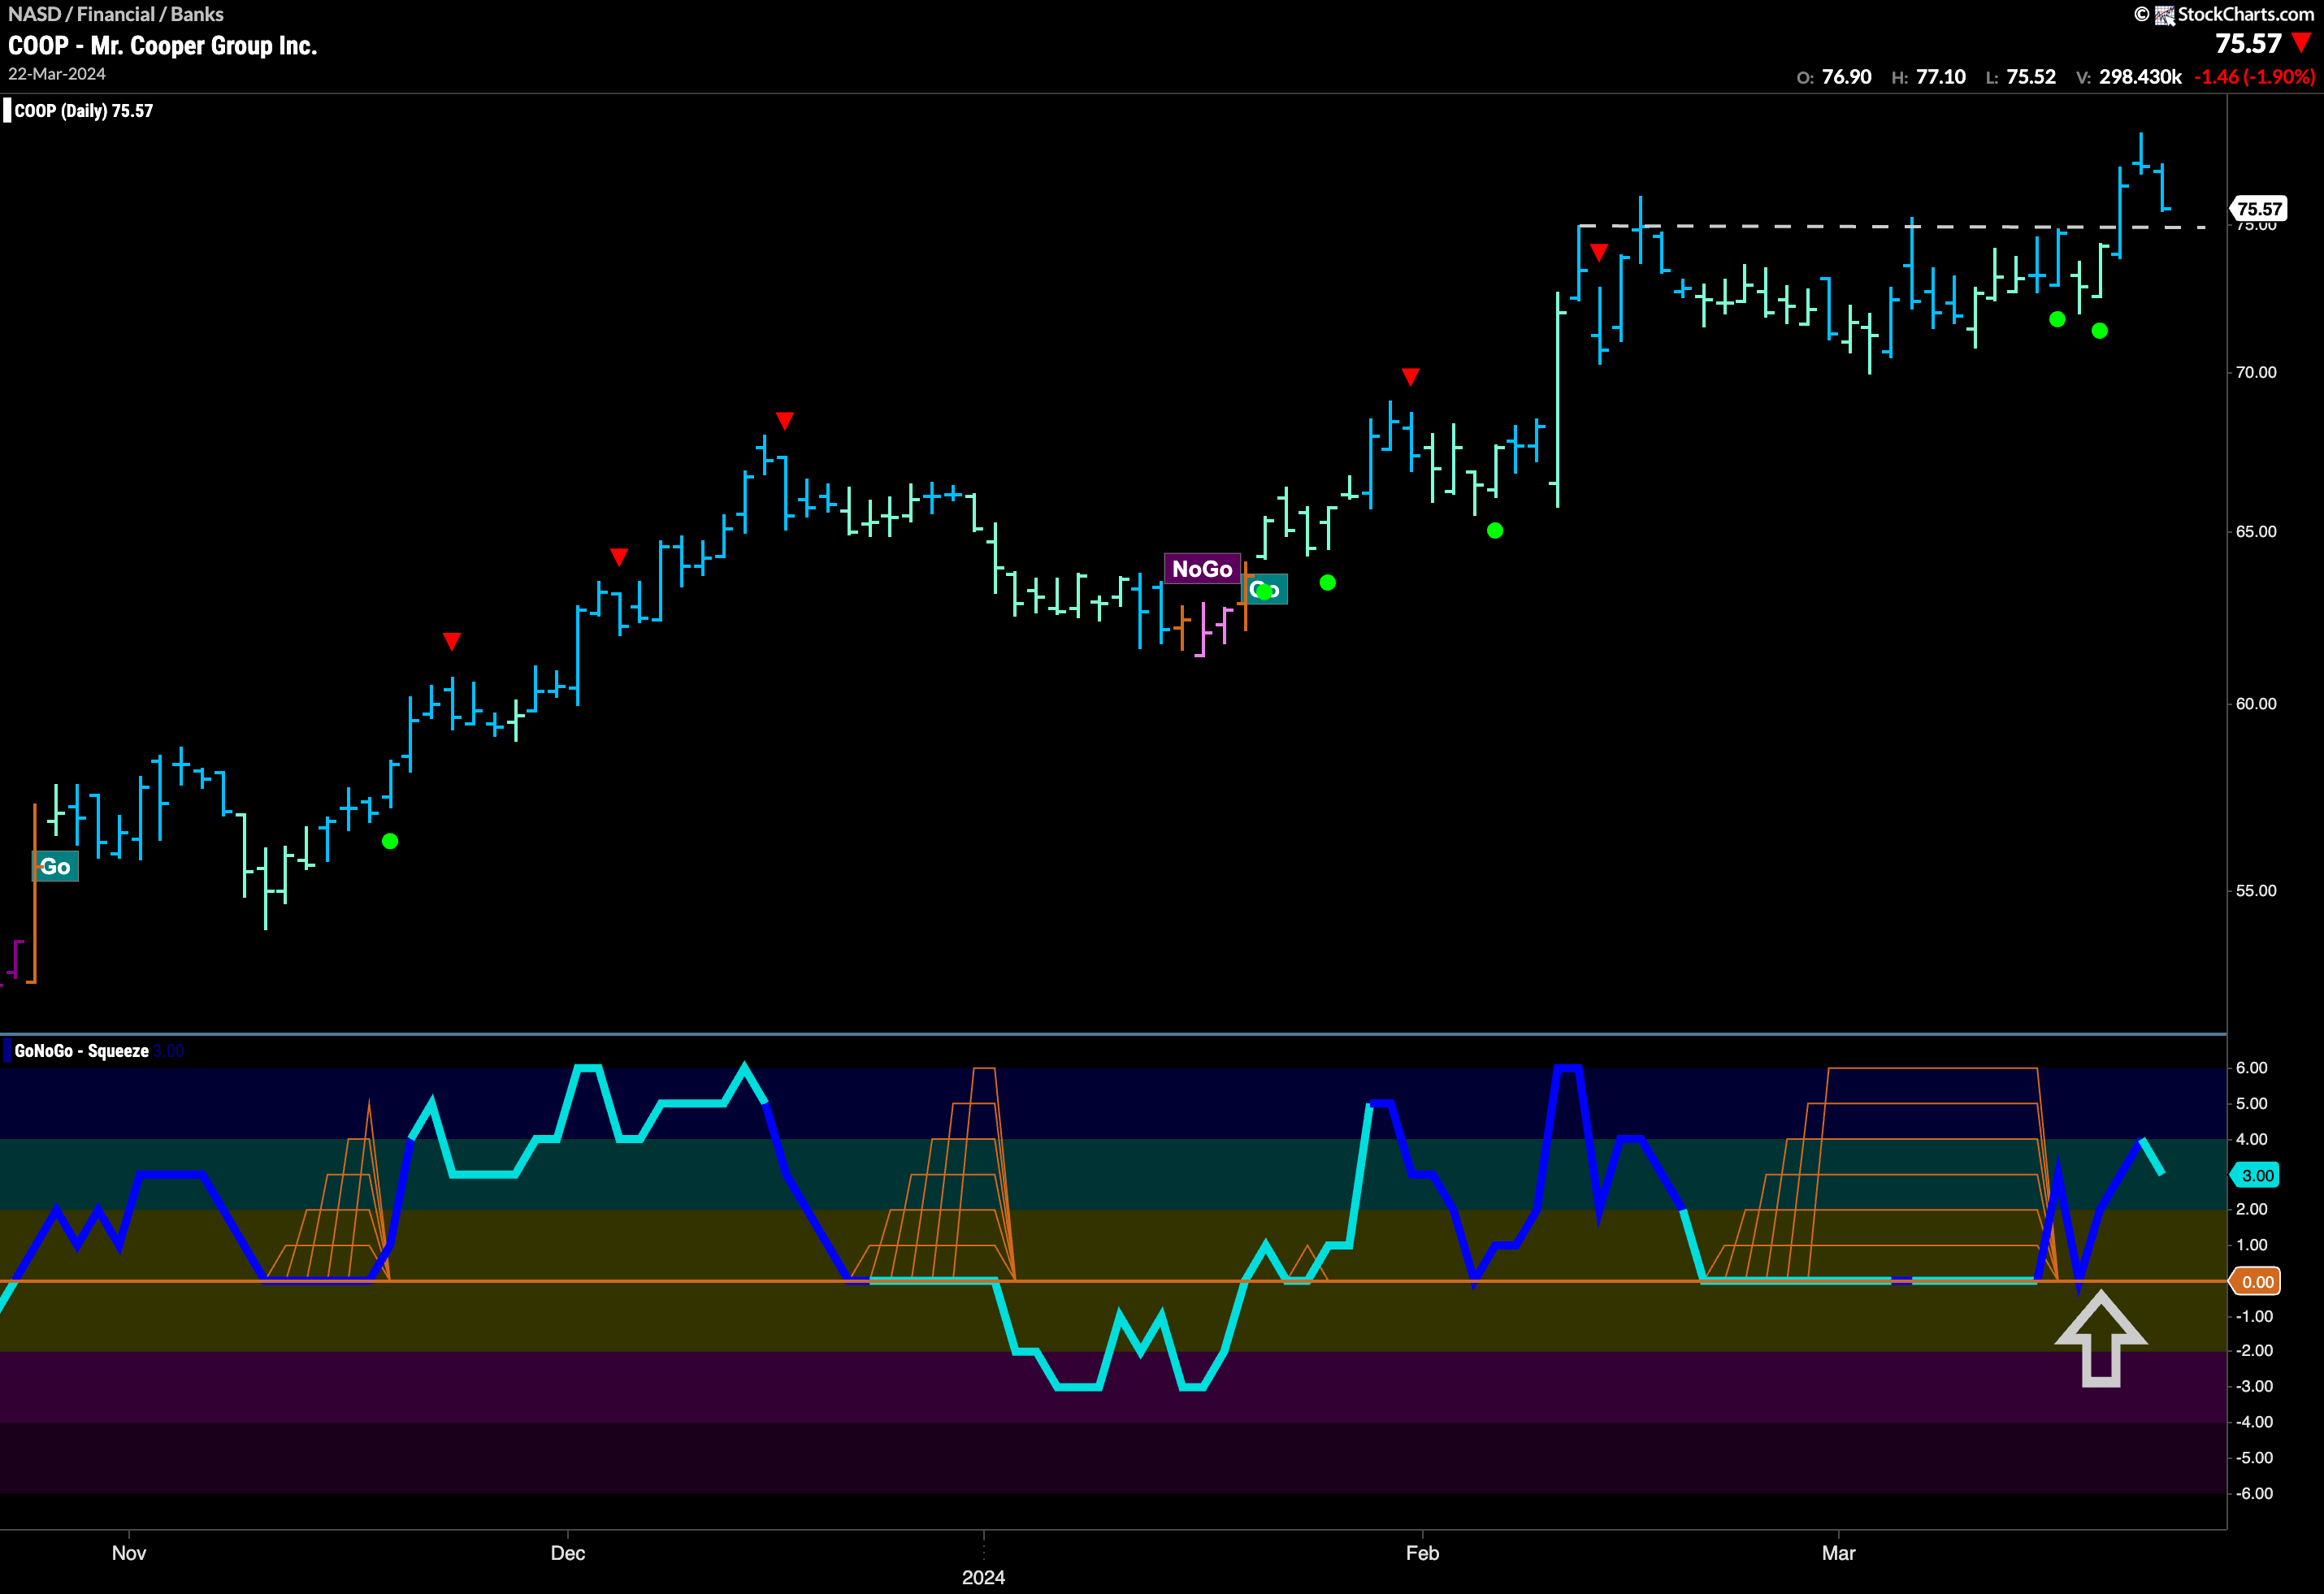
Mr Cooper Sets New Highs
The chart below of $COOP shows that the “Go” trend is likely to continue. As price consolidated sideways for several weeks we saw GoNoGo Trend paint a lot of weaker aqua “Go” bars. During this time, GoNoGo Oscillator fell to the zero line where it got stuck, riding the zero line for an extended period of time. This allowed the climbing grid of GoNoGo Squeeze to hit its Max. Finally, GoNoGo Oscillator broke out of the extended Max GoNoGo Squeeze into positive territory on heavy volume. This resurgent momentum in the direction of the “Go” trend triggered Go Trend Continuation Icons (green circles) and gave price the push it needed to break above resistance. We will look for price to move higher from here.
$WFC Looks for Support in “Go” Trend
GoNoGo Trend shows that the “Go” trend remains in place for $WFC. After a strong run of blue “Go” bars that saw momentum stay overbought for a significant period of time, we saw a Go Countertrend Correction Icon (red arrow) that indicated price may struggle to go higher in the short term. GoNoGo Trend painted a string of weaker aqua bars as price started to consolidate sideways. With GoNoGo Oscillator back at the zero line, we will look to see if it finds support here. GoNoGo Trend is back painting strong blue “Go” bars so if the oscillator can rally into positive territory we will expect price to make an attempt at a new higher high.


