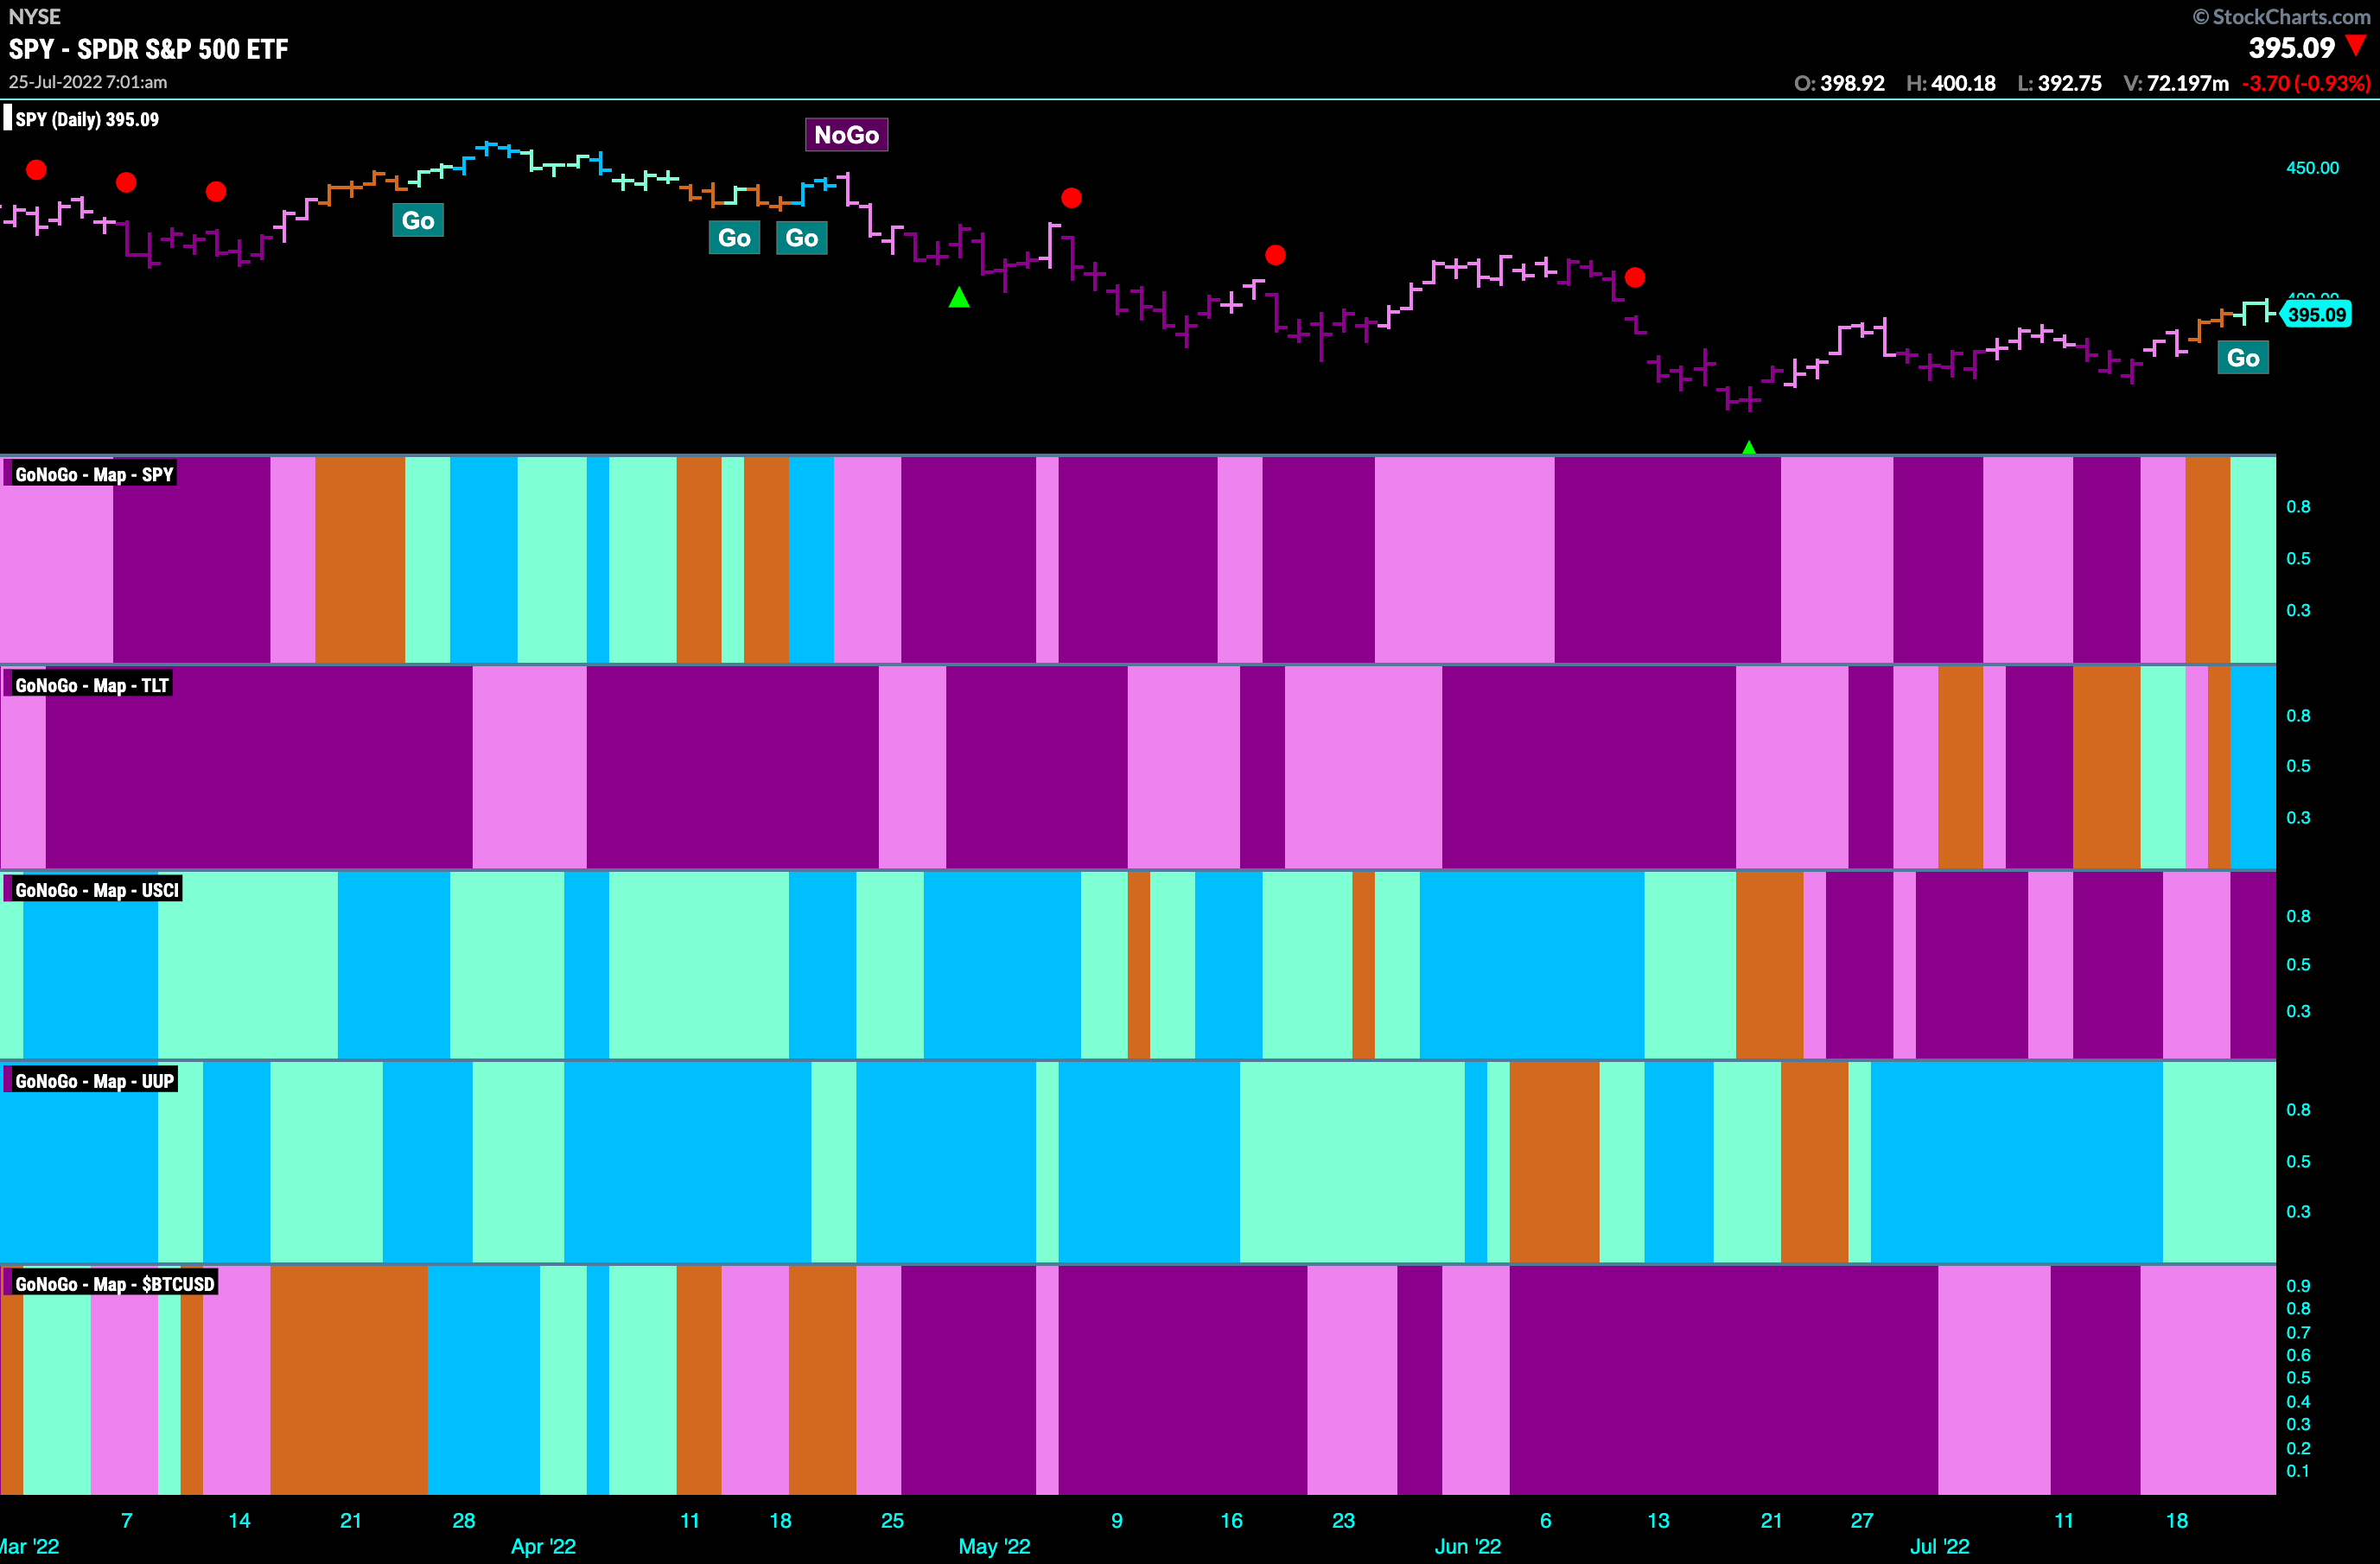
Good morning and welcome to this week’s Flight Path. Let’s take a look at the GoNoGo Asset map below. Is this the beginning of a rotation into risky assets? We certainly are seeing some change in the macro make up this week. Equities in the top panel were able to finish the week painting aqua “Go” bars. Treasury bonds also finished the week in “Go” bars as did the dollar. The dollar has come off a high and is painting weaker aqua “Go” bars as it looks for support. Commodities are still a strong “NoGo” on a daily basis this week.
Sector RelMap
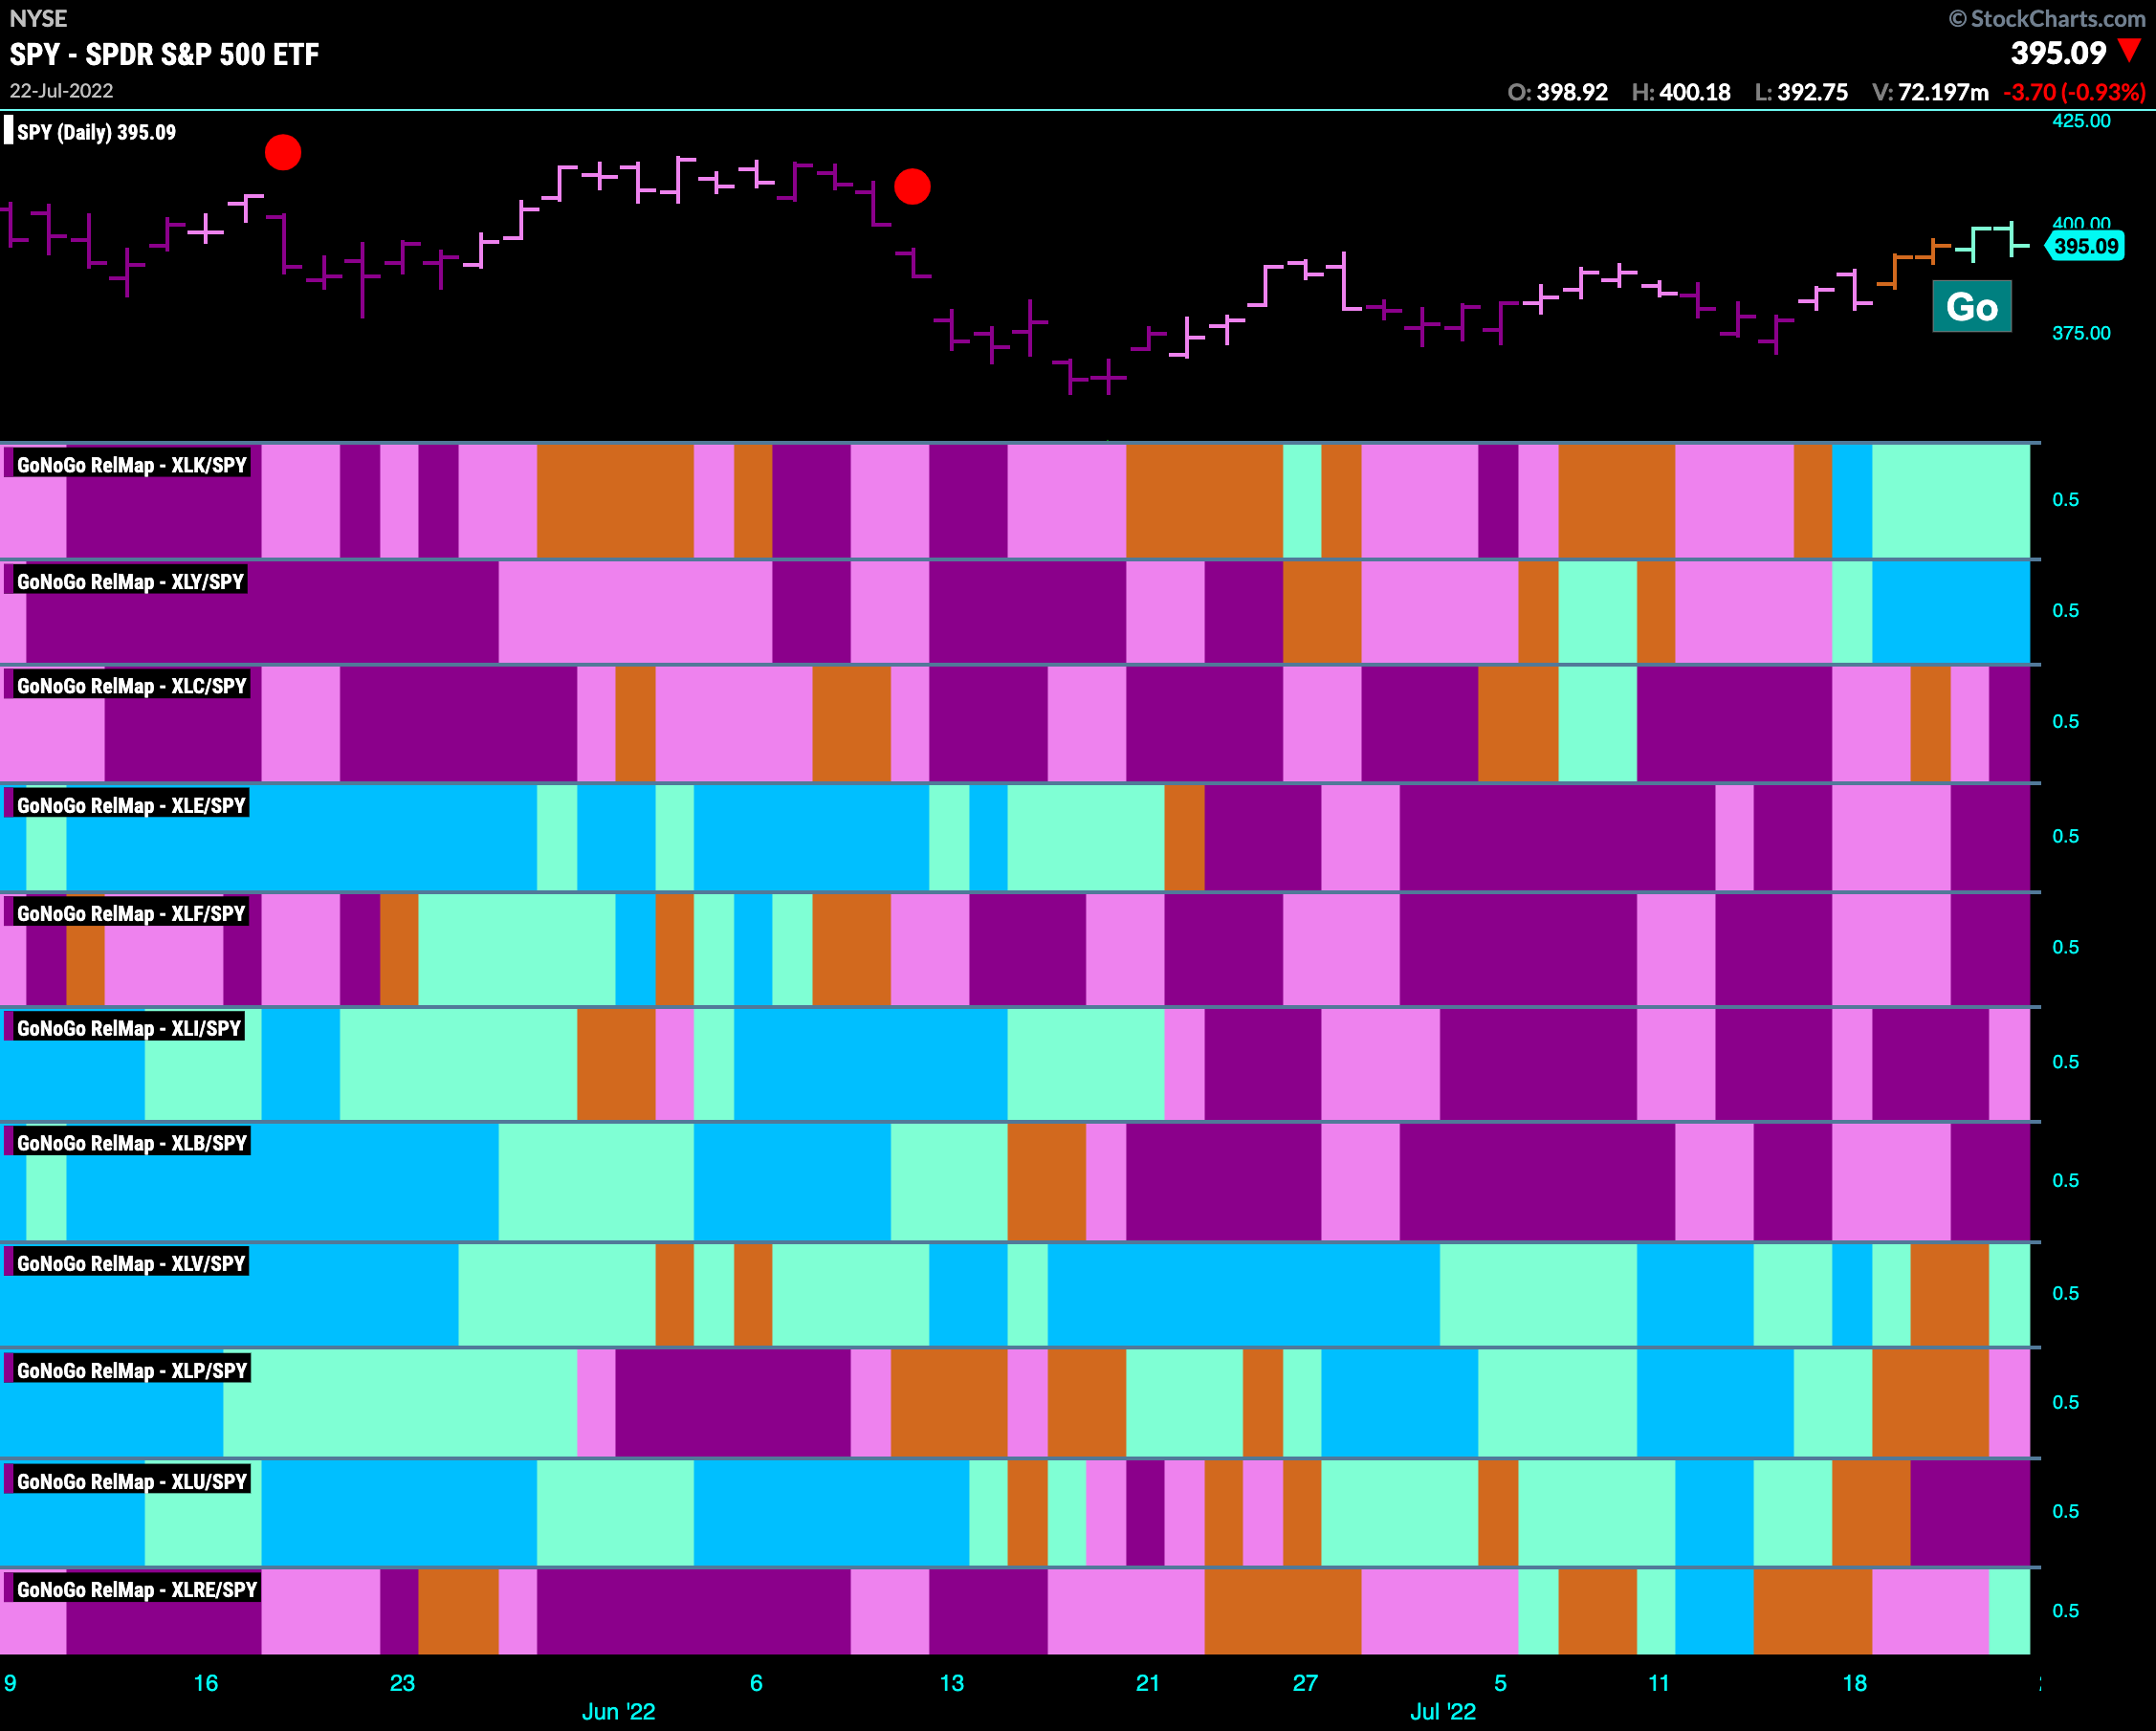
Below is the GoNoGo Sector Relmap. This GoNoGo Relmap applies the GoNoGo Trend to the relative strength ratios of the sectors to the base index. Looking at this map, we can quickly see where the relative outperformance is coming from as well as which sectors are lagging on a relative basis. The GoNoGo RelMap this week shows the rotation into risky growth assets on a sector basis. Technology and discretionary are in “Go” trends marking a change in investor risk appetites.
Rates Roll Lower
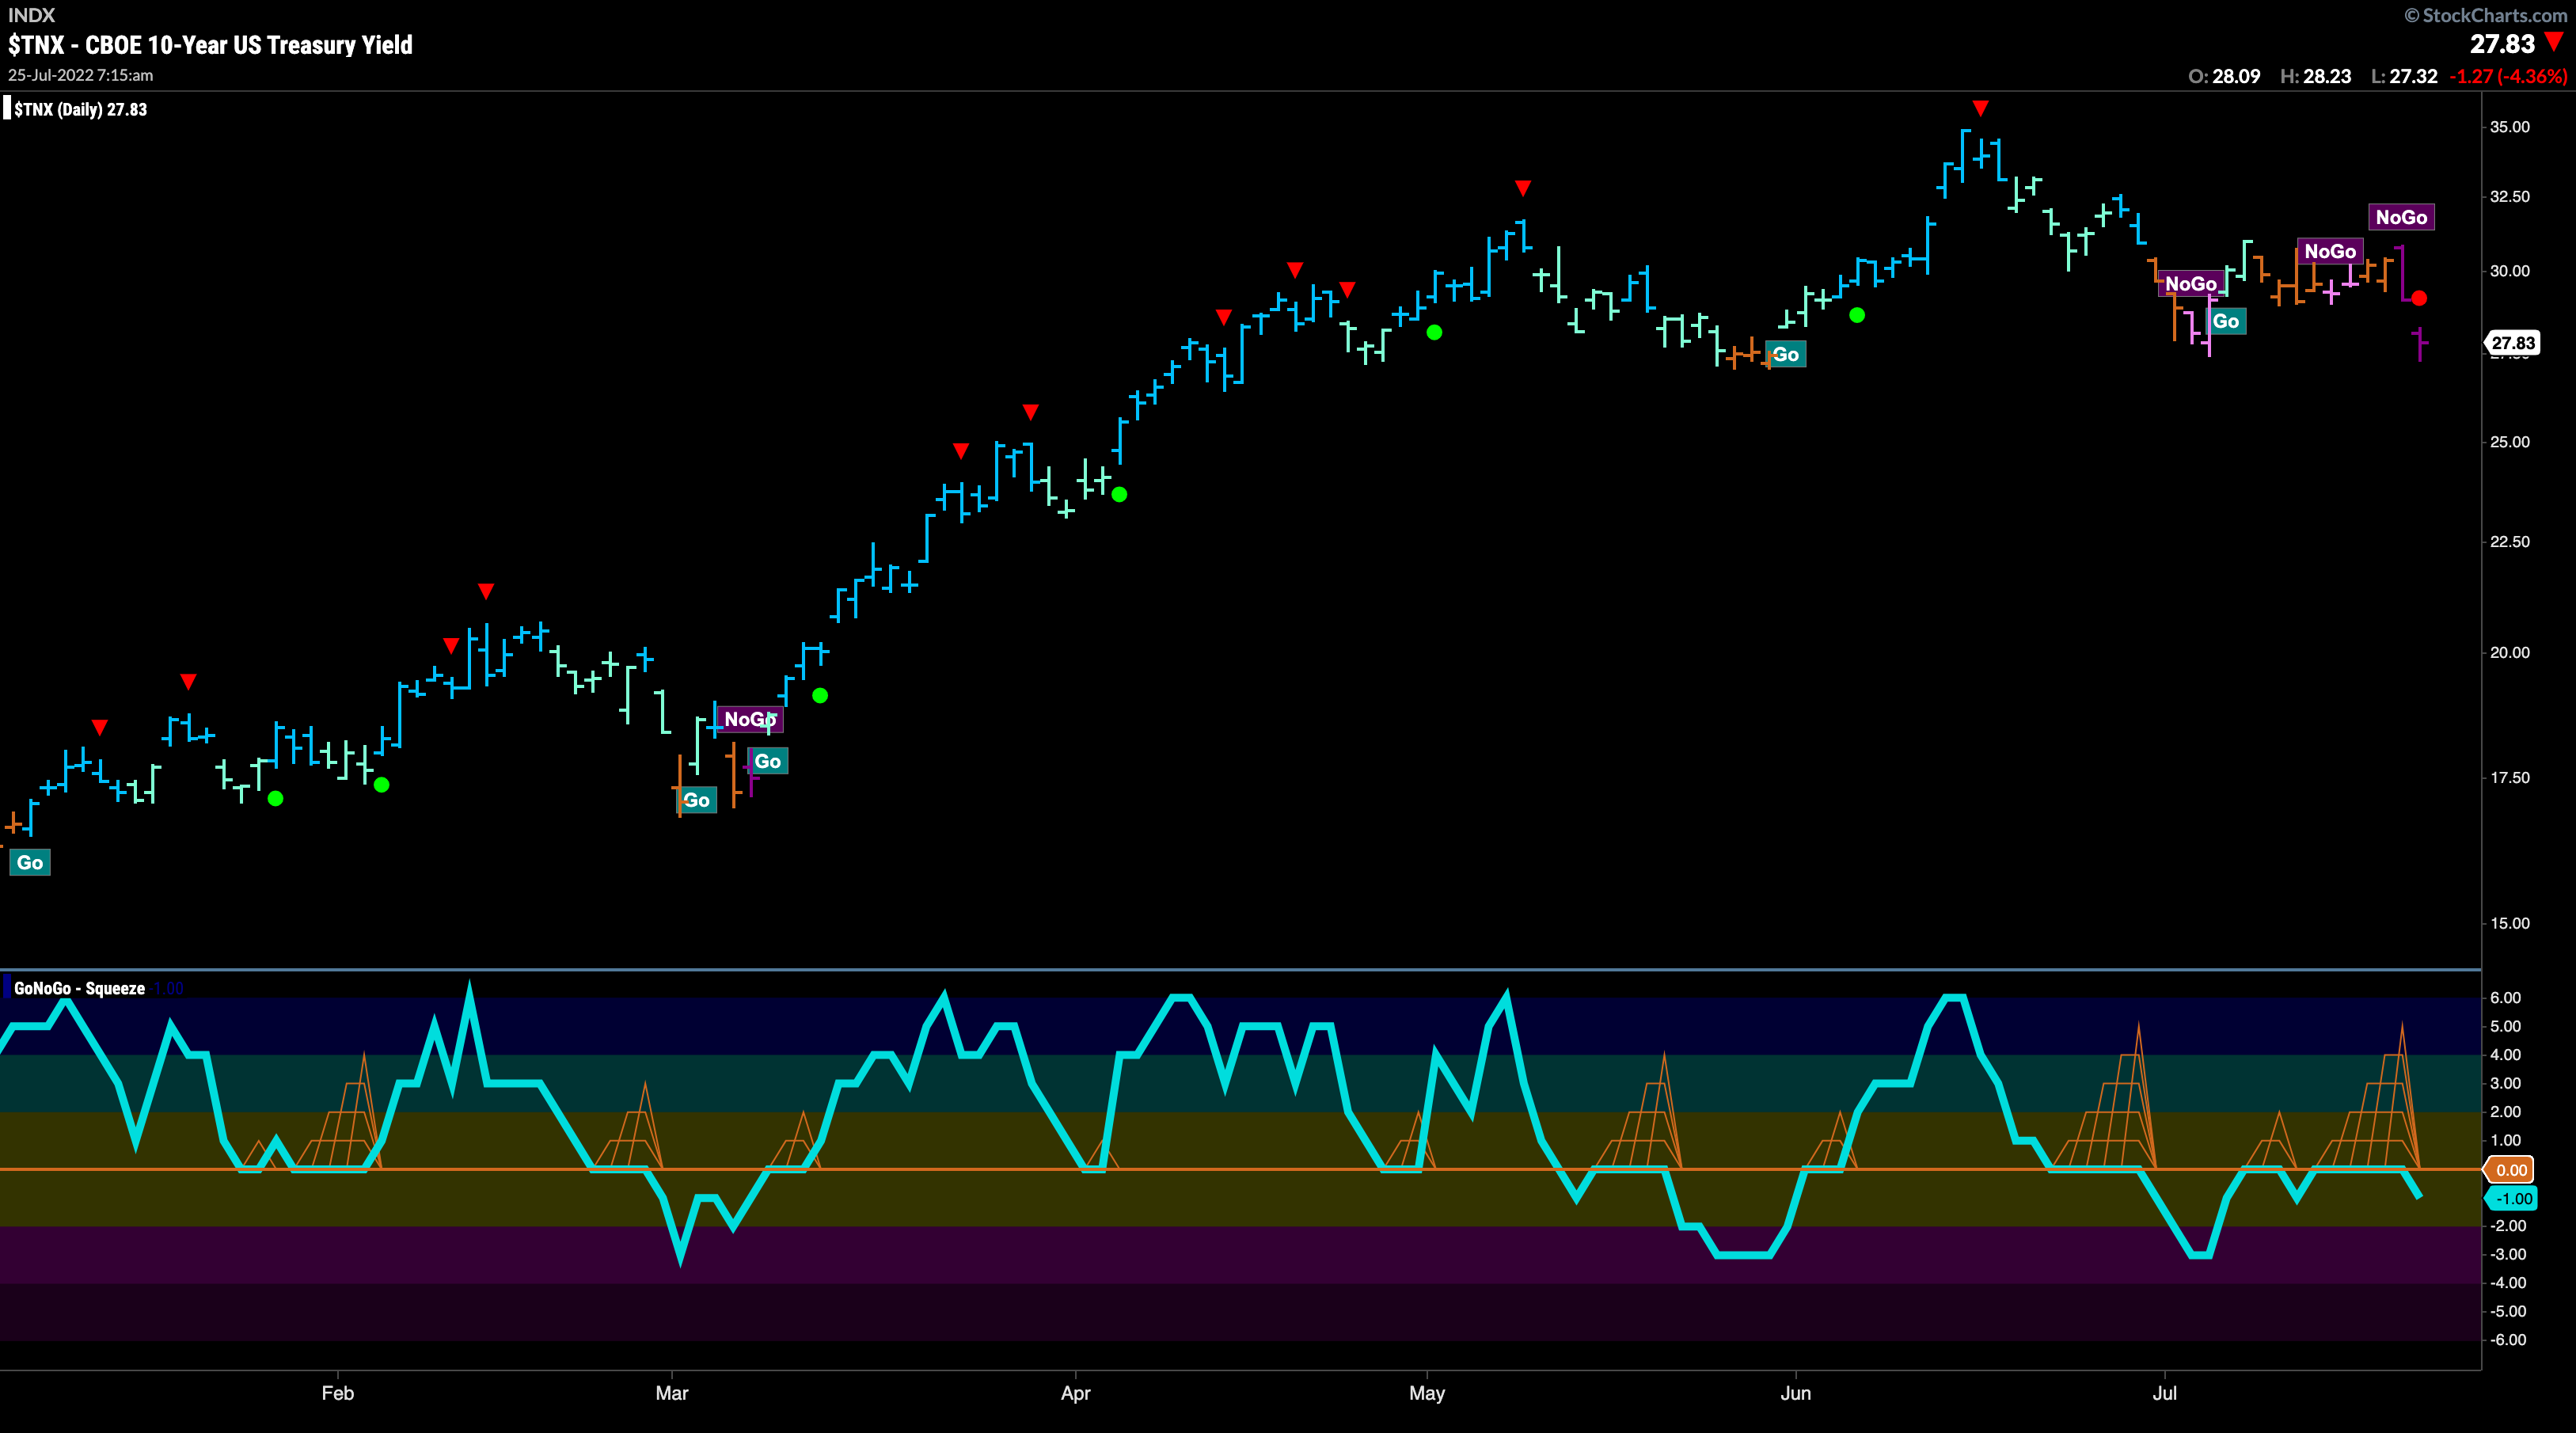
We noted recently how rates have corrected enough to push the GoNoGo Oscillator into negative territory. This week the oscillator has been testing the zero line from below as a GoNoGo Squeeze has built. On the last day of the week we saw the oscillator fall into negative territory, indicating that momentum has returned in the direction of the “NoGo”. All this in the face of a Fed meeting this week where analysts mostly agree we will see another 75 point hike. We will watch the charts to see what impact that has this week.
Oil at Inflection Point
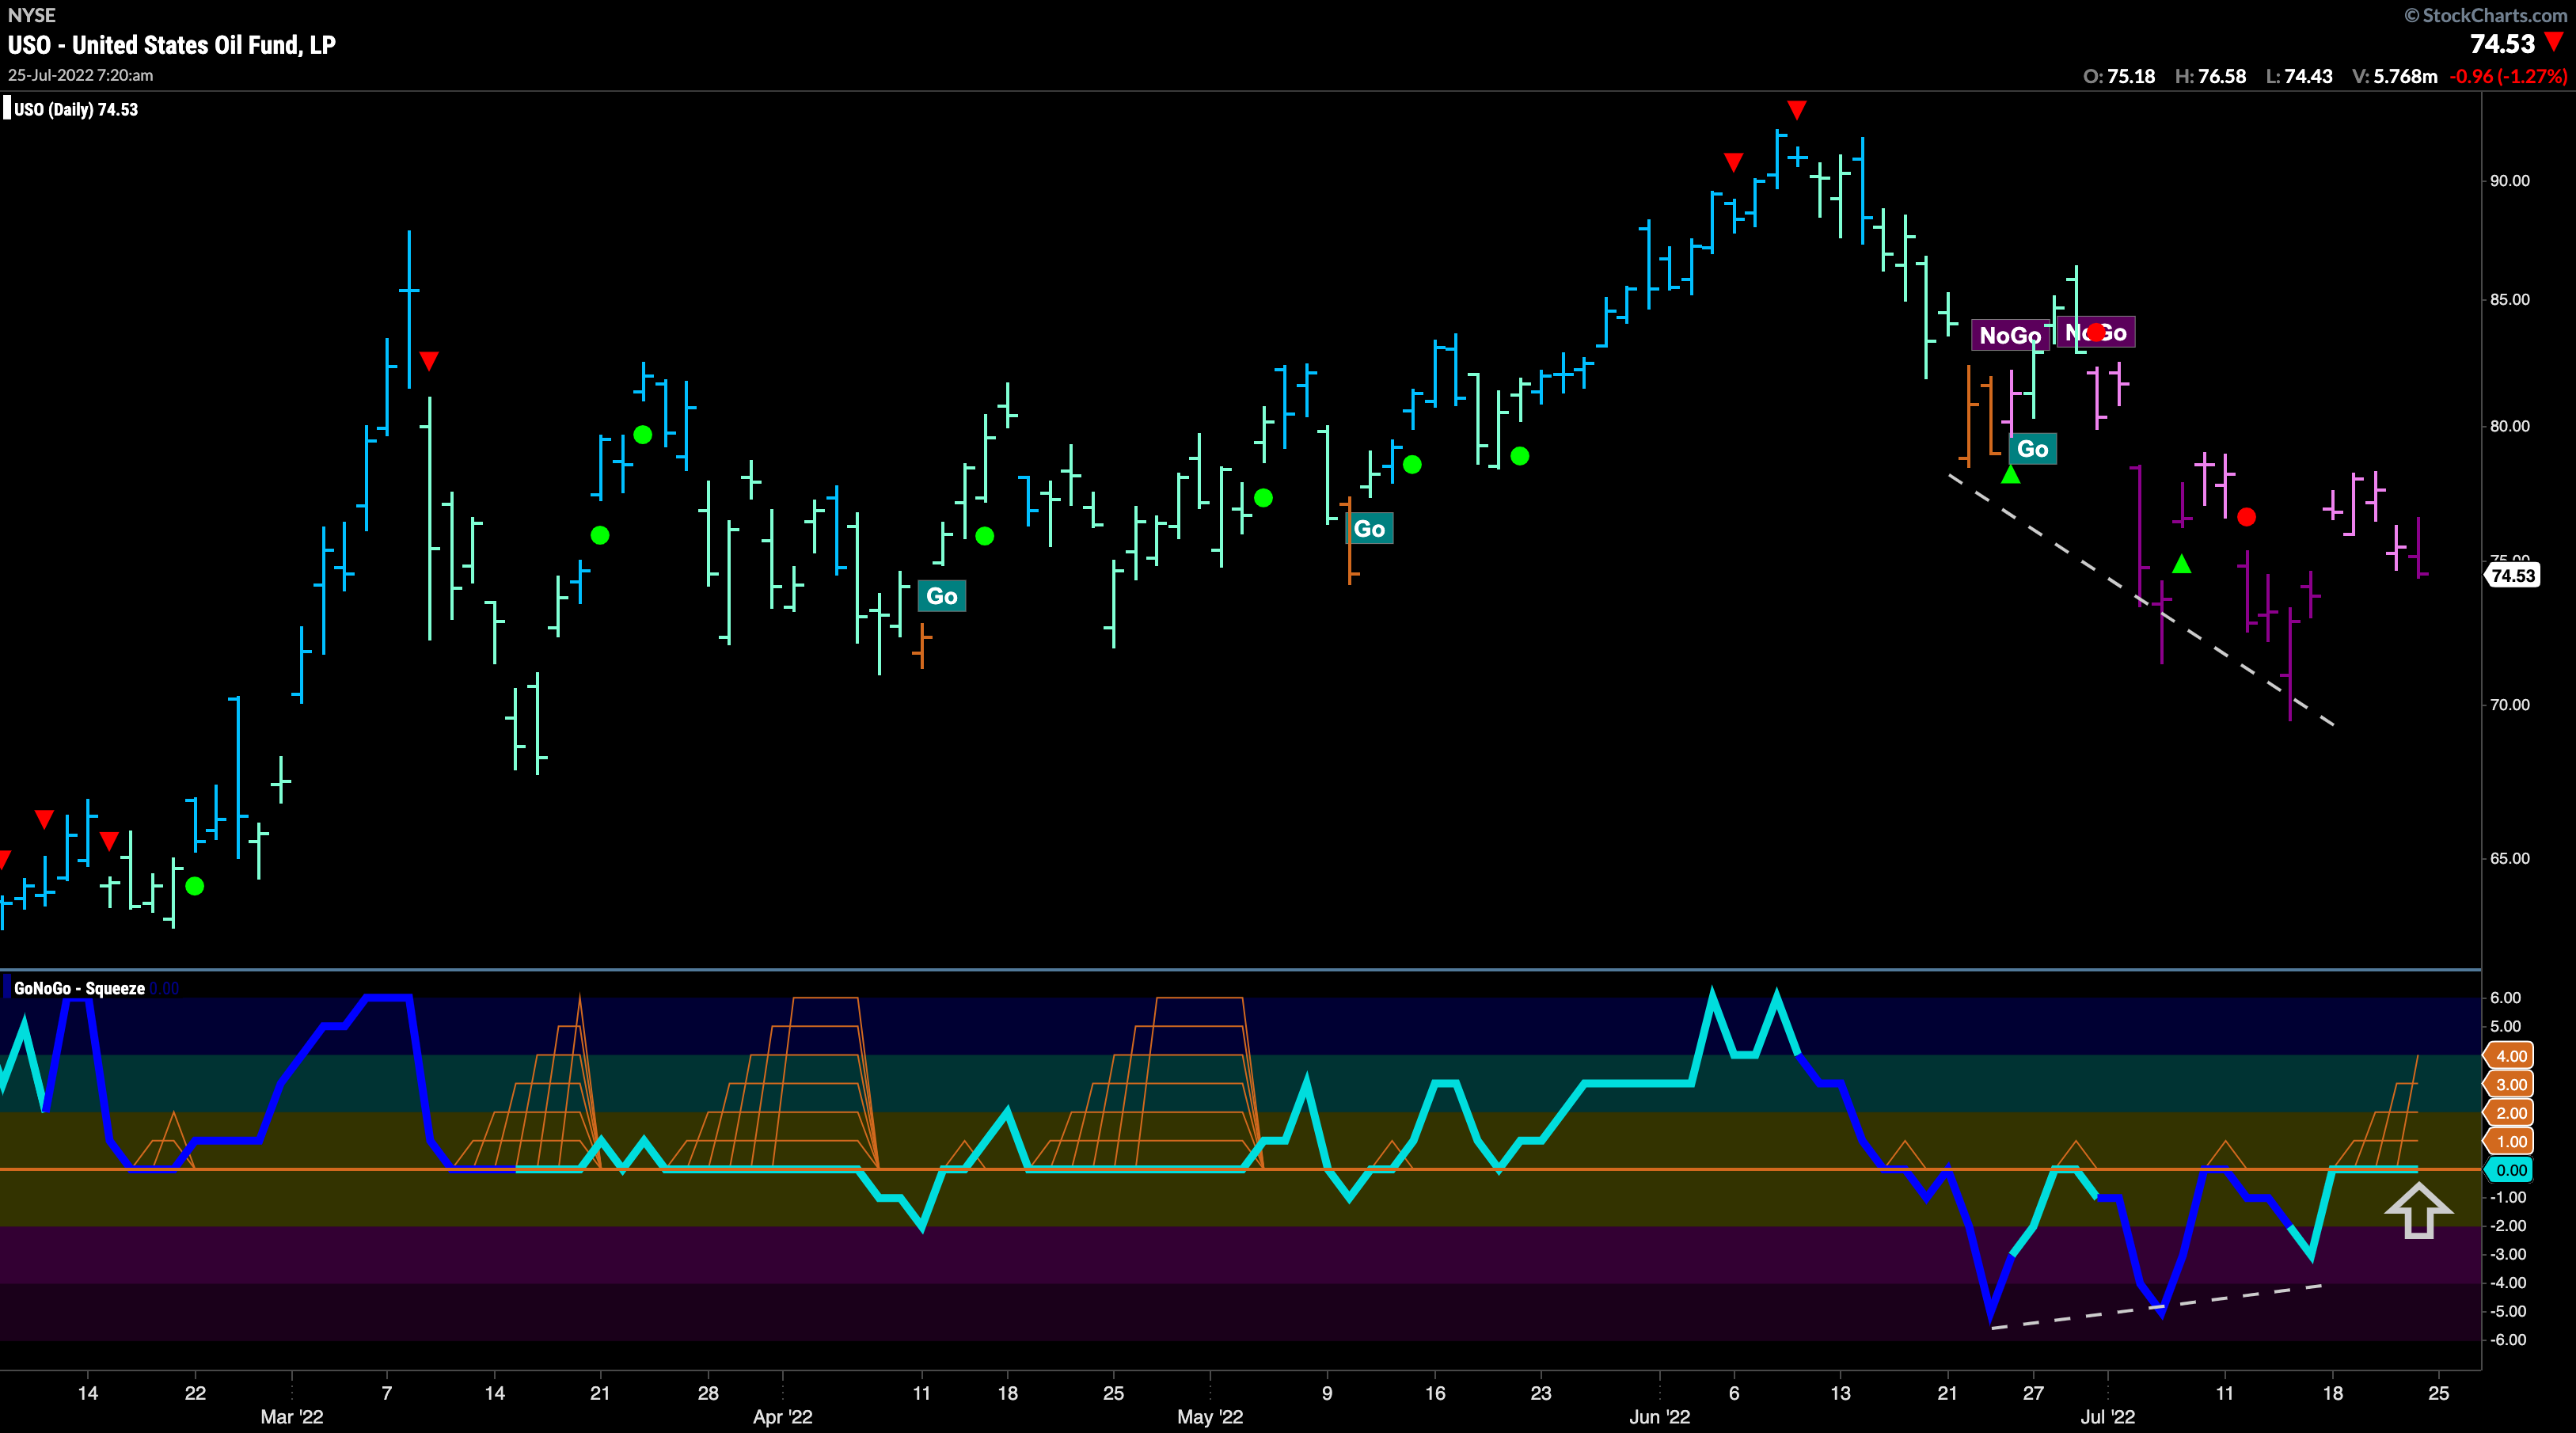
The GoNoGo Chart below shows that there is bullish divergence between the price trend and GoNoGo Oscillator. As price has made lower lows GoNoGo Oscillator has made higher lows and is now testing the zero line from below as a GoNoGo Squeeze builds. We will watch to see if this level holds as resistance or if the oscillator can break back above zero which would be a positive sign for oil.
Dollar Testing Support
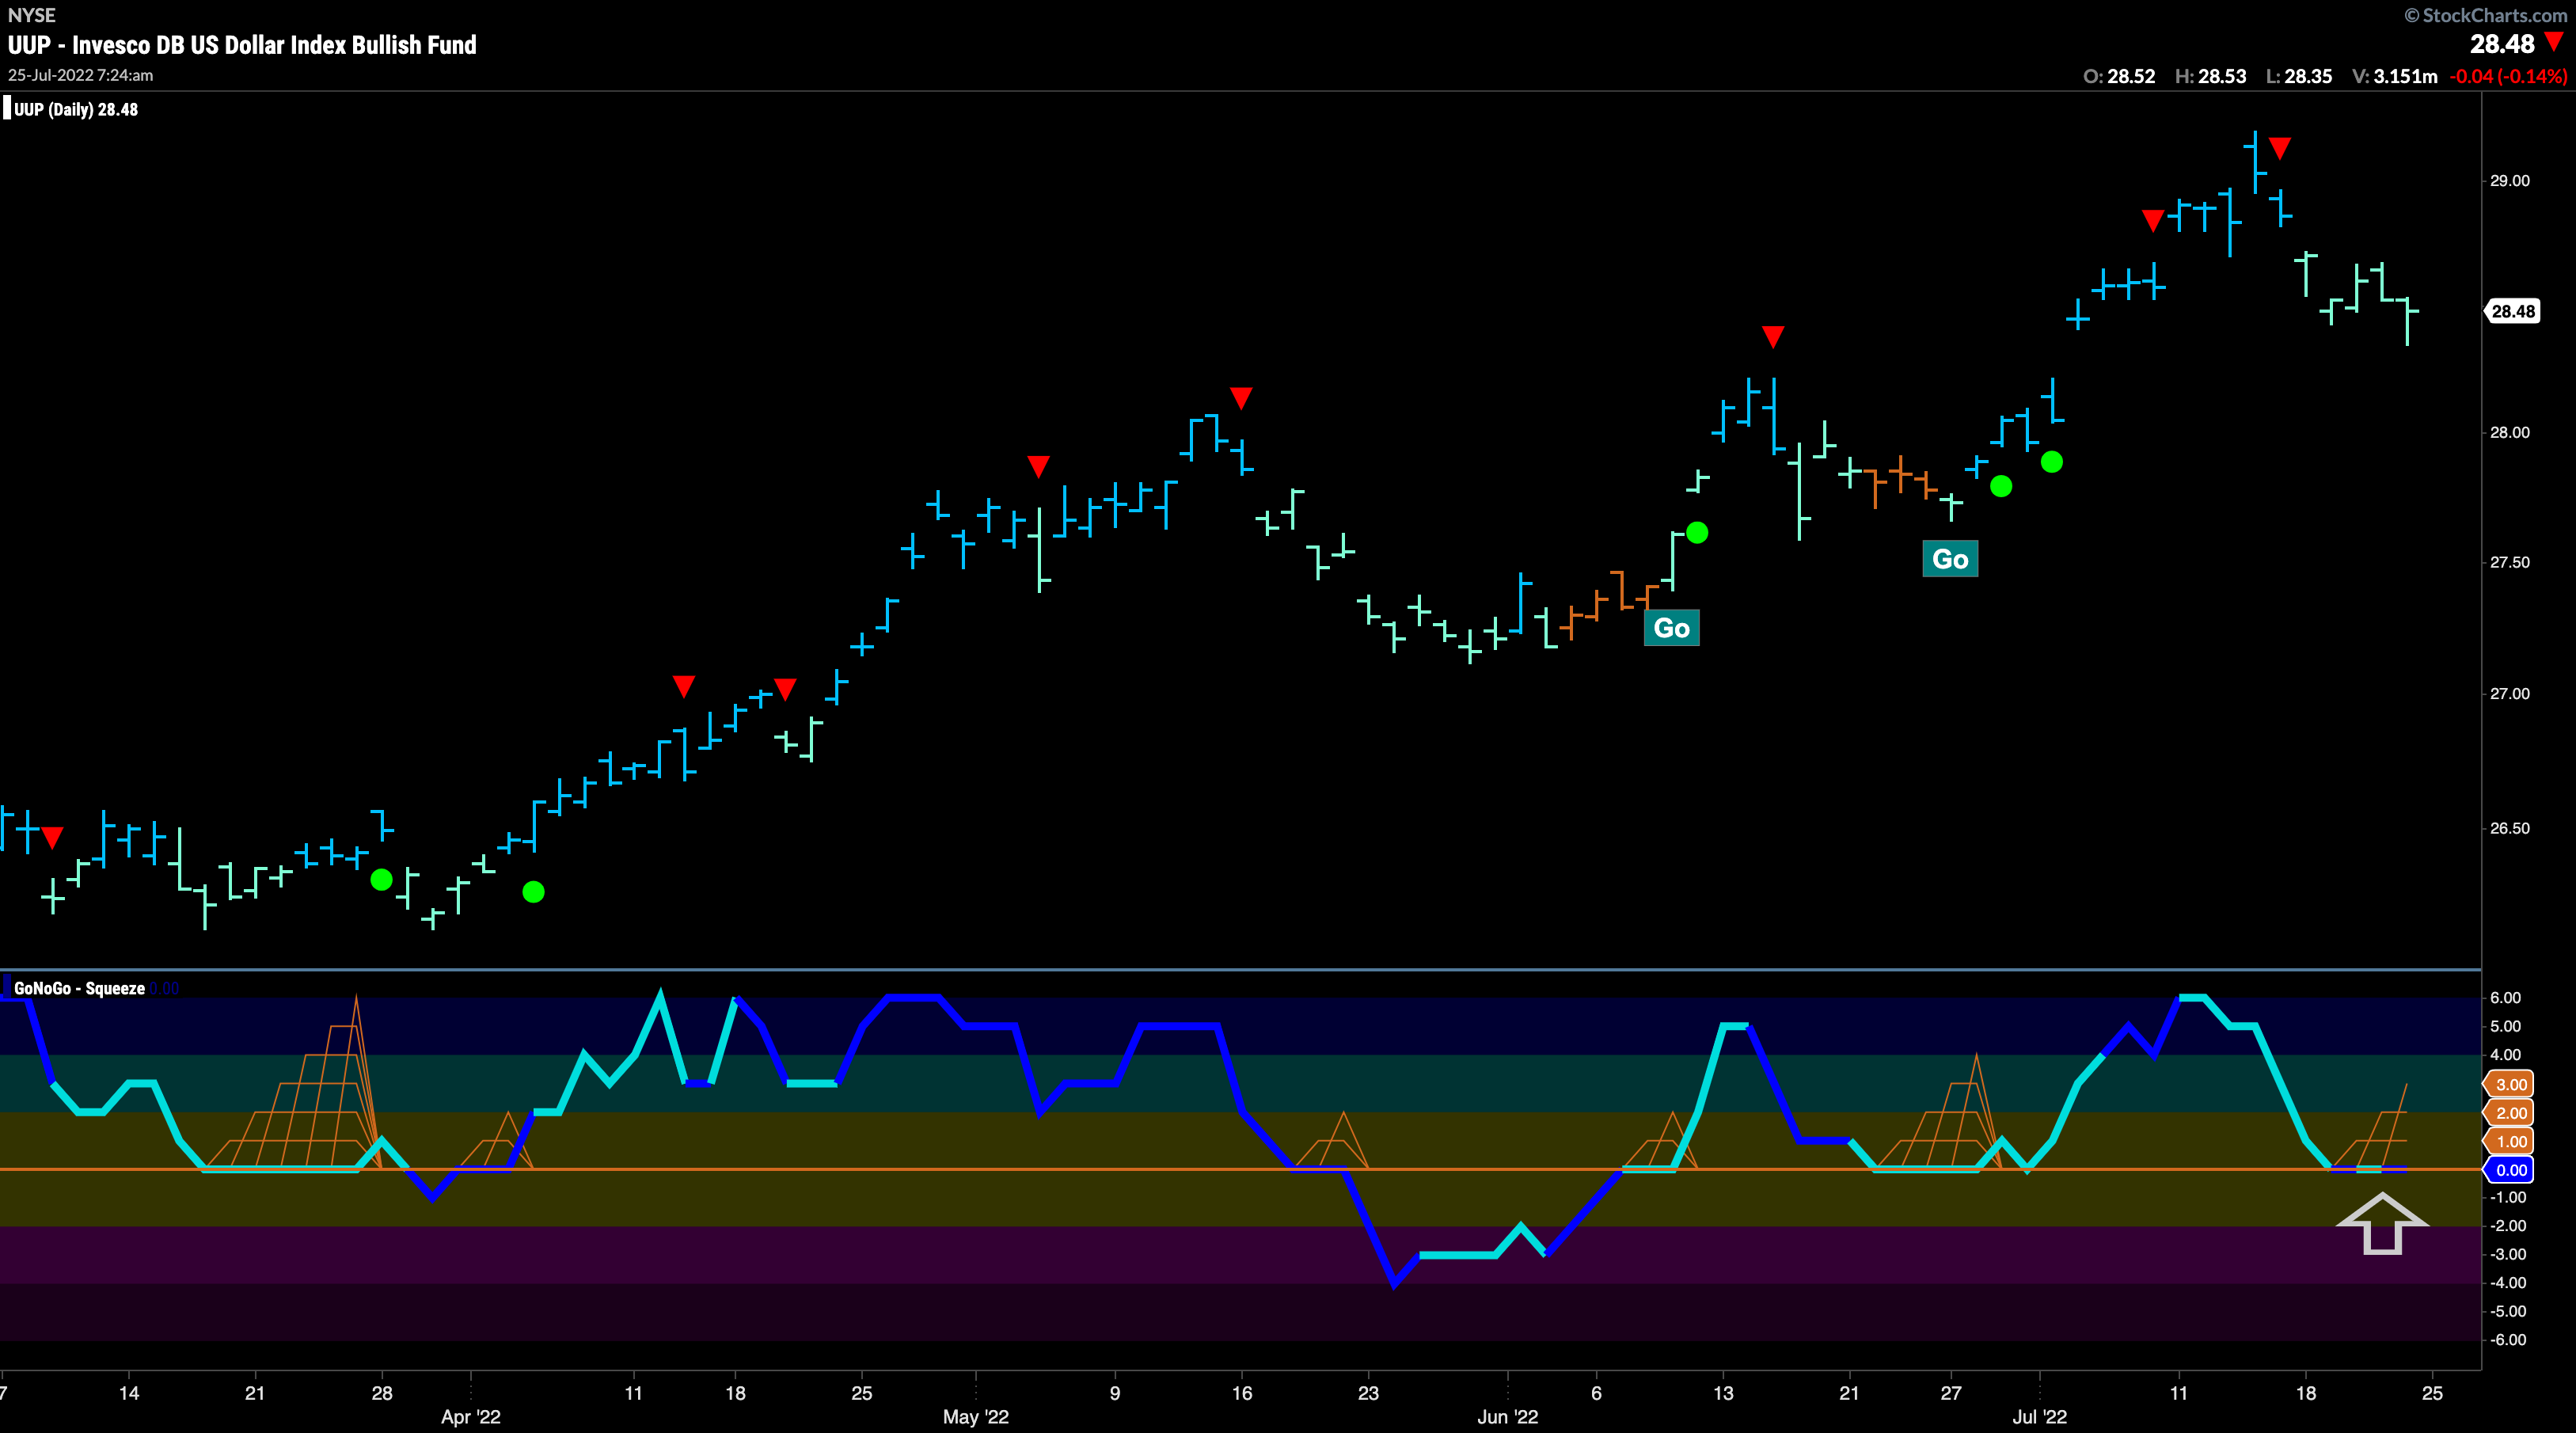
The “Go” trend in the dollar has been one of the most durable trends of the year. Now, as price falls from a high (suggested by the Go Countertrend Correction red arrow), we see weaker aqua bars and GoNoGo Oscillator is testing the zero line from above. We will watch to see if the oscillator rallies off the zero line and therefore this will prove to be a buy the dip moment or if it is the start of something more destructive should the oscillator fall into negative territory. Until that happens, the weight of the evidence tells us the trend is still in place.
Dollar Very Strong Against the Yen
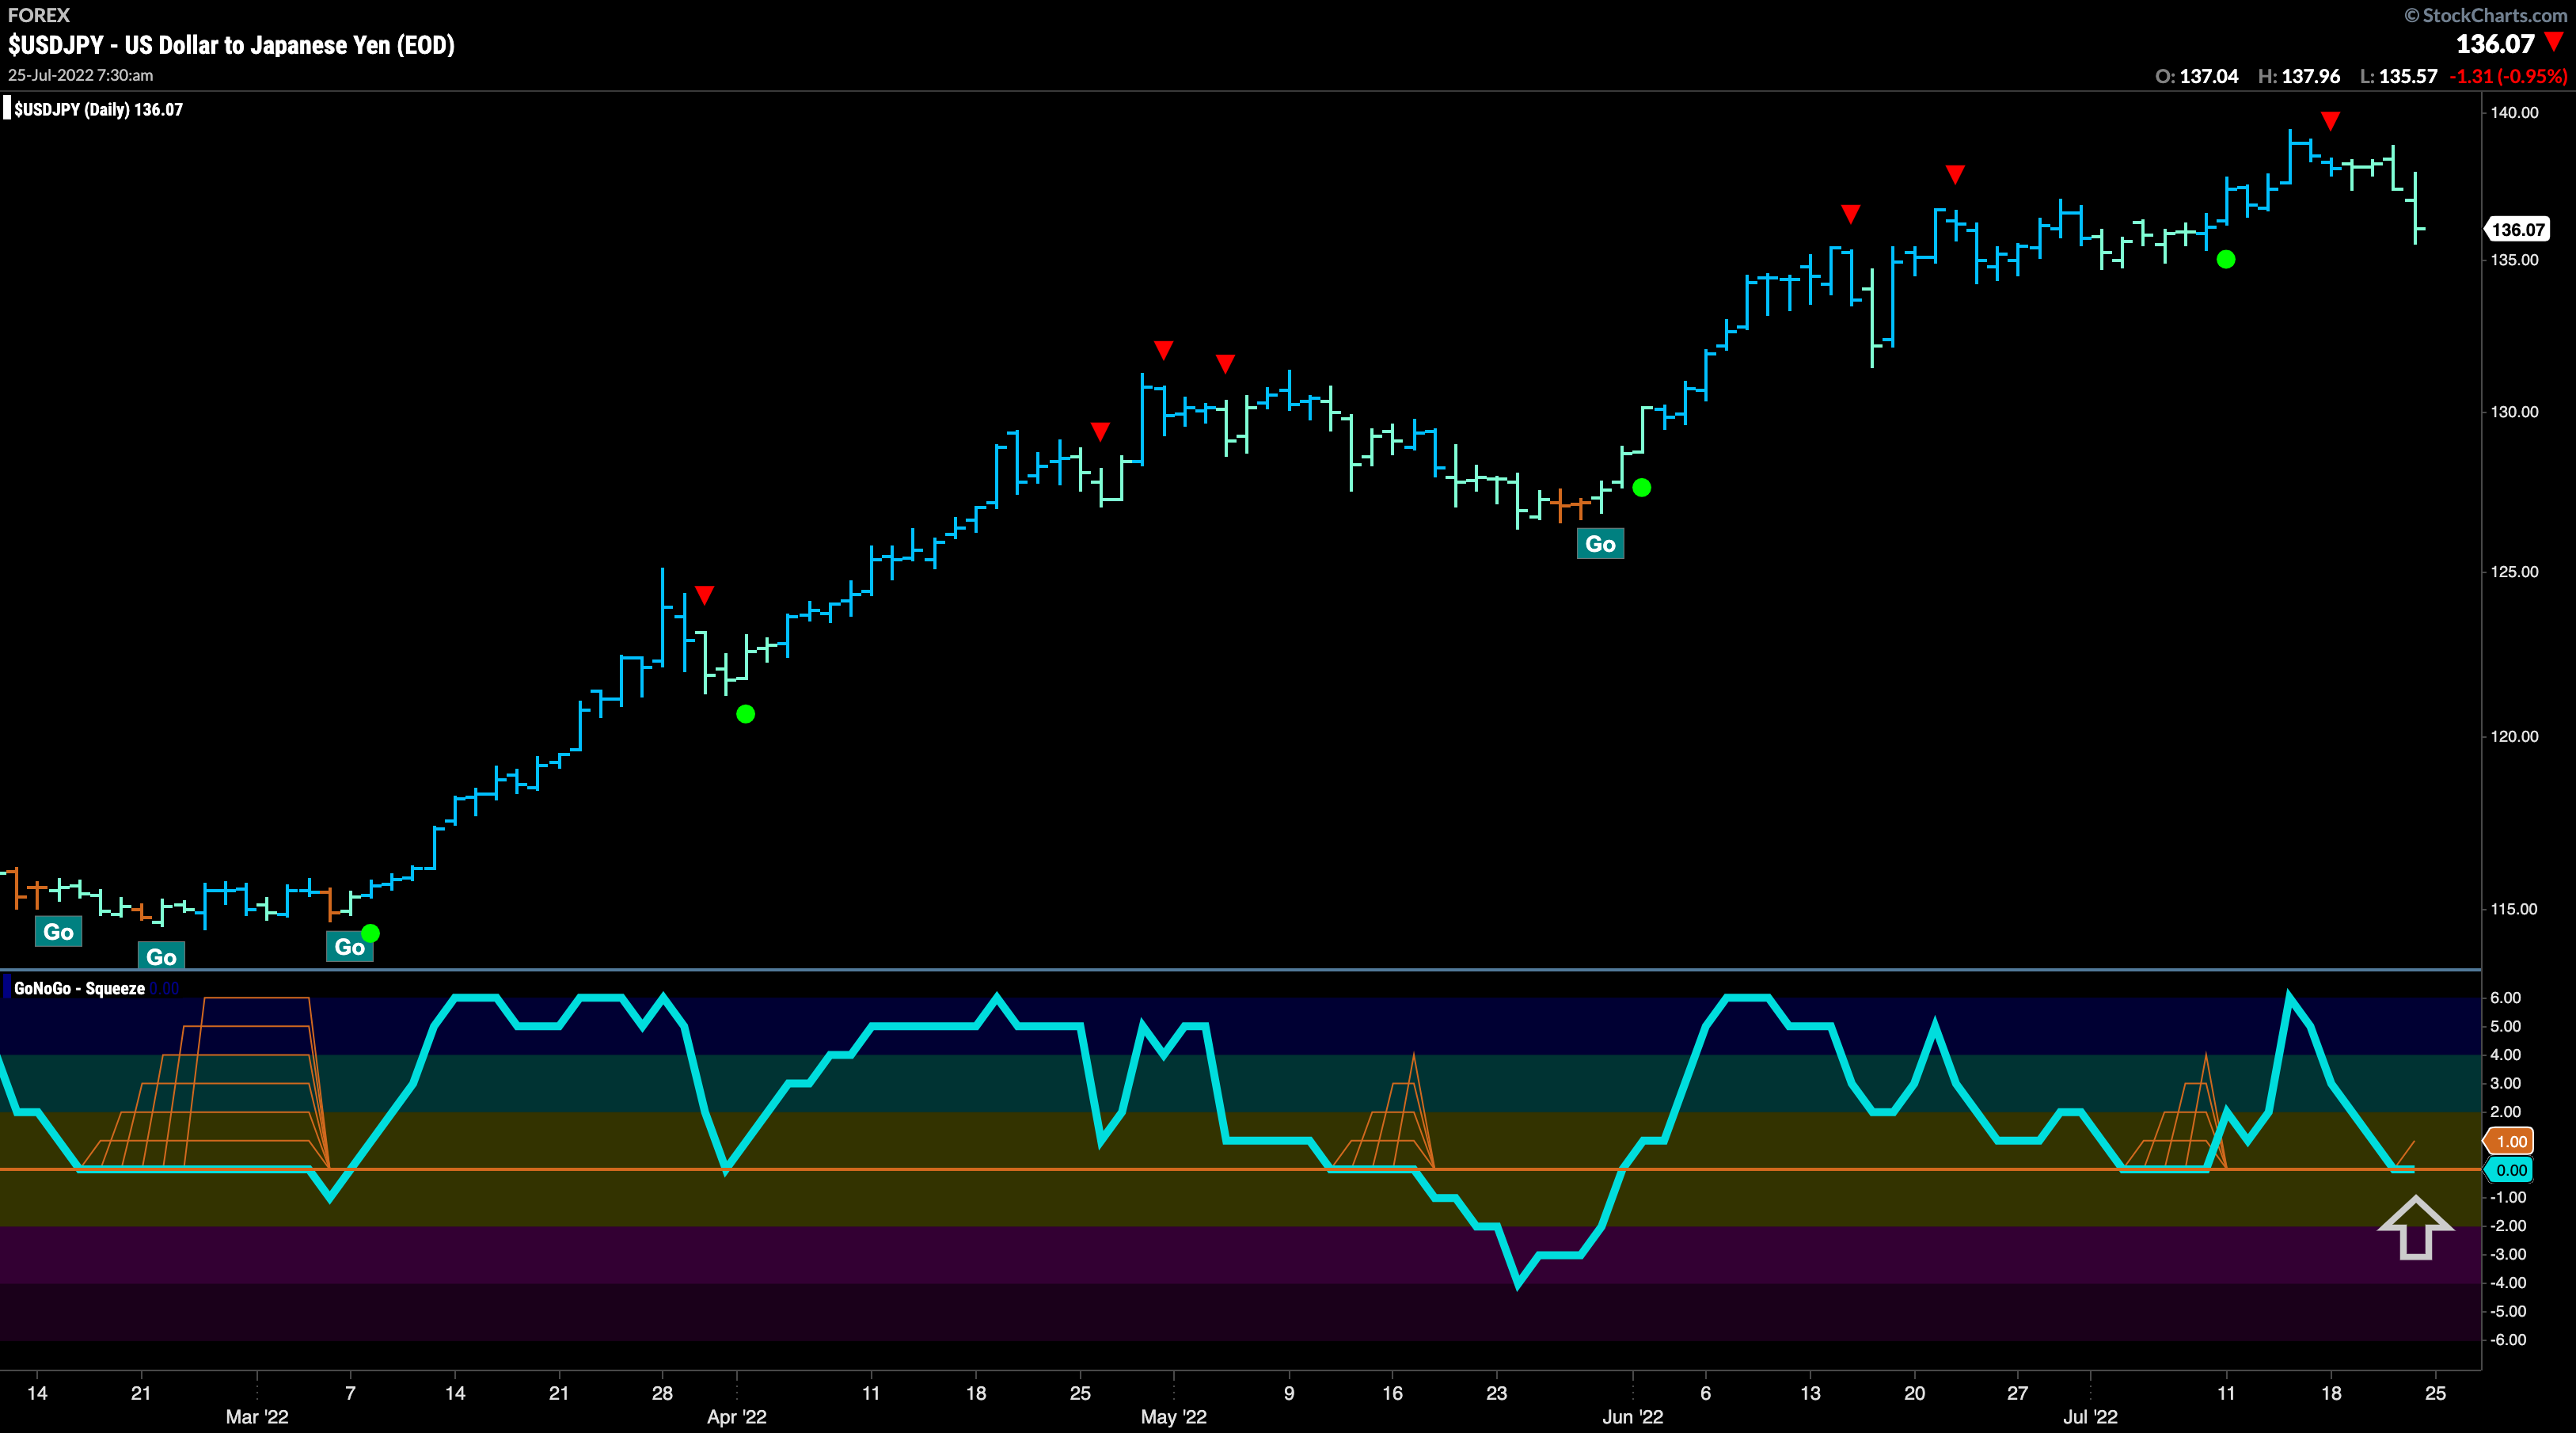
The dollar has been strong overall, but against the Yen it has really shone. The GoNoGo Chart below shows daily prices of this pair and we can see how formidable the “Go” trend has been since the “Go”s in March. Now, as price consolidates a little, GoNoGo Oscillator is testing the zero line from above. We will look for support here if the trend is to continue.
Dollar/Yen Strength on Larger Timeframe
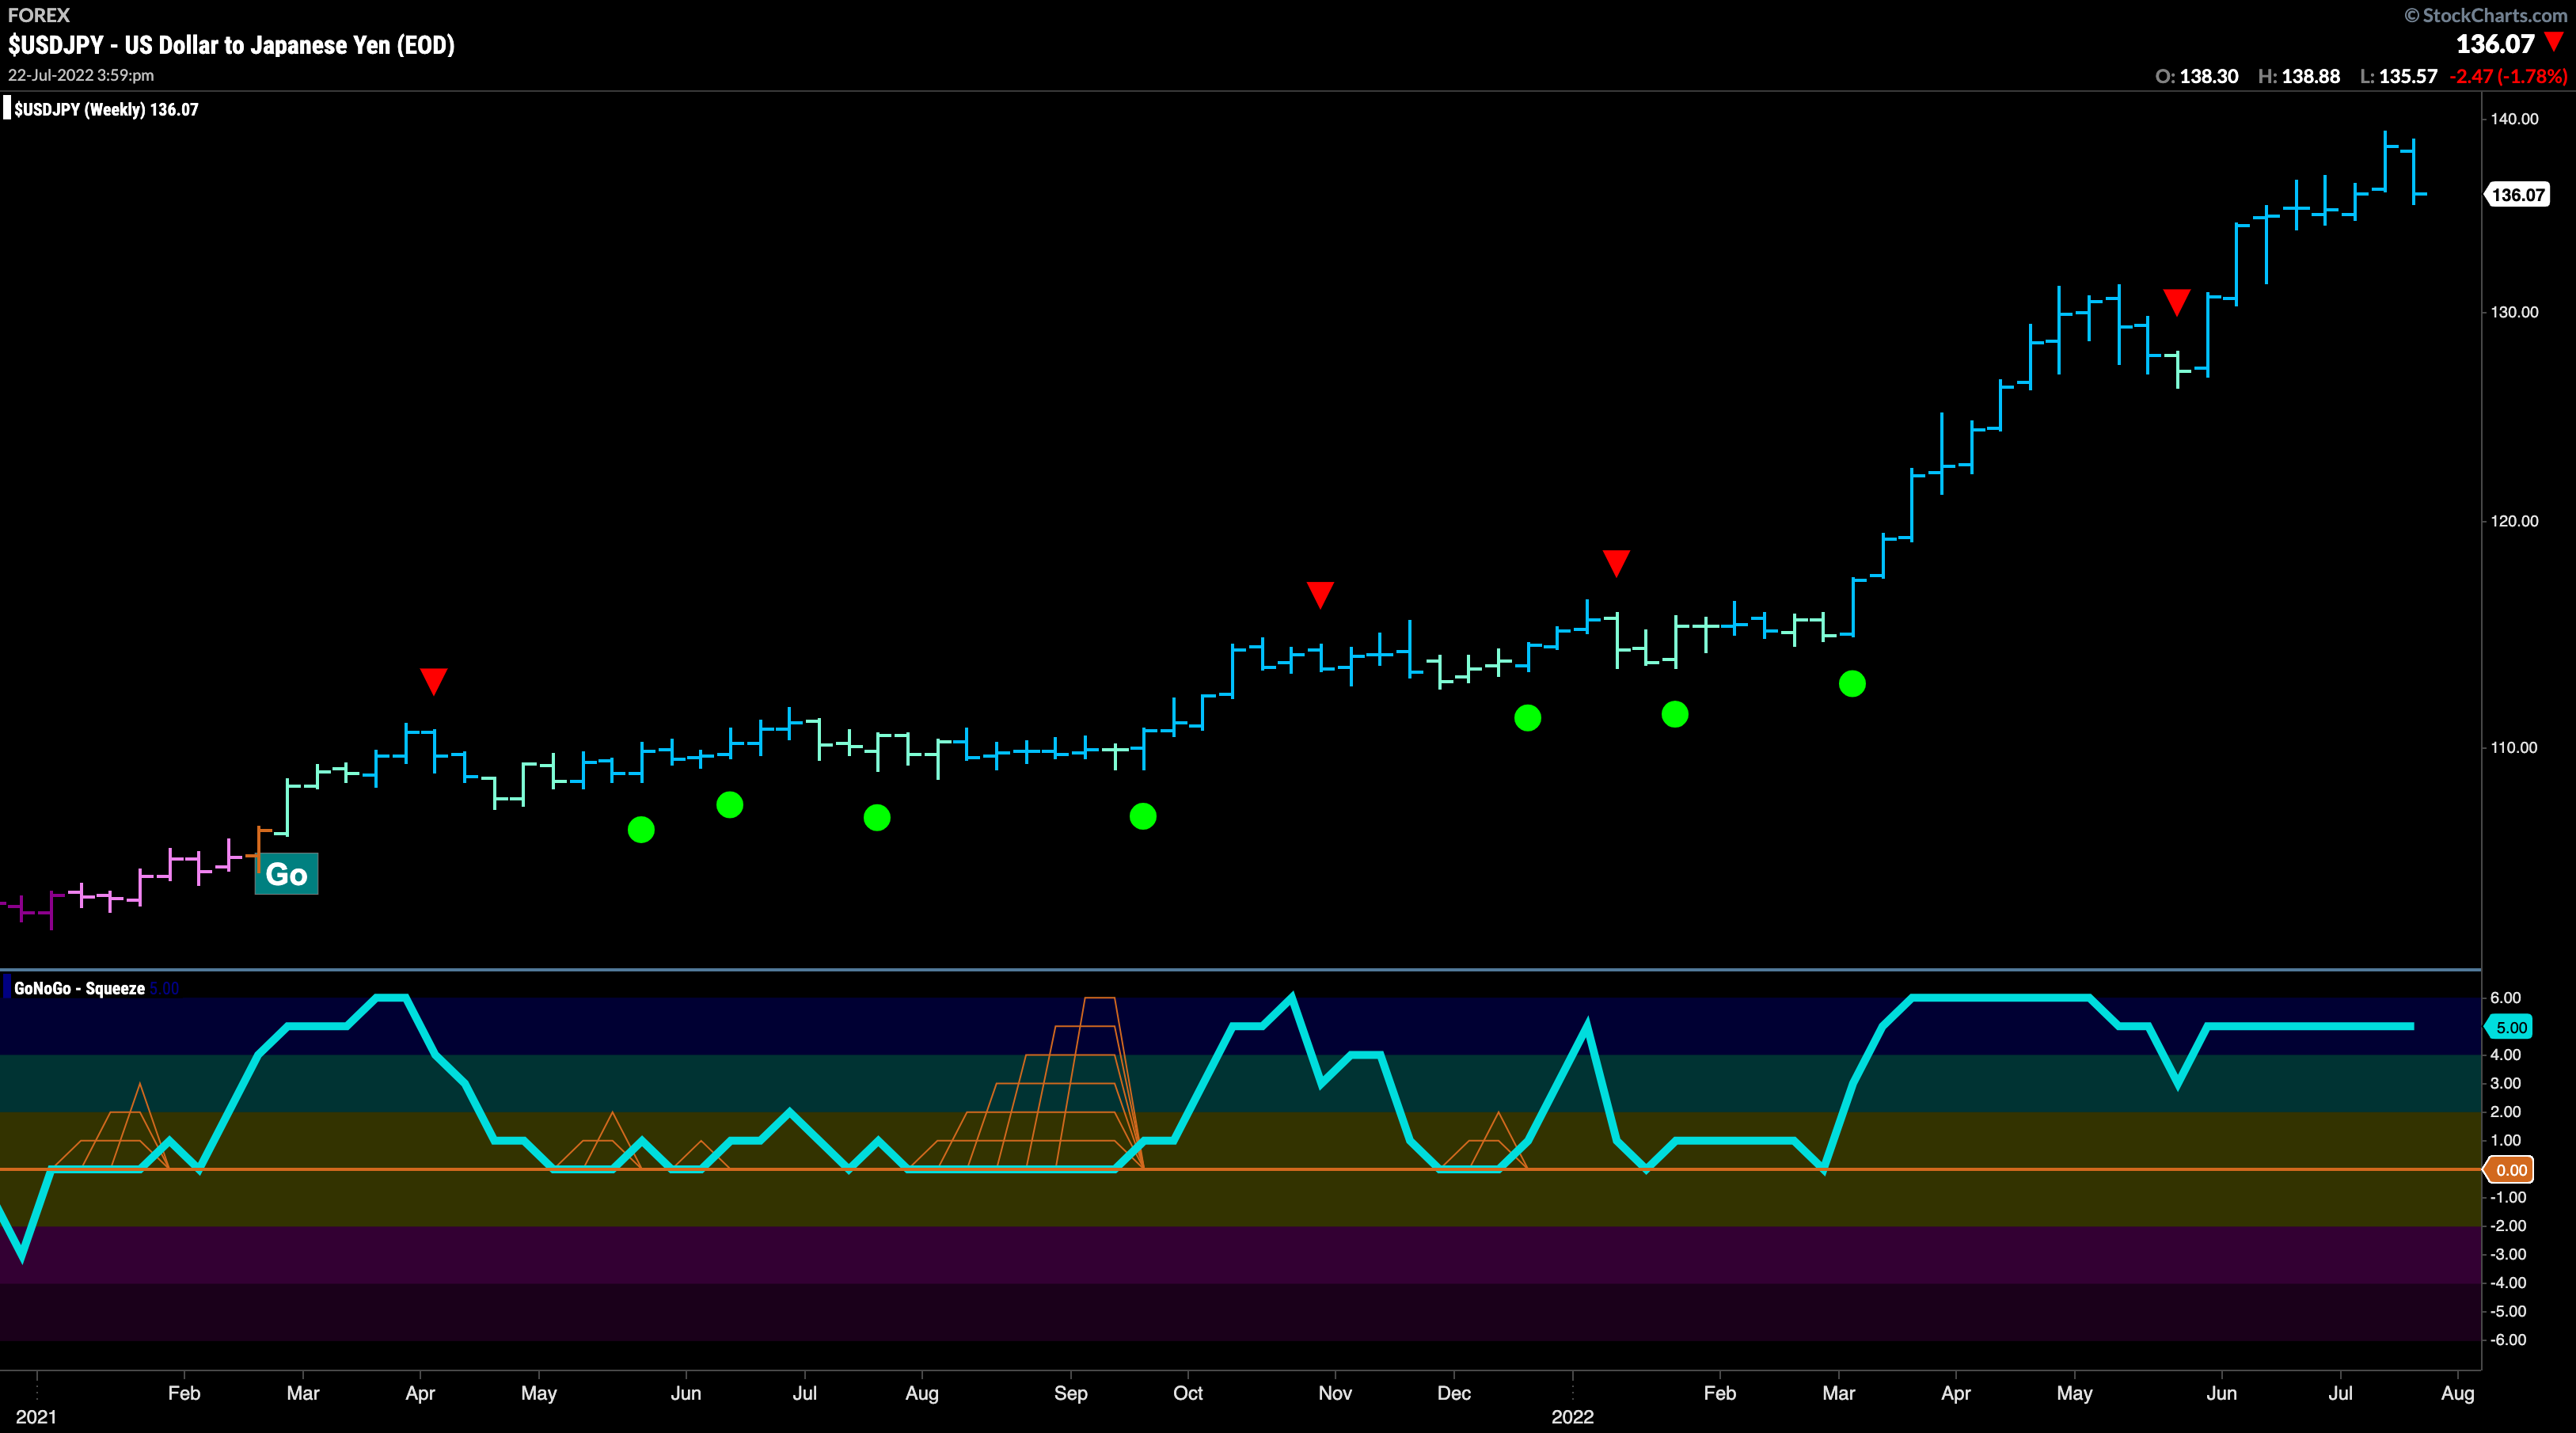
There is no breaking yet in the larger timeframe. We see a string of uninterrupted “Go” bars as price pushes to new highs on an almost weekly basis. Currently, GoNoGo Oscillator remains elevated in overbought territory.
Bestbuy a Best Buy?
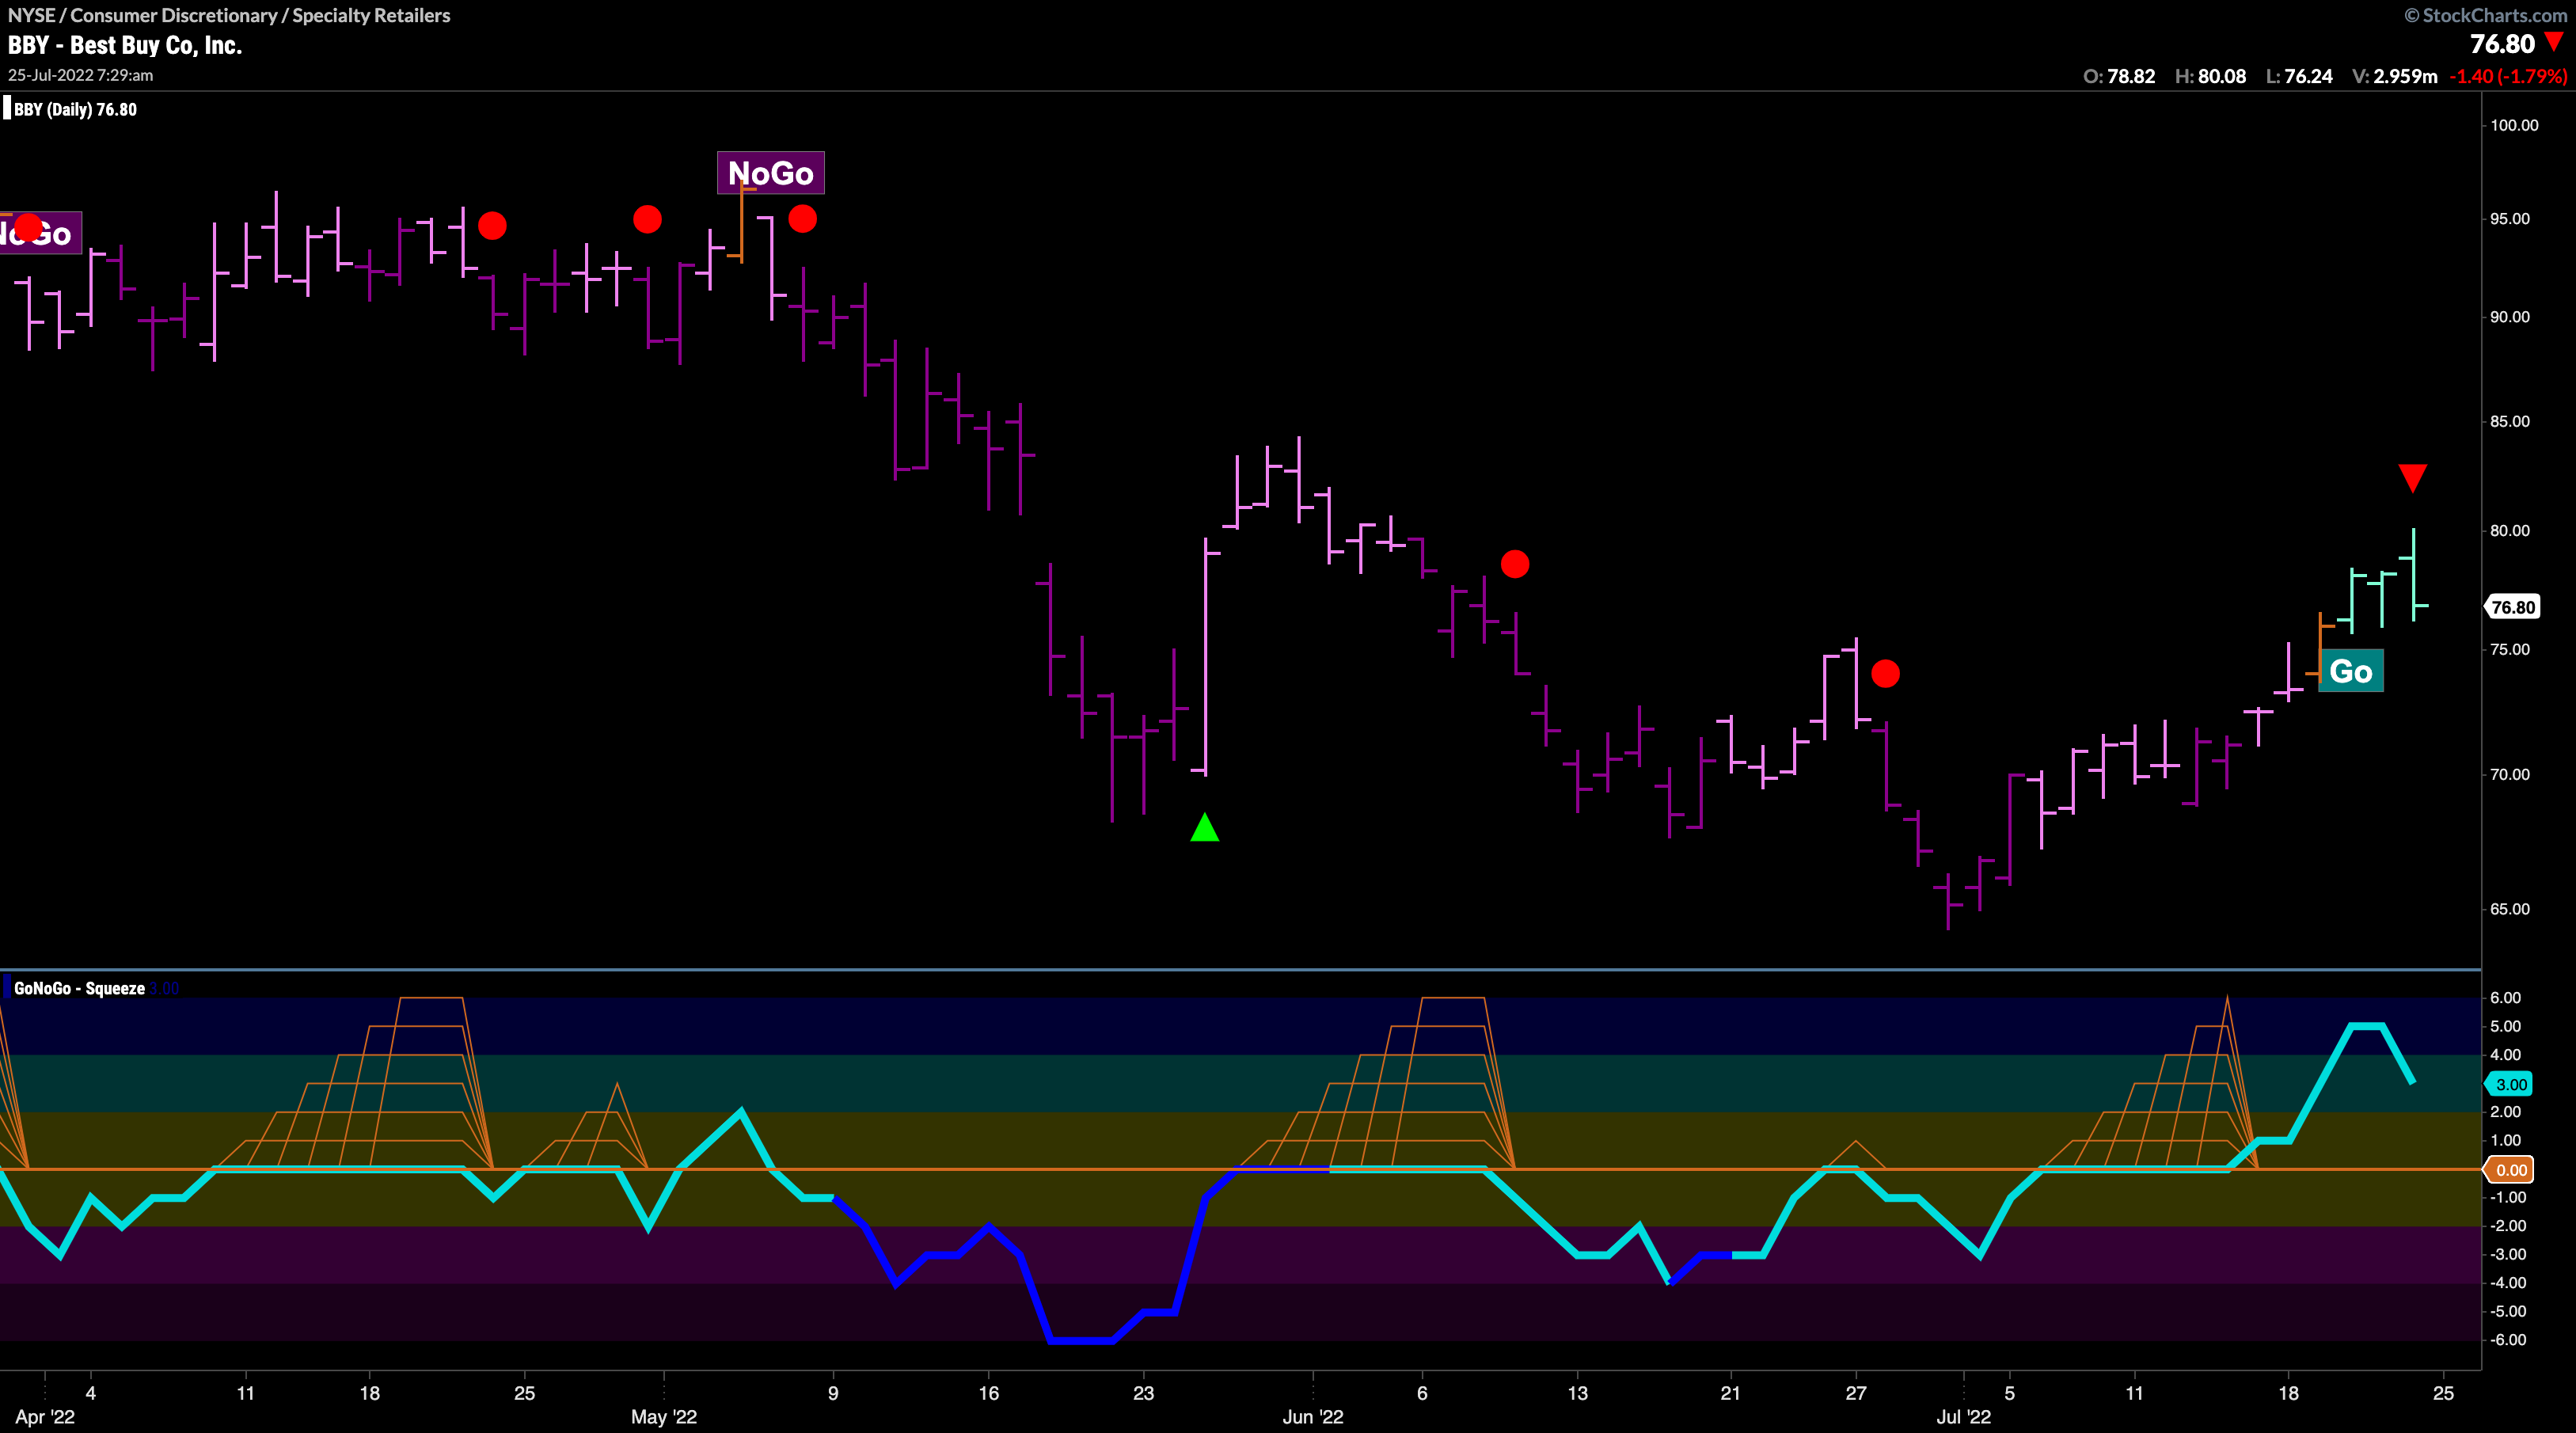
With the dollar strong relative to the yen we can look to Bestbuy perhaps as an opportunity. Struggling until now, as all technology stocks have done this year, will Bestbuy stock start to rise as the firm can import electronics from Japan at advantageous prices? Ignoring the story, let’s look at the GoNoGo Chart below which will give us the technical picture. $BBY is emerging from a “NoGo” trend as we saw a few aqua “Go” bars this week. We also see that GoNoGo Oscillator has broken out of a max GoNoGo Squeeze into positive territory which led the trend change in the panel above.
Take a Bite of Apple
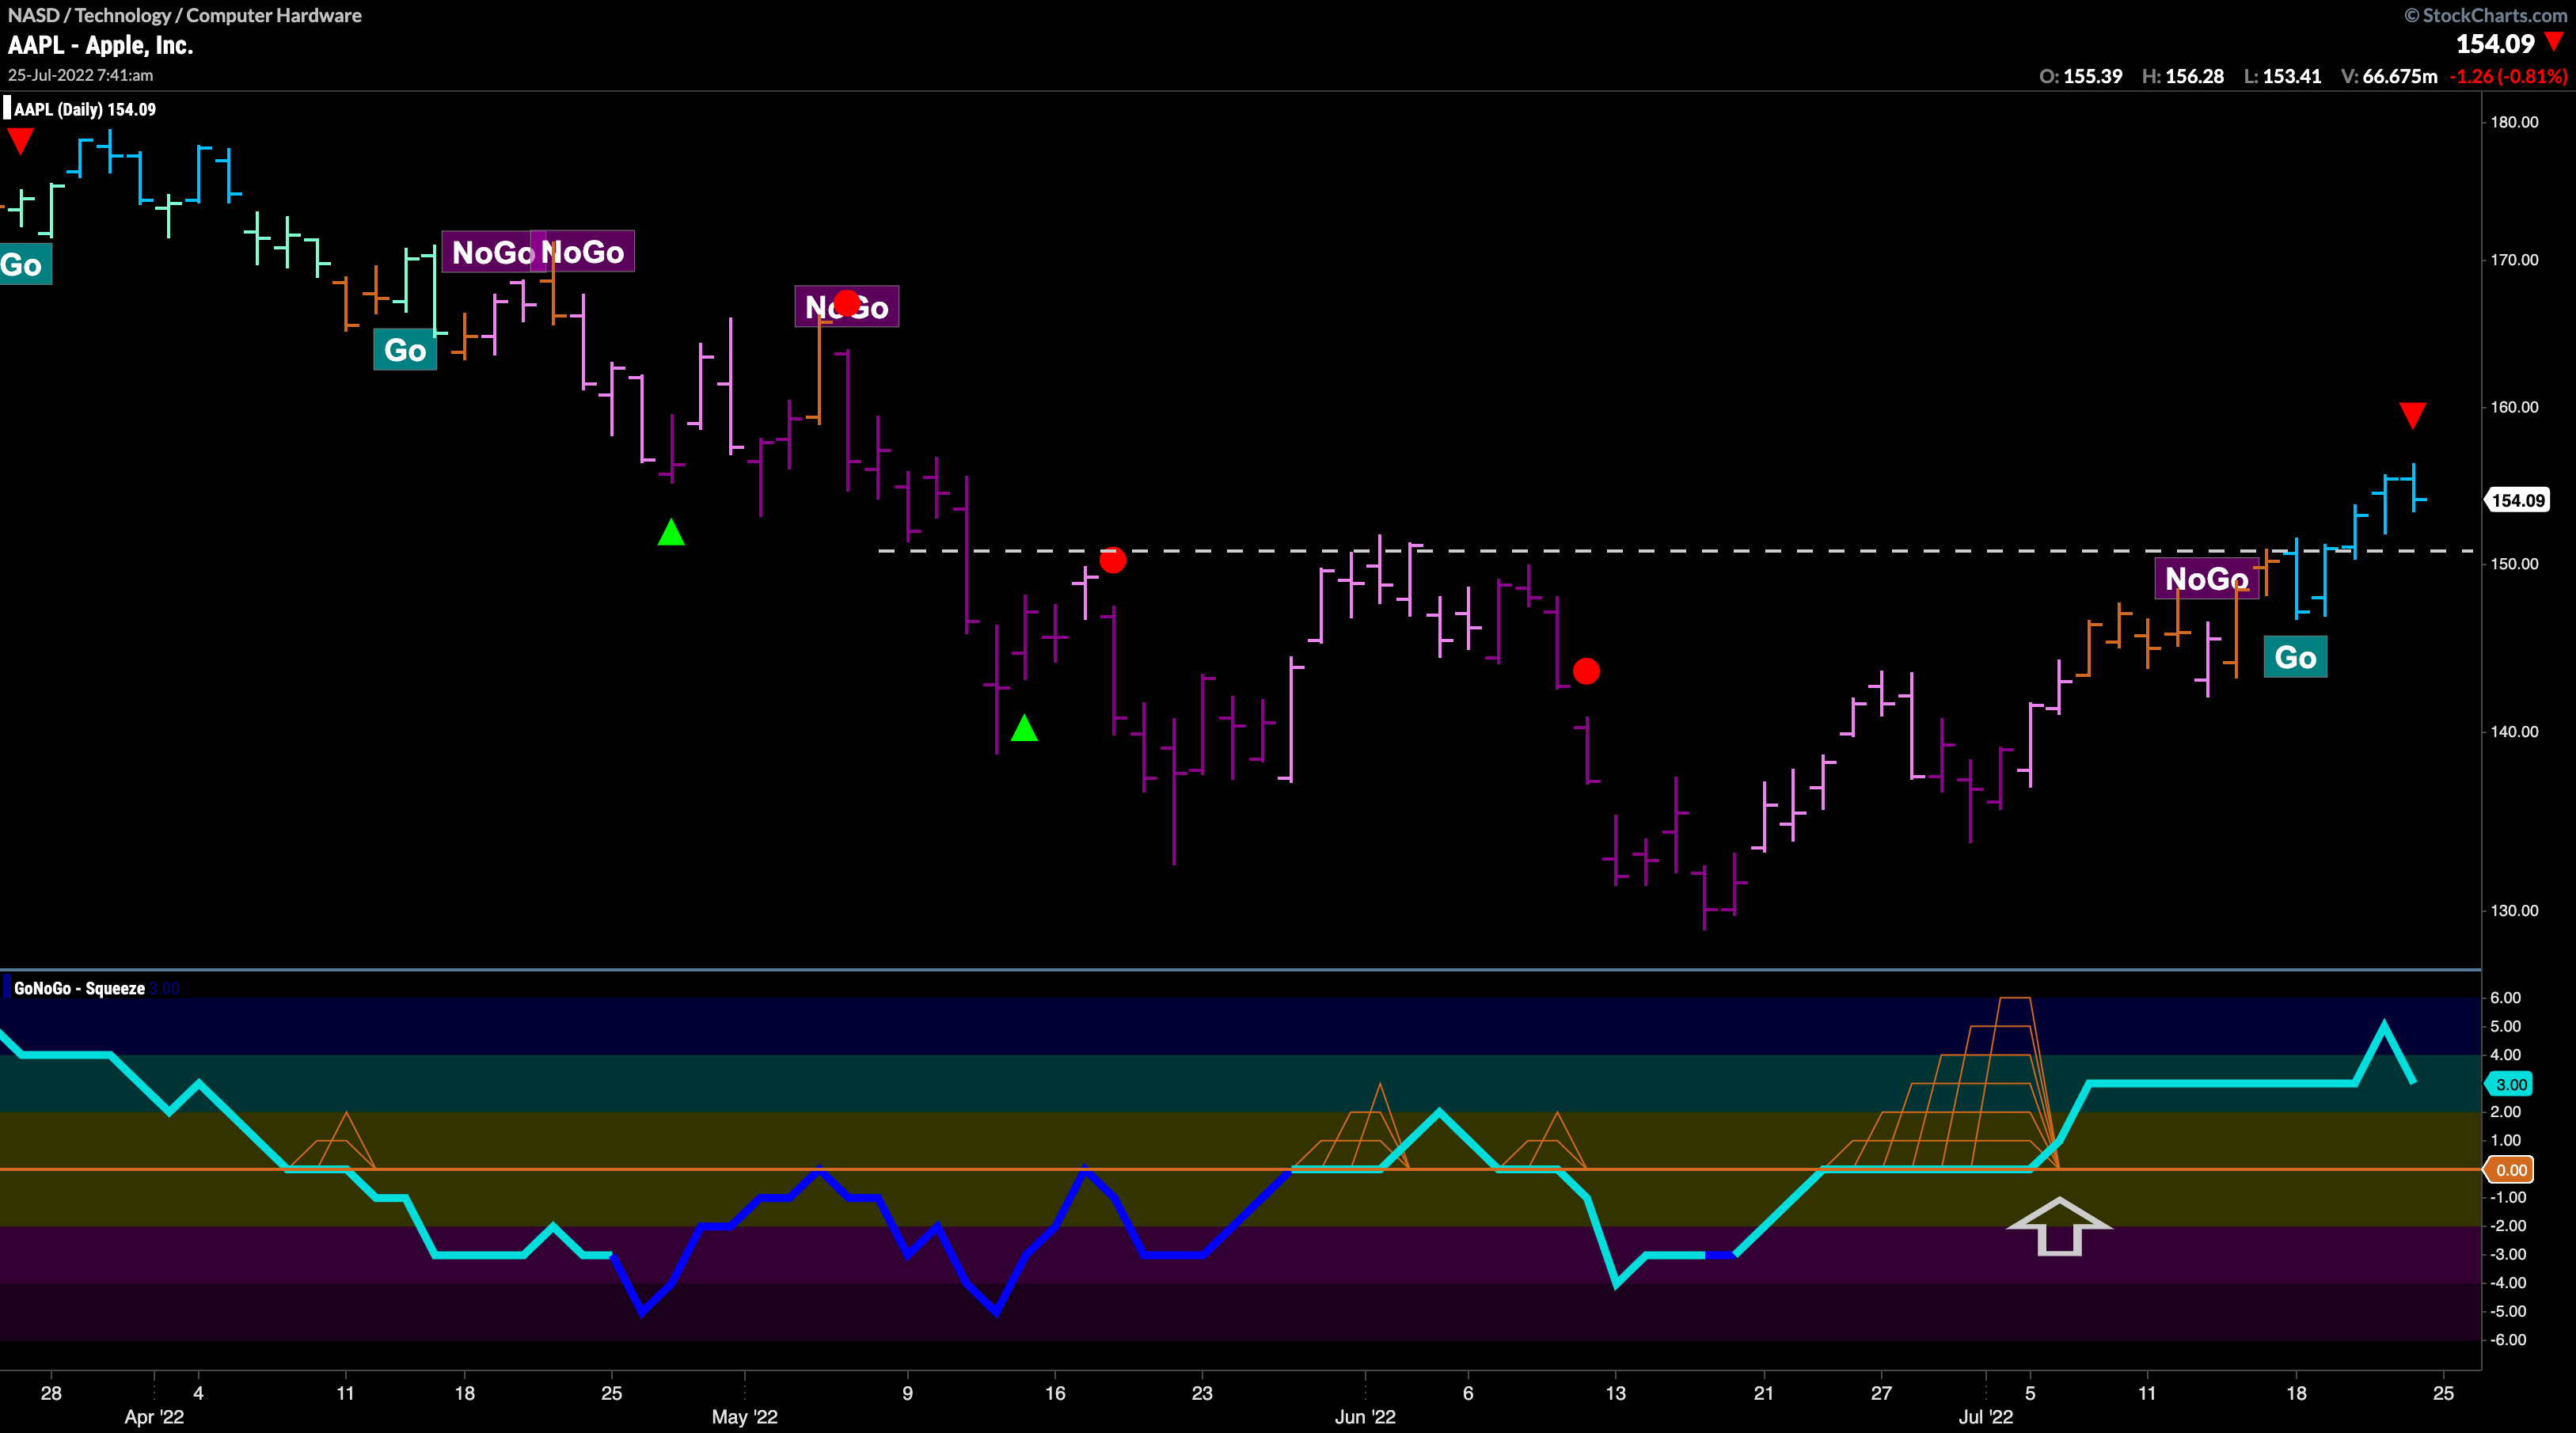
As we saw in the GoNoGo Sector Relmap, we are seeing the beginnings of a rotation into growth sectors. Let’s take a look at a technology juggernaut, Apple, Inc. The chart below shows that $AAPL is in a “Go” trend painting strong blue bars as price climbs above horizontal pattern resistance. In the lower panel, we see that GoNoGo Oscillator gave us an indication beforehand as it broke out of a max GoNoGo Squeeze ahead of GoNoGo Trend painting amber “Go Fish” bars.
Tesla Also Breaks Higher
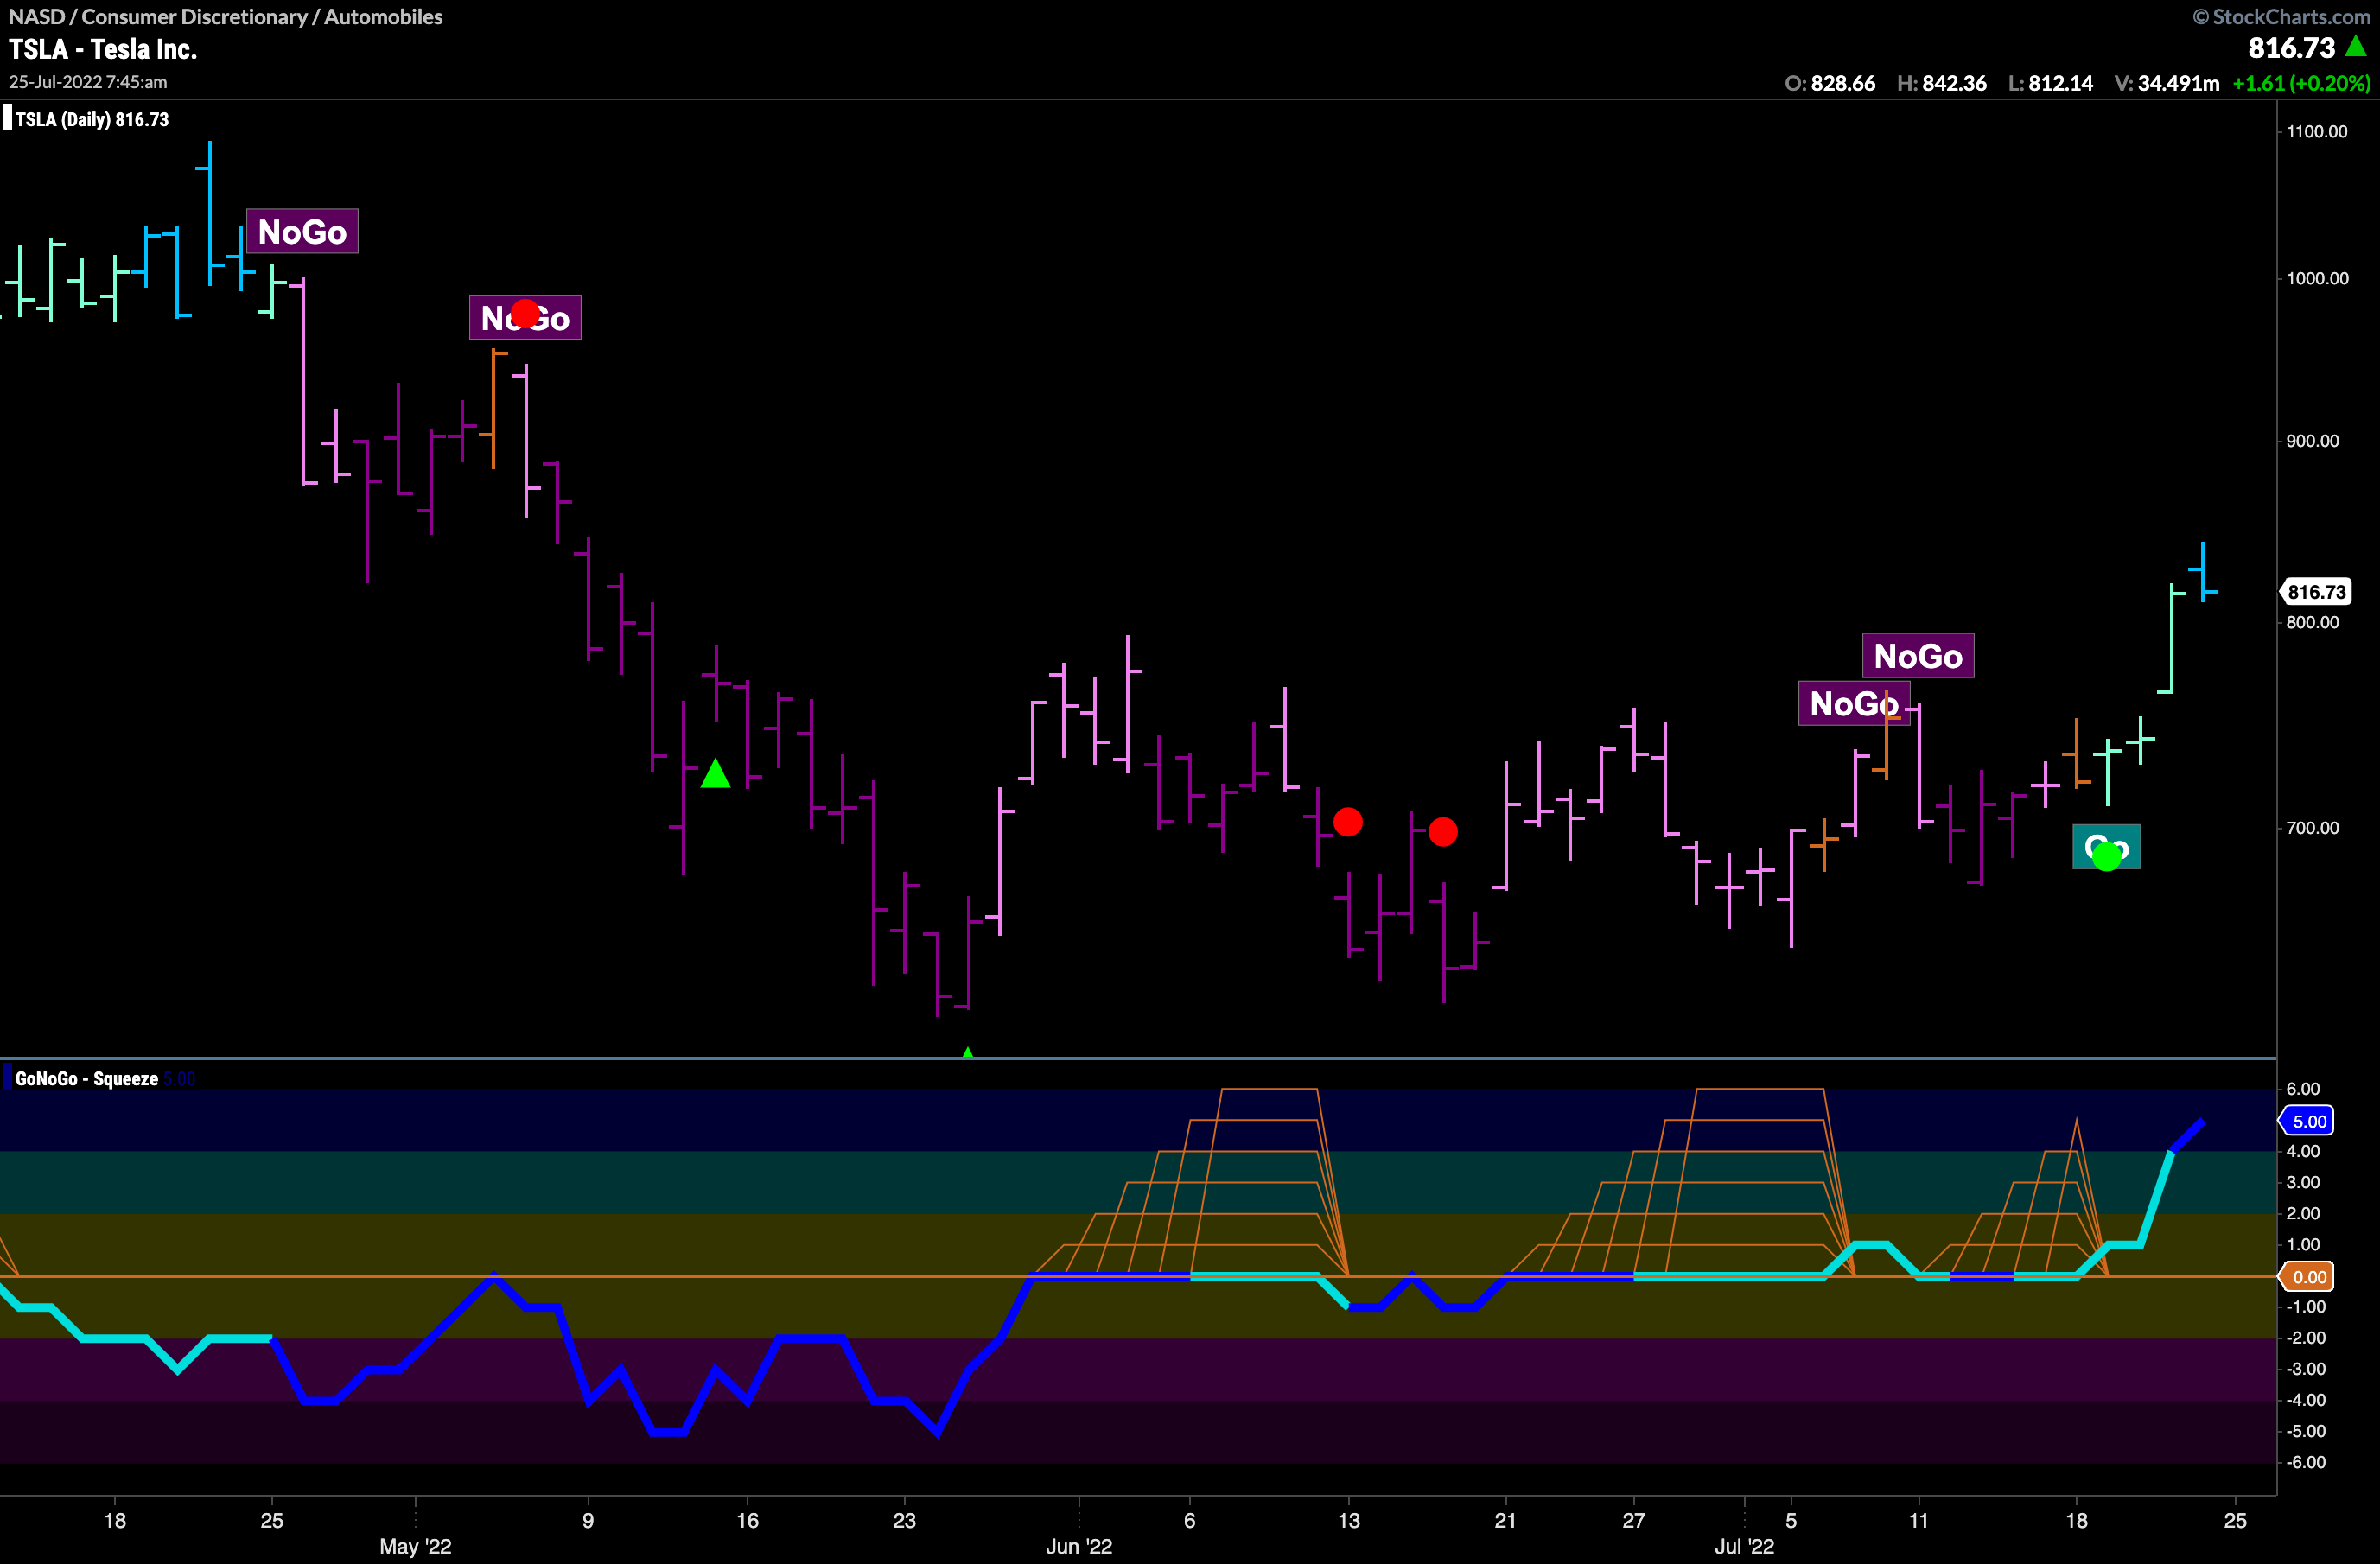
The other sector faring well last week on a relative strength basis was discretionary. $TSLA definitely helped in that regard. After a “NoGo” that lasted several months we saw a return to “Go” bars last week as price made a new intermediate term high. Of great interest in this chart is the length of time that GoNoGo Oscillator battled with the zero line. For over a month and a half, GoNoGo Oscillator was practically unable to tear itself away from the zero line. Finally, we see momentum surging into positive territory, in the direction of this new “Go” trend. With the trend a “Go”, an investor could certainly step down in timeframes to profit quickly from new price strength.
