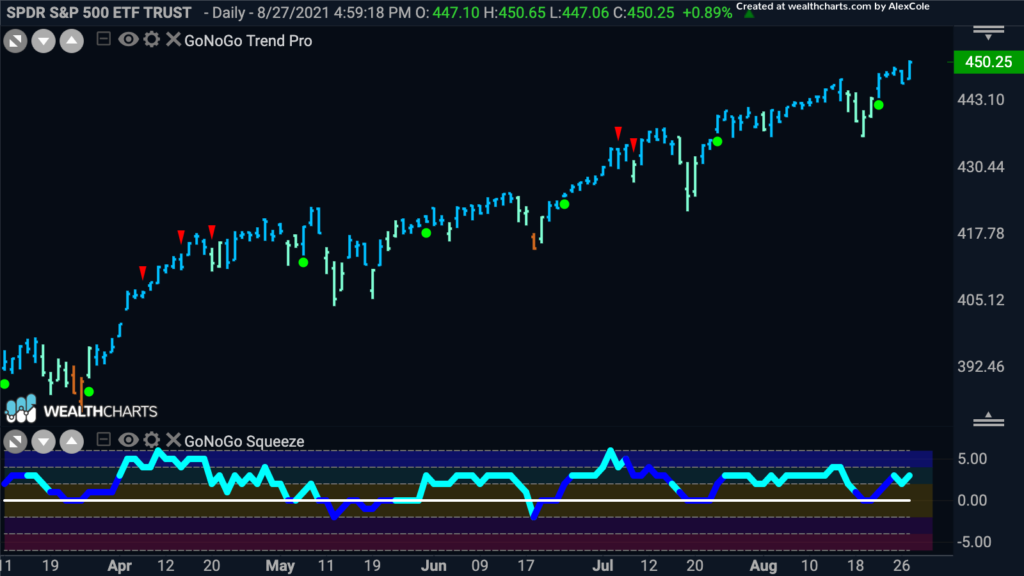
The bull market bounces back! This week saw uncontested strong blue “Go” bars as price hit record highs. Also, of note, the returns came from agressive sectors. The S&P 500 energy sector rebounded 7.3% (cutting its monthly decline to 1.0%) while five other sectors rose more than 2.0%. The defensive-oriented utilities (-2.1%), consumer staples (-1.4%), health care (-1.2%), and real estate (-0.3%) sectors closed lower, loosely reflecting a greater tolerance for riskier stocks. Risk? Back on.
Possible reasons? Earnings reports for the most part continuing to beat expectations, the FDA granted full approval for the Pfizer (PFE)-BioNTech (BNTX) vaccine for people 16 years and older, and the House advanced the $3.5 trillion budget resolution and the $1 trillion bipartisan infrastructure bill through procedural hurdles.
Risk On
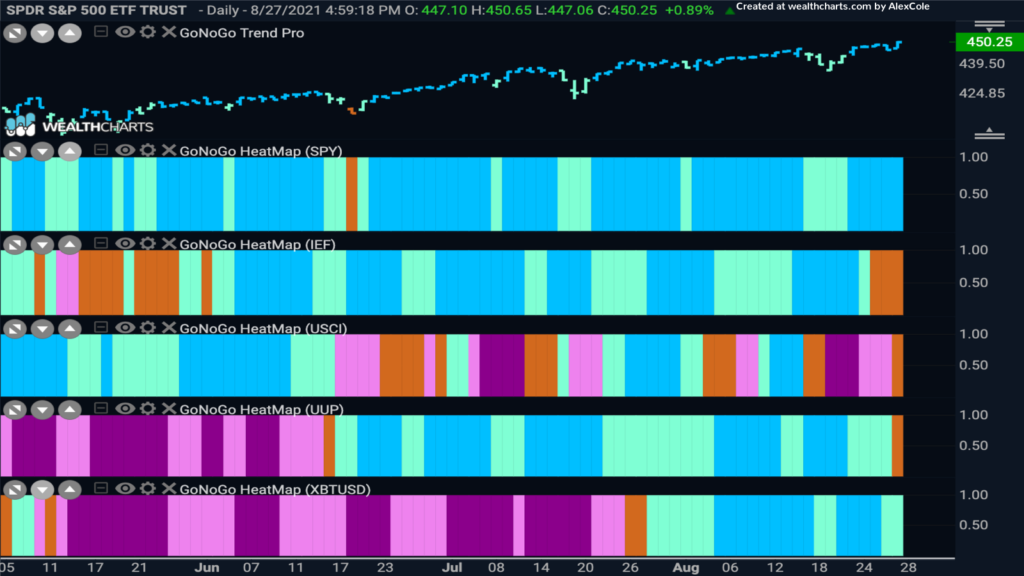
This narrative looks to be well demonstrated by the GoNoGo Asset Map below. Equities in the top panel continue to soar. Treasuries have slipped, as has the dollar, painting amber “Go Fish” bars to end the week. As we know, the U.S. dollar and treasury prices often will display a negative correlation with equity prices. Bitcoin continues its “Go” trend also, as price sets a higher low.
Choppiness Under the Surface
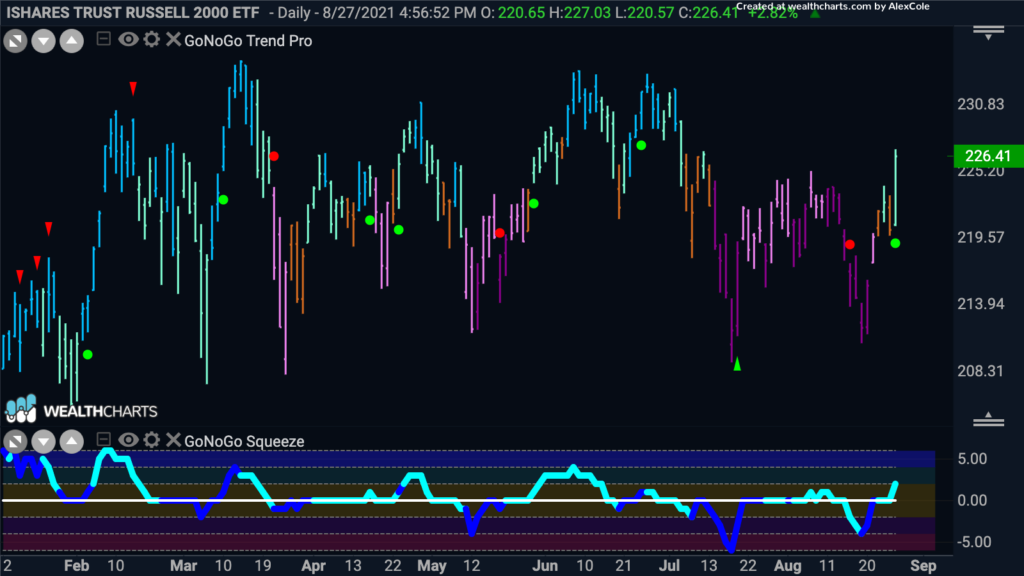
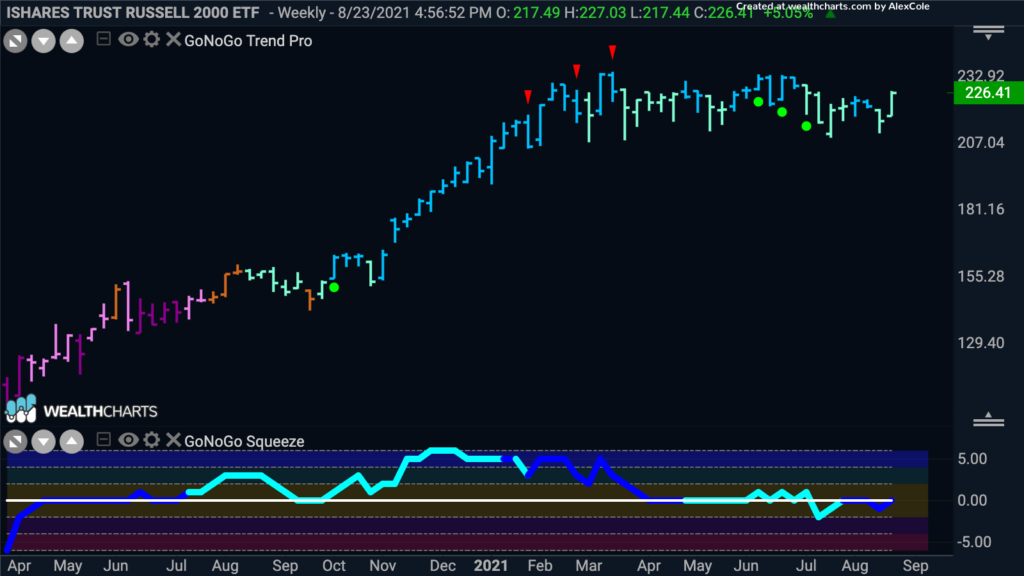
Outside of the large-cap averages, almost everything has been chopping around in a range since Q1. This had reinforced analysts’ view that these messy conditions were likely to persist for the foreseeable future. Below is the GoNoGo daily chart of $IWM, the Russel 2000 small cap index. As you can see, this mostly sideways correction has been messy and has persisted for several months, with prices at times correcting significantly from the March highs. While many are still looking for the “correction”, perhaps it has already happened for the majority of stocks. Clearly, small cap stocks have seen a multi month shake out already.
Given the risk on narrative we suggested in the opening stanza, let’s zoom out to look at the larger trend in the $IWM. The trend is a “Go”, but here we clearly see the sideways consolidation that has been in place since Q1 as investors digest the gains from the back half of 2020. There seems to be significant support around 207 as the GoNoGo Oscillator hovers around the zero line trying to find support. Currently, the oscillator is back at the zero line on heavy volume. We will look to see if the oscillator can break back into positive territory which would suggest trend continuation, in line with the thesis that the correction has already happened.
Energy to Re-enter the Fray?
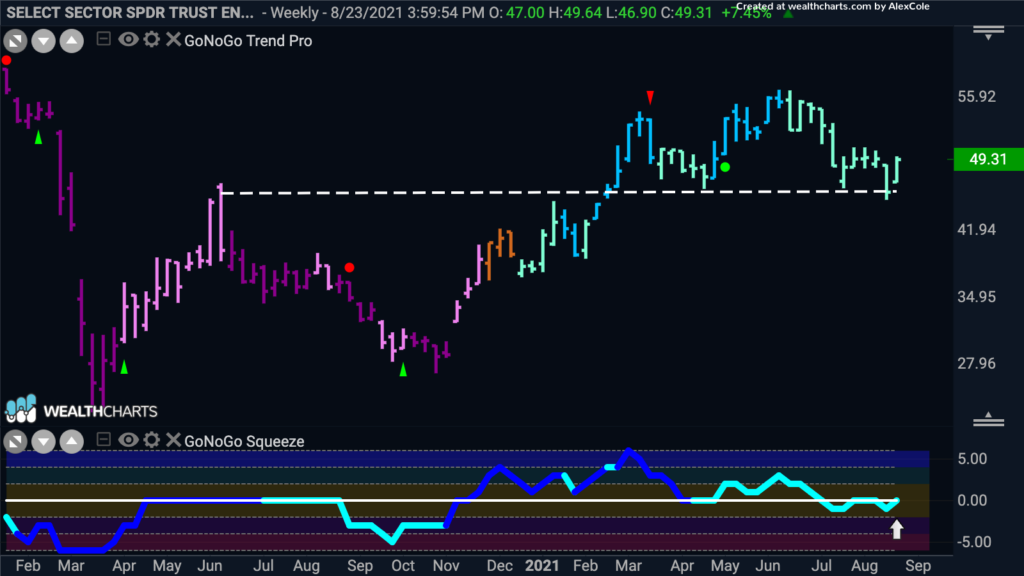
The chart below shows the weekly GoNoGo Chart for $XLE, the S&P 500 Energy sector ETF. Energy had a big week as we mentioned above, but, as you can see, there has been significant correction off the highs with the GoNoGo Trend painting weaker aqua “Go” bars. Also, we see the GoNoGo Oscillator at zero trying hard to find support at that level. This is a very important stage for energy prices as there does appear to be support here. We will need to see the oscillator back above zero which would show momentum returning in the direction of the “Go” trend.
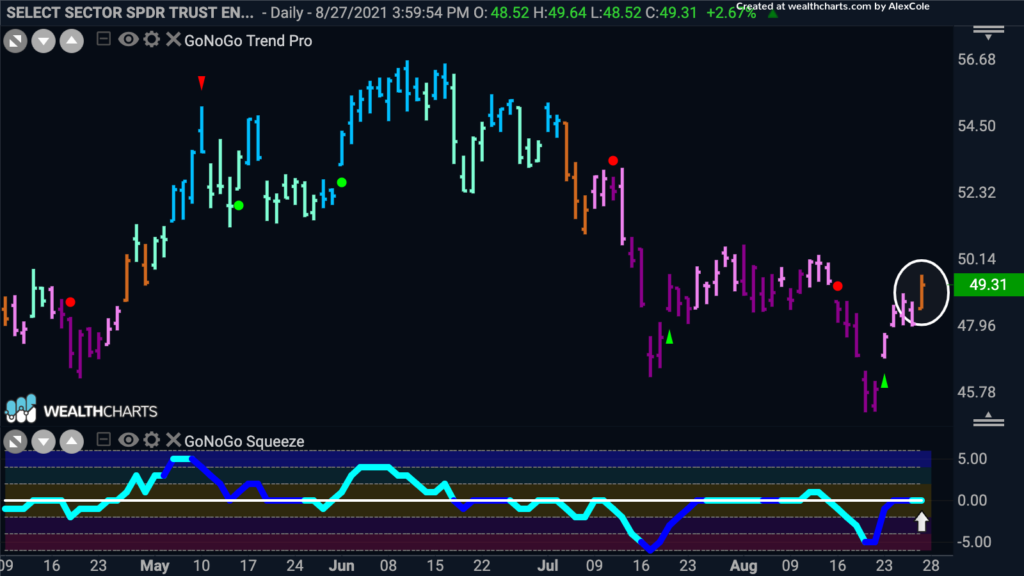
Looking at the daily chart, we must point out that things aren’t rosy in the energy sector. Indeed last week in Flight Path we noted the sector’s underperformance and looked at oil as a culprit. However, as markets swing we must constantly evaluate. If risk is coming back on in the more aggressive sectors, are we seeing any signs of recovery in the energy ETF? Friday saw a “Go Fish” bar painted, meaning that there are not enough “NoGo” conditions or “Go” conditions being met to paint a trend in either direction. This is a concern for the bears. We also see the GoNoGo Oscillator testing the zero line from below. We will look to see if this acts as resistance or if momentum can follow the trend color change.
Small Cap Energy Ideas
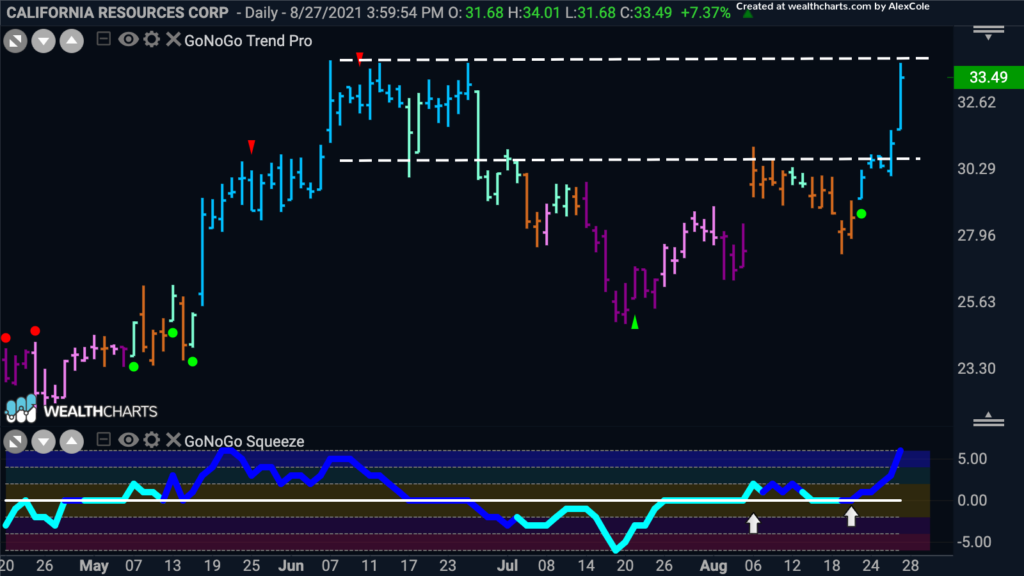
If energy is to recover, where are the leaders that can provide opportunity? If small cap is set to rally and there are signs of a recovery in energy space, we can look to get a jump with specific stocks. Below is the chart of Califdornia Resources Corp. We can see real strength here. GoNoGo Trend is strong blue and price raced higher this week. We saw the GoNoGo Oscillator find support at the zero line confirming the breakout in price on heavy volume. In the long term, we will look for the GoNoGo Oscillator to remain positive and for price to get above resistance in the form of the overhead supply from June. In the short term, the oscillator is oversold and price is at resistance so we may see some struggles at these levels.
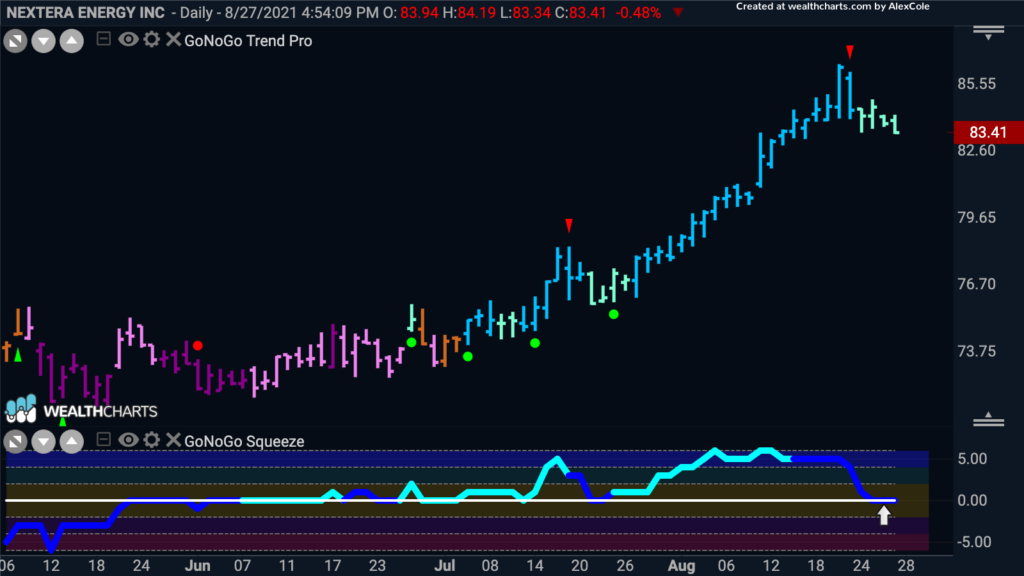
Nextera Energy Inc is setting up beautifully for a rally if the trend for energy stocks is to emerge as a renewed “Go”. We can see that the stock saw a strong rally from early July up to highs over $85.55. The GoNoGo counter trend correction arrow appeared at the top to warn of short term correction against the trend and the GoNoGo Oscillator has now fallen to the zero line. If this trend is strong, we will expect the oscillator to find support at the zero line and when it rallies off it, that will tell us that momentum has come back in the direction of the trend and we will see a green trend continuation circle appear under the price bar.
