
FLIGHT PATH GoNoGo Charts Weekly Research 2|22|21
Equity gains, particularly for large-cap names, cooled last week. However, this was not a “sell-off,” a “crash,” or a reason to panic. The environment still points to risk-on investing. See the GoNoGo Risk® chart below which shows the trend colors for a simple ratio of junk bonds to Treasuries. We can see that the risk-on trend has been unwavering through countertrend corrections so far this year and continues to be the prevailing theme for the week beginning Feb 22nd. This is a bull market.

As with all risk-on regimes, Stocks, Commodities, and Cryptos are in “Go” trends. Once a cause for concern, the dollar index, $DXY, is showing signs of retreat. In addition, the yield curve steepens as 10-year Treasuries make a notable advance. For investors focused on capturing alpha and maximizing returns, see the GoNoGo Asset Class Heat Map below which compares trends across asset classes highlighting that Stocks, Commodities, and Cryptos ought to be the focus for allocations right now.

The GoNoGo Heat Map® above shows us the daily trend performance of five asset classes: Equities, Bonds, Commodities, Currencies, and Digital Assets from the US perspective. The takeaway remains the same as it has been for several weeks. Equities, commodities, and the cryptocurrency markets are now in established “Go” trends.
Panel 1 – Stocks continue to paint strong blue “Go” bars as the trend persists. The $SPY ETF seeks to provide investment results that correspond generally to the price and yield performance of the S&P.
Panel 2 – Government bonds, continue to paint “NoGo” bars, as investors seek yield elsewhere. $IEF tracks a market-value-weighted index of debt issued by the US Treasury with 7-10 years to maturity remaining.
Panel 3 – Commodities are a “Go,” painting the strongest blue bars last week. $USCI tracks an equal-weighted index of 14 commodity futures contracts and holds at least one precious metal, industrial metal, energy, livestock, soft, and grain commodity.
Panel 4 – The US Dollar is retreating again from the “Go” trend of the last few weeks and concluded last week’s session with an amber bar. $DXY is an index of the value of the United States Dollar relative to a basket of foreign currencies.
Panel 5 – Bitcoin’s “Go” trend continues with strength this week as it climbs ever higher on strong blue bars.
Catapulting COPPER
As the economy returns to pre-pandemic productivity, the Industrials sector is showing early indications of strength. Copper is a bellwether for many industry groups including homebuilding, automotive and industrial manufacturing. Look at the massive acceleration in price action for Copper just last week. The “Go” trend rocketed higher after the green trend continuation icon as GoNoGo Oscillator broke through the zero line on heavy volume. The oscillator is at sustained overbought extremes. We will soon see if this is enough to consume overhead supply. $HG1 closed just below resistance on Friday.

For a better perspective on the long-term resistance levels Copper is now approaching, see the Monthly GoNoGo chart below. Copper is just now reaching levels not hit in a decade. The chart also highlights the incredible rally off the March 2020 lows.

GoNoGo Research believes a breakout to all-time highs for Copper would be a strong signal that the industrial economy is back online. To capture returns with an individual equity, see the 4hr GoNoGo chart below of Southern Copper Corporation $SCCO:

Dollar Looks DOUBTFUL
The efforts of the dollar to climb into a “Go” trend these past few weeks were a potential threat to the equity rally – particularly for emerging markets and small caps. Dollar strength would make it more difficult for the risk assets such as equities and dollar-denominated commodities to continue higher.
The chart below shows that after identifying a second “Go” trend two weeks ago, the dollar has struggled to move higher. Last week we saw trend conditions deteriorate from strong blue to end the week on amber bars. GoNoGo Oscillator® is now riding the zero line on light volume. It will have to find support here or we can expect the mighty greenback to fall out of the “Go” trend back into bearish price action.

S&P equity Sector relative strength
A GoNoGo RelMap® below shows the Sector SPDR ETFs and their relative GoNoGo Trends to the S&P 500. The map applies the GoNoGo Trend® indicator, a composite of technical conditions, to the relative strength ratio of each sector to the U.S. benchmark. What we can see is that four sectors decisively outperformed the broad S&P 500 Index this week.
The Consumer Discretionary ($XLY) sector had a brief relative rally but then fell back to NoGo pink, pulled down by weakness in Amazon (22.5% of the weighting for $XLY).
The materials and healthcare ($XLB and $XLV) sectors’ relative performance continued to underperform the benchmark in “NoGo” relative trends. But keep in mind, the absolute trends for these sectors are still a “Go” – they are simply not trending higher at the same pace as the index.
Energy ($XLE) continues strong relative outperformance. Financials ($XLF), Technology ($XLK), and Communications ($XLC) round out the leadership for the week ending February 19.

ENERGY SUSTAINS GO TREND
The energy sector of the S&P, $XLE, has a strong “Go” trend on an absolute and relative basis right now. See the daily GoNoGo Chart below:

To Provide context though, the long-term structural view on the Energy sector is still a “NoGo.” See the monthly chart below:

Interestingly, GoNoGo Trend is painting weaker pink bars and GoNoGo Oscillator rallied to the zero line on heavy volume. If the oscillator breaks into positive territory on this monthly chart, we could see GoNoGo Trend confirming the “Go” trend across multiple timeframes – a high conviction environment.
DRILLING INTO THE SECTOR
As investors, we can capture gains from the performance of the sector as a whole, or we can drill down to single securities. At the stock level, there is greater return and greater risk. See the chart below of the largest holding in the cap-weighted sector ETF ($XLE), Exxon Mobil. This beautifully sustained “Go” trend provided many opportunities to enter the trend or increase position sizes at each low-risk entry icon (green circle). After each period of consolidation, the oscillator rallied as momentum thrust price higher. Look for these setups to continue as $XLE gains confirmation from longer-term charts.

Another tradeable idea in the Energy sector is a much smaller corporation: Holly Frontier $HFC. Similar to Exxon Mobil, $HFC triggered a “Go” flag in November and made impressive uninterrupted gains since:

Bond Yields drive gains for Financial Sector
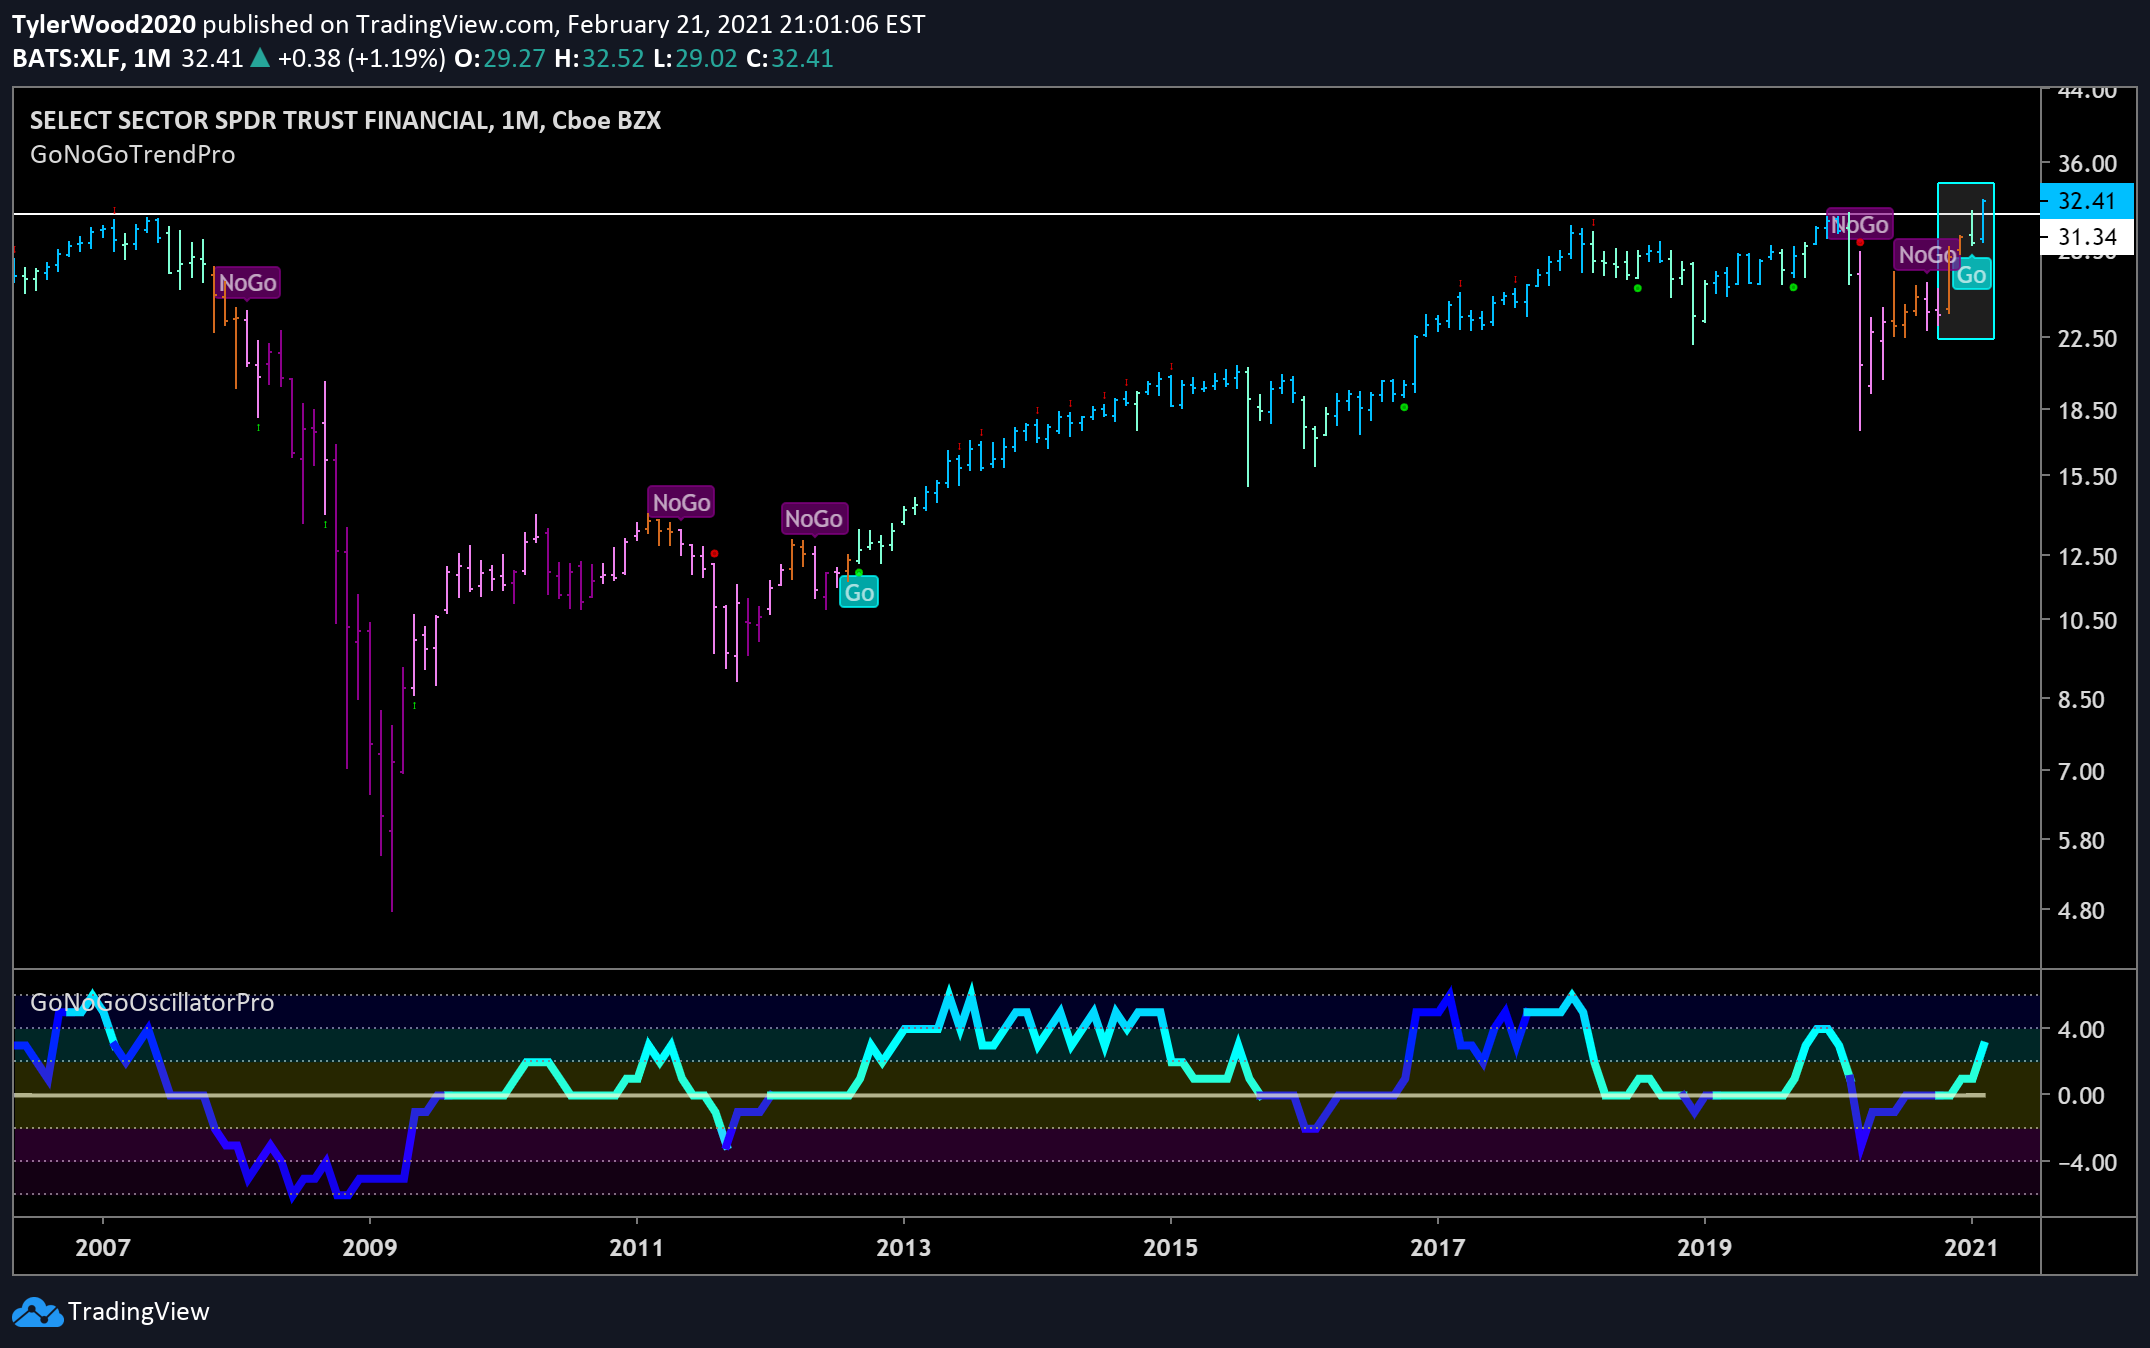
Many companies held in the $XLF lend money. Rising rates improve the returns for those companies. Others in the brokerage, trading, or investment banking space have also captured banner years in the post-pandemic rally of 2020 and into 2021. Their performance has been so remarkable, that last week, the Financial sector broke out of a 14-year base! Trading at all-time highs is significant because there is no overhead supply or resistance keeping the sector from trading higher.

If we zoom in on just the highlighted box in the top right corner of the monthly chart above, we can see the detail of recent trading activity on the daily chart below. Notice that price tested the resistance line twice, closing below resistance again on Thursday, Feb 11th before breaking out finally to new all-time highs last week.

Again, looking for individual stocks to own within the $XLF, there are huge multinational banks such as Bank of America Merrill Lynch which are also breaking out individually. See the daily GoNoGo Trend chart of $BAC below. The trend is painting strong blue bars and the oscillator is sustaining positive levels.

For a more direct play on the rising yields, we should look at a firm squarely focused on consumer financial services including private label credit cards and customized financing for retail, auto, healthcare and travel industries.

GoNoGo Trend is a “Go” and the oscillator is positive, but Synchrony has yet to break out to all-time highs. Perhaps it is set to catch up with its peers in the financial sector.
Better charts, better decisions.


