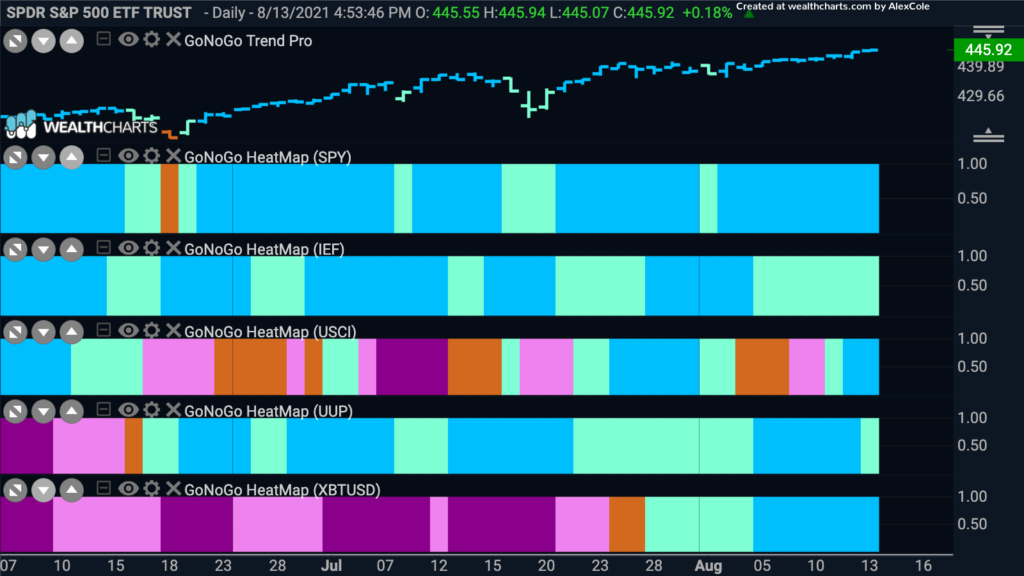
“Go” trends abound. Equities have continued to paint strong blue “Go” bars this week as prices climb higher and higher. Commodities have resumed their “Go” trend and ended the week painting strong blue bars. Bitcoin, having emerged out of a severe “NoGo” correction last week is now in a strong “Go” trend. This appears to be a risk on environment. The dollar, although showing recent strength and still in a “Go” trend slipped a little to end the week painting a weaker aqua bar. Treasury bonds have also cooled of late, spending this whole week painting weaker aqua “Go” bars.
Dollar Looking for Support
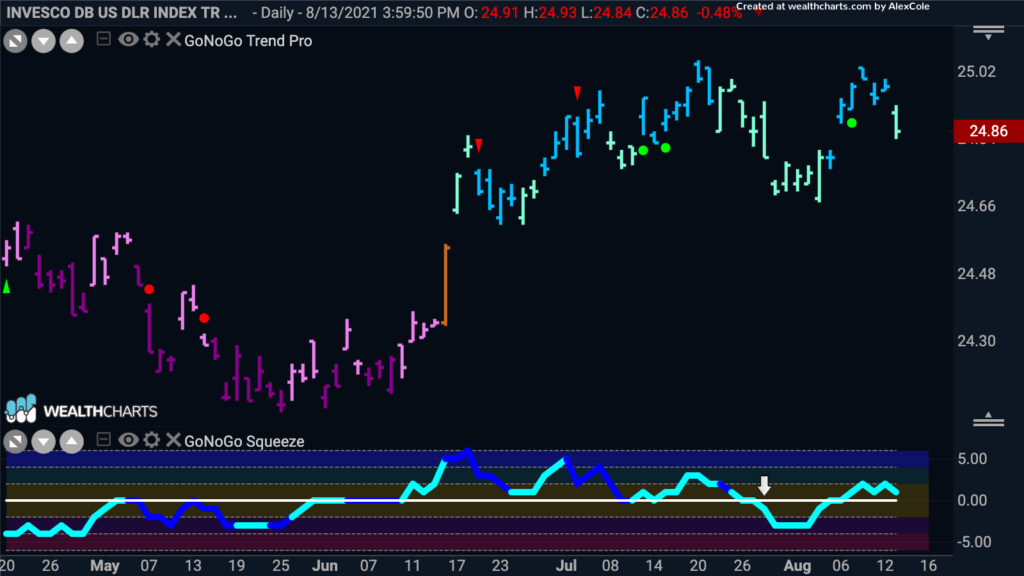
The chart below shows the chart of $UUP, the Invesco Dollar Indcx Fund. Since establishing a “Go” trend in the middle of June the greenback has struggled to move significantly higher. It has set a higher low however, and the rally from that low has been strong enough to get the GoNoGo Oscillator back above the zero line. If it finds support here we may see another higher low in place.
Leadership Among Domestic Equities
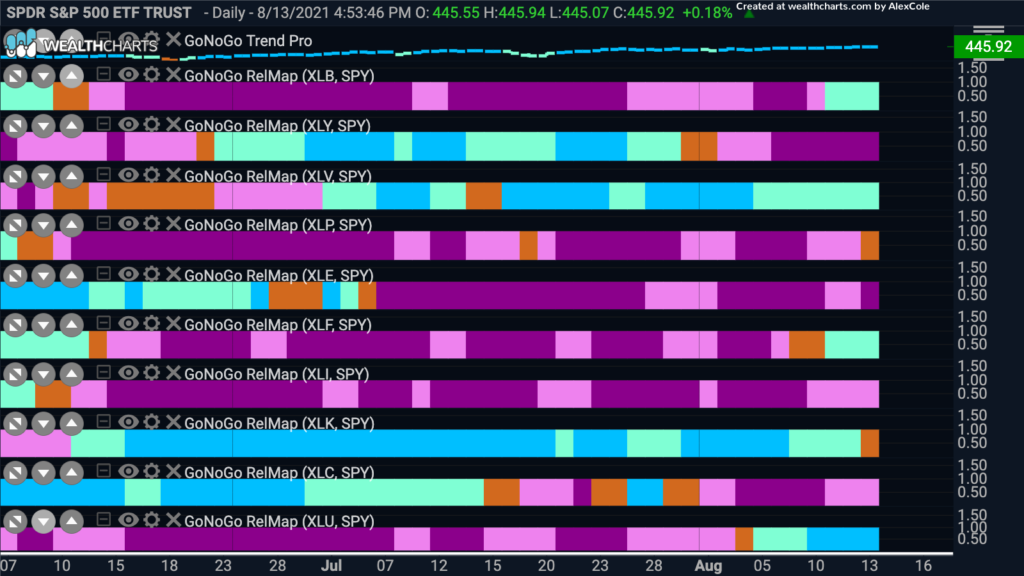
We’ve seen some rotation recently in terms of which sectors are showing leadership on a relative basis. The GoNoGo RelMap below shows the GoNoGo Trend applied to the relative strength ratio of each sector to the broader index. We have seen strength in healthcare, utilities and technology over the past several weeks but this week saw materials and financials emerge as leaders. That bodes well perhaps for the markets as cyclical sectors tend to fare better when an economy is healthy and growing.
Materials Making Moves
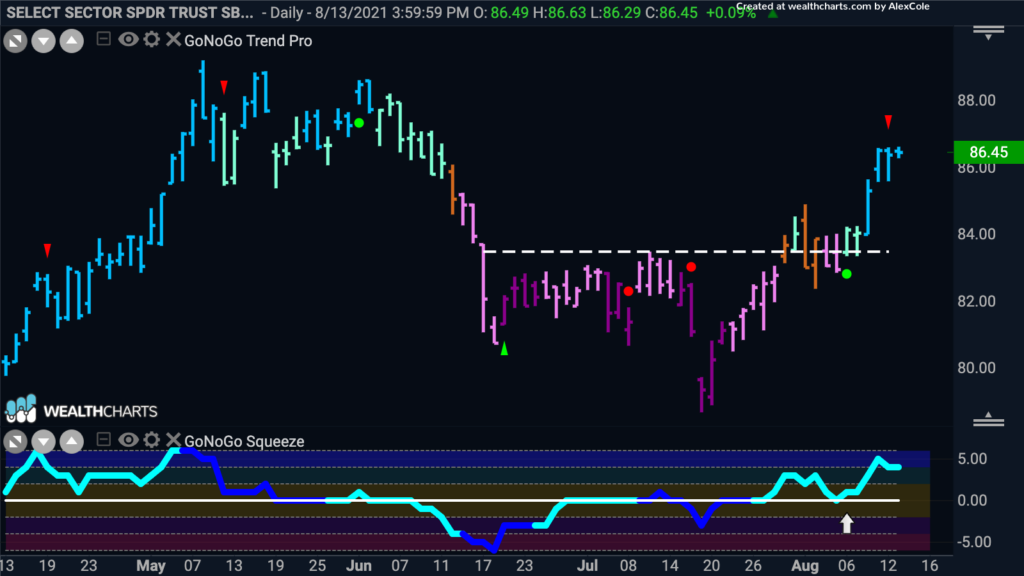
The GoNoGo Chart below shows the GoNoGo Trend and GoNoGo Oscillator applied to $XLB, the materials sector. After experiencing a “NoGo” correction, the GoNoGo Trend has identified a “Go” trend. Initially we saw that the GoNoGo Oscillator was unable to stay below zero and toward the end of July broke into positive territory. The GoNoGo Trend followed by cycling through trend colors painting amber “Go Fish” bars and even some aqua “Go” bars as price struggled with resistance from the correction. Earlier this month, the GoNoGo Oscillator found support at zero and rallied into positive territory. The GoNoGo Trend indicator is now painting strong blue “Go” bars.
Cemex to Cement Gains?
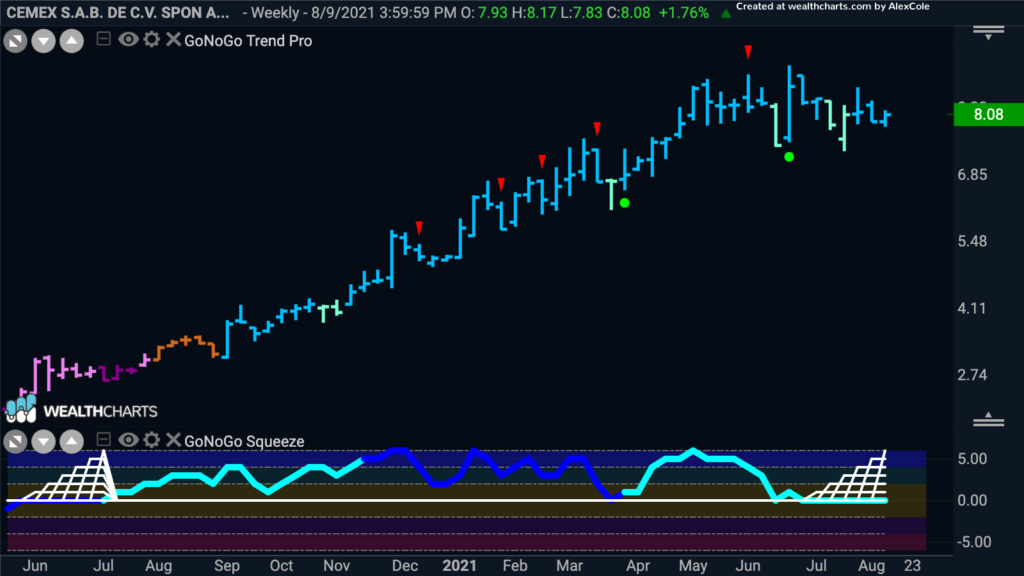
Below is the long term weekly GoNoGo Chart of Cemex. We can see that the “Go” trend has been in place since September of last year and during that time the GoNoGo Oscillator has been in positive territory finding support at zero. Recently, price has consolidated sideways as investors digest gains and the GoNoGo Oscillator has fallen to and is riding the zero line. The GoNoGo Squeeze shows that the climbing grid has risen to an extreme as volatility shrinks. All else being equal, given the “Go” trend in place, we will look for the GoNoGo oscillator to break out of the squeeze into positive territory and prices to resume the trend higher.
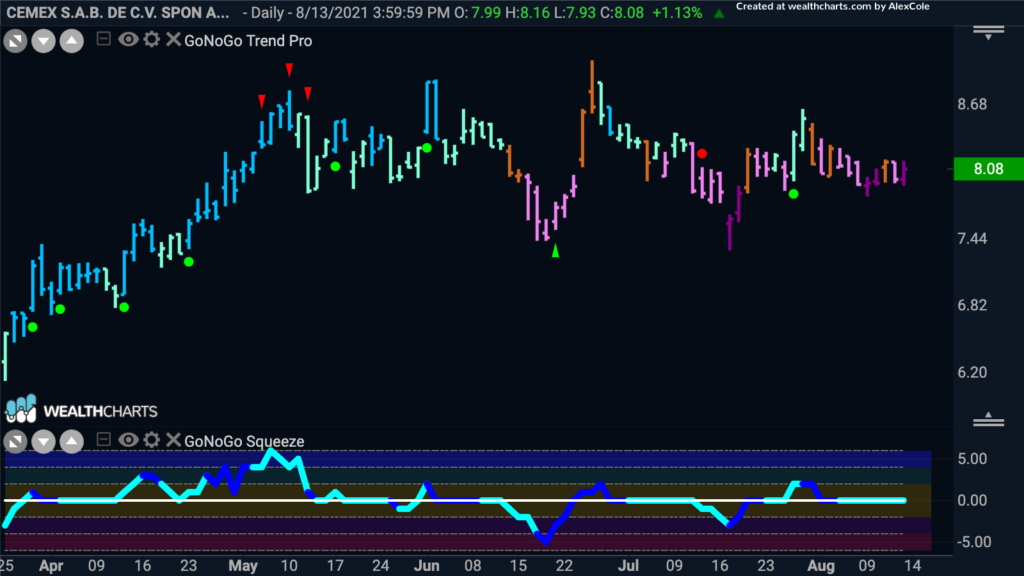
Comfortable with the long term “Go” trend that is in place, we can look at the daily chart to assess possible opportunity to enter the trend. As we saw on the larger time frame chart, there has been sideways consolidation and this looks choppy on the daily chart. After failing to break into positive territory several times already, the GoNoGo Oscillator is riding the zero line from above once again. If the long term “Go” trend is strong, one of these times we will see the oscillator significantly break into positive territory and price will try again to set a new high. We will watch to see if this is the time.
Financials look Favorable
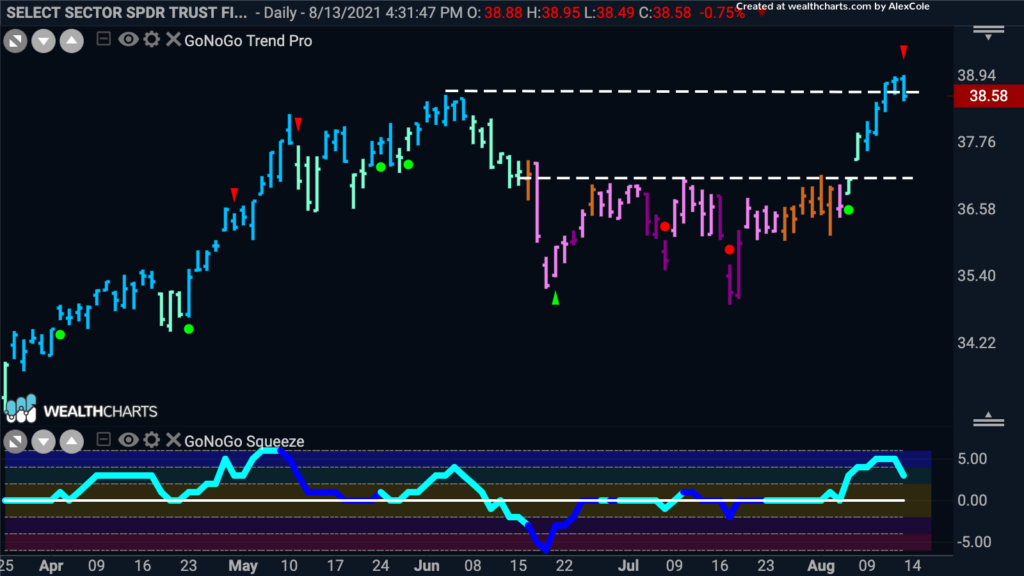
The financials sector is another showing leadership when we look at the GoNoGo Sector RelMap. The chart has similarities with the materials sector chart. There has been a relatively strong “NoGo” correction and during that correction the GoNoGo Oscillator was generally at or below zero. The last week of August saw the oscillator ride the zero line as the GoNoGo Trend painted a series of amber “Go Fish” bars. This signaled uncertainty and directionless price movement. This was followed by the GoNoGo Oscillator strongly breaking into positive territory and then the GoNoGo Trend confirmed by identifying a new “Go” trend. The last week saw stronger blue “Go” bars as price edged higher than its prior high. We will look to see if price can consolidate at or above these levels and move higher.
Rocket About to Take Off?
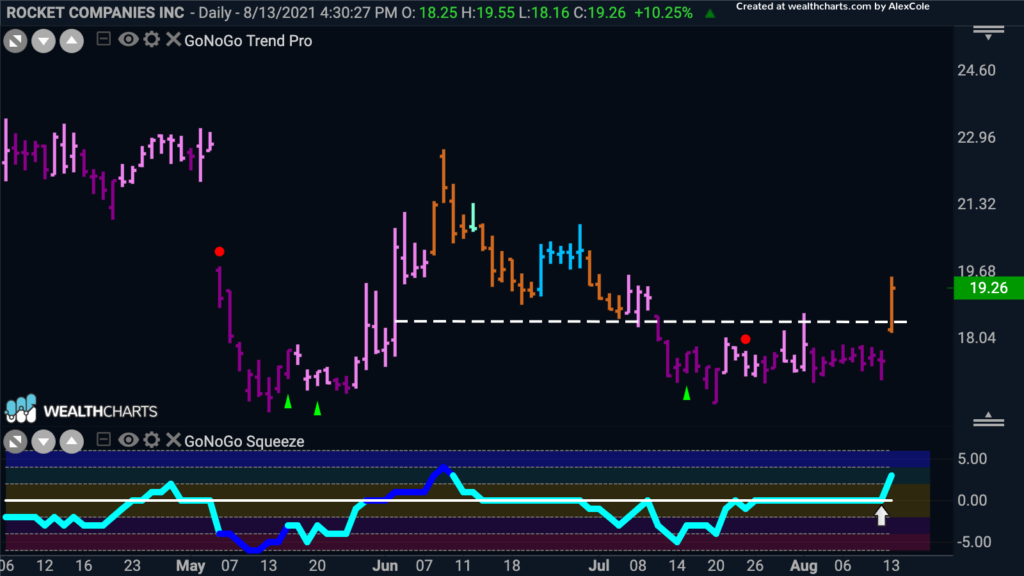
Let’s take a look within the sector for a single stock opportunity. Below is the daily GoNoGo Chart of Rocket Companies Inc. The stock has struggled of late, spending much of the last several months with the GoNoGo Trend painting NoGo bars. Let’s think of the saying “a rising tide lifts all ships” and see if there are any signs of bullish price action on the horizon. The GoNoGo Oscillator spent several bars riding the zero line recently and if the “NoGo” trend was healthy we know that it should have been turned away back into negative territory. It was not, we can see that the oscillator has burst into positive territory. Coinciding with that we see the GoNoGo Trend indicator painting its first amber “Go Fish” bar in several weeks. Friday’s strong price action also saw a break of resistance. We will need to see the oscillator stay in positive territory and then wait for the GoNoGo Trend to confirm by painting “Go” colors. If that happens then we will expect price to rally and try to set a new high.
