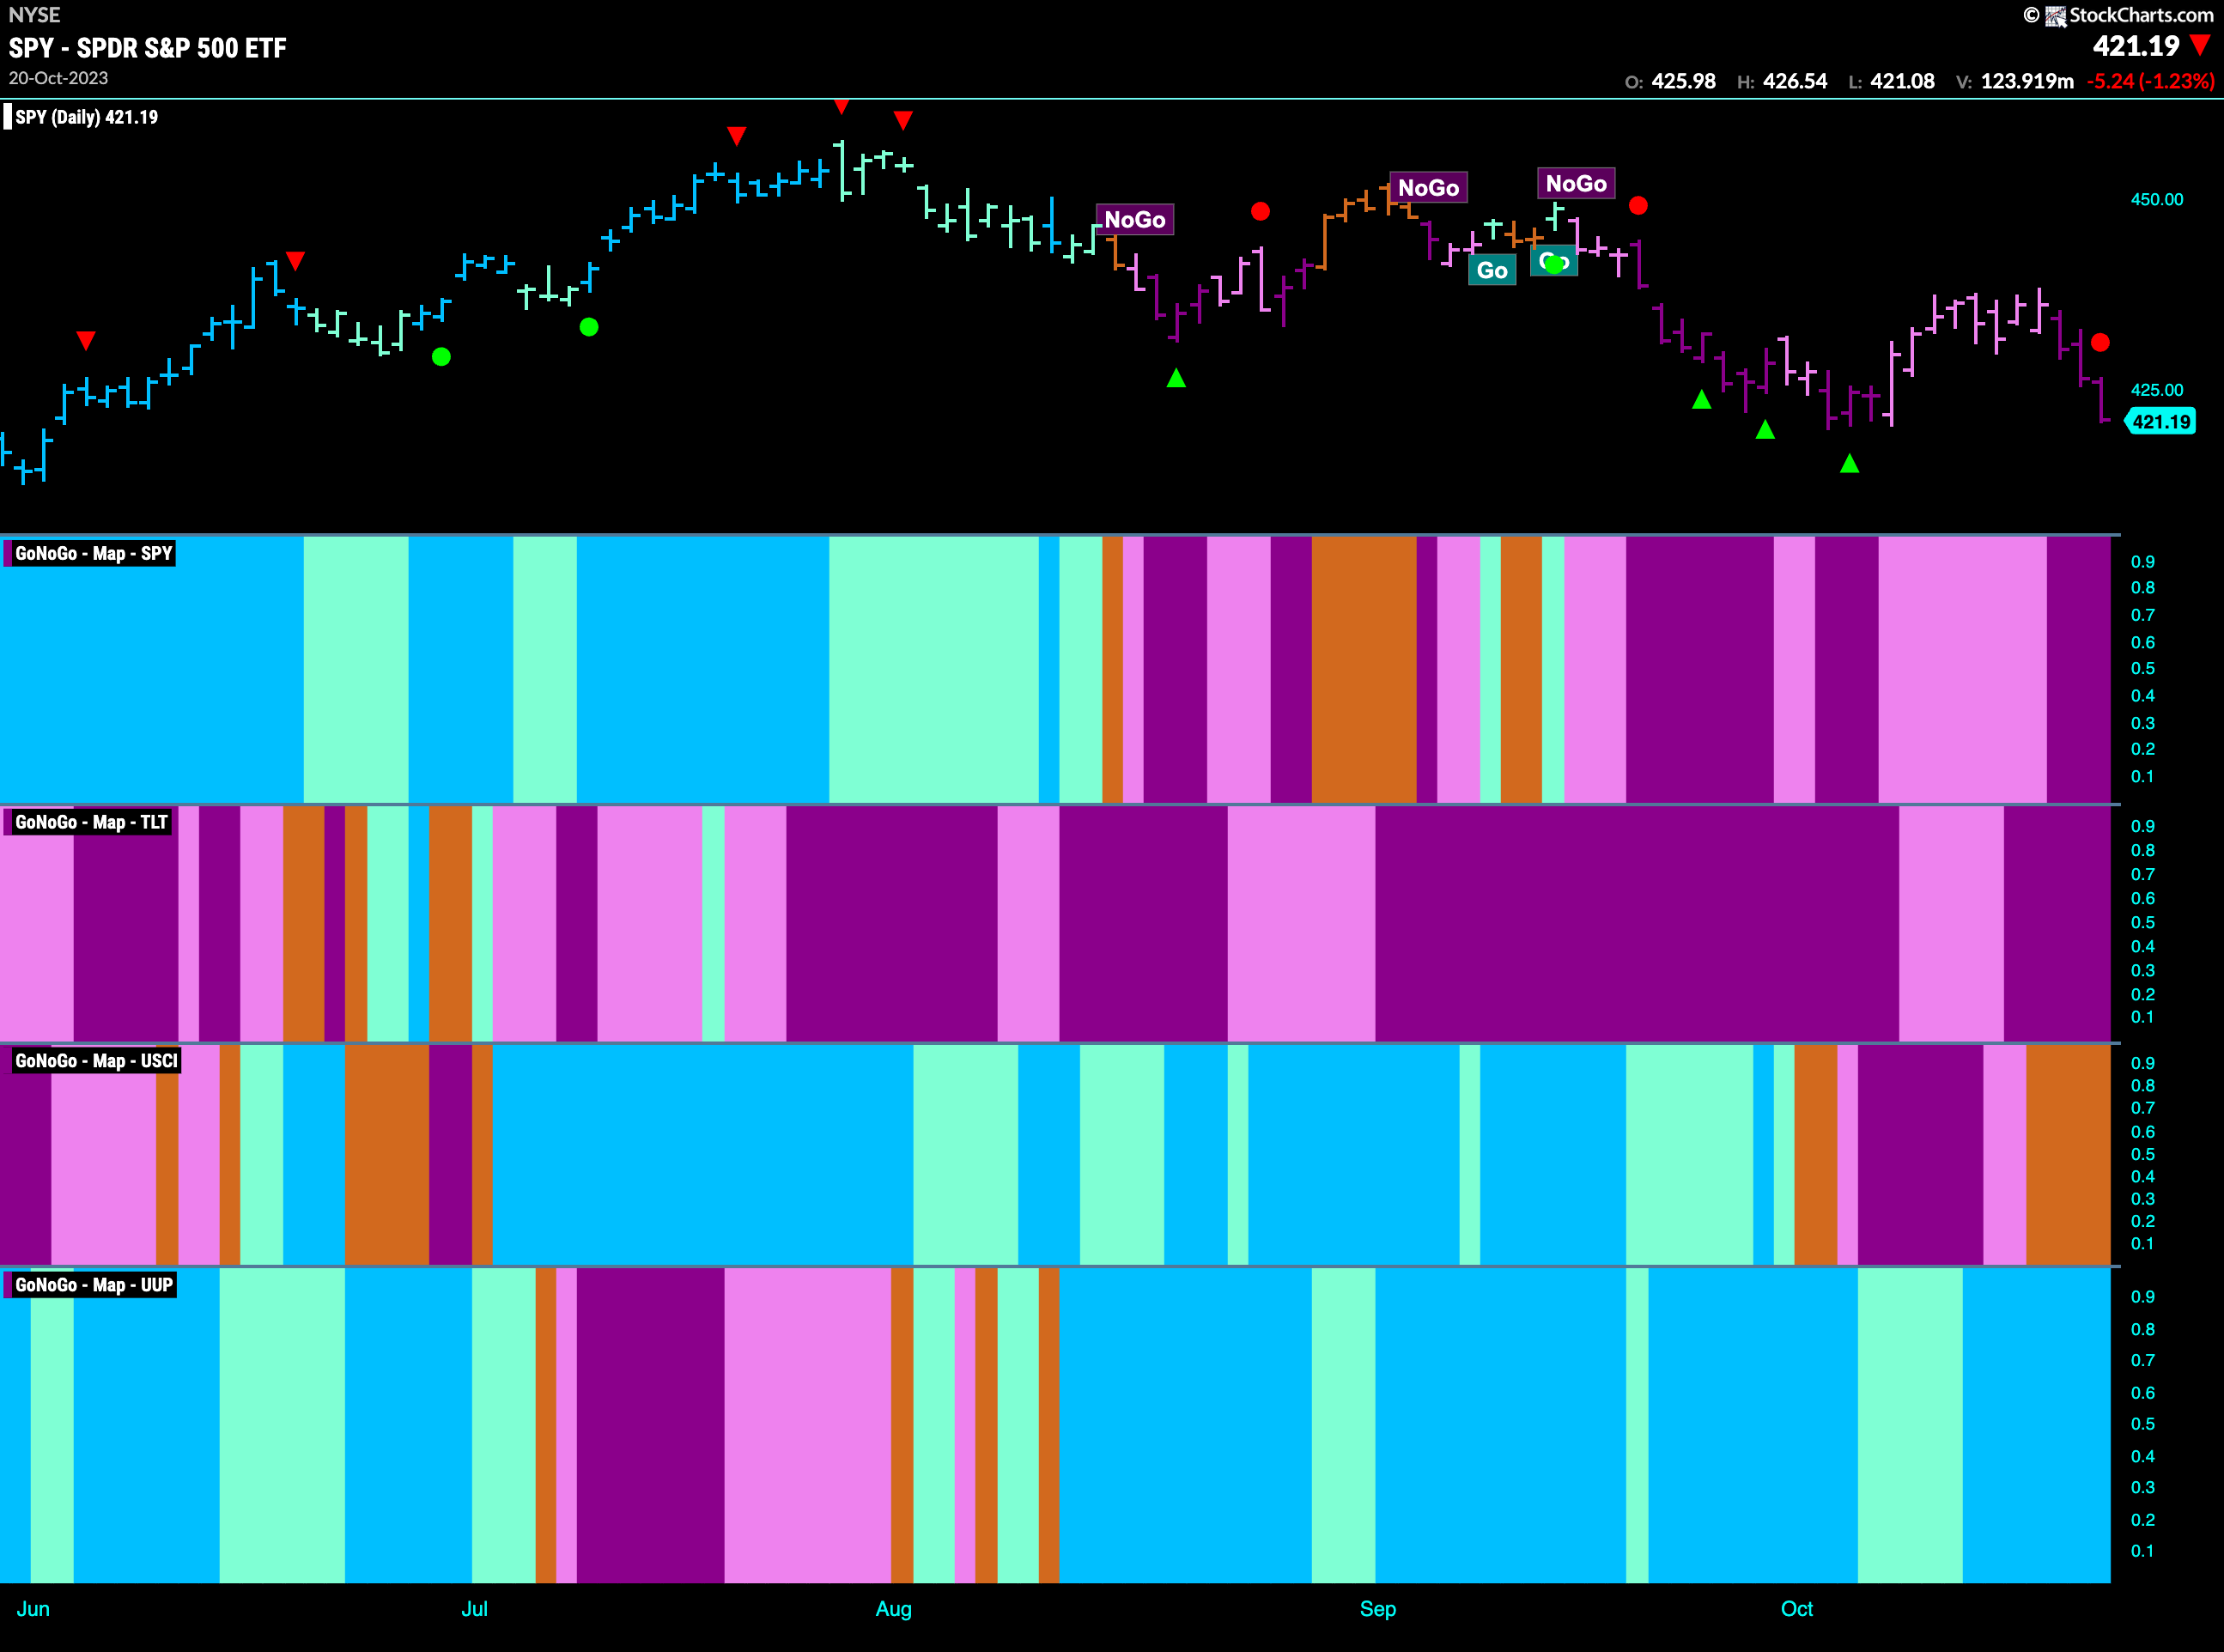
Good morning and welcome to this week’s Flight Path. The “NoGO” continued this past week after starting the week strong we saw price roll over and GoNoGo Trend painted stronger purple bars. Treasury bond prices did nothing to impress either as we see the continued to paint strong purple bars as well. The commodity index showed some uncertainty as it sees a couple of amber “Go Fish” bars. This tells us that not enough criteria were hit to allow the indicator to find a trend in either direction. The dollar (last panel) remained in strong “Go” trend again this week.
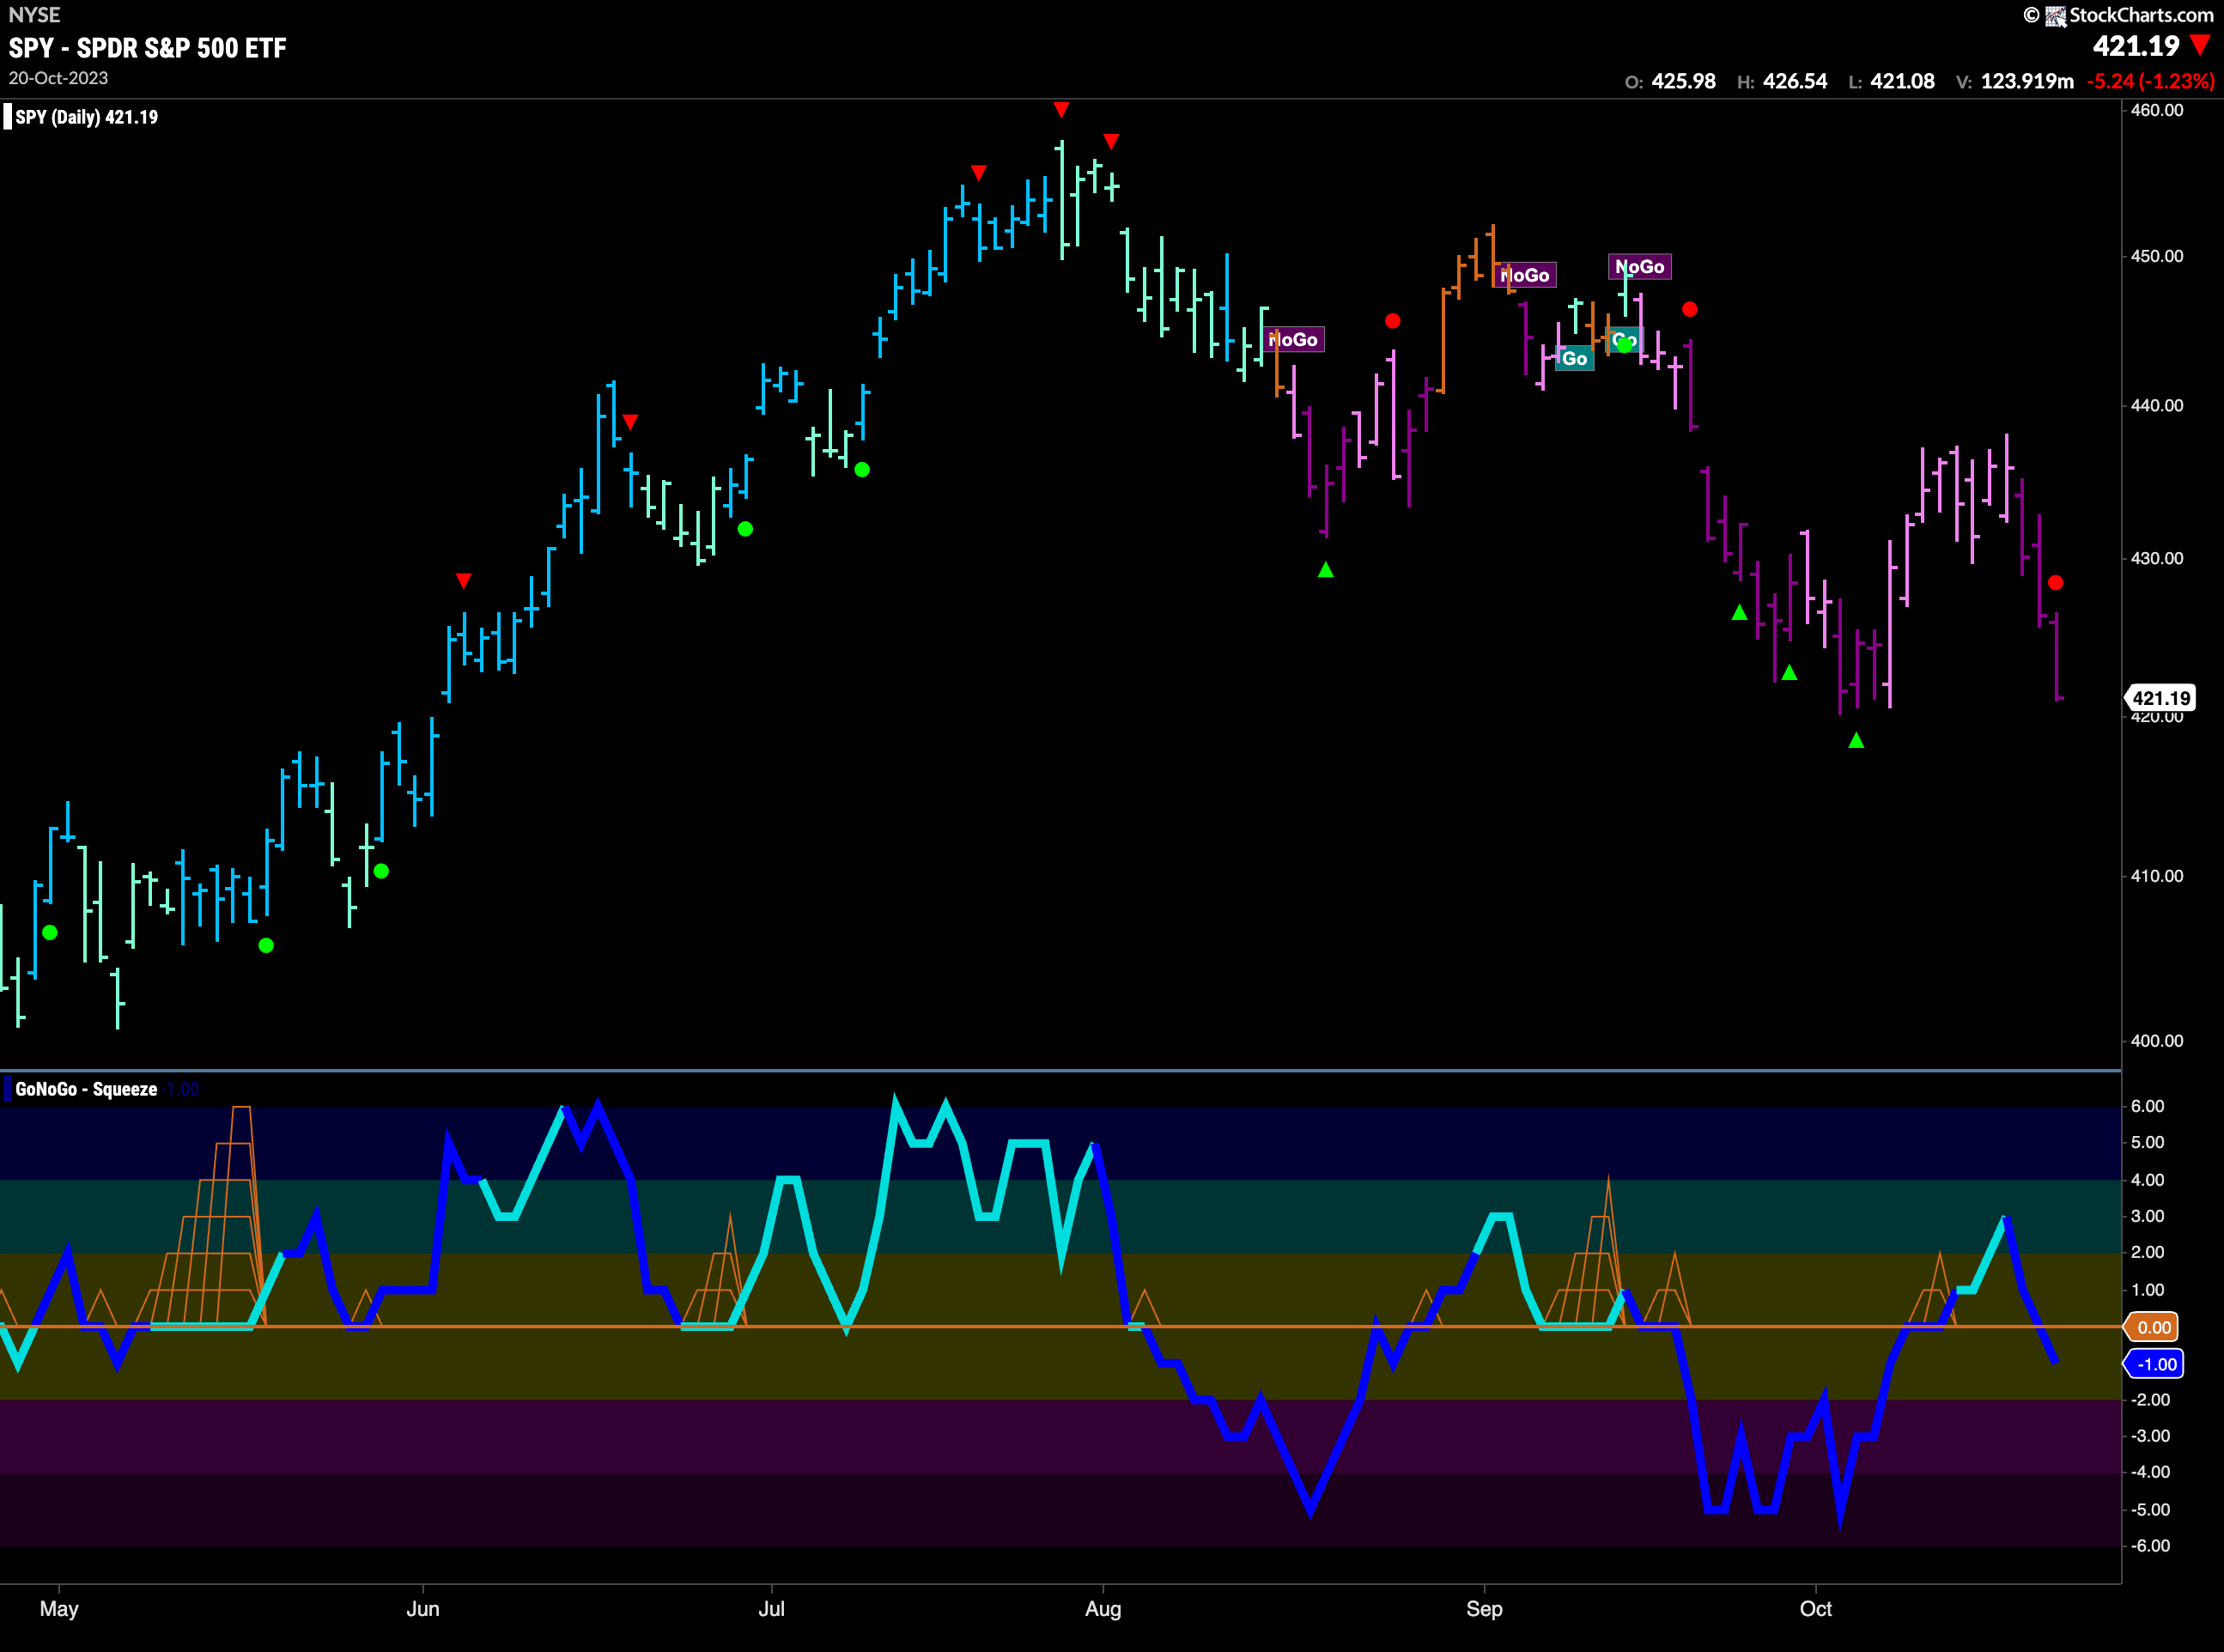
“NoGo” Strengthens as Price Re-tests Lows
GoNoGo Trend painted strong purple bars as price fell to touch lows from a few weeks ago. As price moved lower, GoNoGo Oscillator crashed back through the zero line into negative territory. This tells us that momentum is back in the direction of the “NoGo” trend having briefly turned positive. This is reflected in the chart as we see a NoGo Trend Continuation Icon (red circle) above the price bar suggesting that resurgent momentum could push price lower. We will watch to see if price can set a new lower low. Volume is heavy as the oscillator has moved to darker blue.
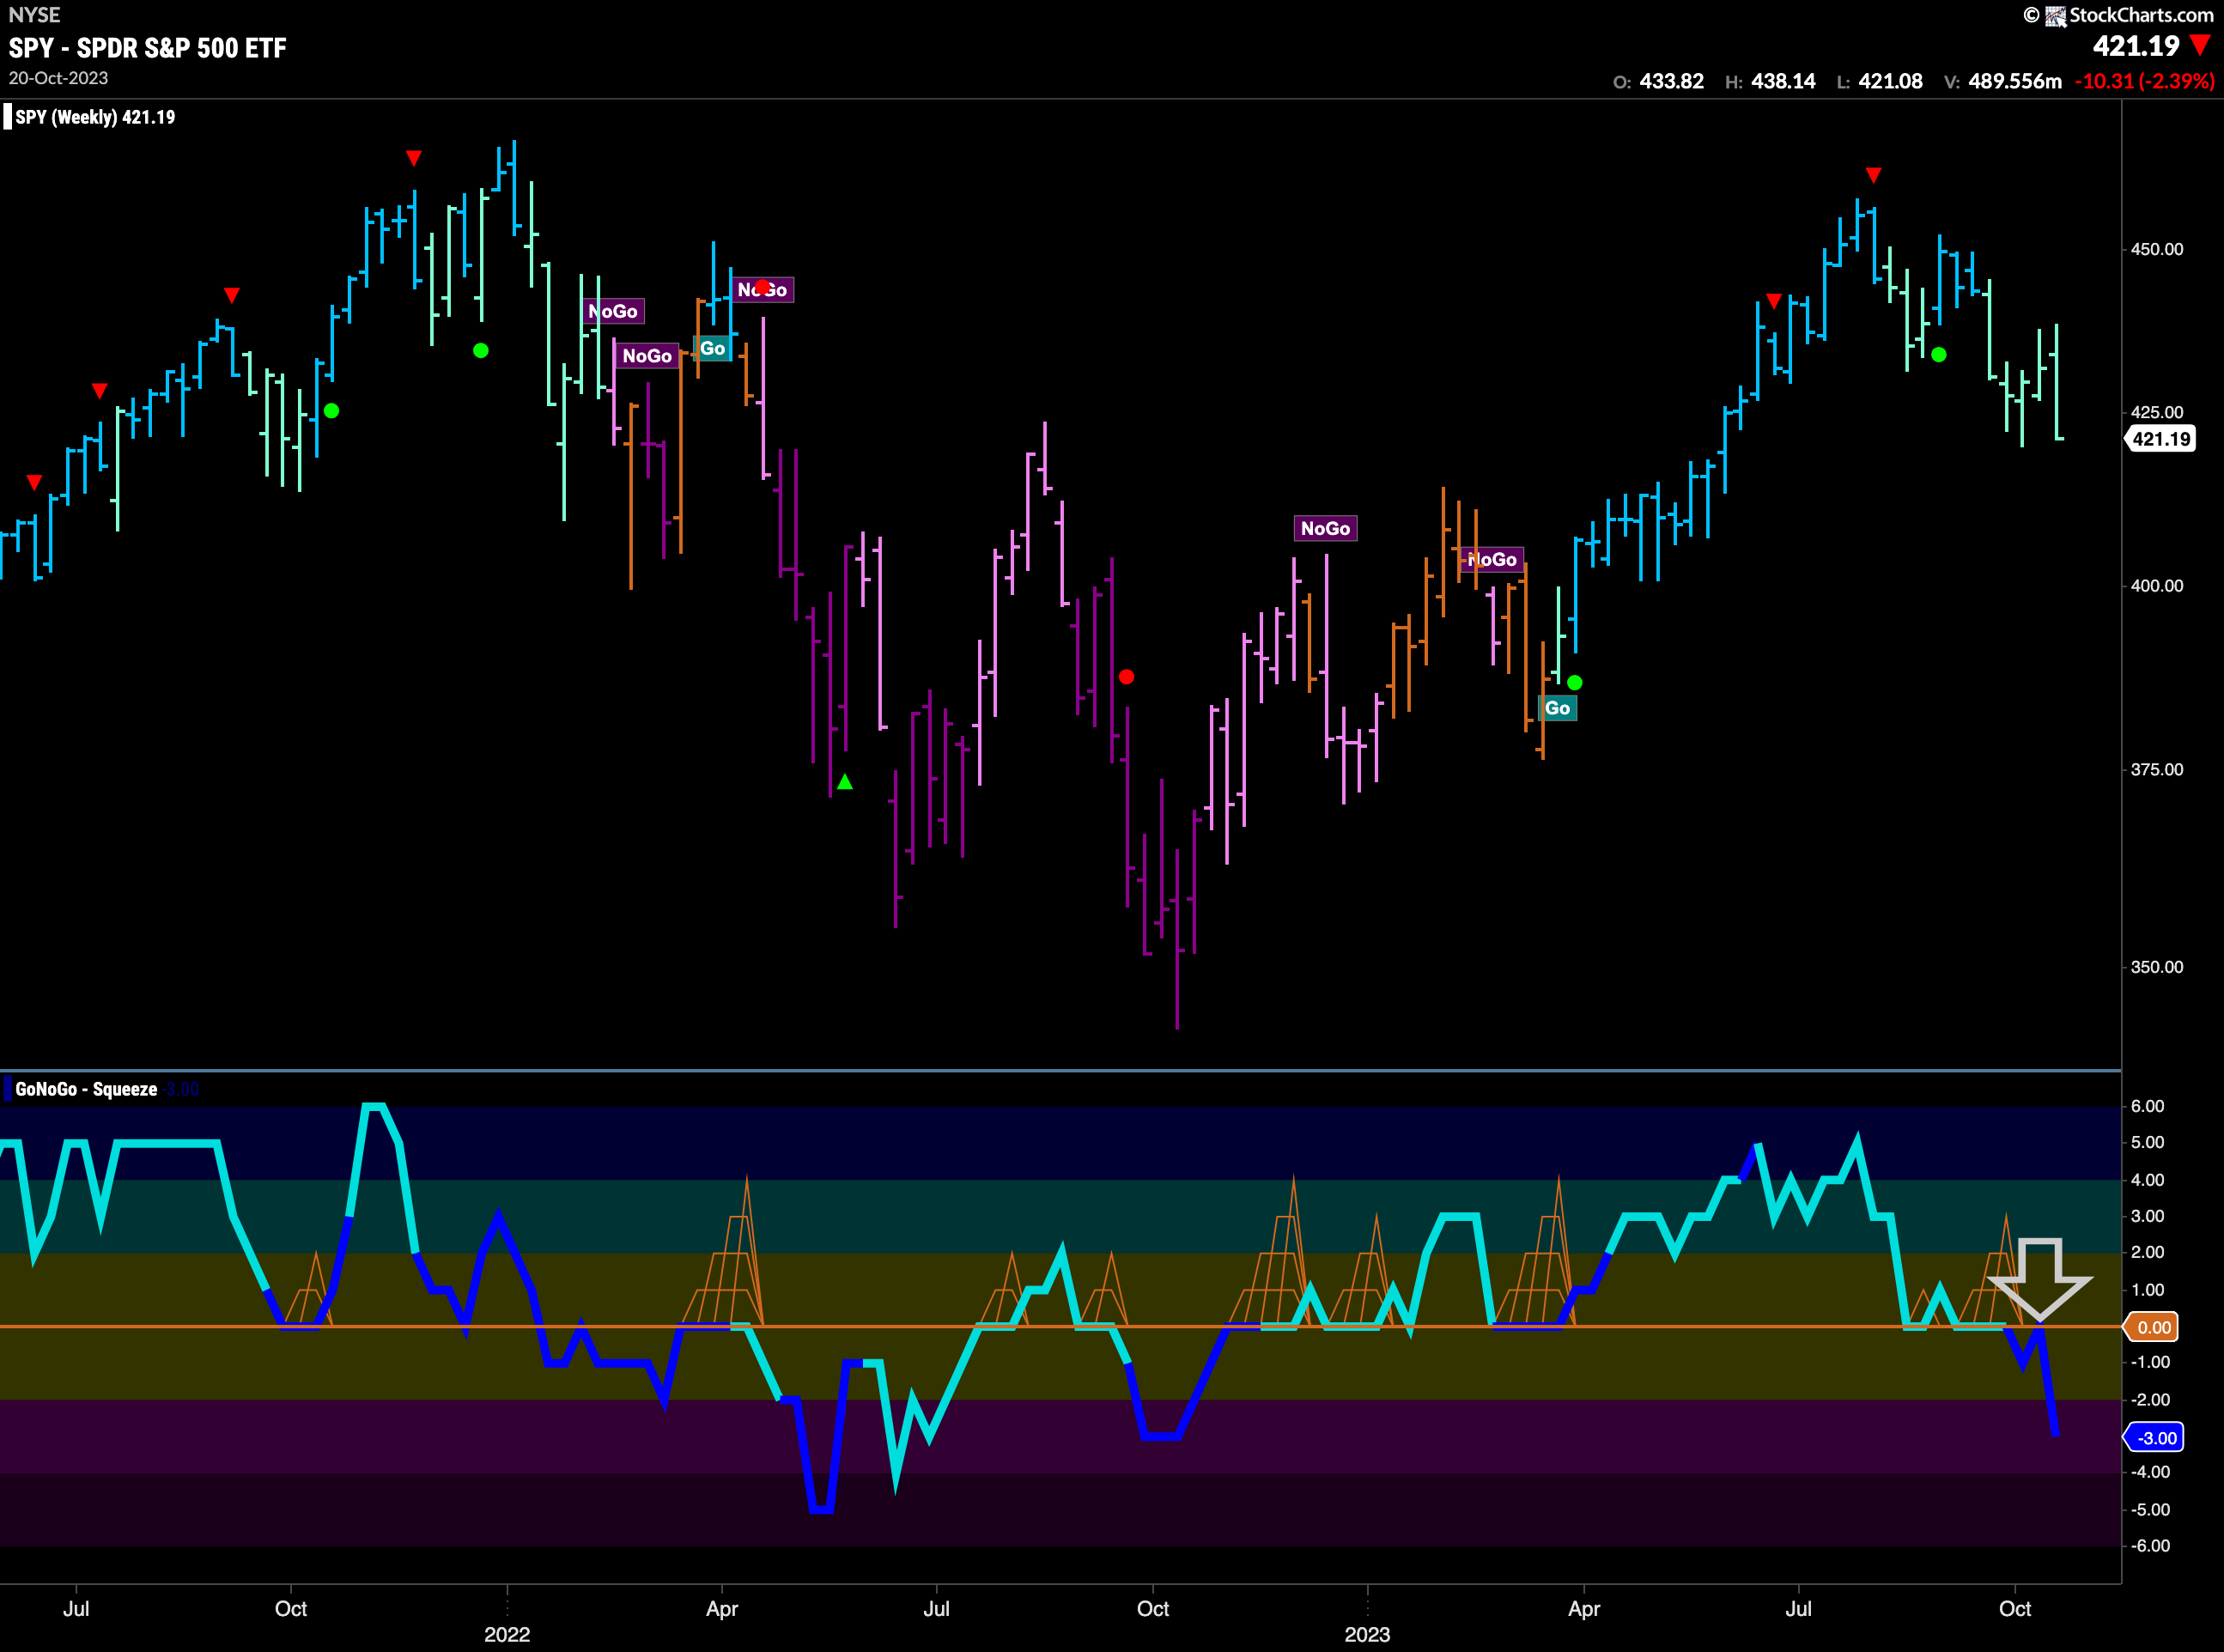
The longer term weekly chart shows that we have tested the zero line from below and failed. The zero line has rejected the oscillator and sent it back into negative territory with heavy market participation. This is a concern for the “Go” trend that we see in this time frame. Already painting weaker aqua bars, we will watch to see if the negative momentum is enough to flag a change in trend in the price chart.
Treasury Rates Barely Slow Down
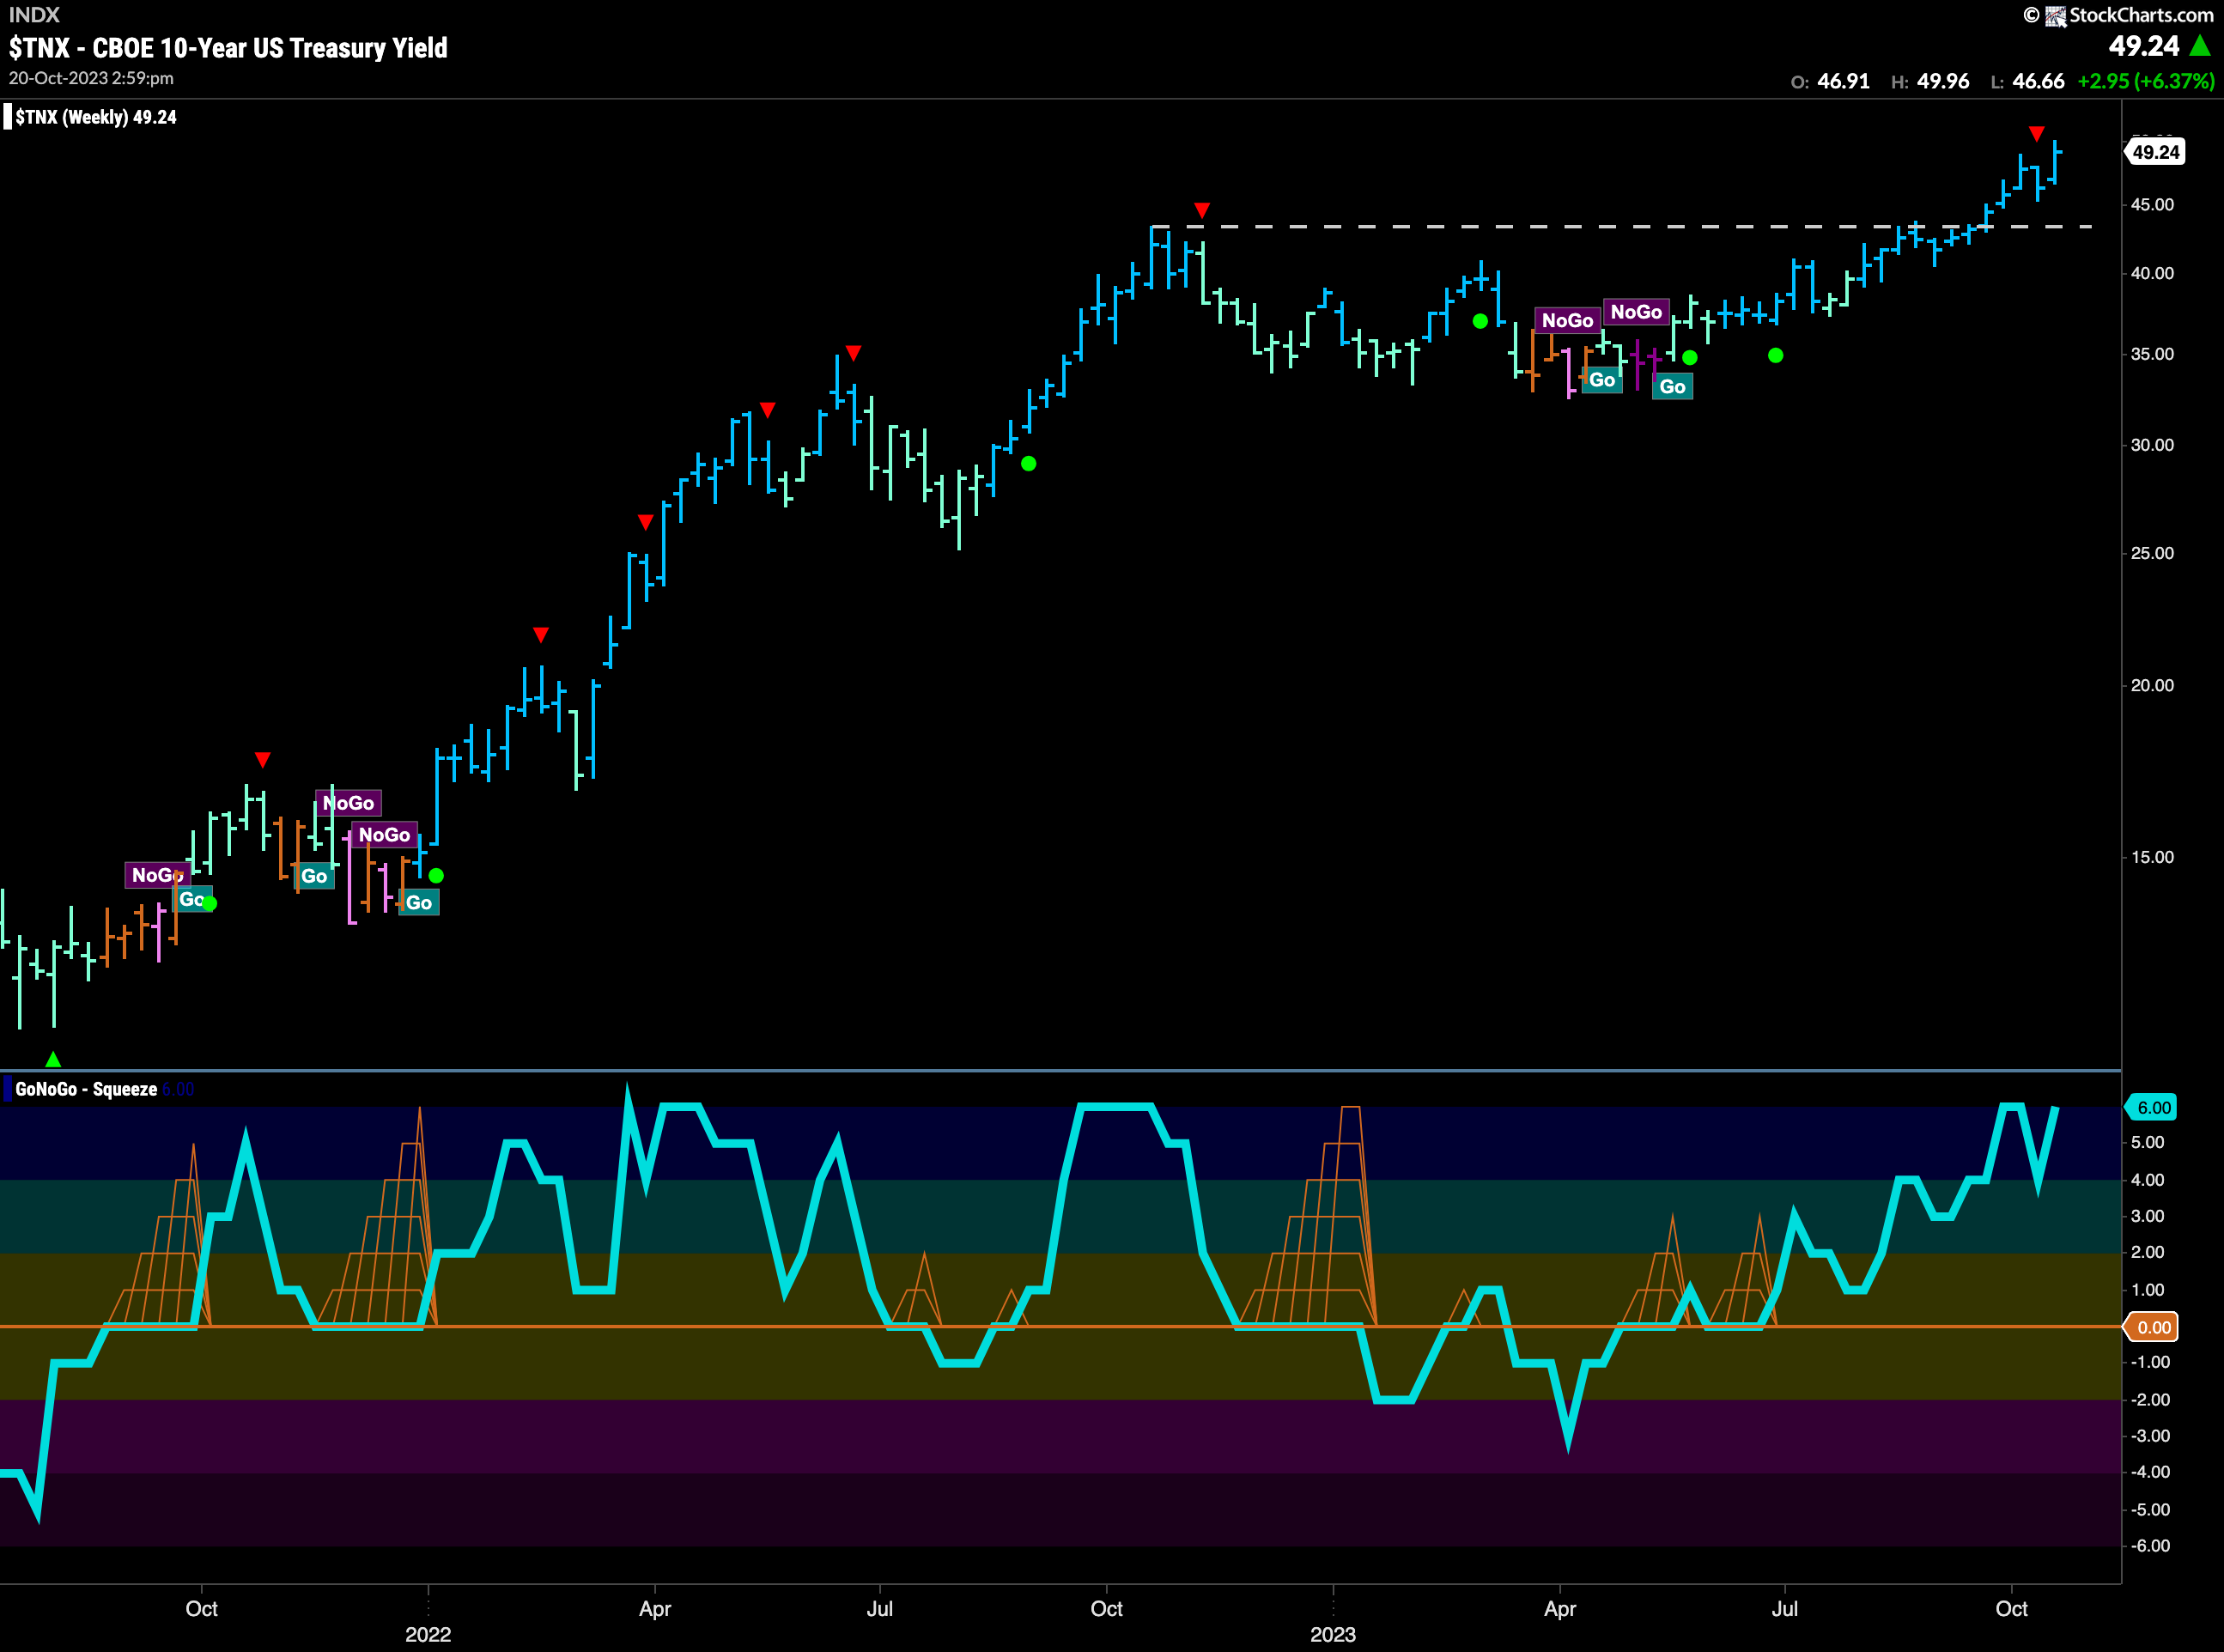
The waning momentum we saw last week on the larger time frame chart didn’t last long as price rose this week to set another higher high and ignore the Countertrend Correction Icon (red arrow) we noted last week. GoNoGo Trend is painting strong blue “Go” bars and GoNoGo Oscillator has moved back into extreme overbought territory. We will watch to see if this puts further pressure on stocks or if momentum will cool allowing rates to pull back slightly.
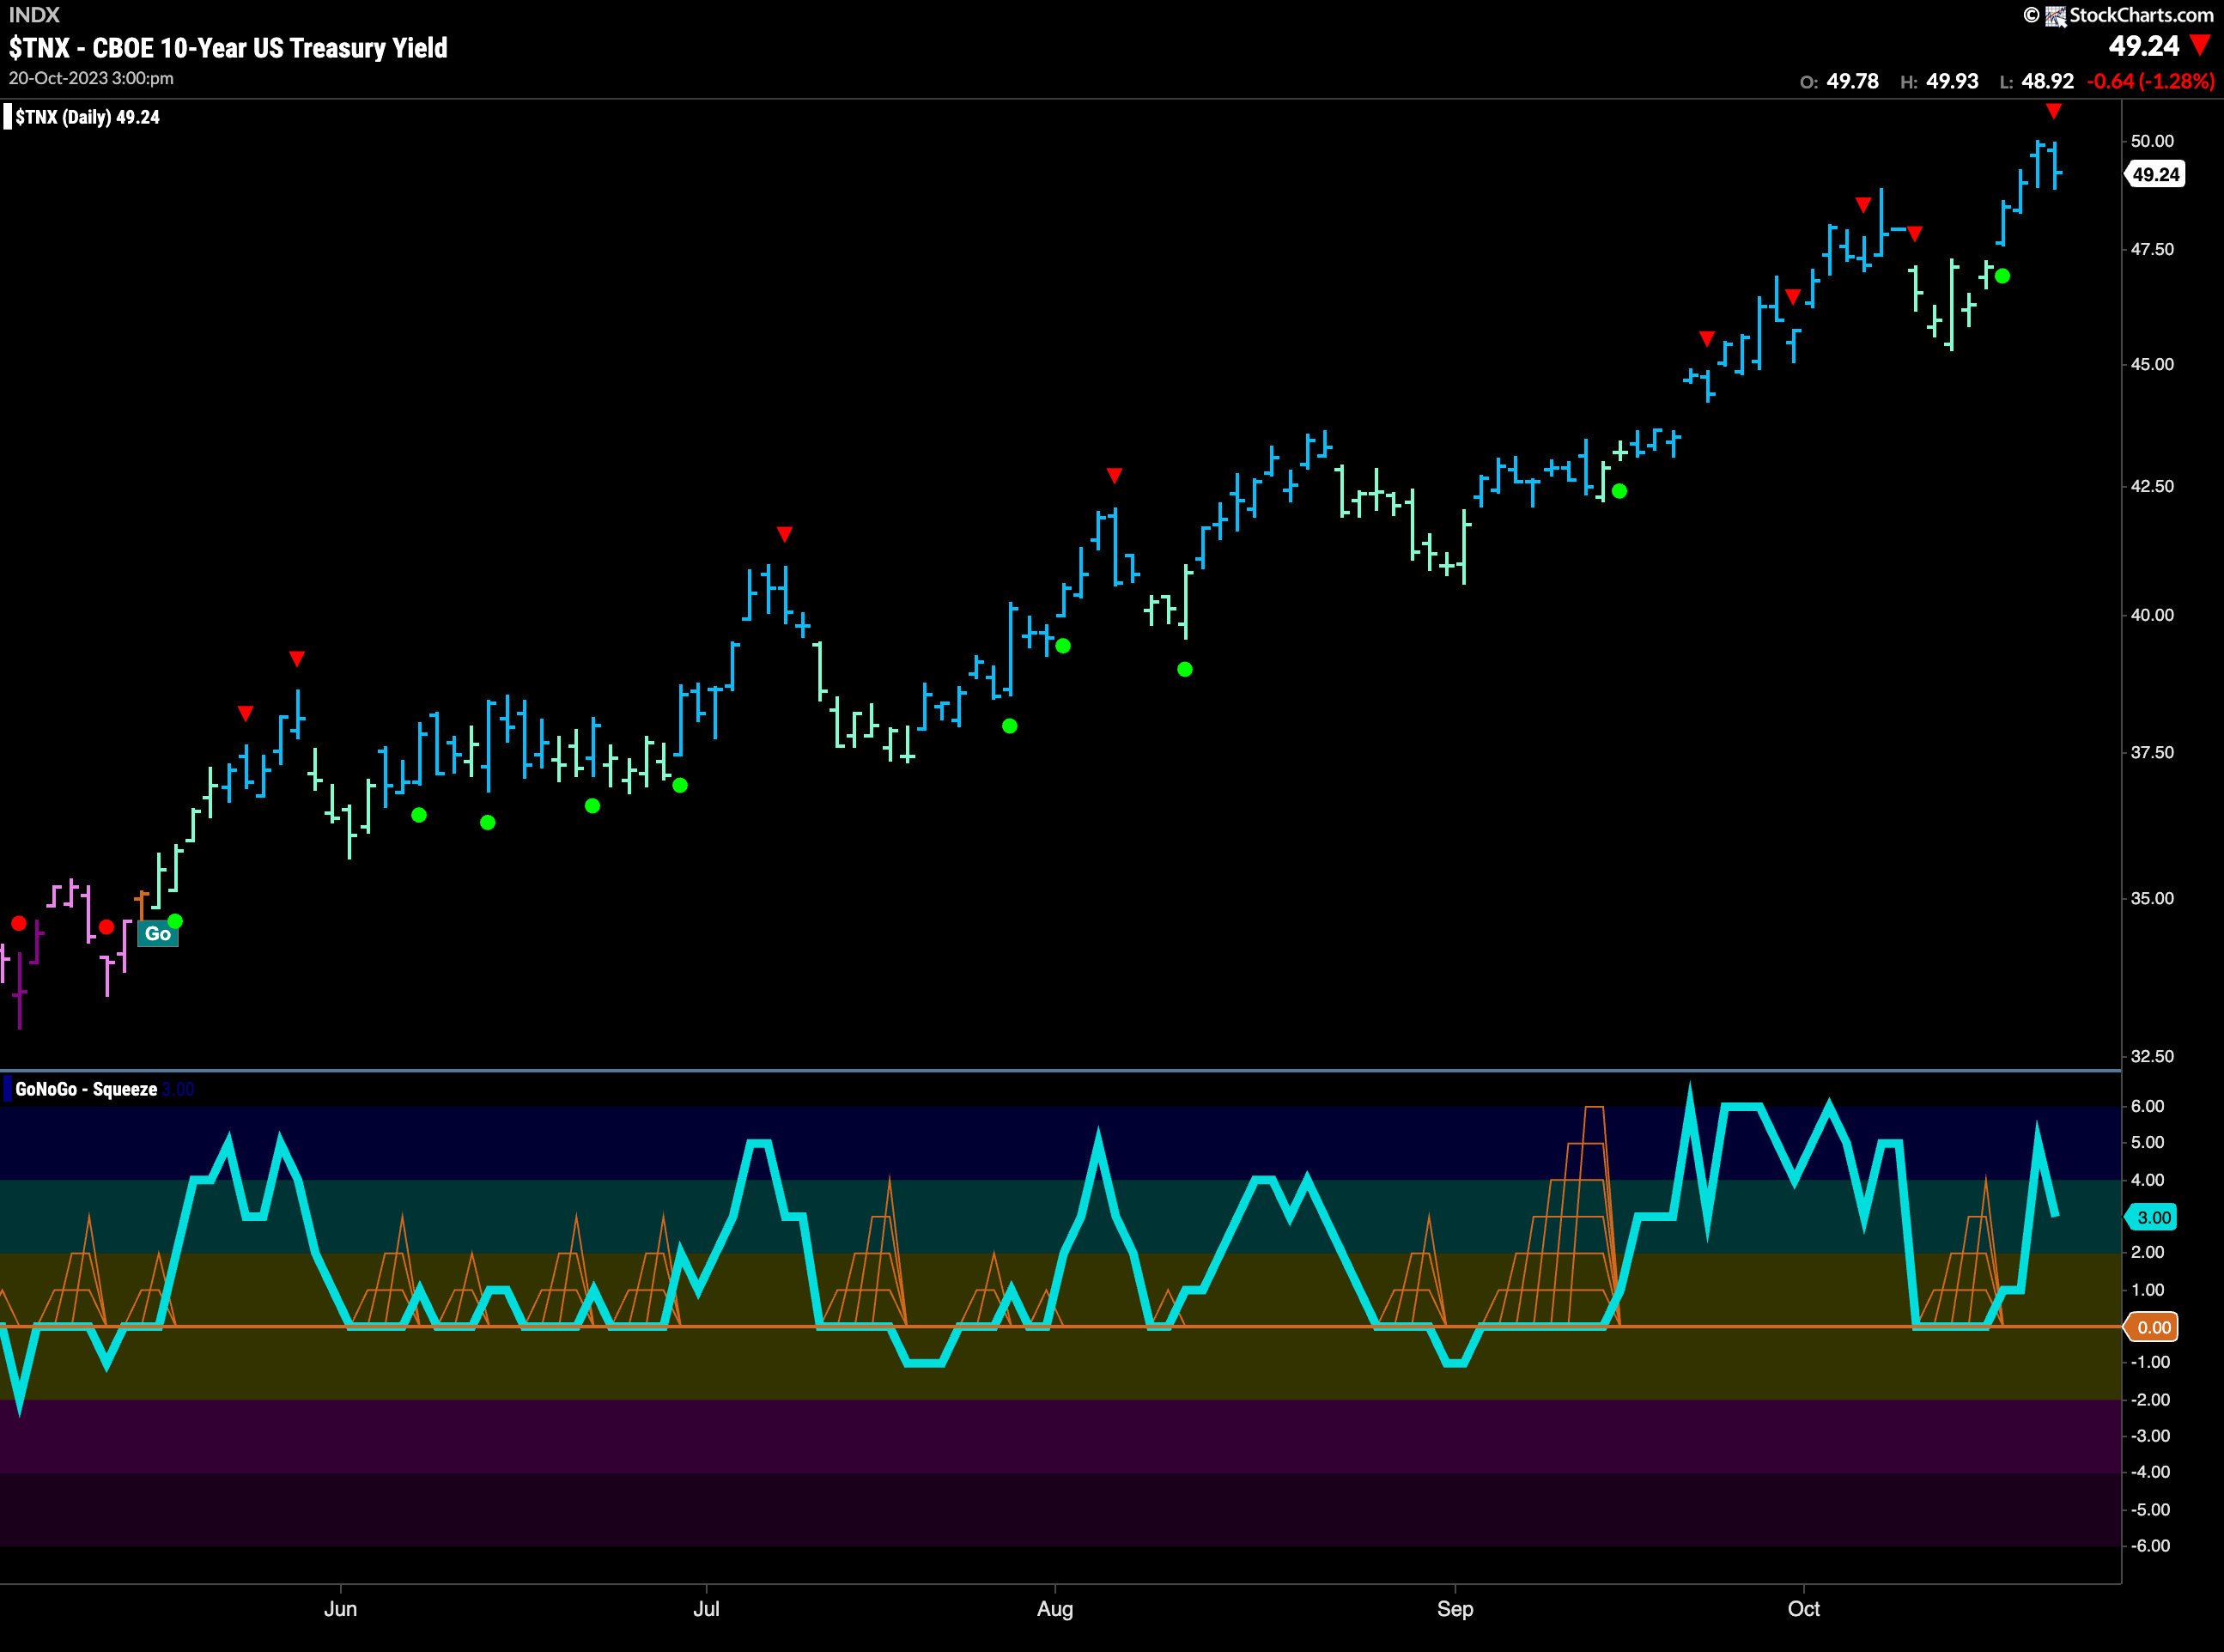
No surprises on the daily chart. GoNoGo Trend paints another strong blue “Go” bar as price made a new higher high this week. GoNoGo Oscillator shows that momentum raced back into positive then overbought territory after finding support at the zero line last week. This triggered a Go Trend Continuation Icon (green circle) on the chart that propelled price higher. With a Go Countertrend Correction Icon (red arrow) on the current bar, we will look to see if there is any respite in the coming days.
Dollar Looks for Continued Support
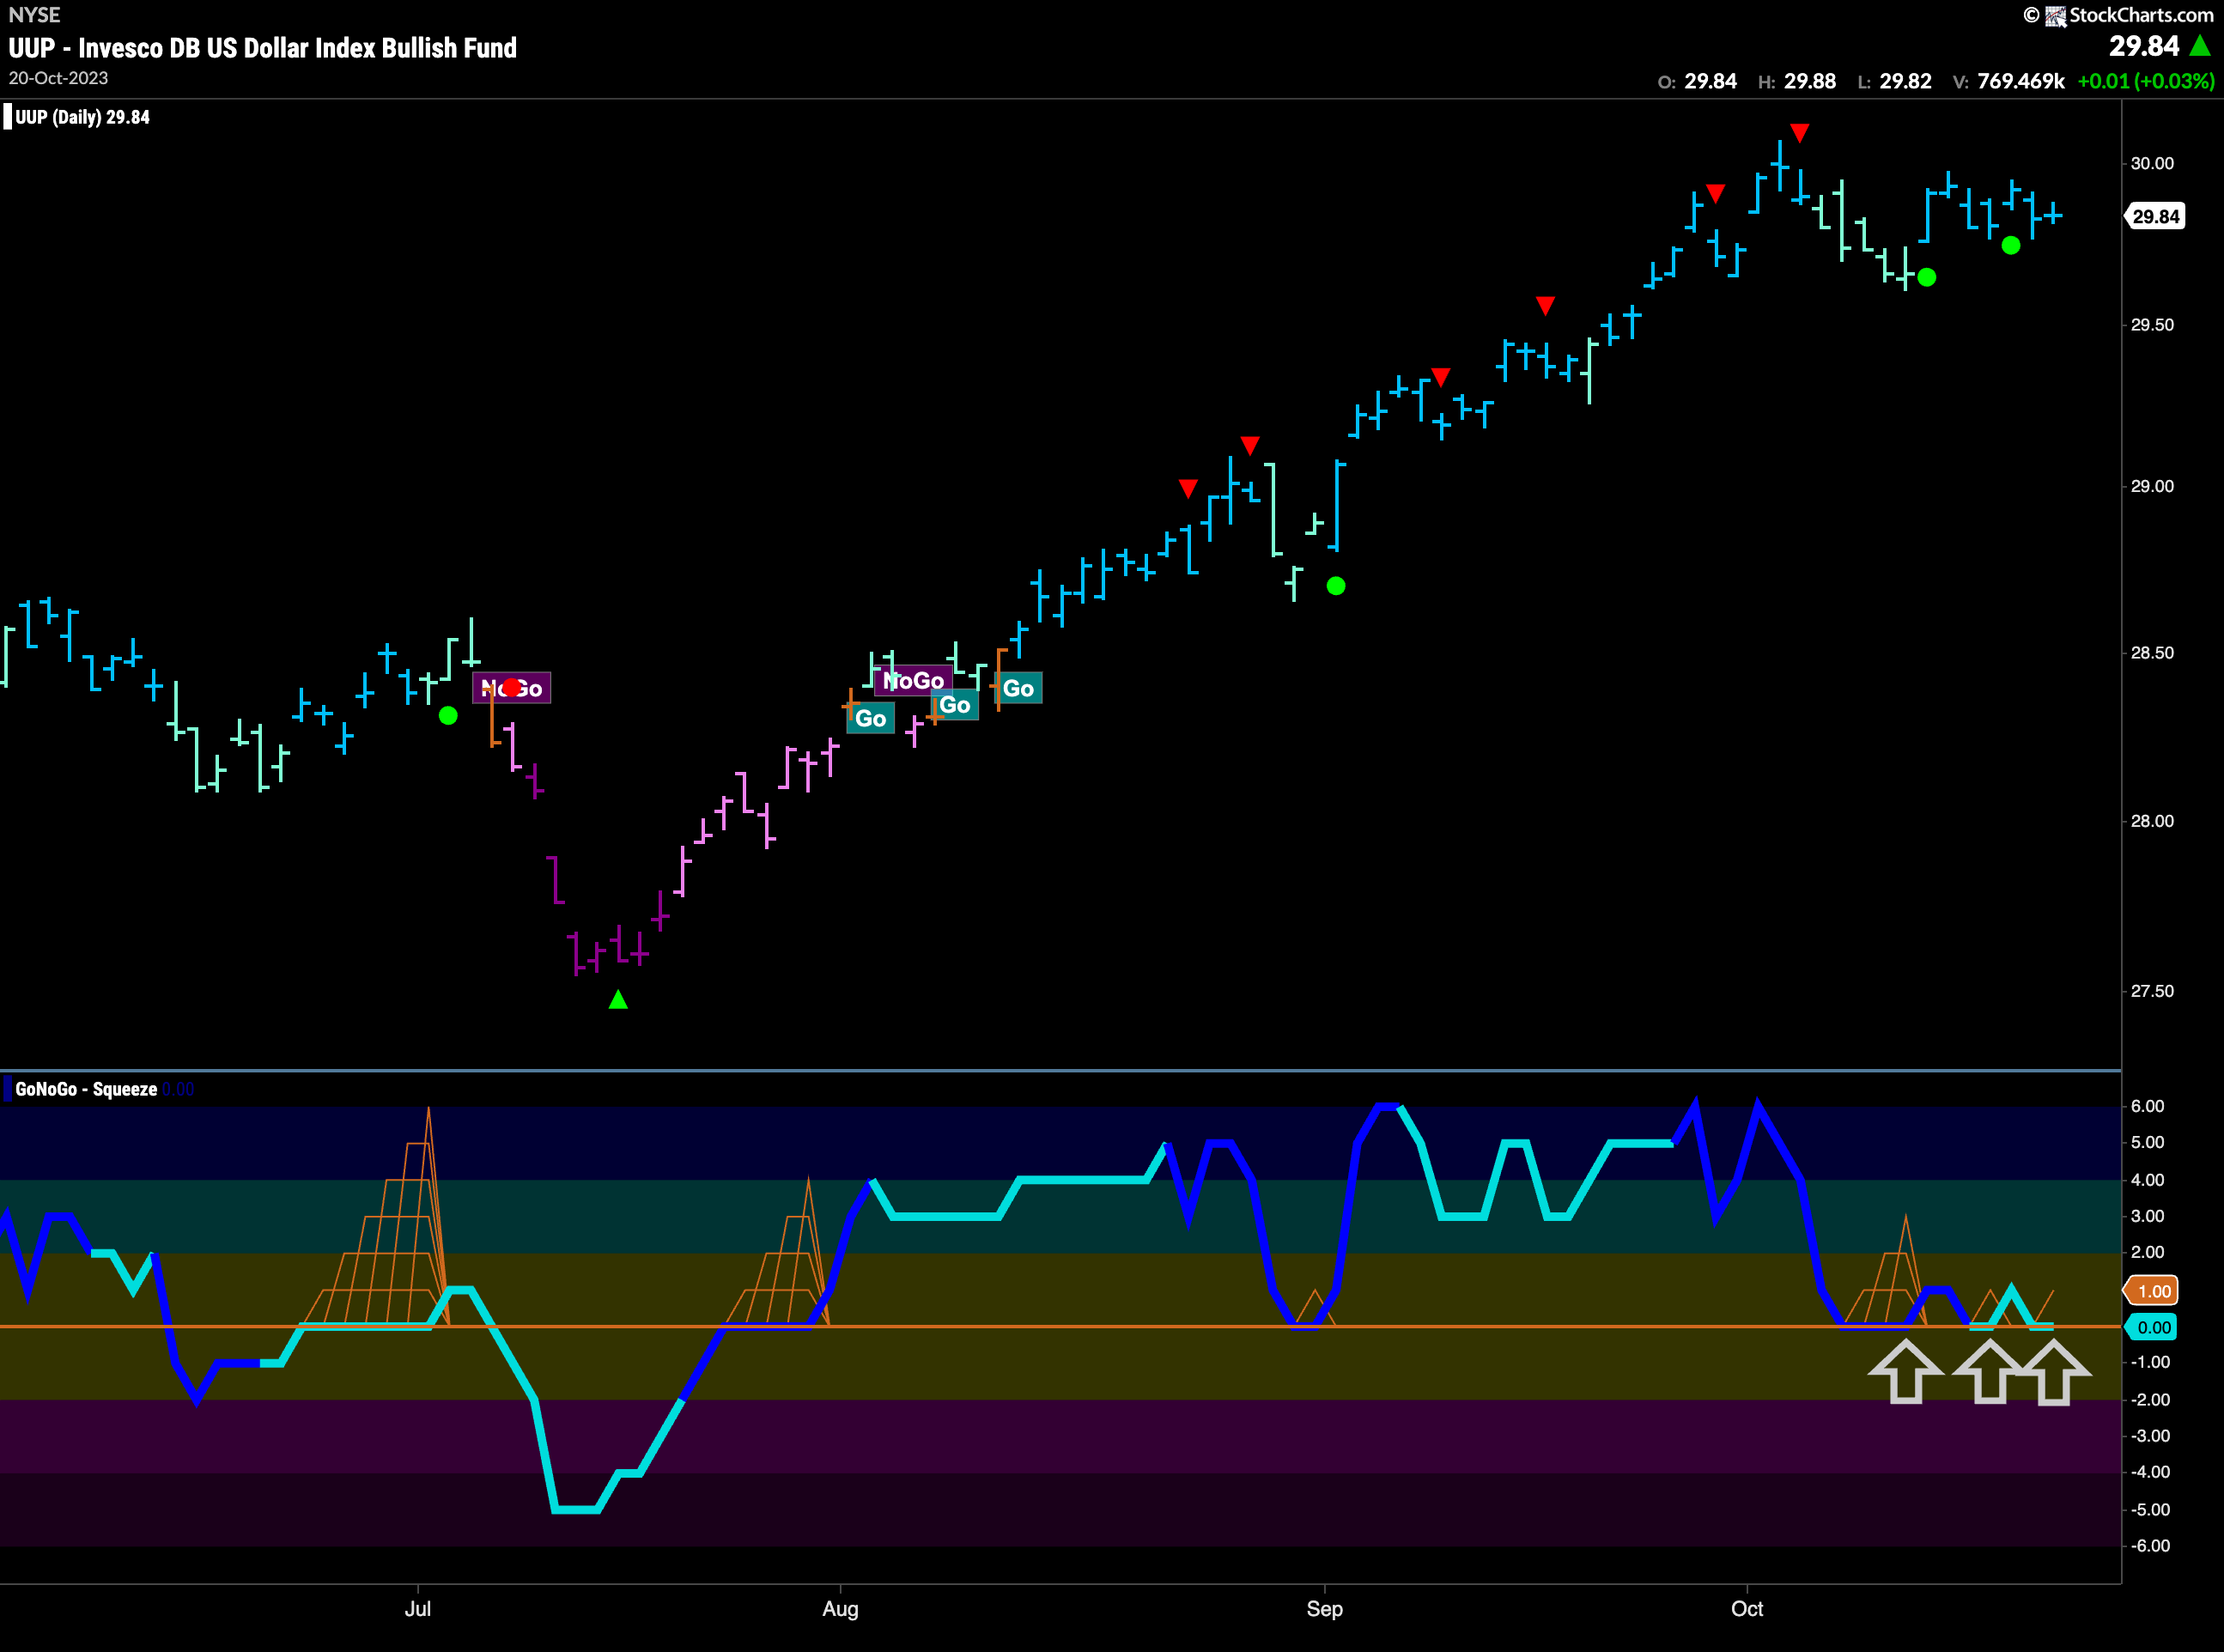
The dollar remains in its “Go” trend and we saw nothing but strong blue bars this week. However, we did not see a new high. Price has moved sideways since the Go Countertrend Correction Icon (red arrow) that we saw at the beginning of the month. This week we saw GoNoGo Oscillator test the zero line again and found temporary support for the second time. We are now right back at that level as price volatility seems to shrink. This will be an important moment. If the oscillator continues to find support and can move further into positive territory we can expect price to mount an attack on a new high. If the oscillator fails at that level, it will be a concern for the “Go” trend.
Oil Resumes “Go” Tred
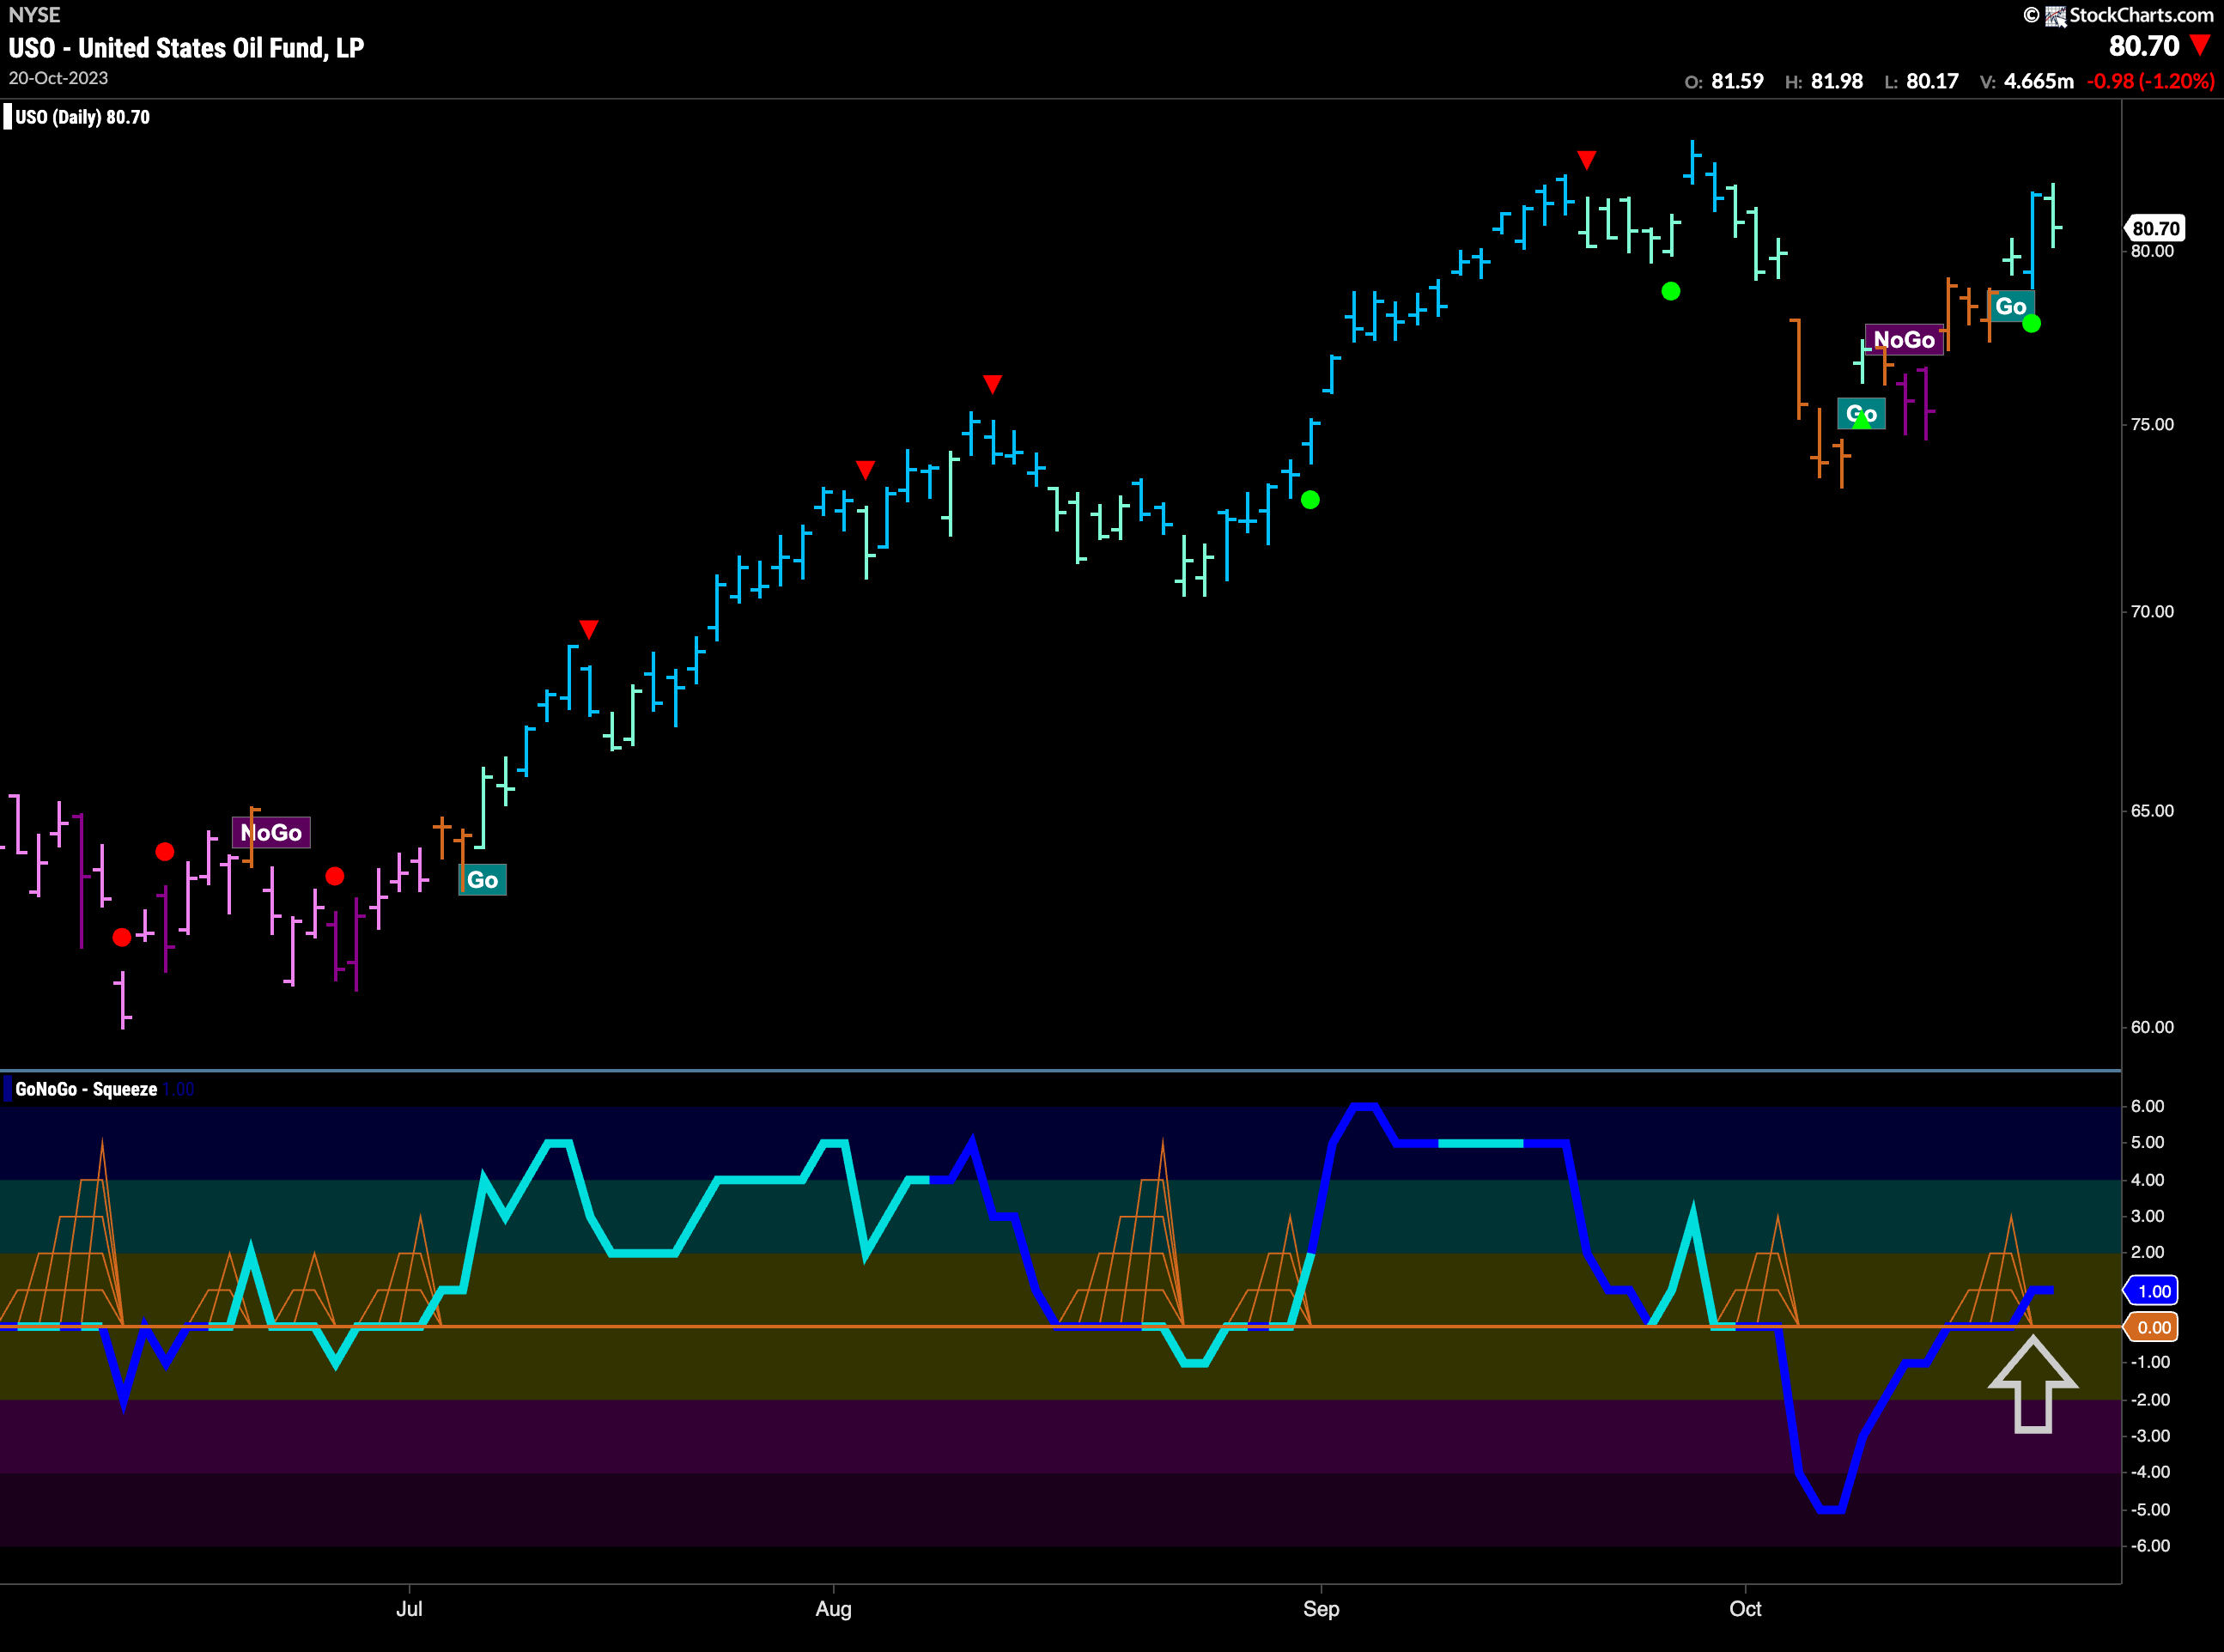
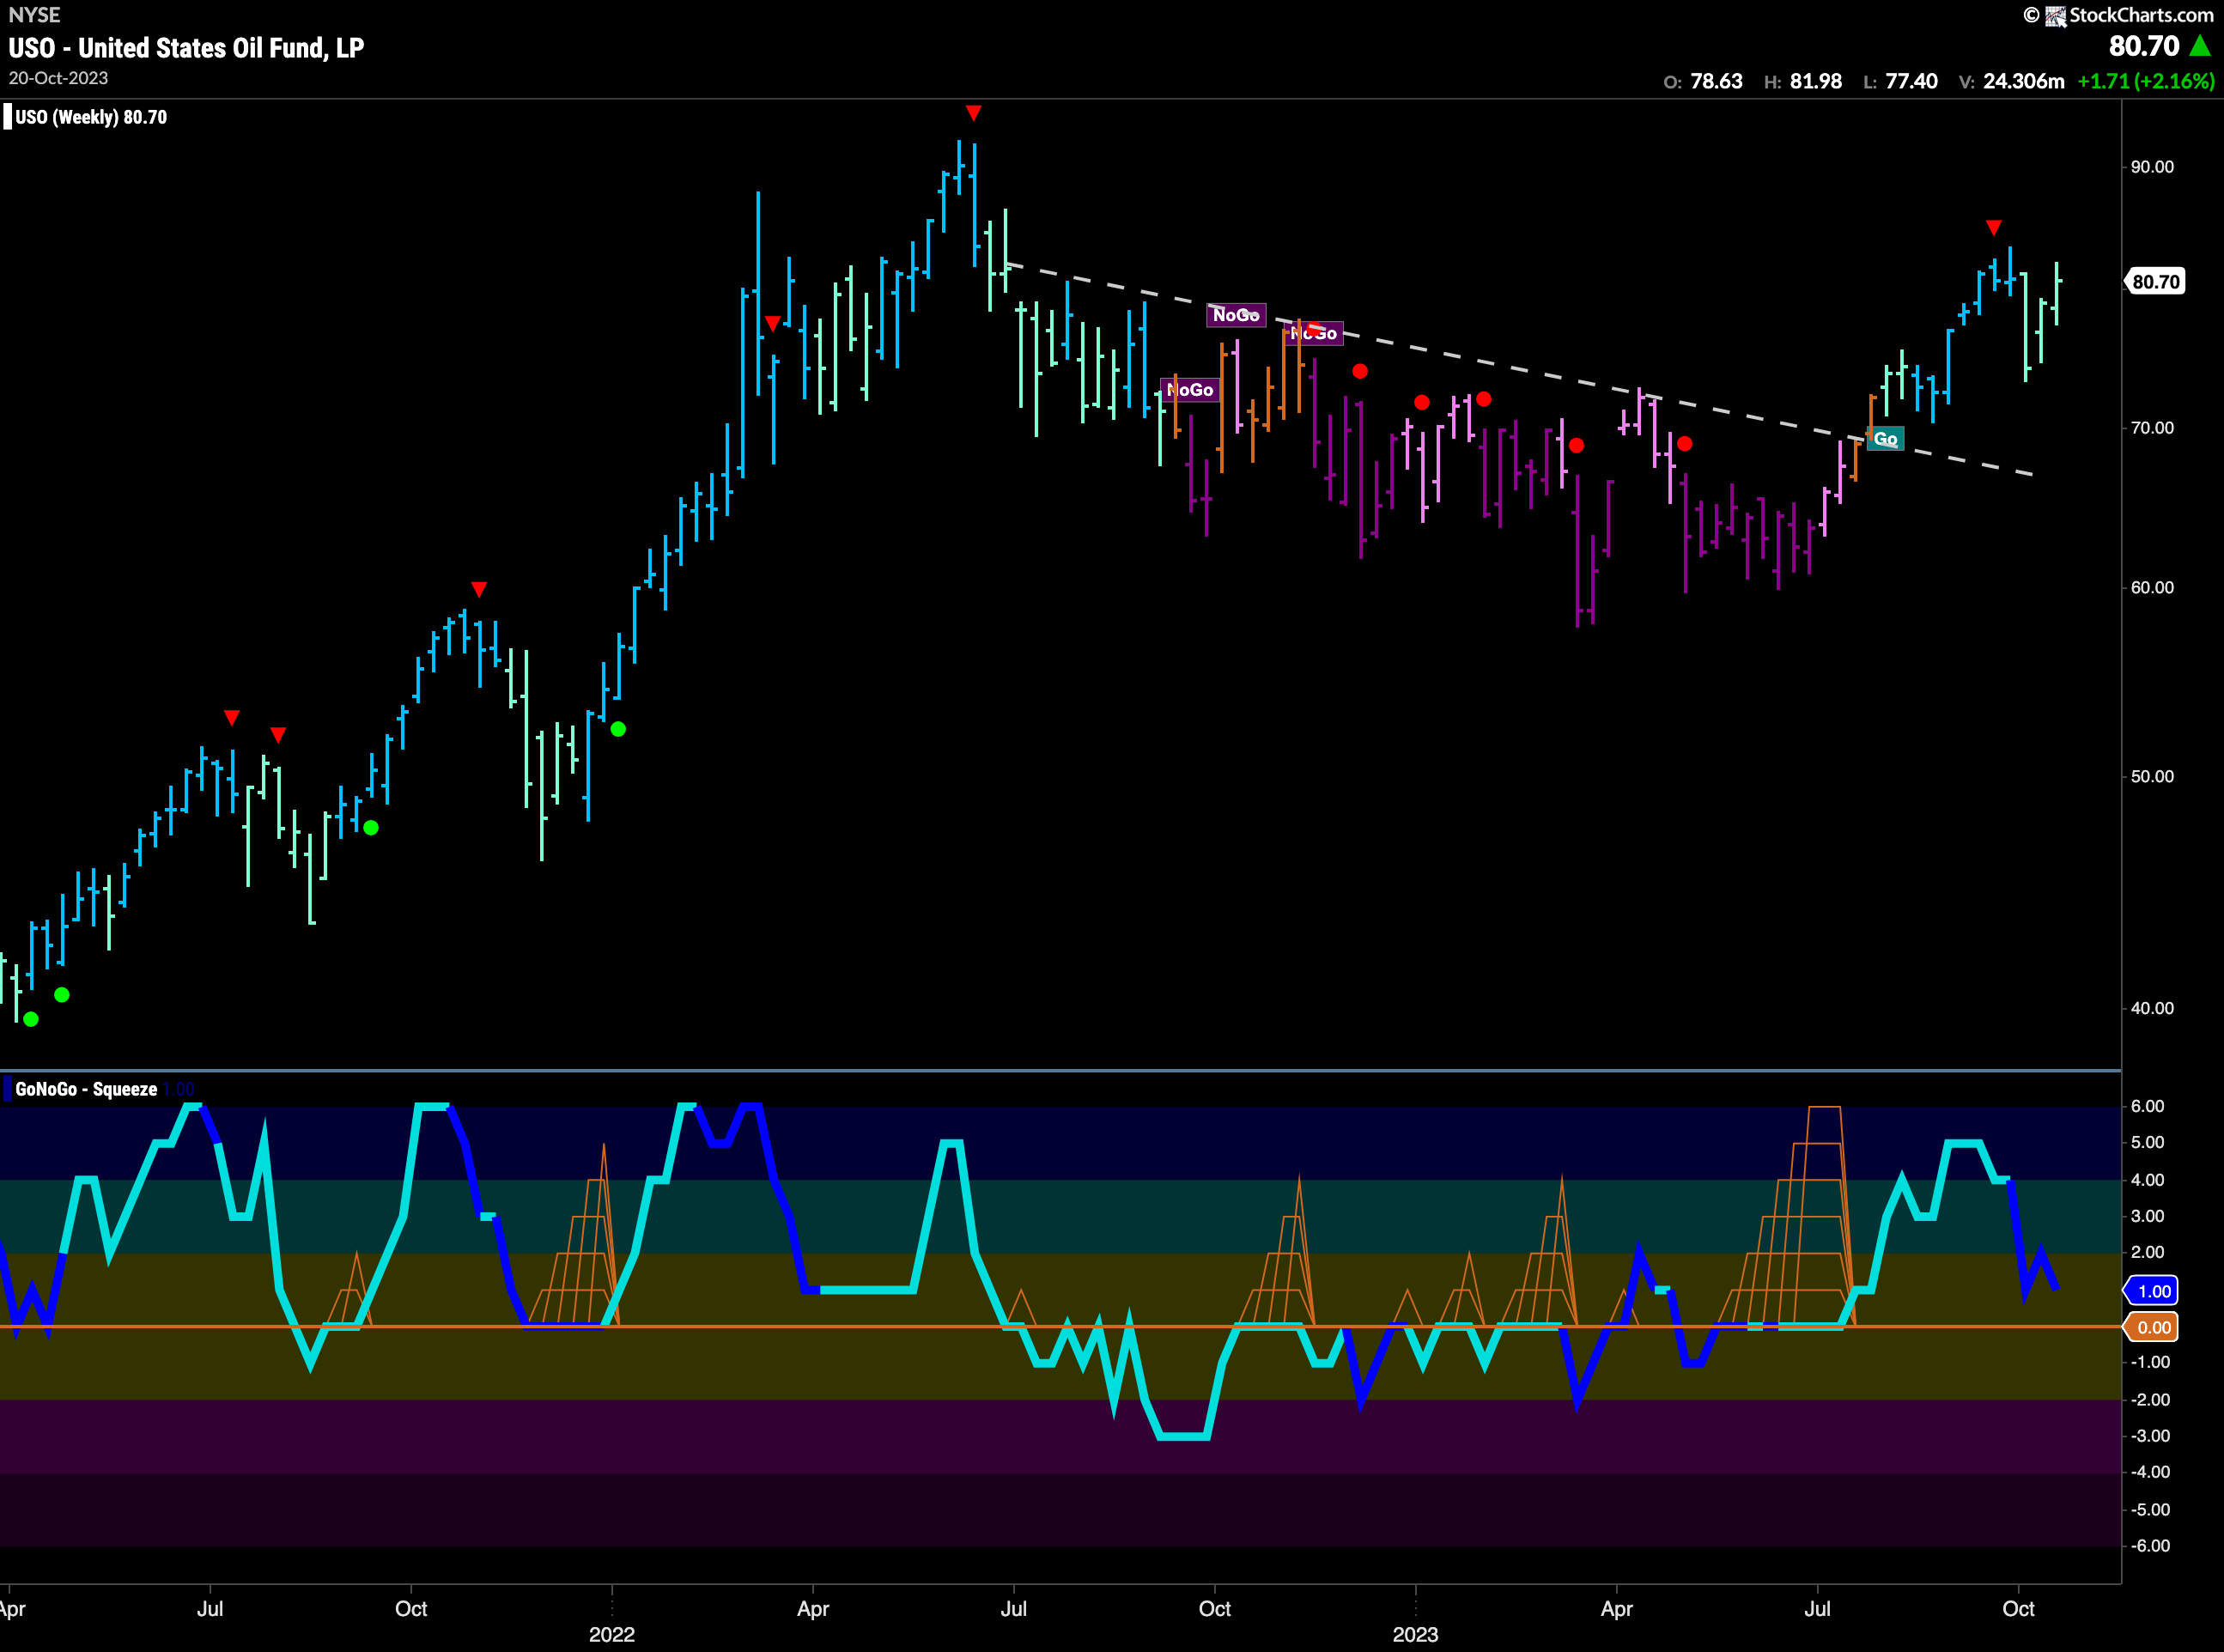
Oil continued to rally this past week and flew out of the brief “NoGo” as the GoNoGo Trend indicator painted first amber “Go Fish” bars, then aqua and blue “Go” bars. Now, with the trend indicator painting “Go” colors, we see that GoNoGo Oscillator is back in positive territory and volume is heavy. We will watch to see if the oscillator can remain in positive territory which would give price a push to move higher.
The weekly chart shows that the “Go” trend is still in place and that price rose last week. Still painting weaker aqua bars we can see that price hasn’t yet made a higher high. GoNoGo Oscillator is in positive territory but close to the zero line where we will watch to see if it finds support. Volume is heavy suggesting that the markets are participating in this price activity.
Sector RelMap
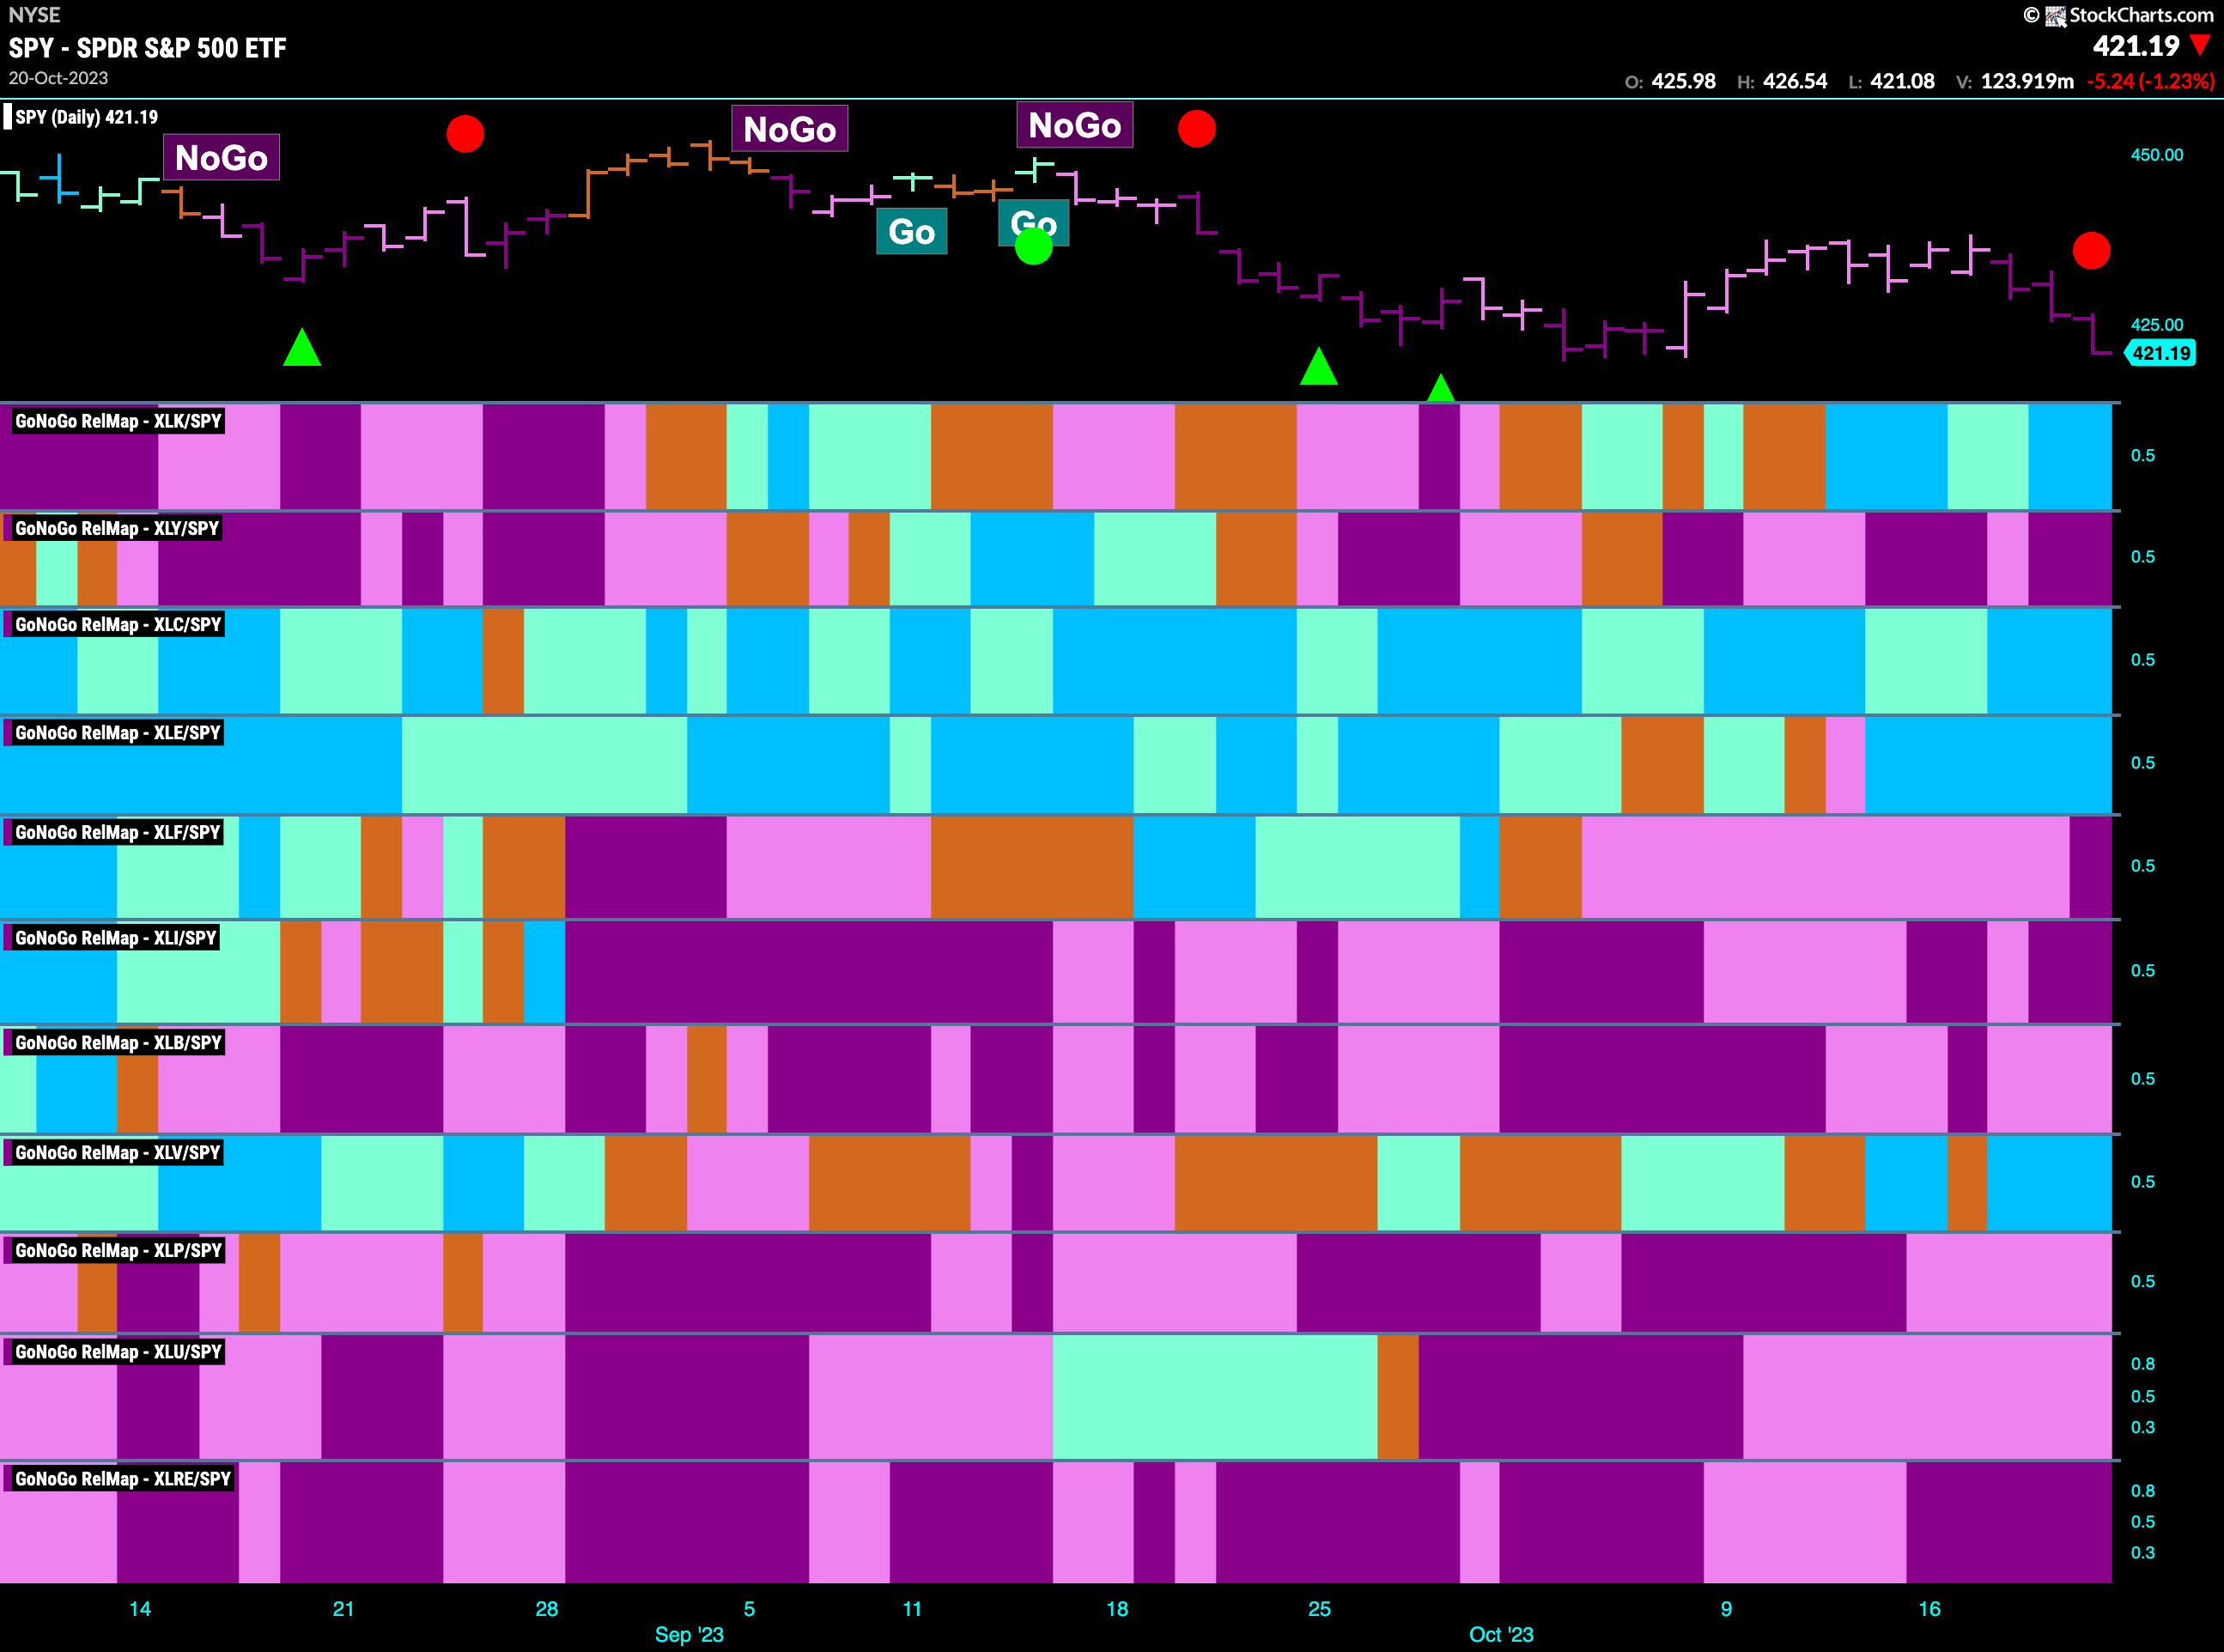
Below is the GoNoGo Sector RelMap. This GoNoGo RelMap applies the GoNoGo Trend to the relative strength ratios of the sectors to the base index. Looking at this map, we can quickly see where the relative outperformance is coming from as well as which sectors are lagging on a relative basis. 4 sectors are outperforming the base index this week. $XLK, $XLC, $XLE, and $XLV are painting “Go” bars.
Energy Sub-Group RelMap
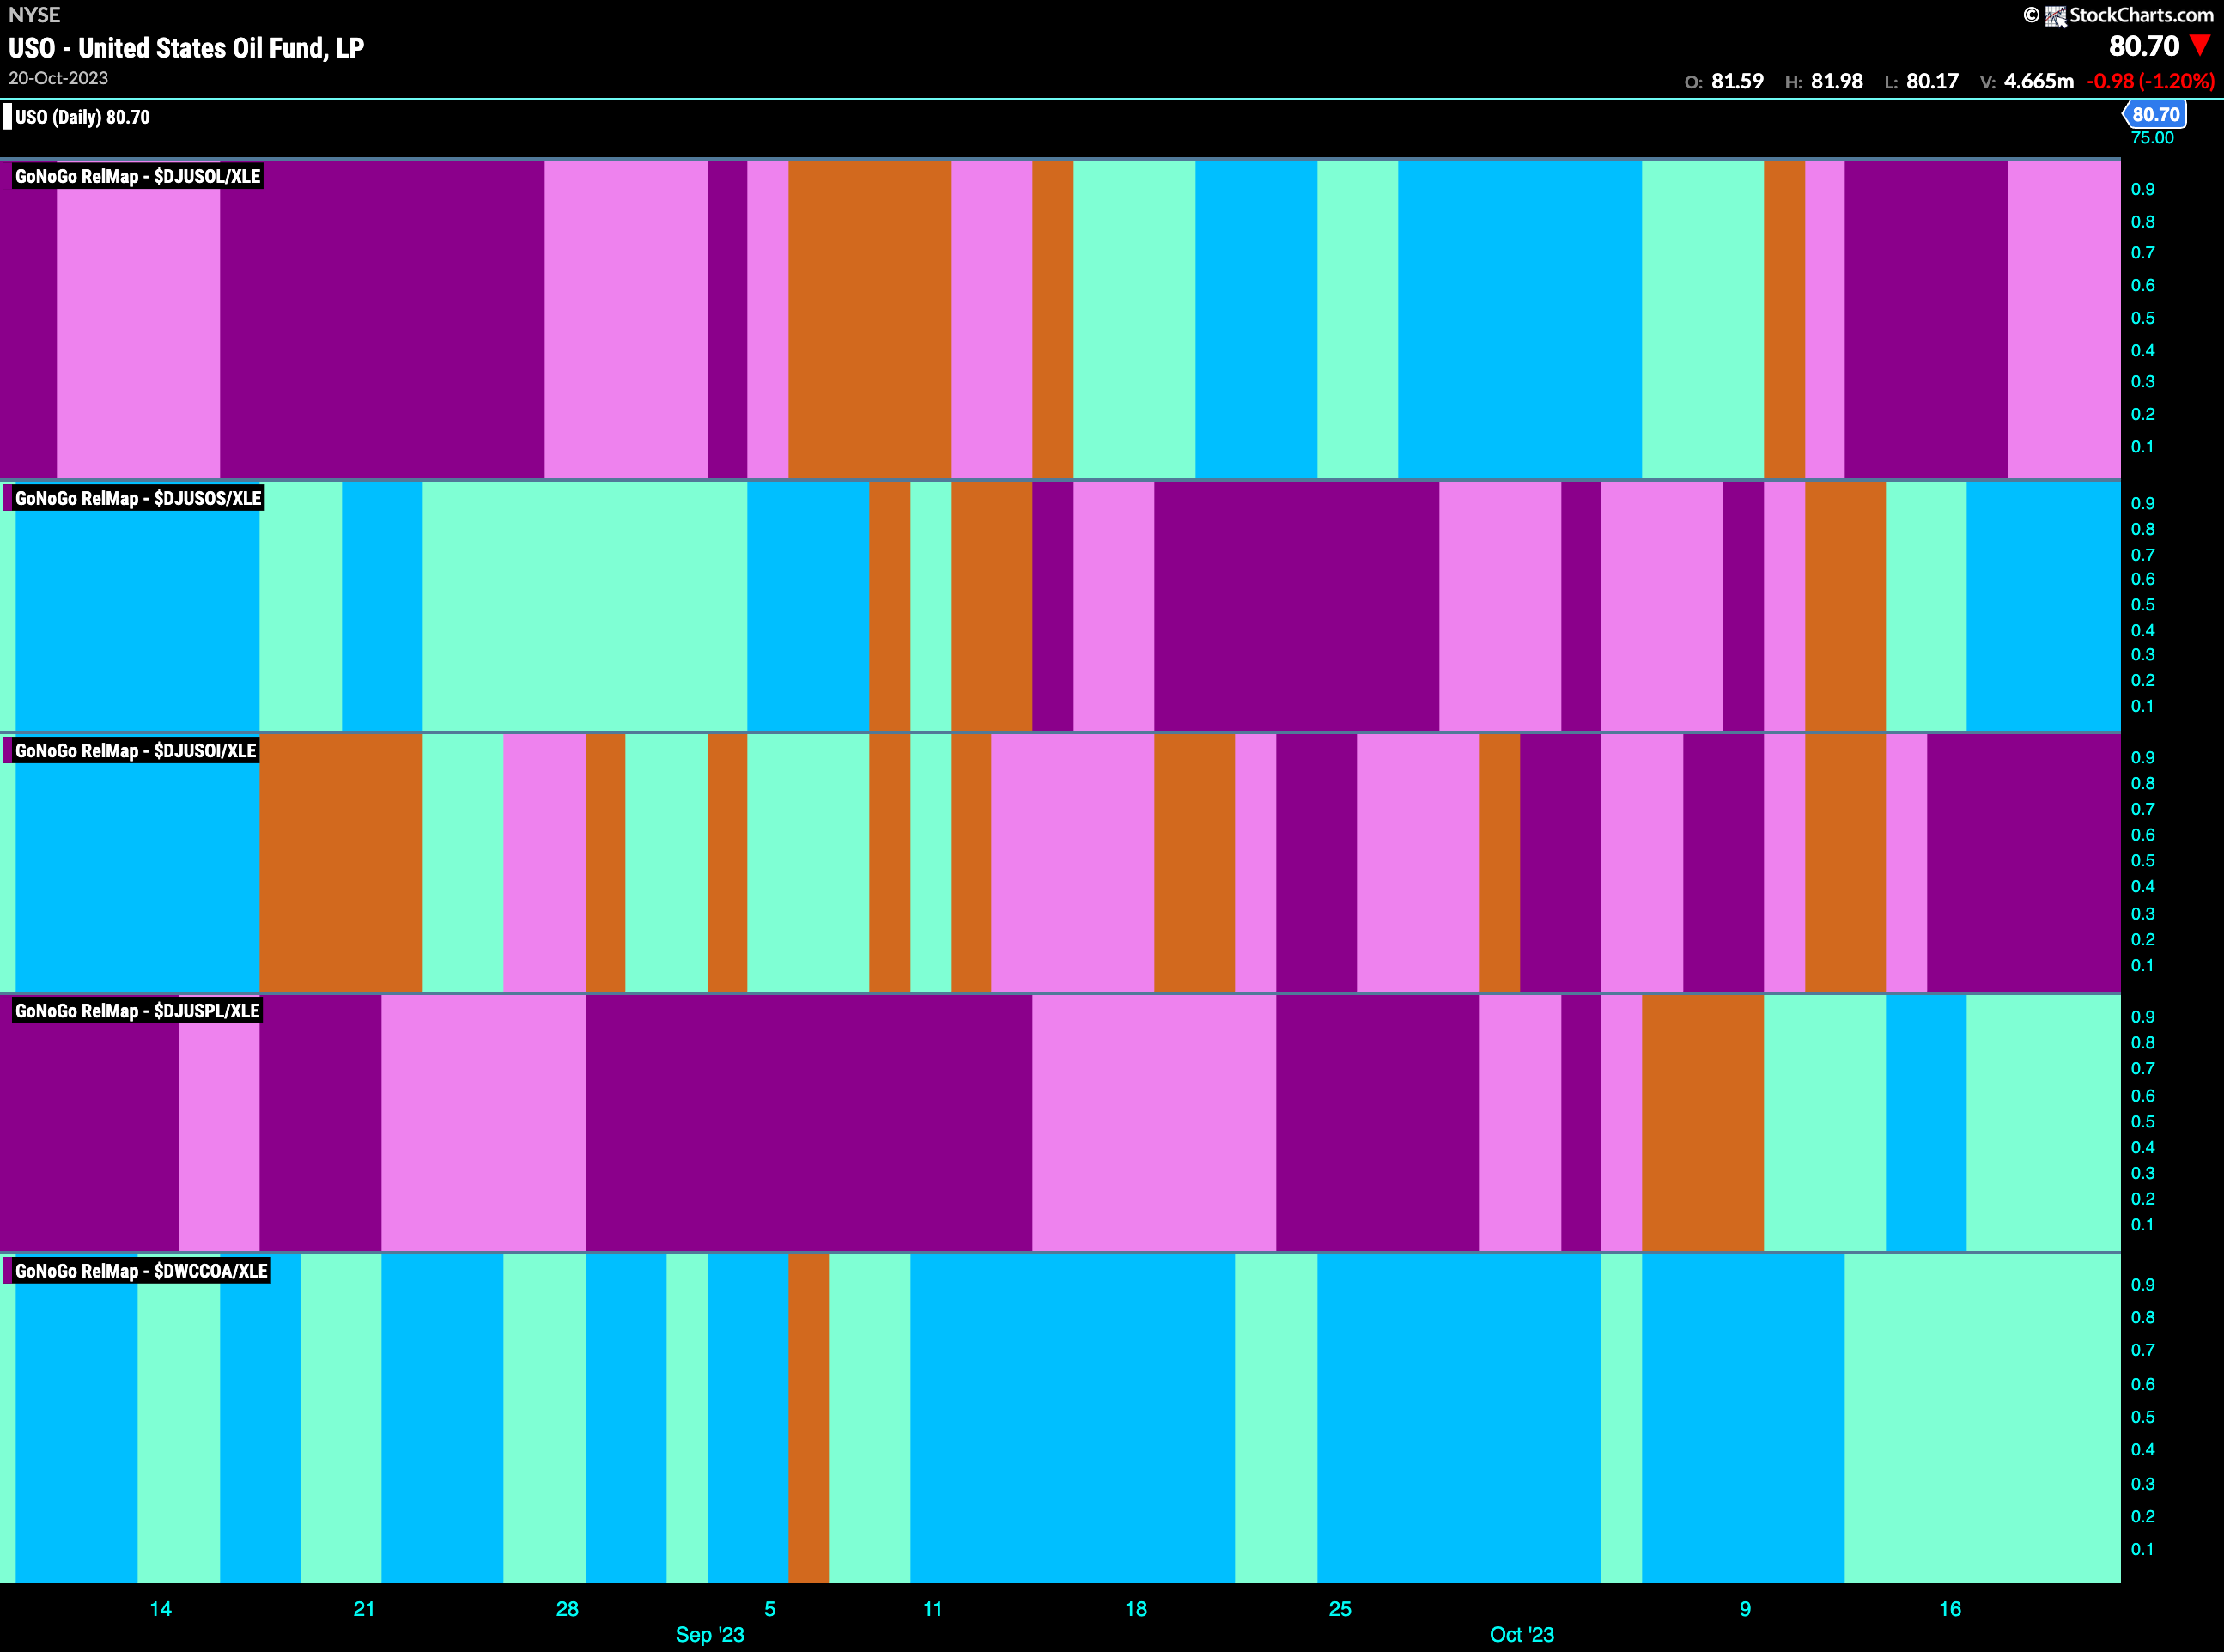
The GoNoGo Sector RelMap above shows the relative outperformance of the energy sector. The energy sub group map below shows that the exploration and production group has also emerged as a leader. This is the second panel.
Exploration and Production Shows Relative Strength
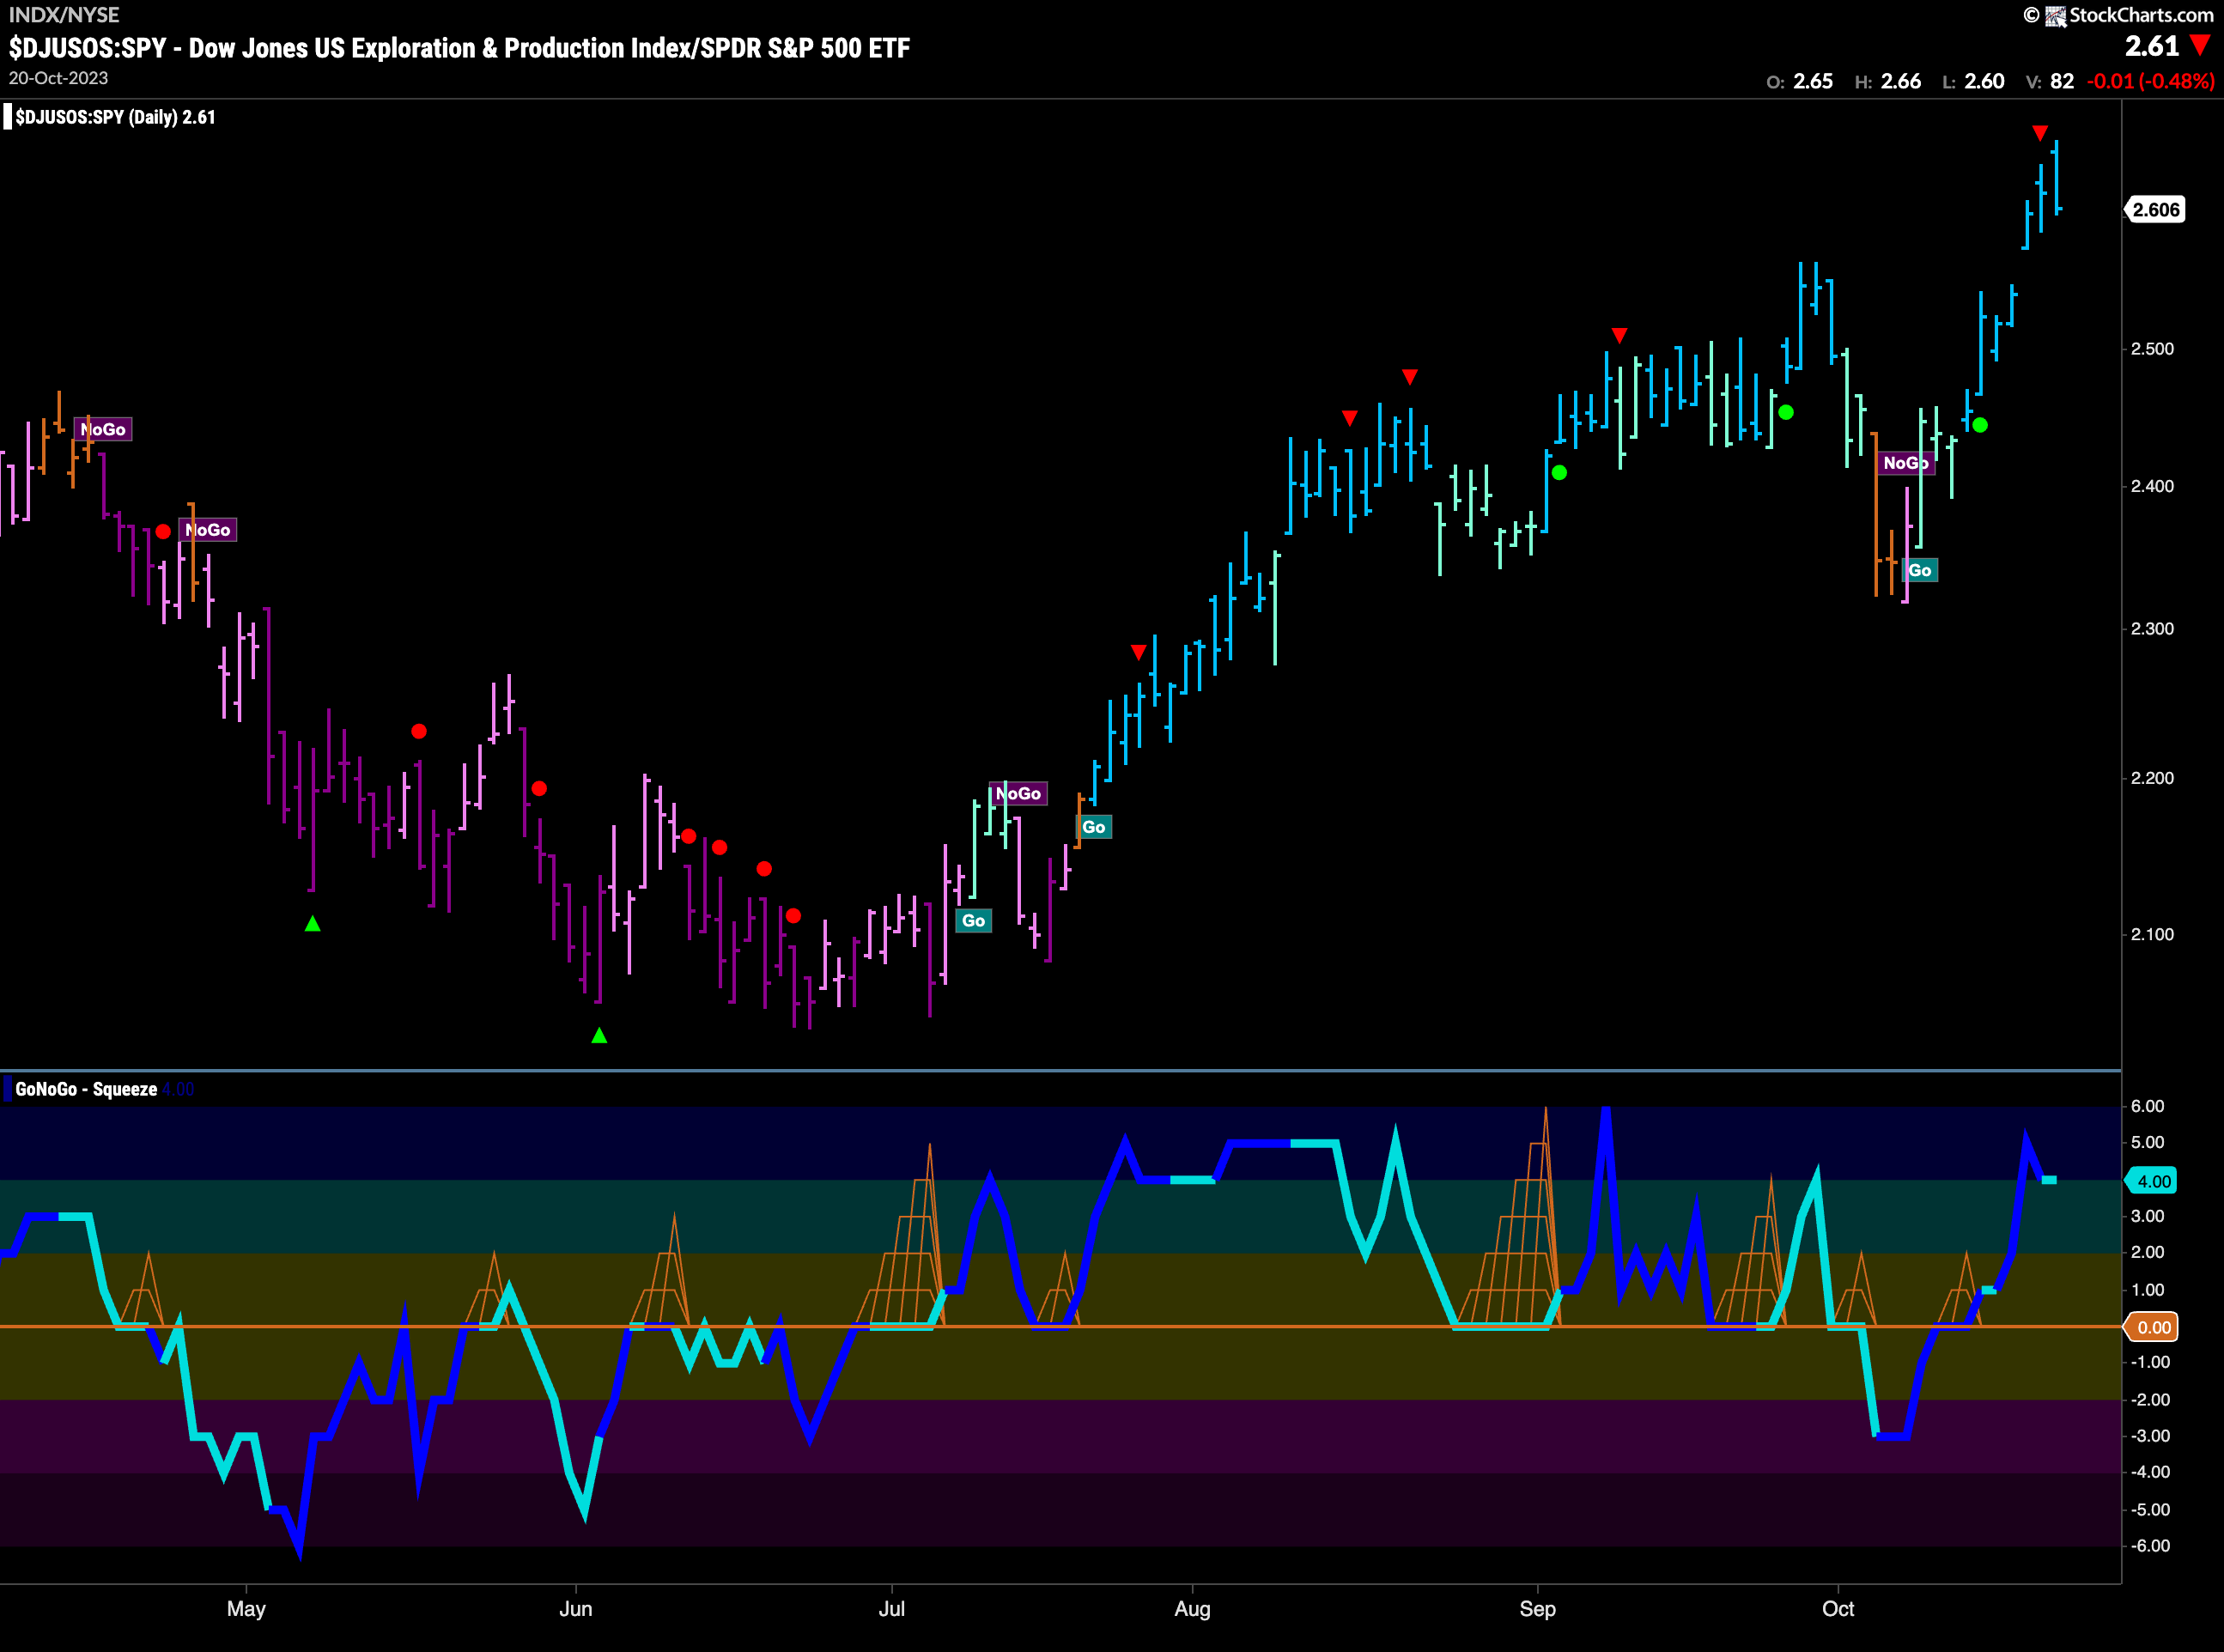
If we take that group and look at the relative ratio to the $SPY we can see just how strong exploration and production has been. Applying the GoNoGo Charts full suite of tools to the ratio we can see that we are in a strong “Go” trend with the indicator painting strong blue bars all of last week as price raced to new highs. The oscillator is in positive territory but has come our of overbought territory. We will watch to see if there is any pull back but see strong support on the chart from prior highs.
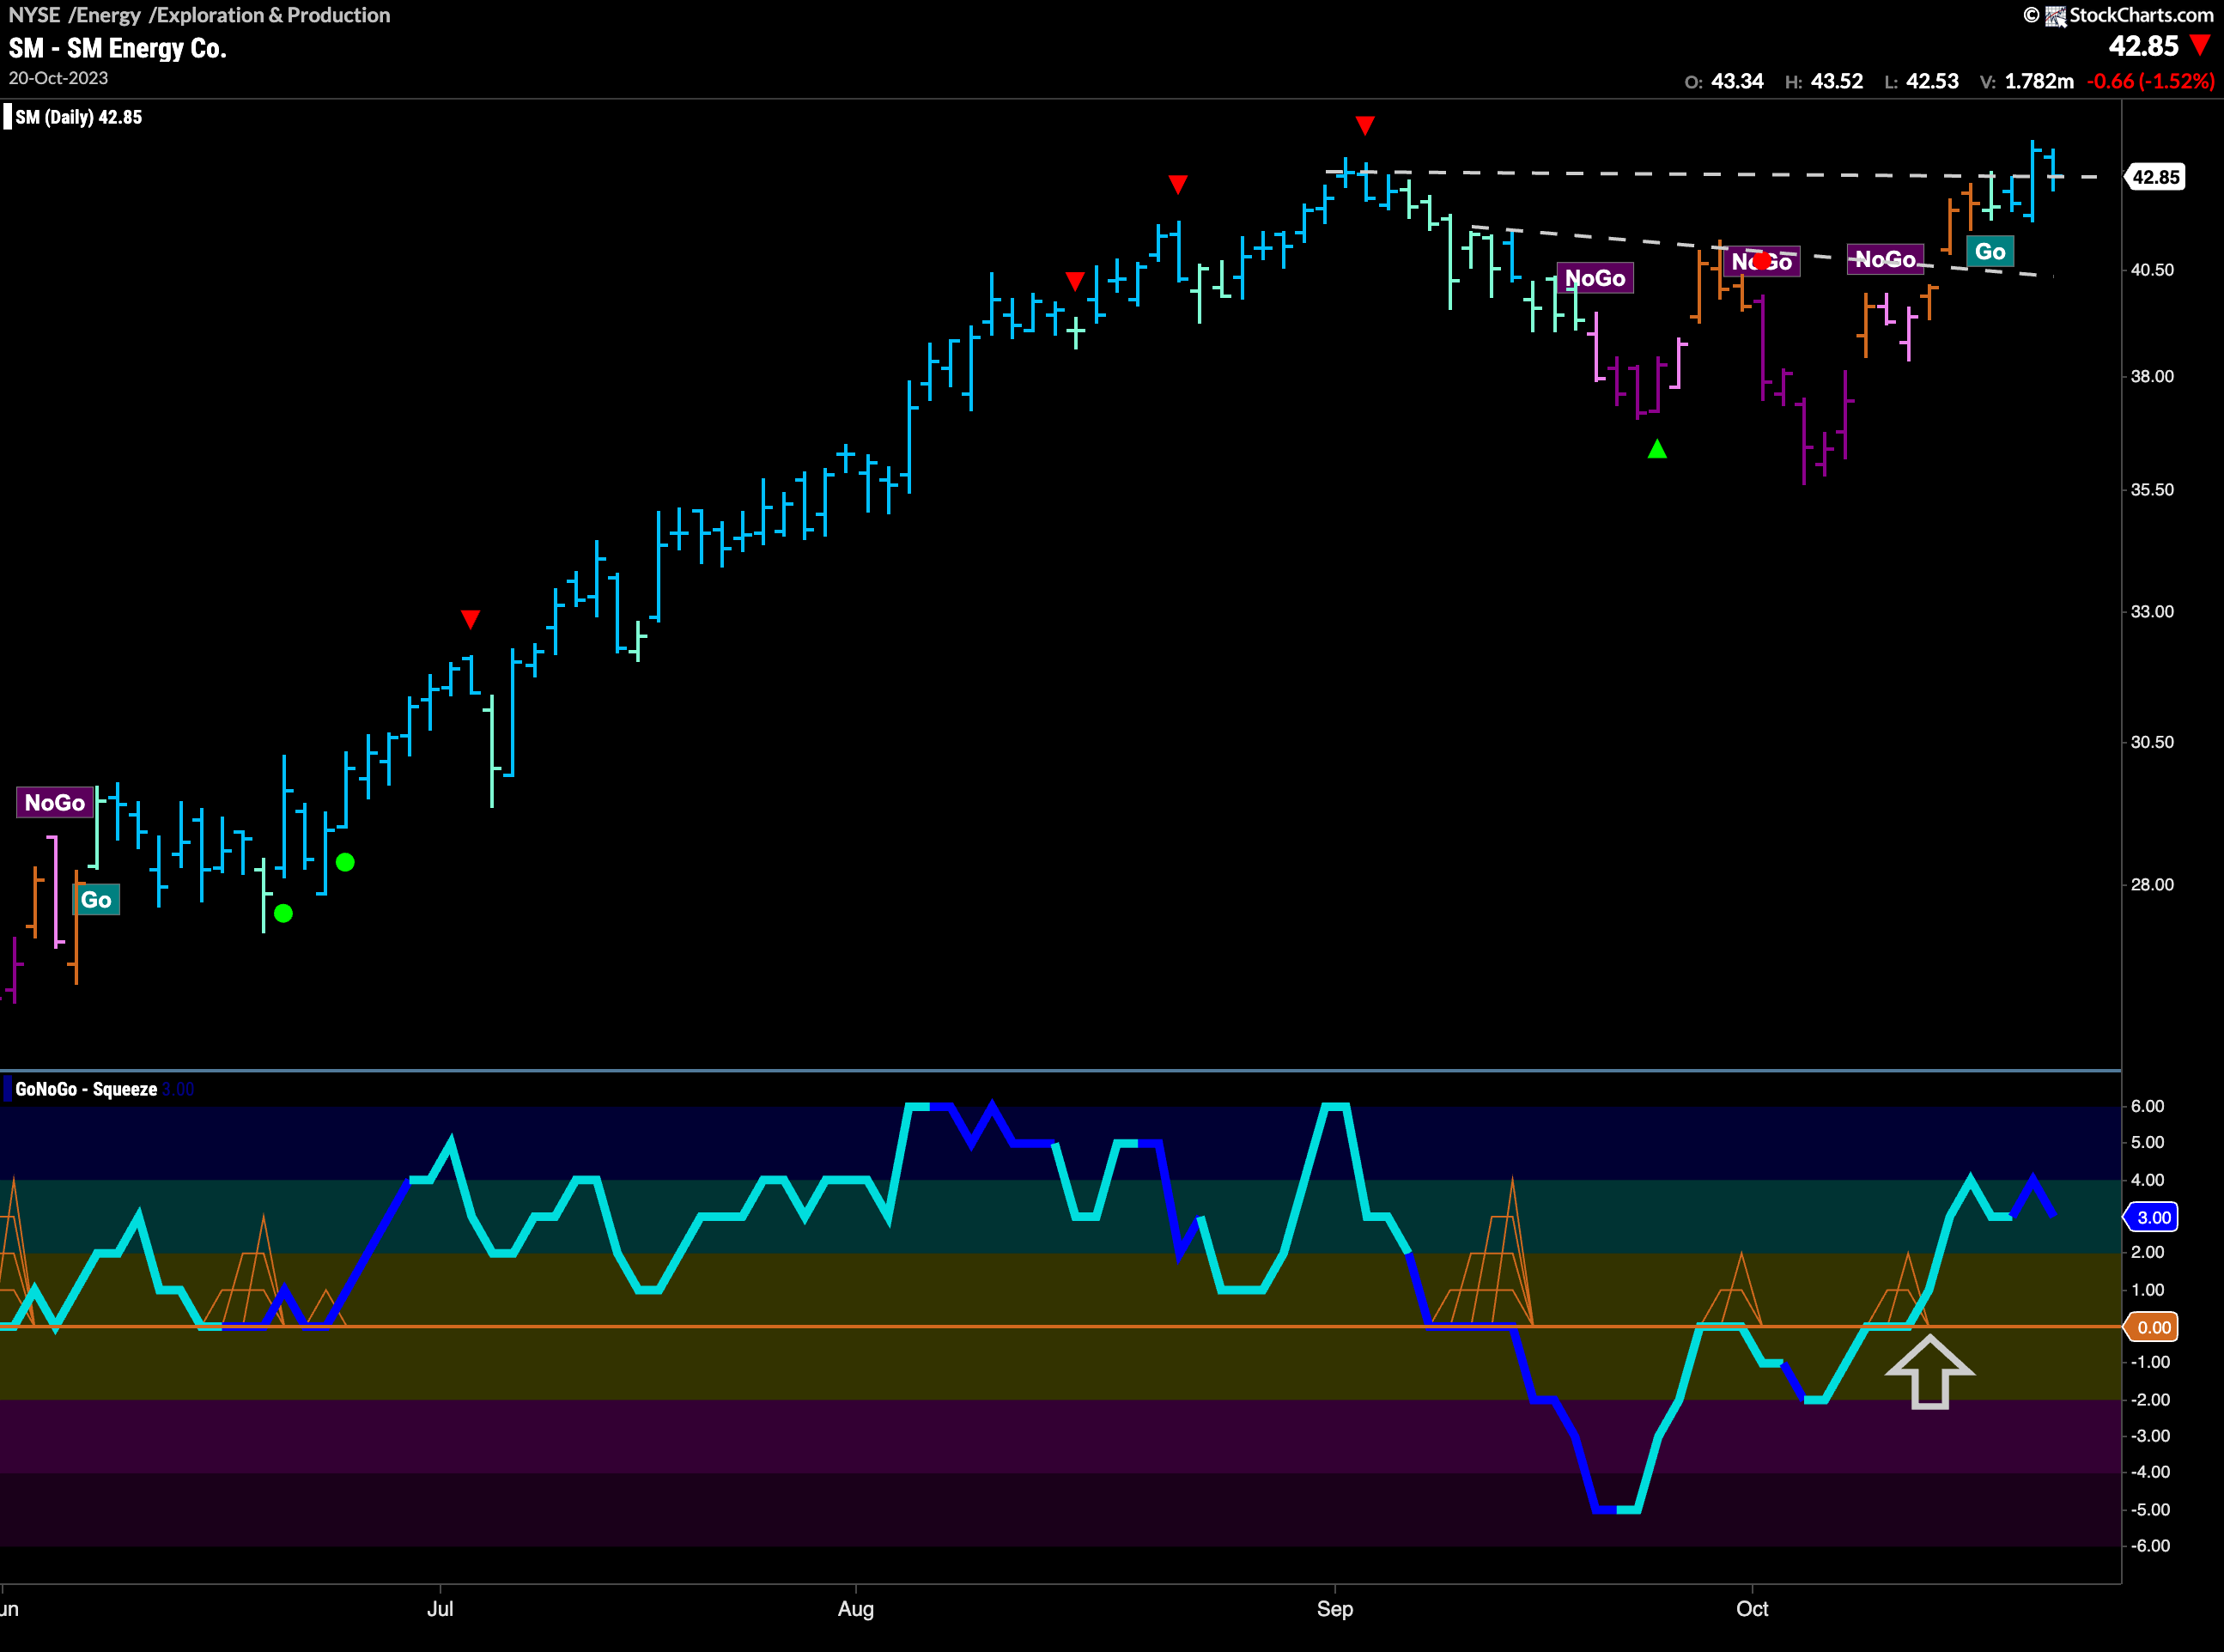
SM Energy Setting up for Higher High?
One of the securities in the exploration and production group is SM Energy. We can see that it has emerged from a “NoGo” correction and has flagged a new “Go” trend as it tests horizontal resistance. GoNoGo Oscillator is in positive territory but not overbought after it broke into positive territory about a week ago. If price can consolidate above these levels we would look for the “Go” trend to continue as price sets a new higher high.
Obsidian Energy in Strong Trend
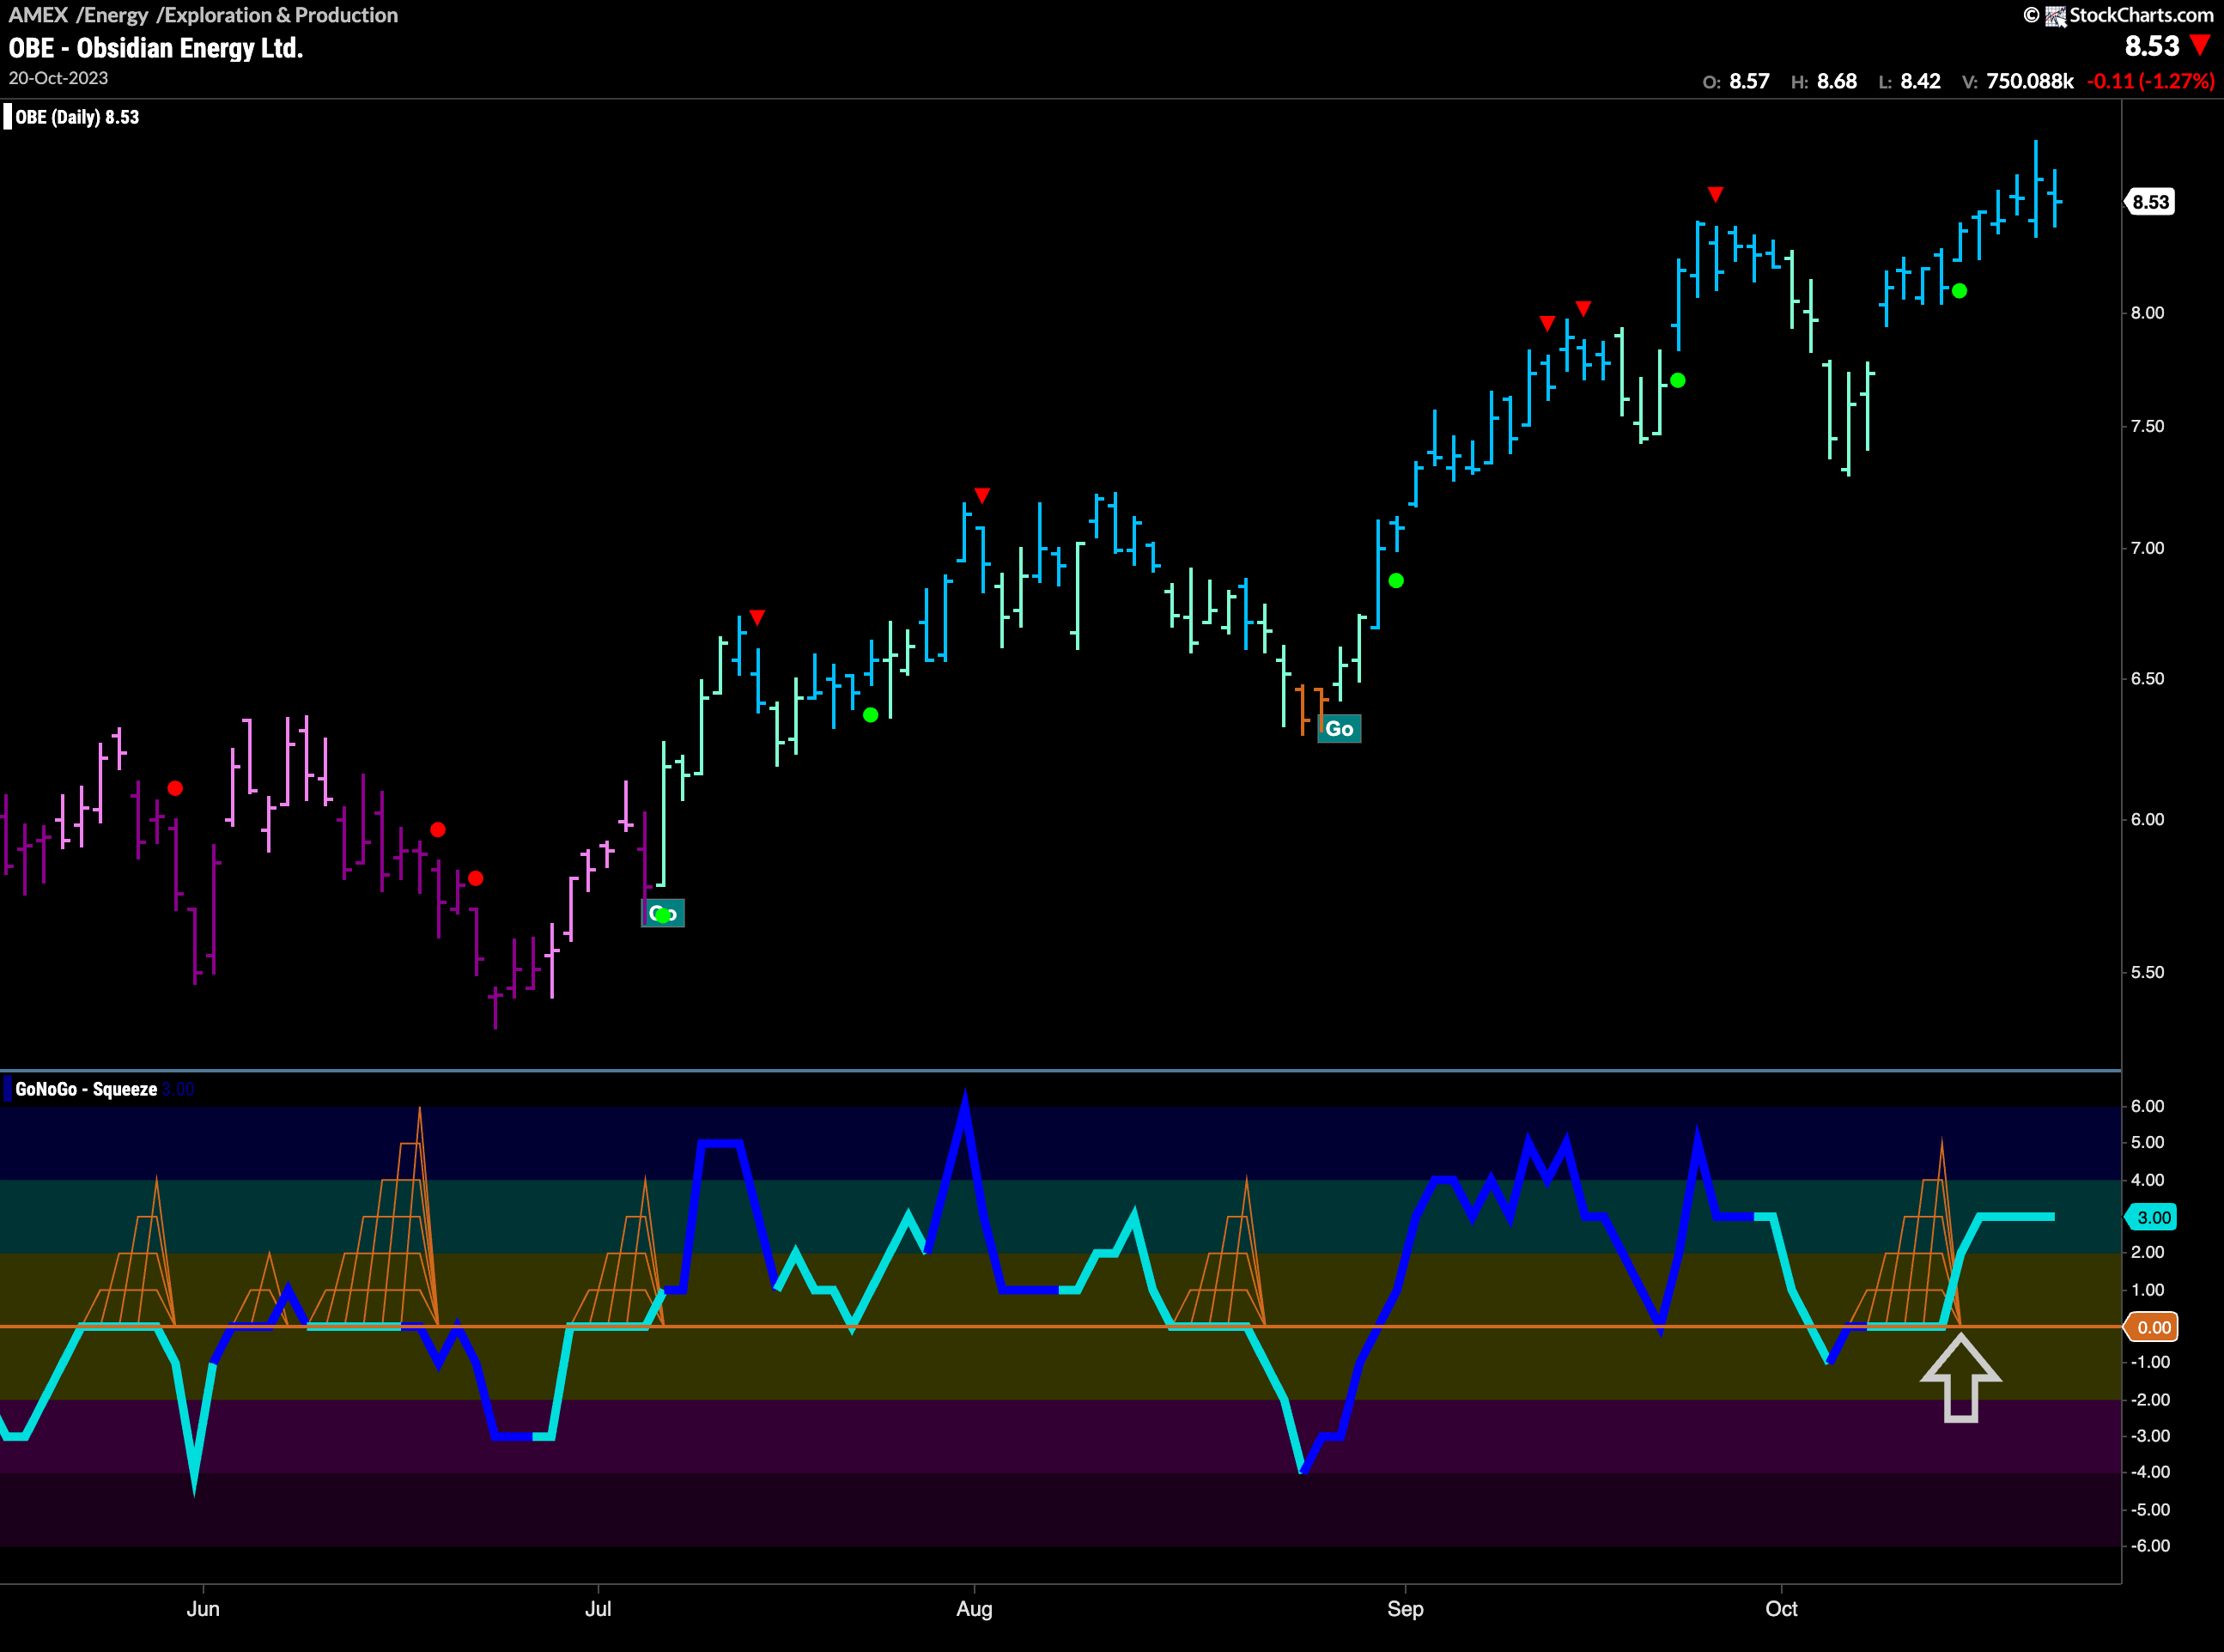
Another security to look at that is in a more established “Go” trend is $OBE. We can see that last week price set a new higher high after the chart triggered a Go Trend Continuation Icon (Green circle). We will be looking for any pull backs on this chart as opportunities to enter the trend. GoNoGo Oscillator is in positive territory but not overbought. We will look for moments when the oscillator retests the zero line and bounces back into positive territory. This will tell us that the trend is likely to continue.
