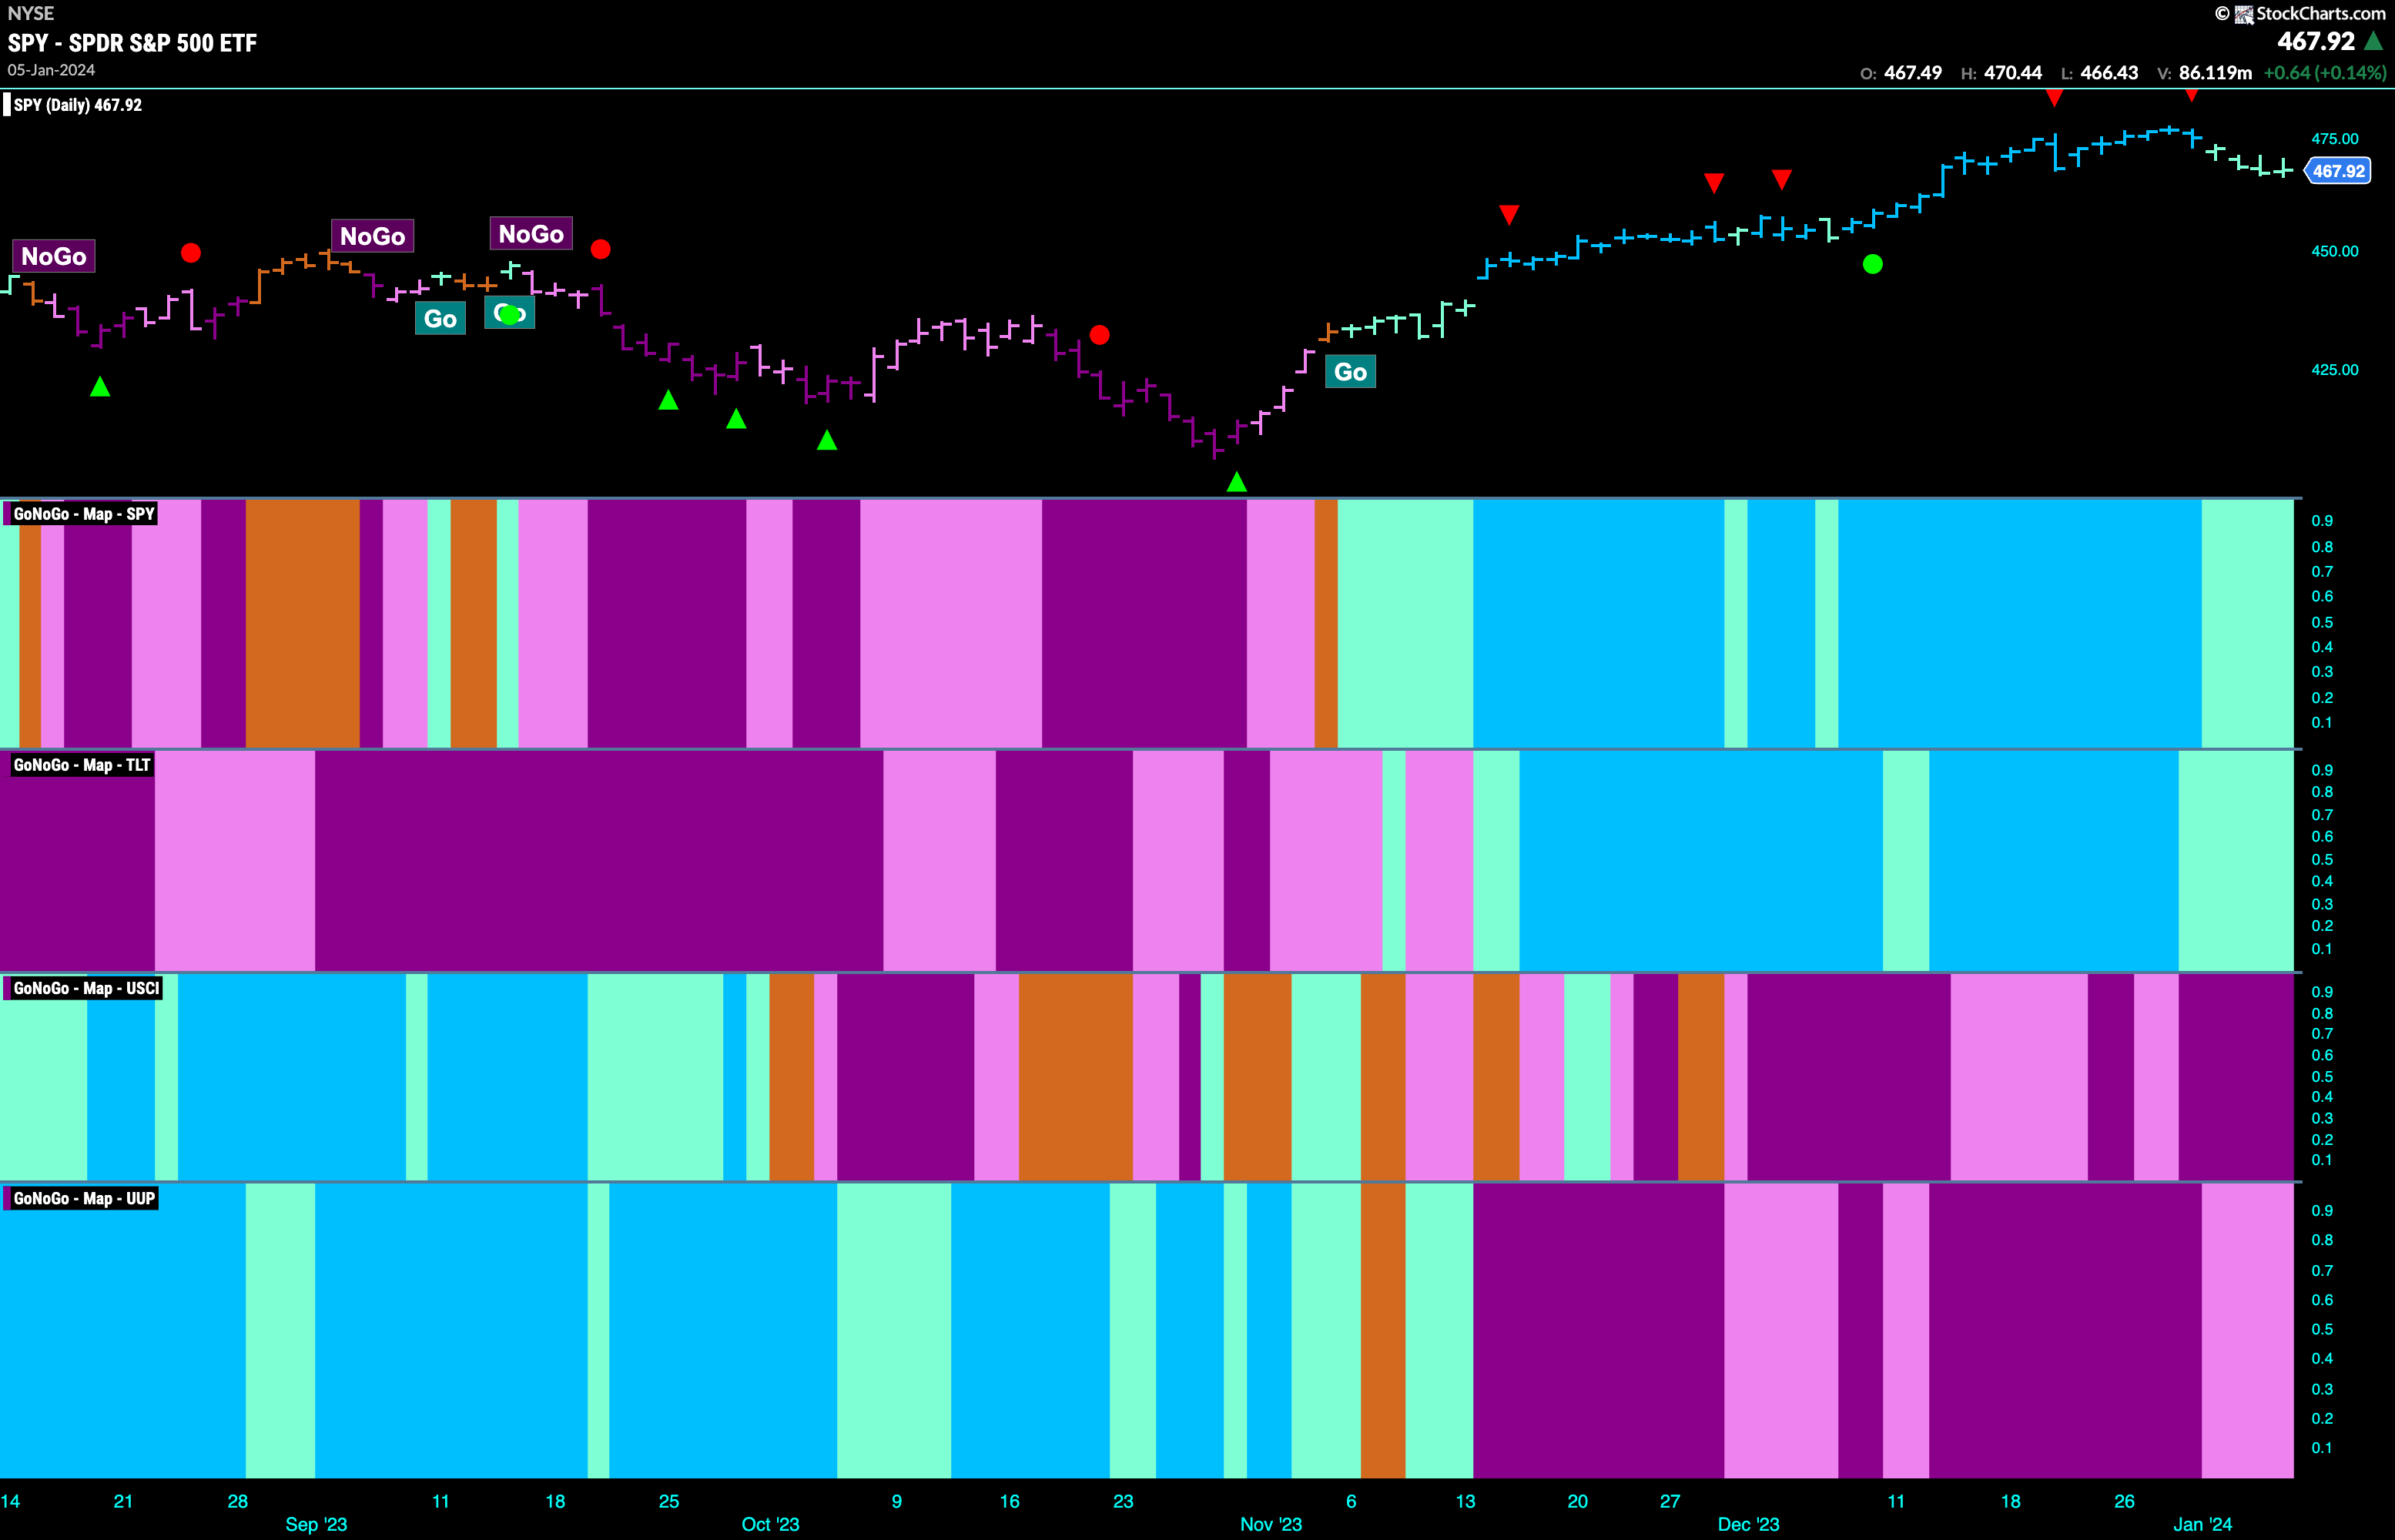
Good morning and welcome to this week’s Flight Path. For the first time in some weeks we saw some weakness in the “Go” trends. Equities remain in a “Go” trend but we saw consecutive weaker aqua bars following the Go Countertrend Correction Icon. It was a similar story for treasury bond prices as this week saw only aqua bars. Elsewhere commodities held on to the “NoGo” trend and in fact saw strength this week with purple bars. The dollar, having been in a strong “NoGo” trend for a few weeks painted mostly weaker pink bars this week as it rallied against the trend.
Equities Pullback in “Go” Trend
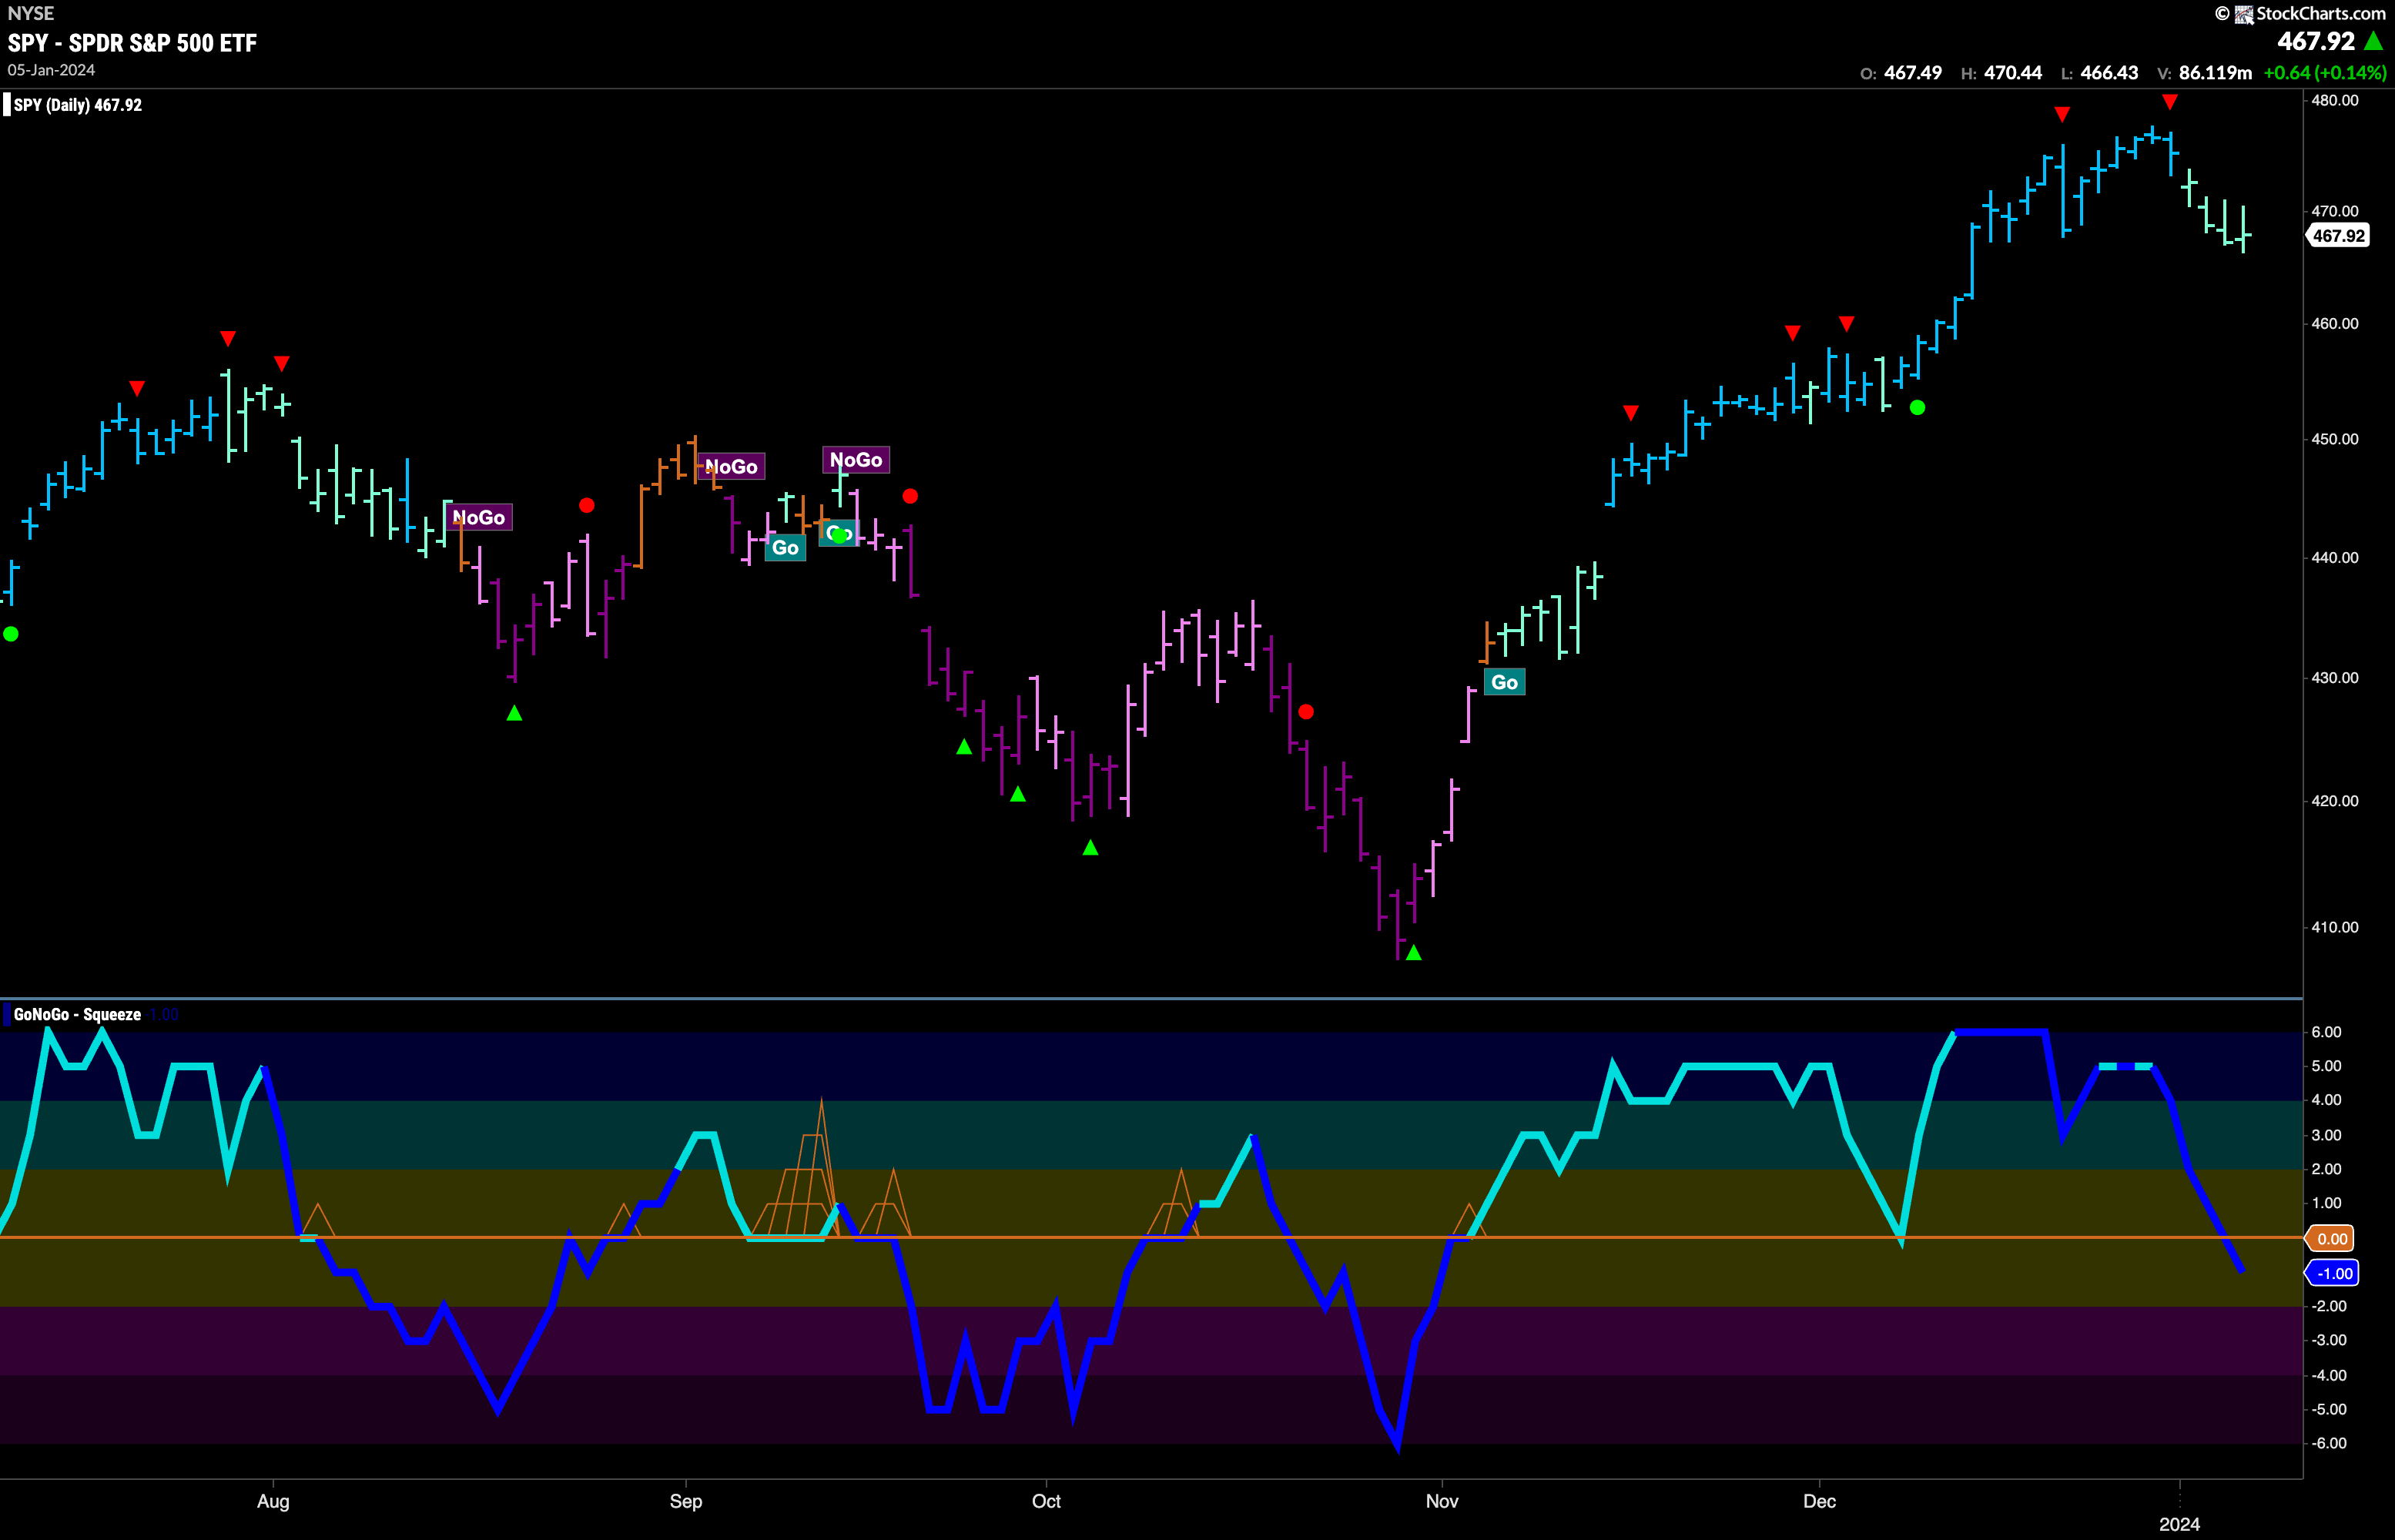
The first bar of the week saw a Go Countertrend Correction Icon (red arrow) indicating that price might struggle to go higher in the short term. This was indeed the case as we saw a pullback on weaker aqua “Go” bars. GoNoGo Oscillator has fallen sharply and volume is heavy. If we look closely we can see that the oscillator has dipped into negative territory. This is a concern for the “Go” trend as we know that when healthy, a “Go” trend should be supported by positive volume. We will watch this week to see if the oscillator regains positive territory.
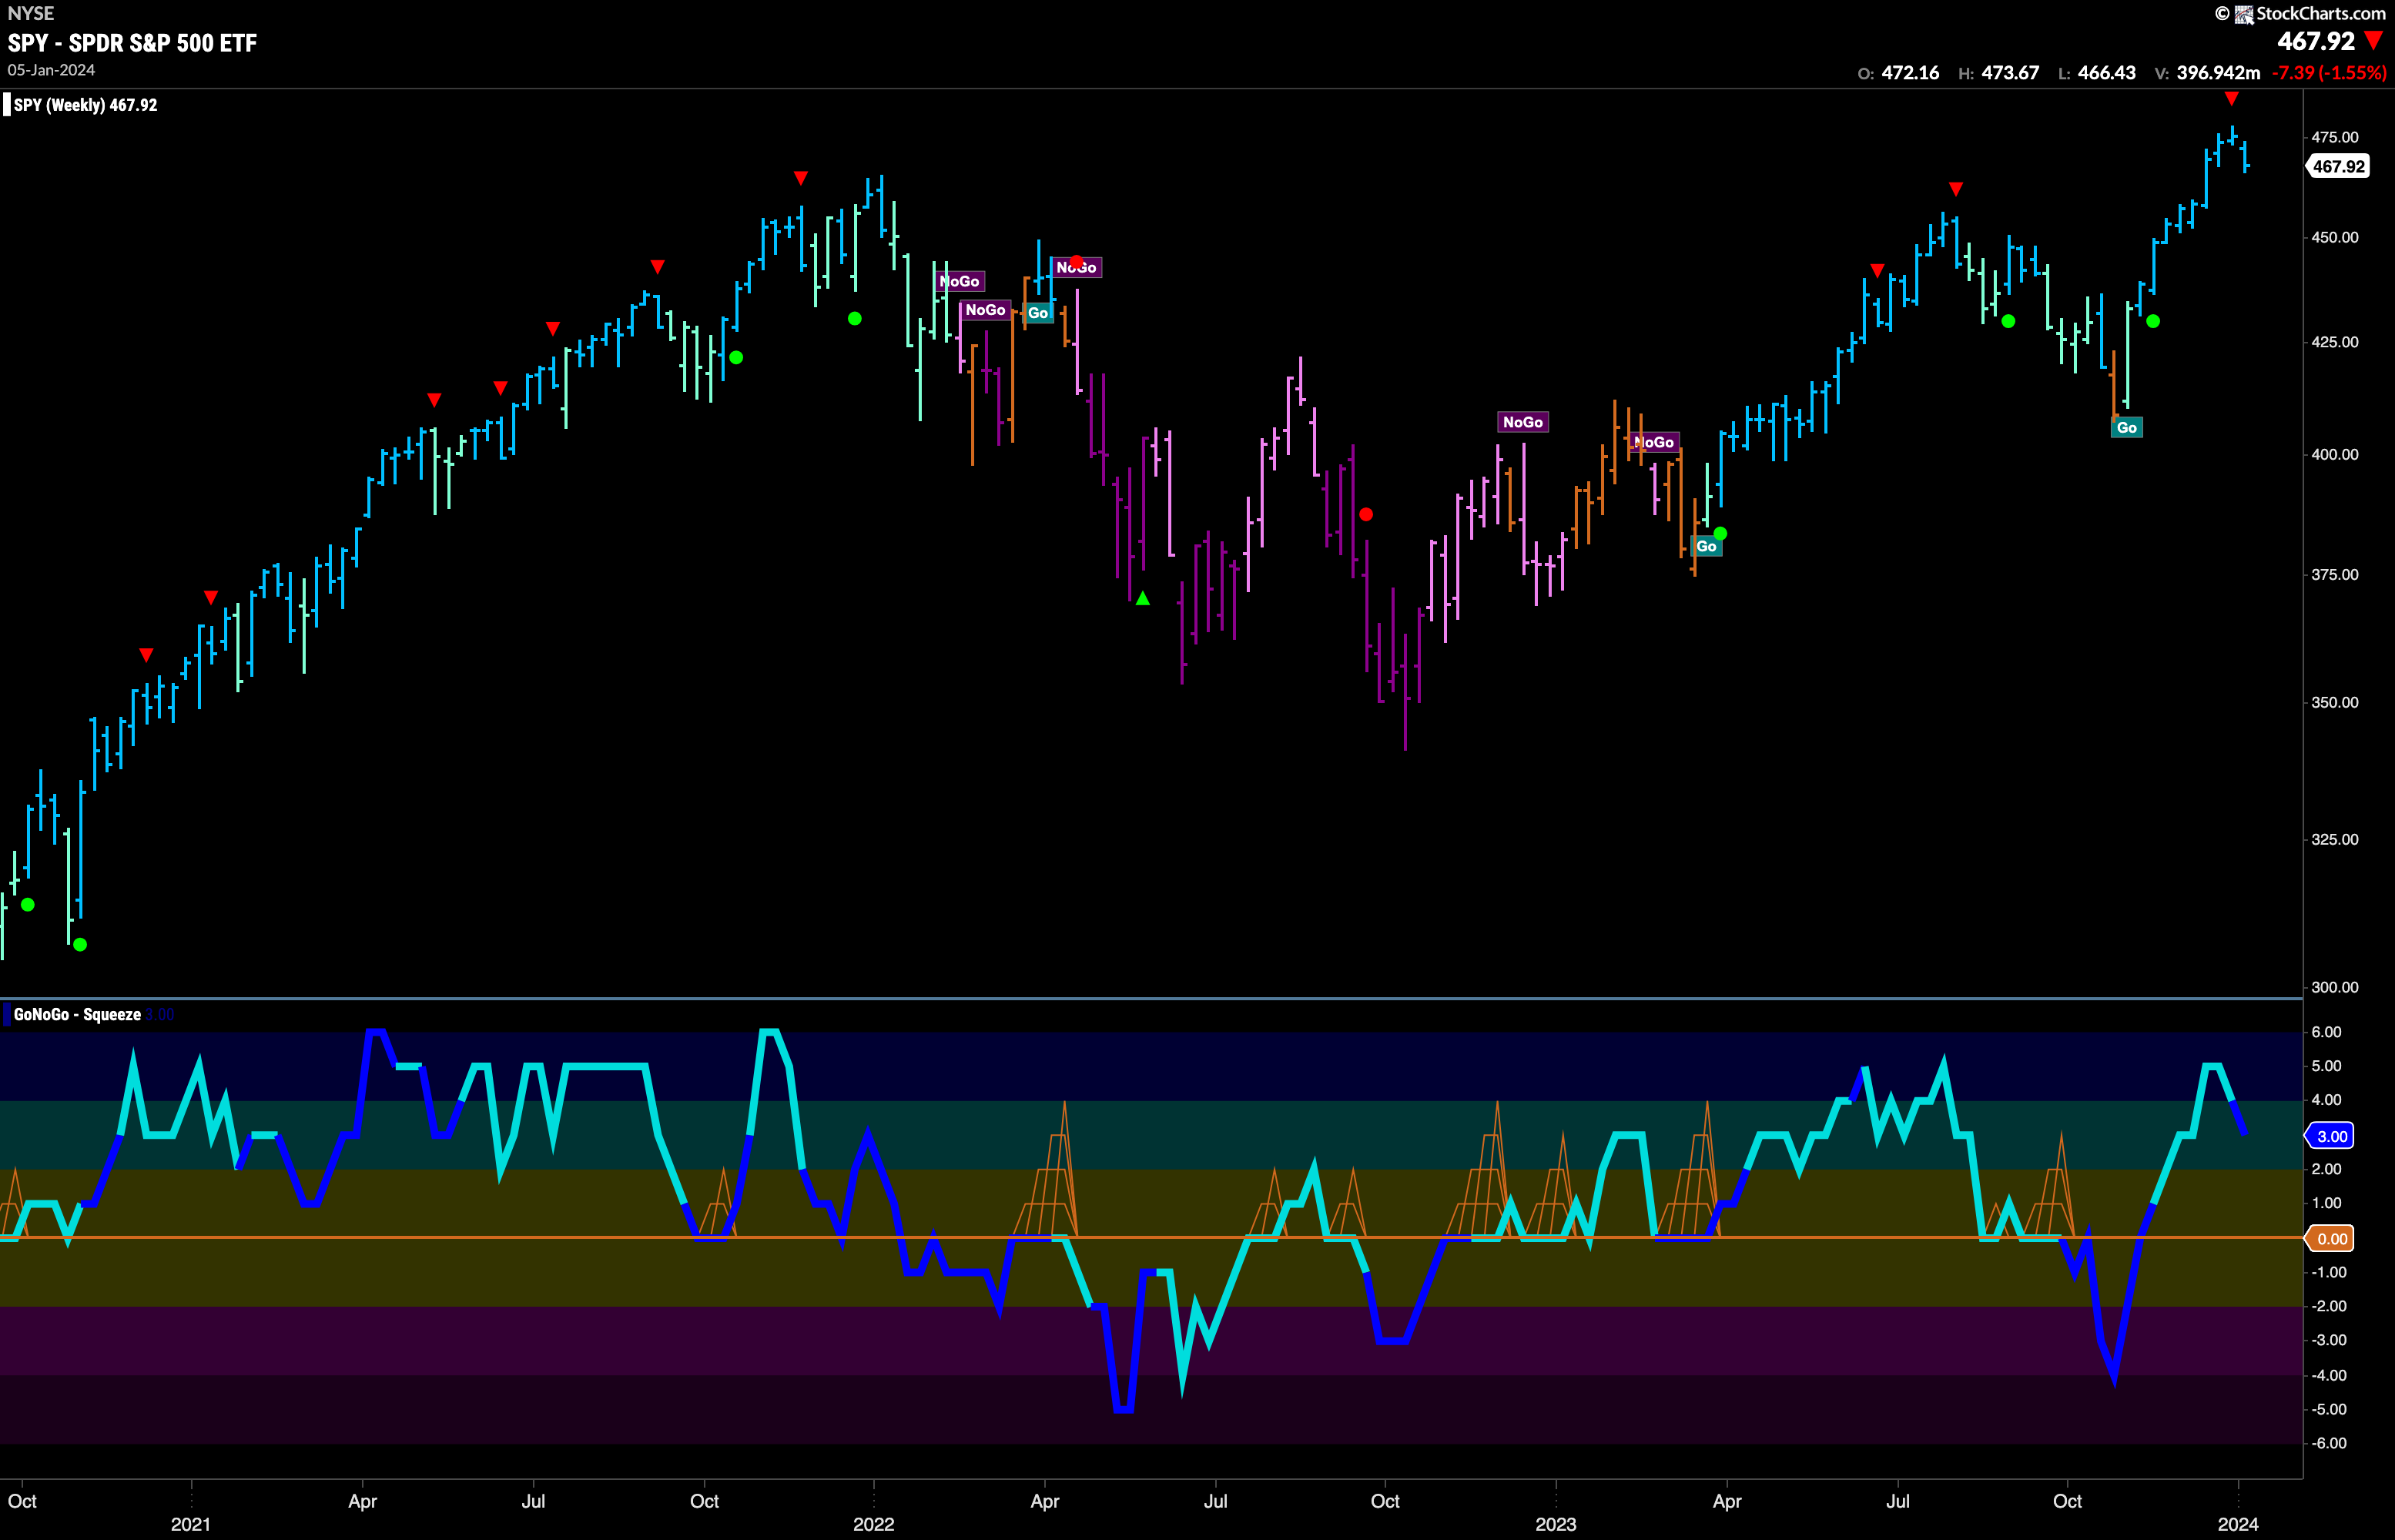
The weekly chart shows a lower close for the first time in 10 weeks. GoNoGo Trend is still painting a strong blue “Go” bar however as we follow up a Go Countertrend Correction Icon (red arrow) at the most recent high. With momentum falling from overbought territory it would be no surprise to see price take a few bars to consolidate the recent run. We will watch to see if the oscillator continues its path toward the zero line and if it finds support when it gets there.
Treasury Rates Rally off Recent Low
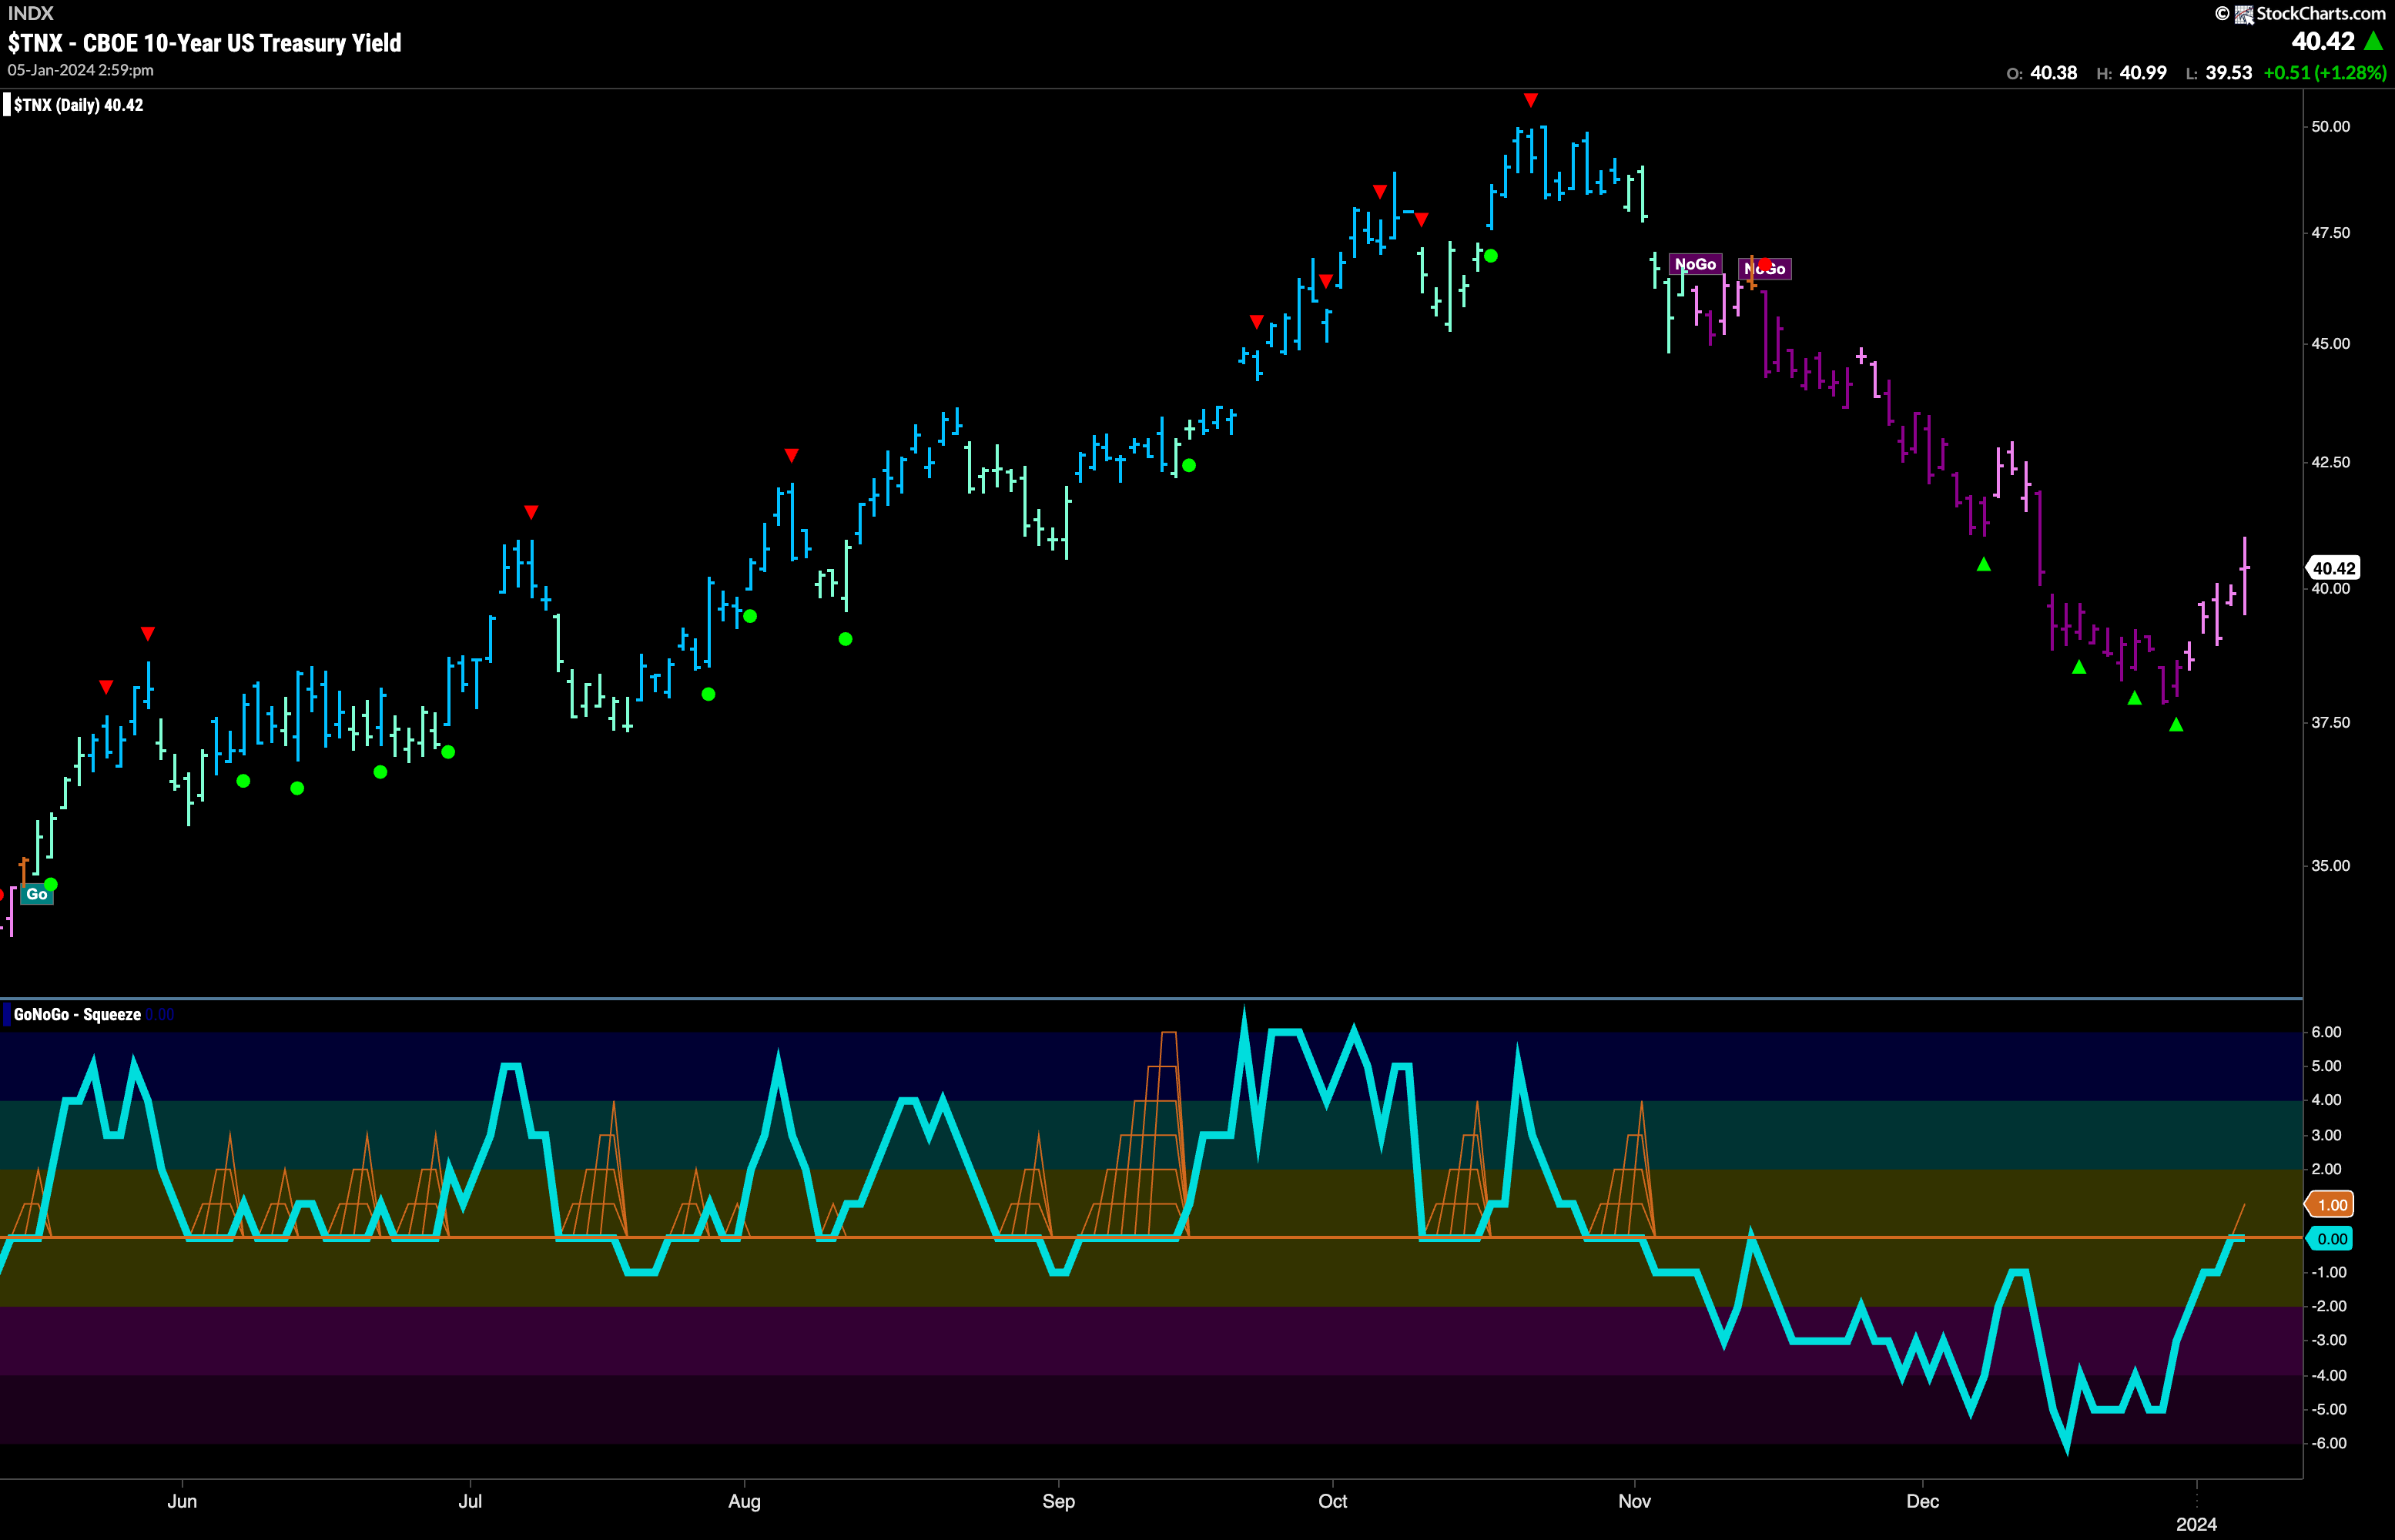
The “NoGo” trend continues in rates but there was change afoot this past week. GoNoGo Trend painted a string of weaker pink “NoGo” bars as price rose from its low. GoNoGo Oscillator which was recently stuck in oversold territory moved sharply up to the zero line and now we are at an inflection point. With price rising, and the oscillator tagging the zero line from below we will watch to see if it gets rejected at that level or if it can break through into positive territory. If the oscillator is turned away back into negative territory then we will see a lower high in price and a continuation of the “NoGo” trend.
The larger timeframe chart shows another week of indecision. A 4th week where GoNoGo Trend paints an amber “Go Fish” bar. GoNoGo Oscillator is in negative territory having broken out of a small GoNoGo Squeeze. The long term chart shows that there is downward pressure on price. 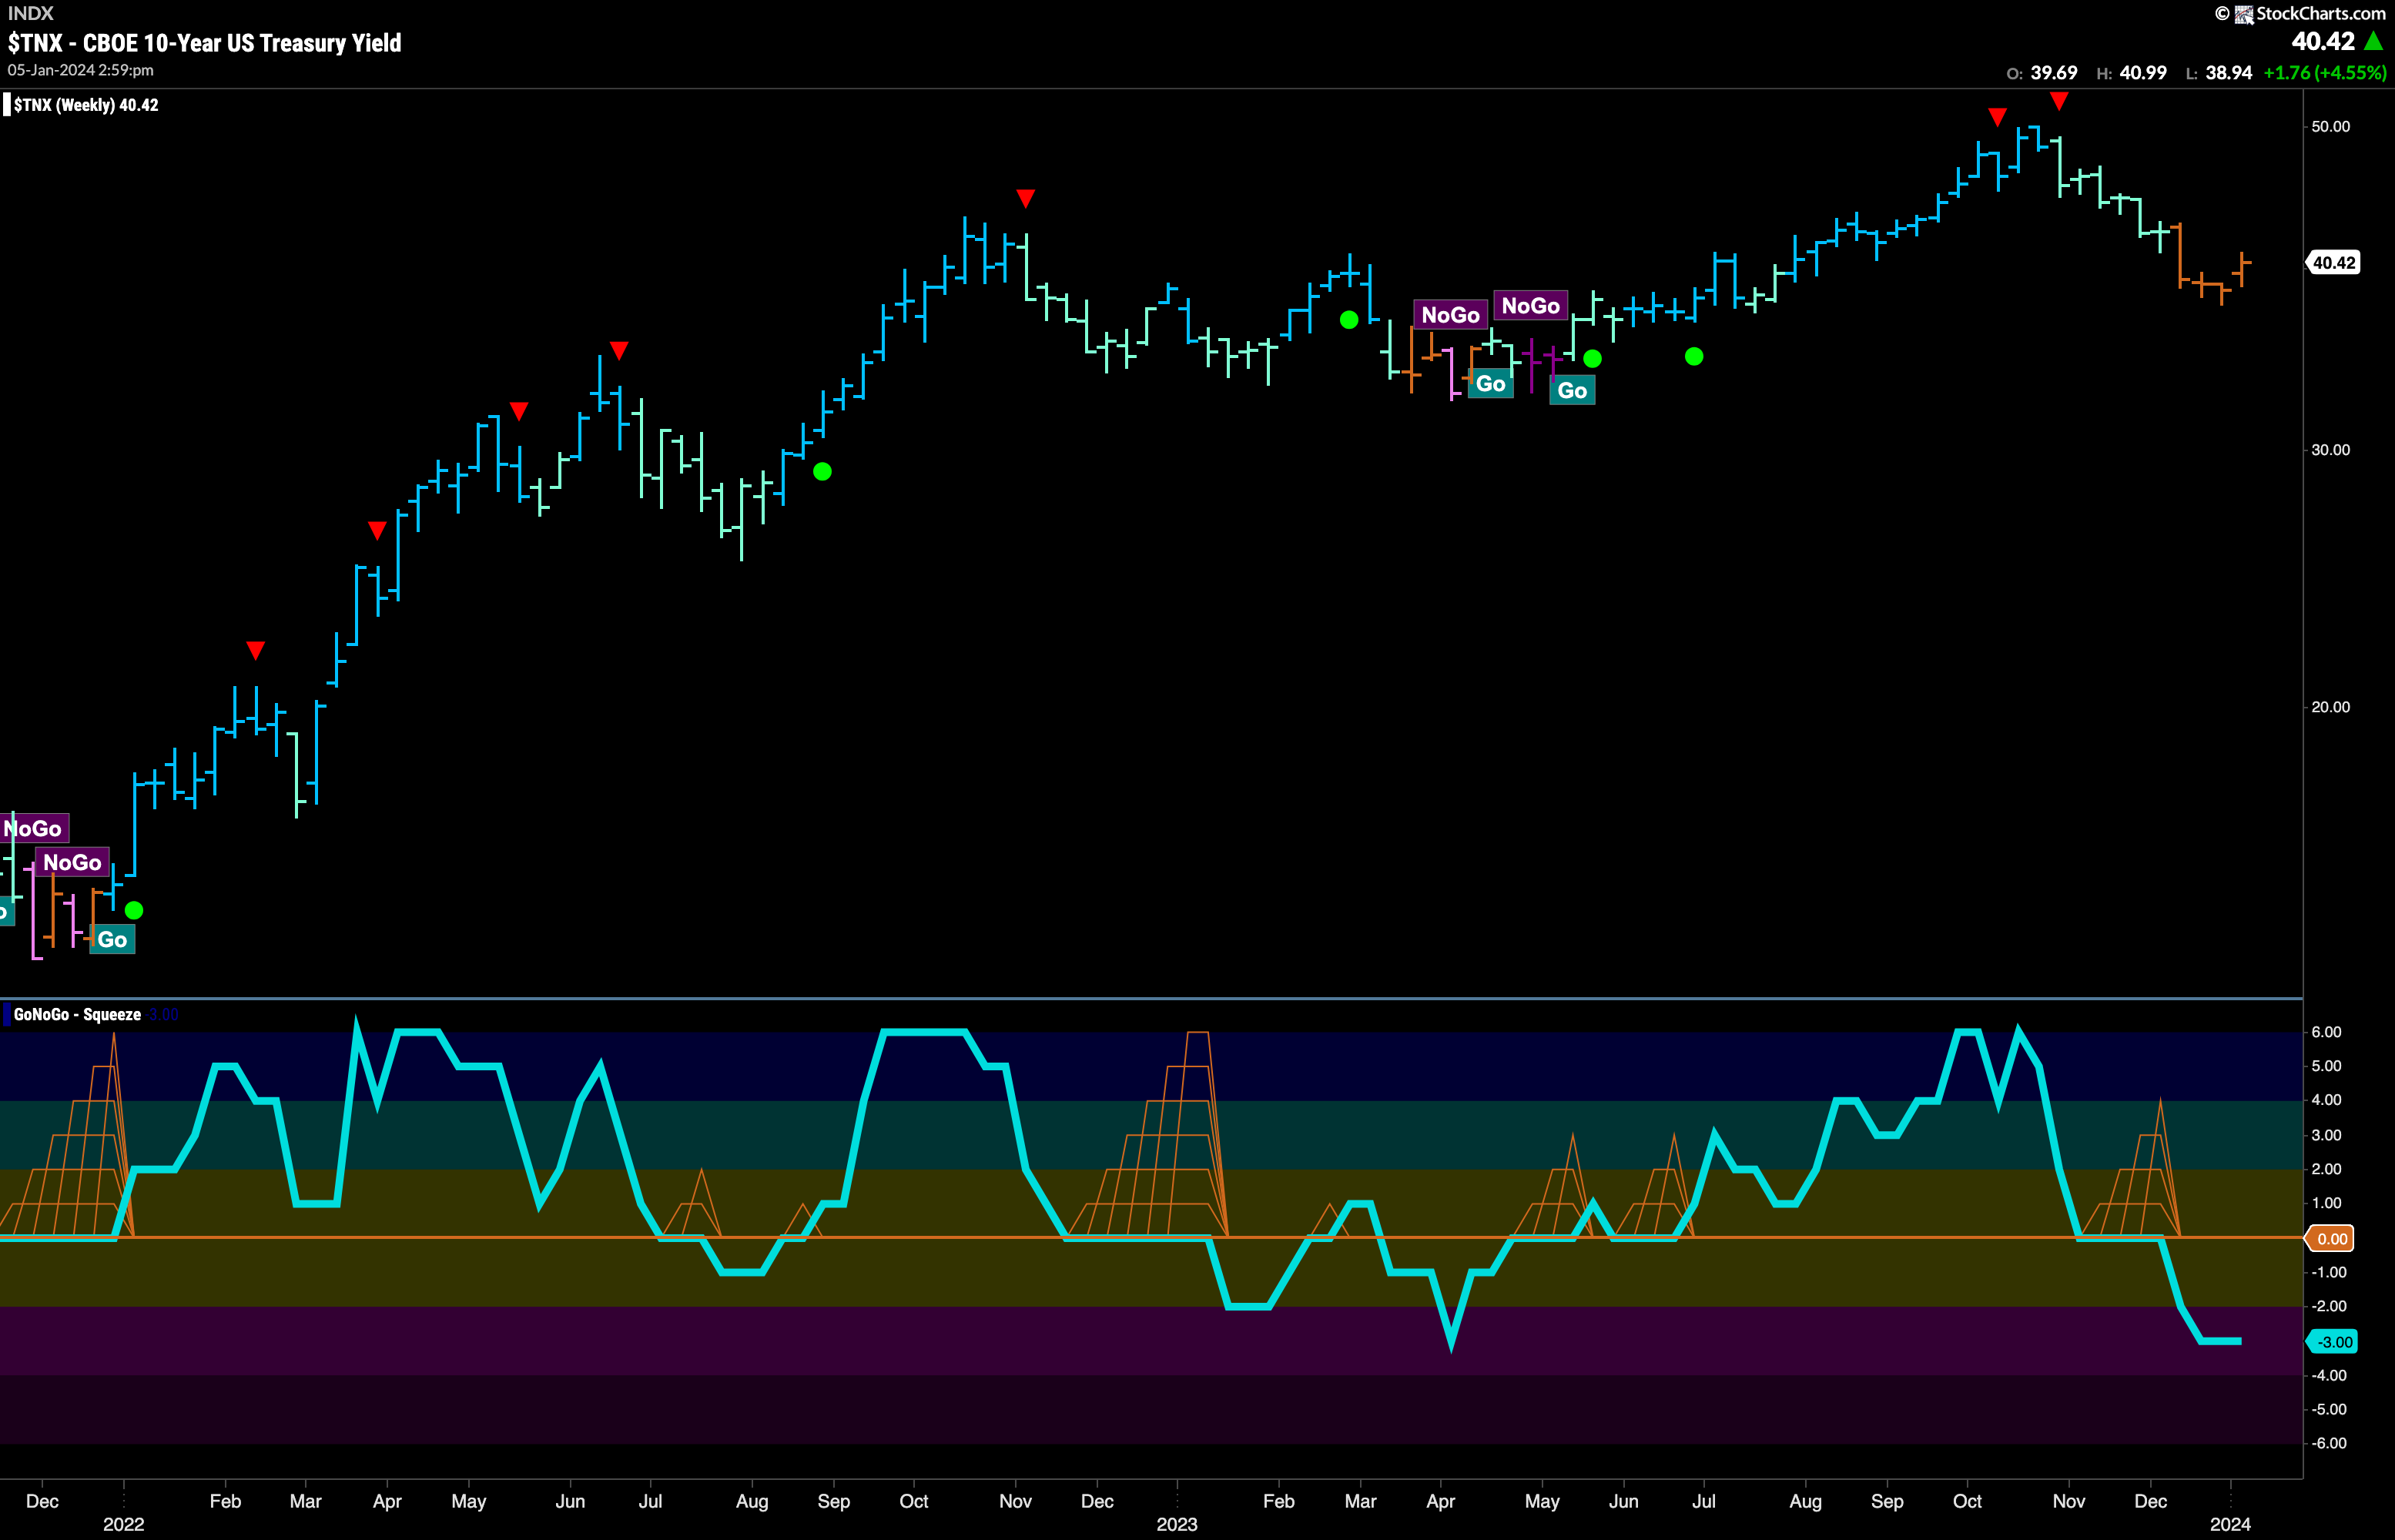
Dollar Shows Weakness in “NoGo”
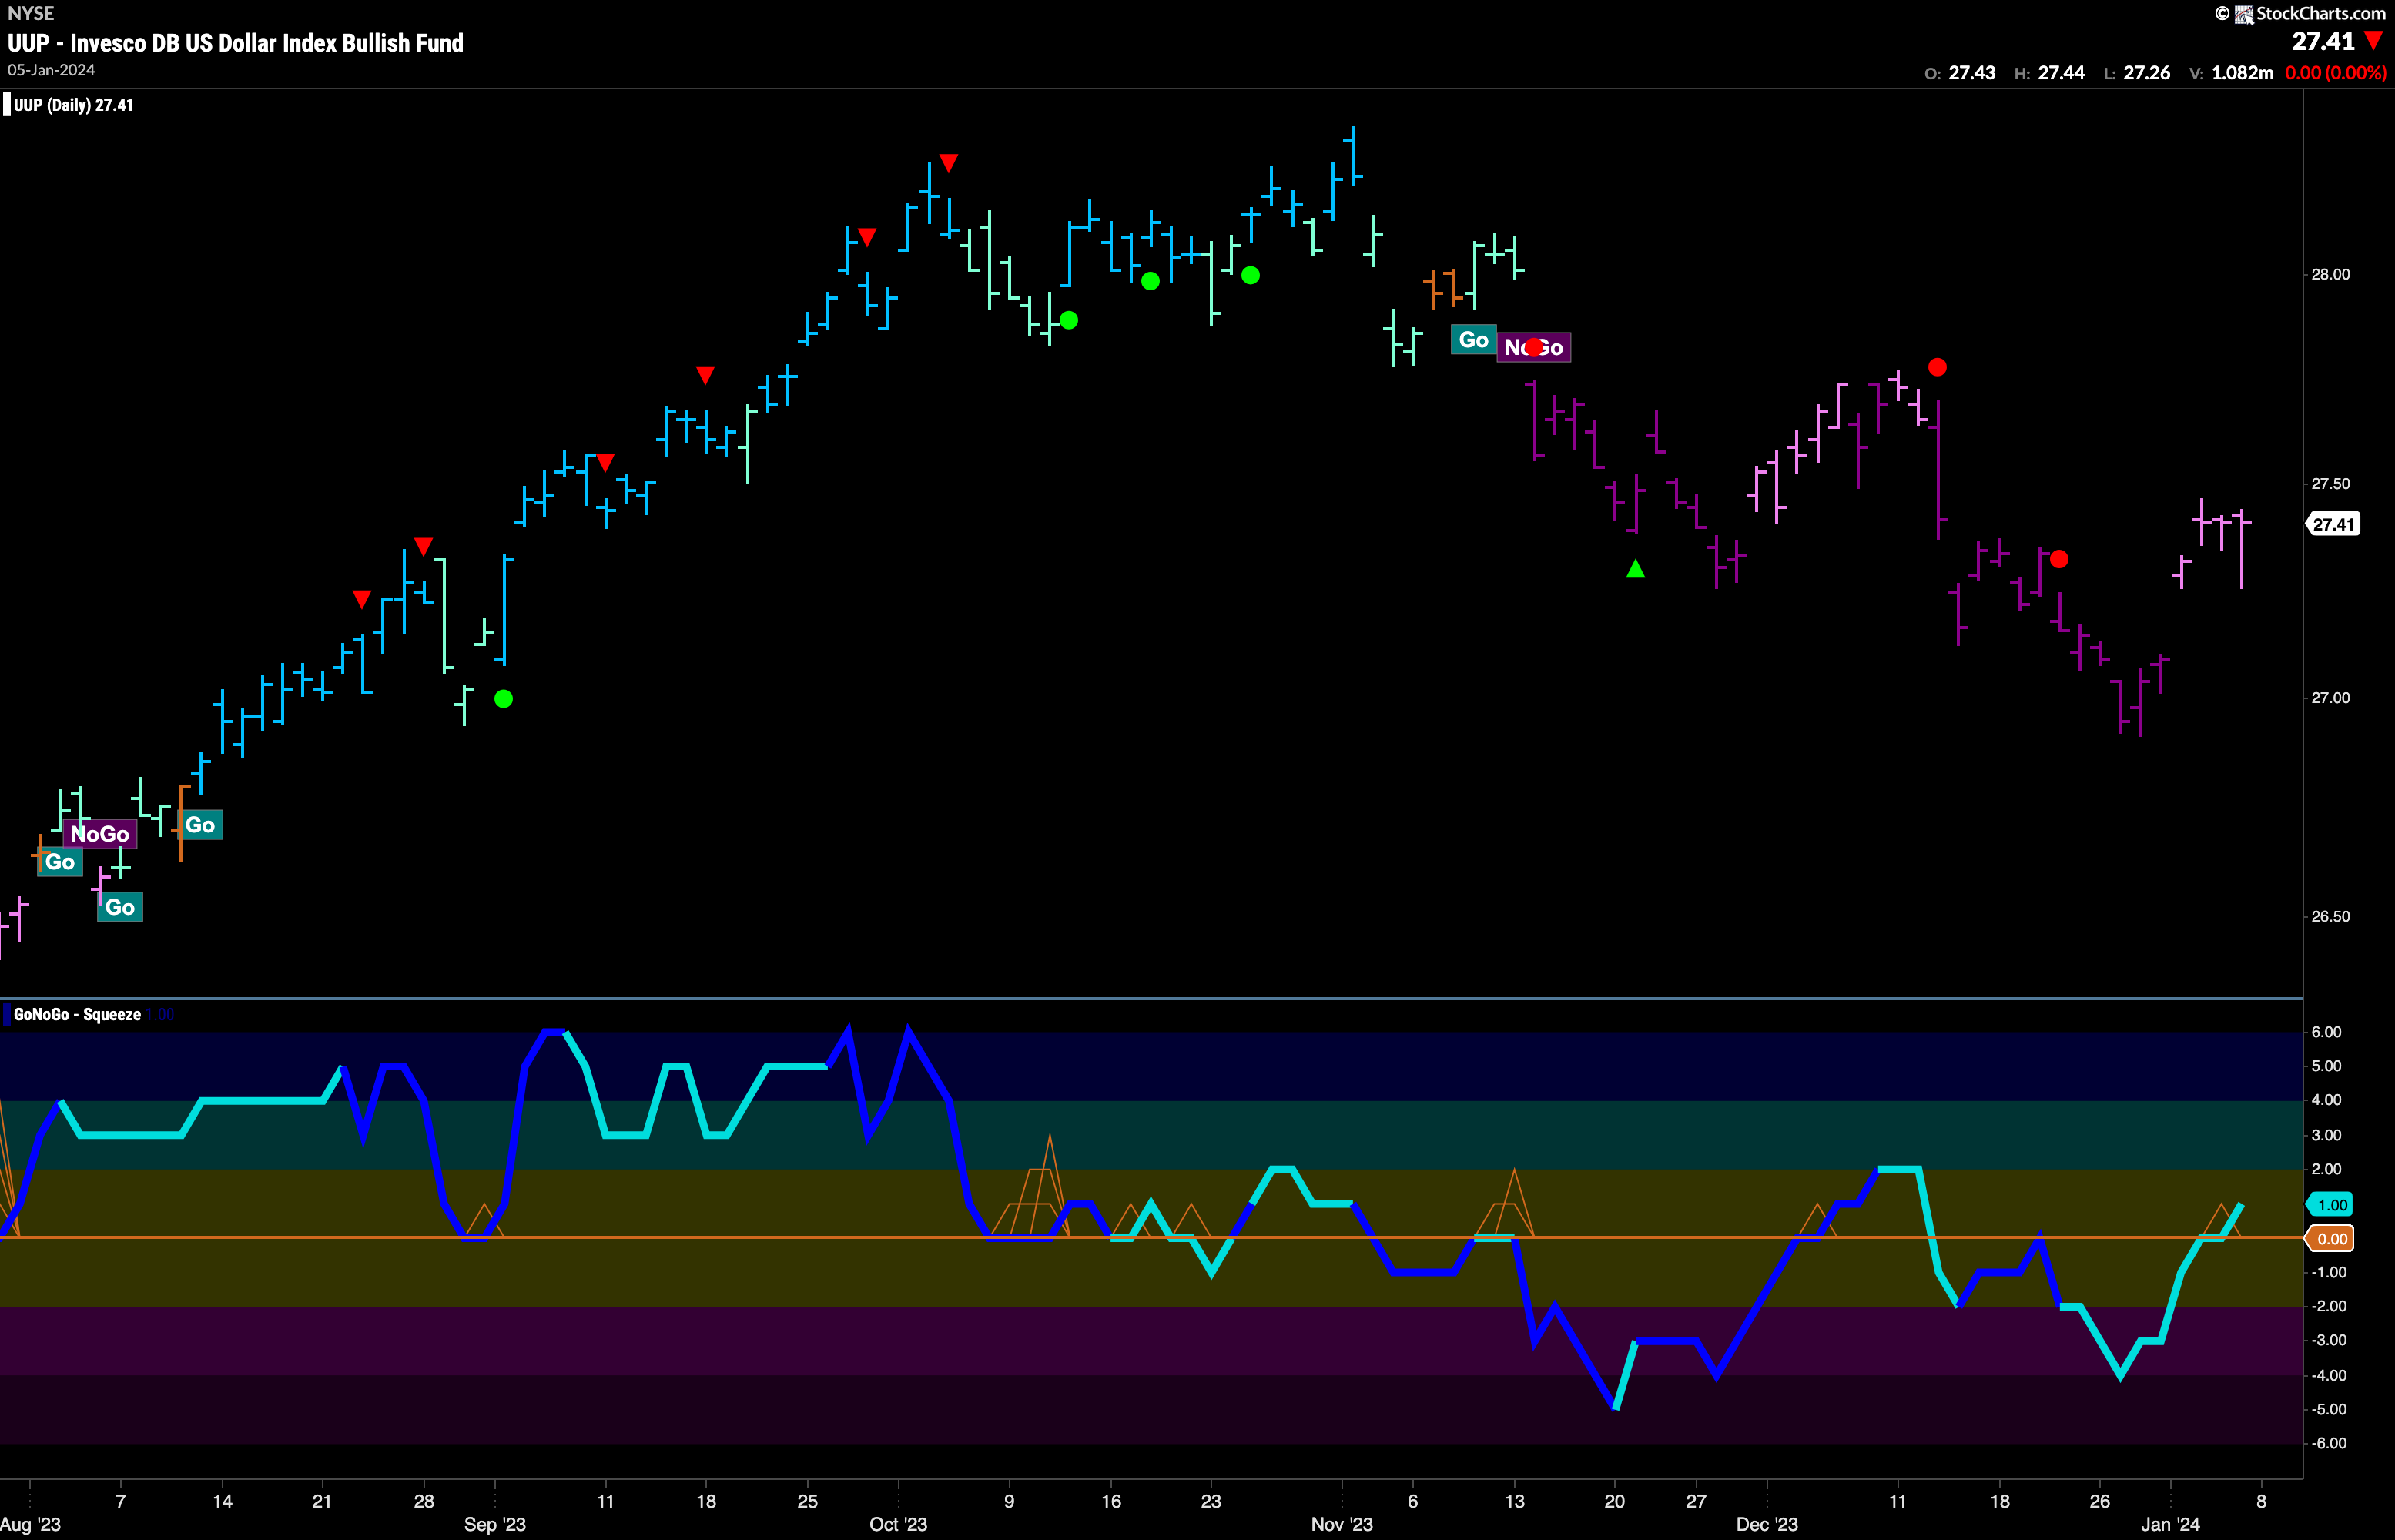
Looking at the daily chart below we see that the “NoGo” trend is still in place but the GoNoGo Trend indicator paints weakness with pink bars. After the most recent low price gapped higher and price was able to remain higher this past week. GoNoGo Oscillator rose to test the zero line from below and we see that it has been able to edge its nose into positive territory. This flies in the face of the “NoGo” trend and we will watch to see if price continues to go higher of if momentum will turn lower once again.
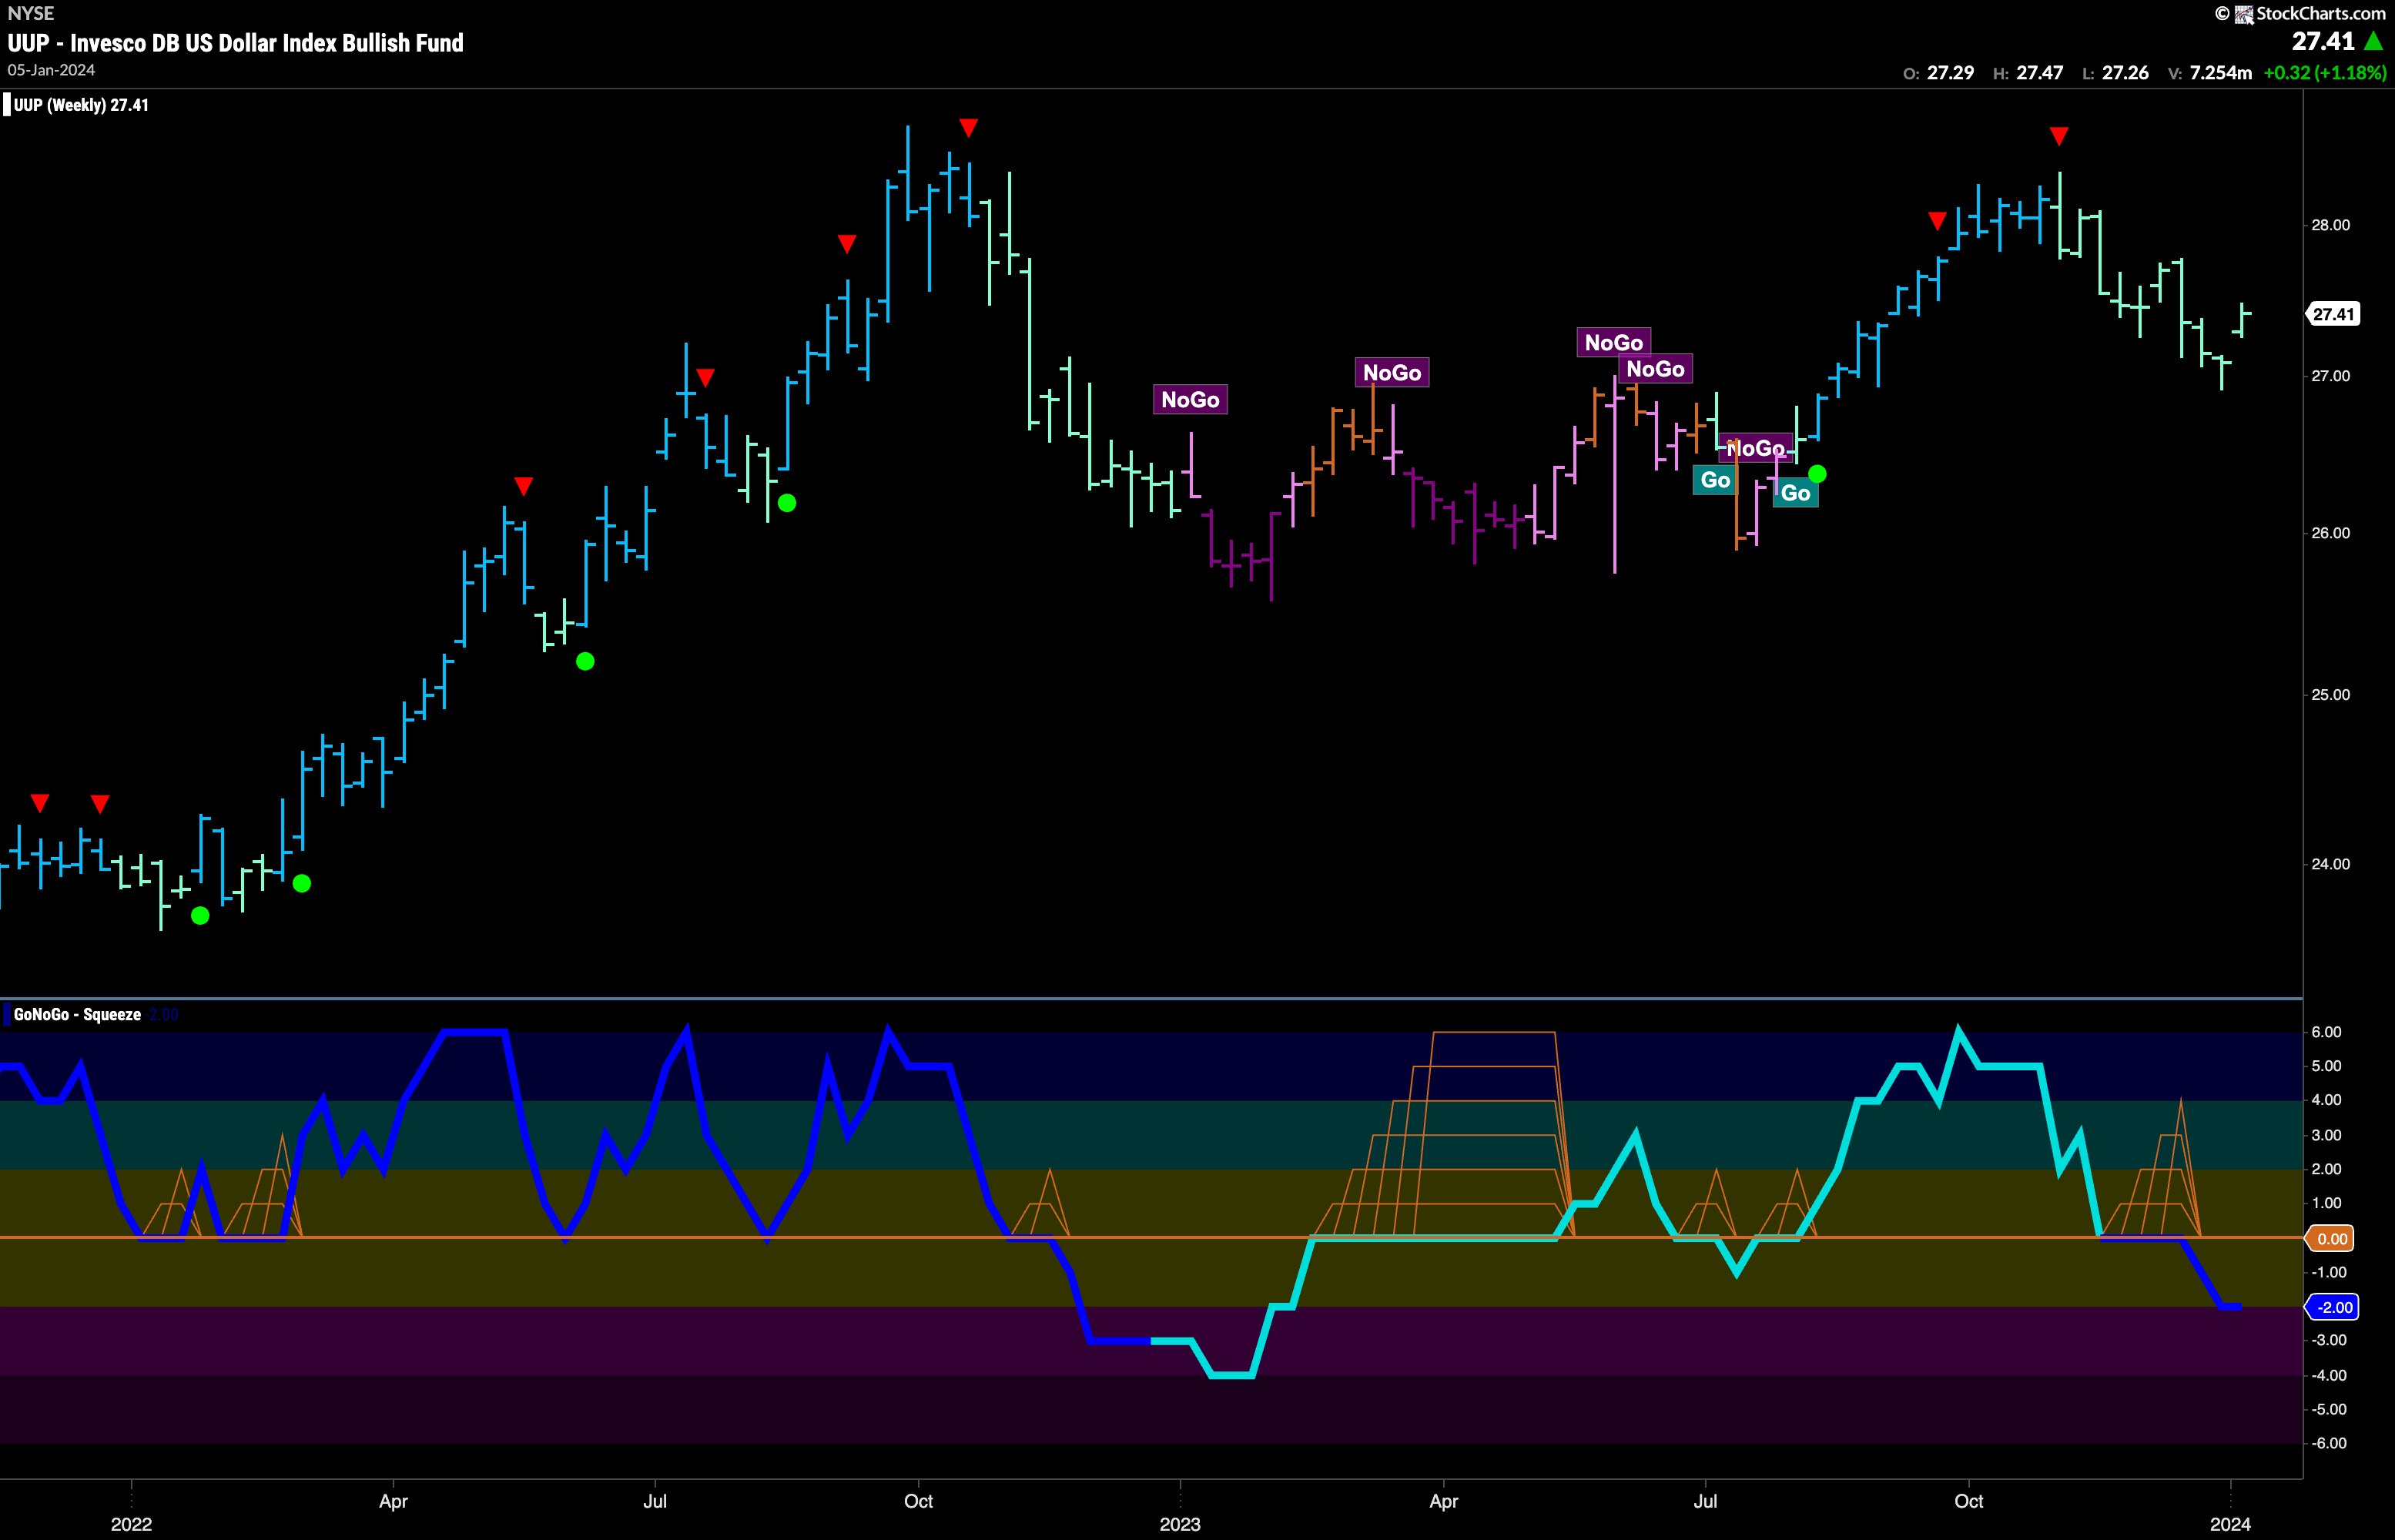
The weekly chart below shows that there is pressure on the long term dollar “Go” trend. GoNoGo Trend paints another weaker aqua bar even as price gapped higher. Price did seem to respond to the support that was offered by last summer’s prior highs. GoNoGo Oscillator is in negative territory and volume is heavy. This remains a concern for the health of the “Go” trend as we know that momentum should remain primarily positive in “Go” trends if they are to persist.
Oil in Max GoNoGo Squeze
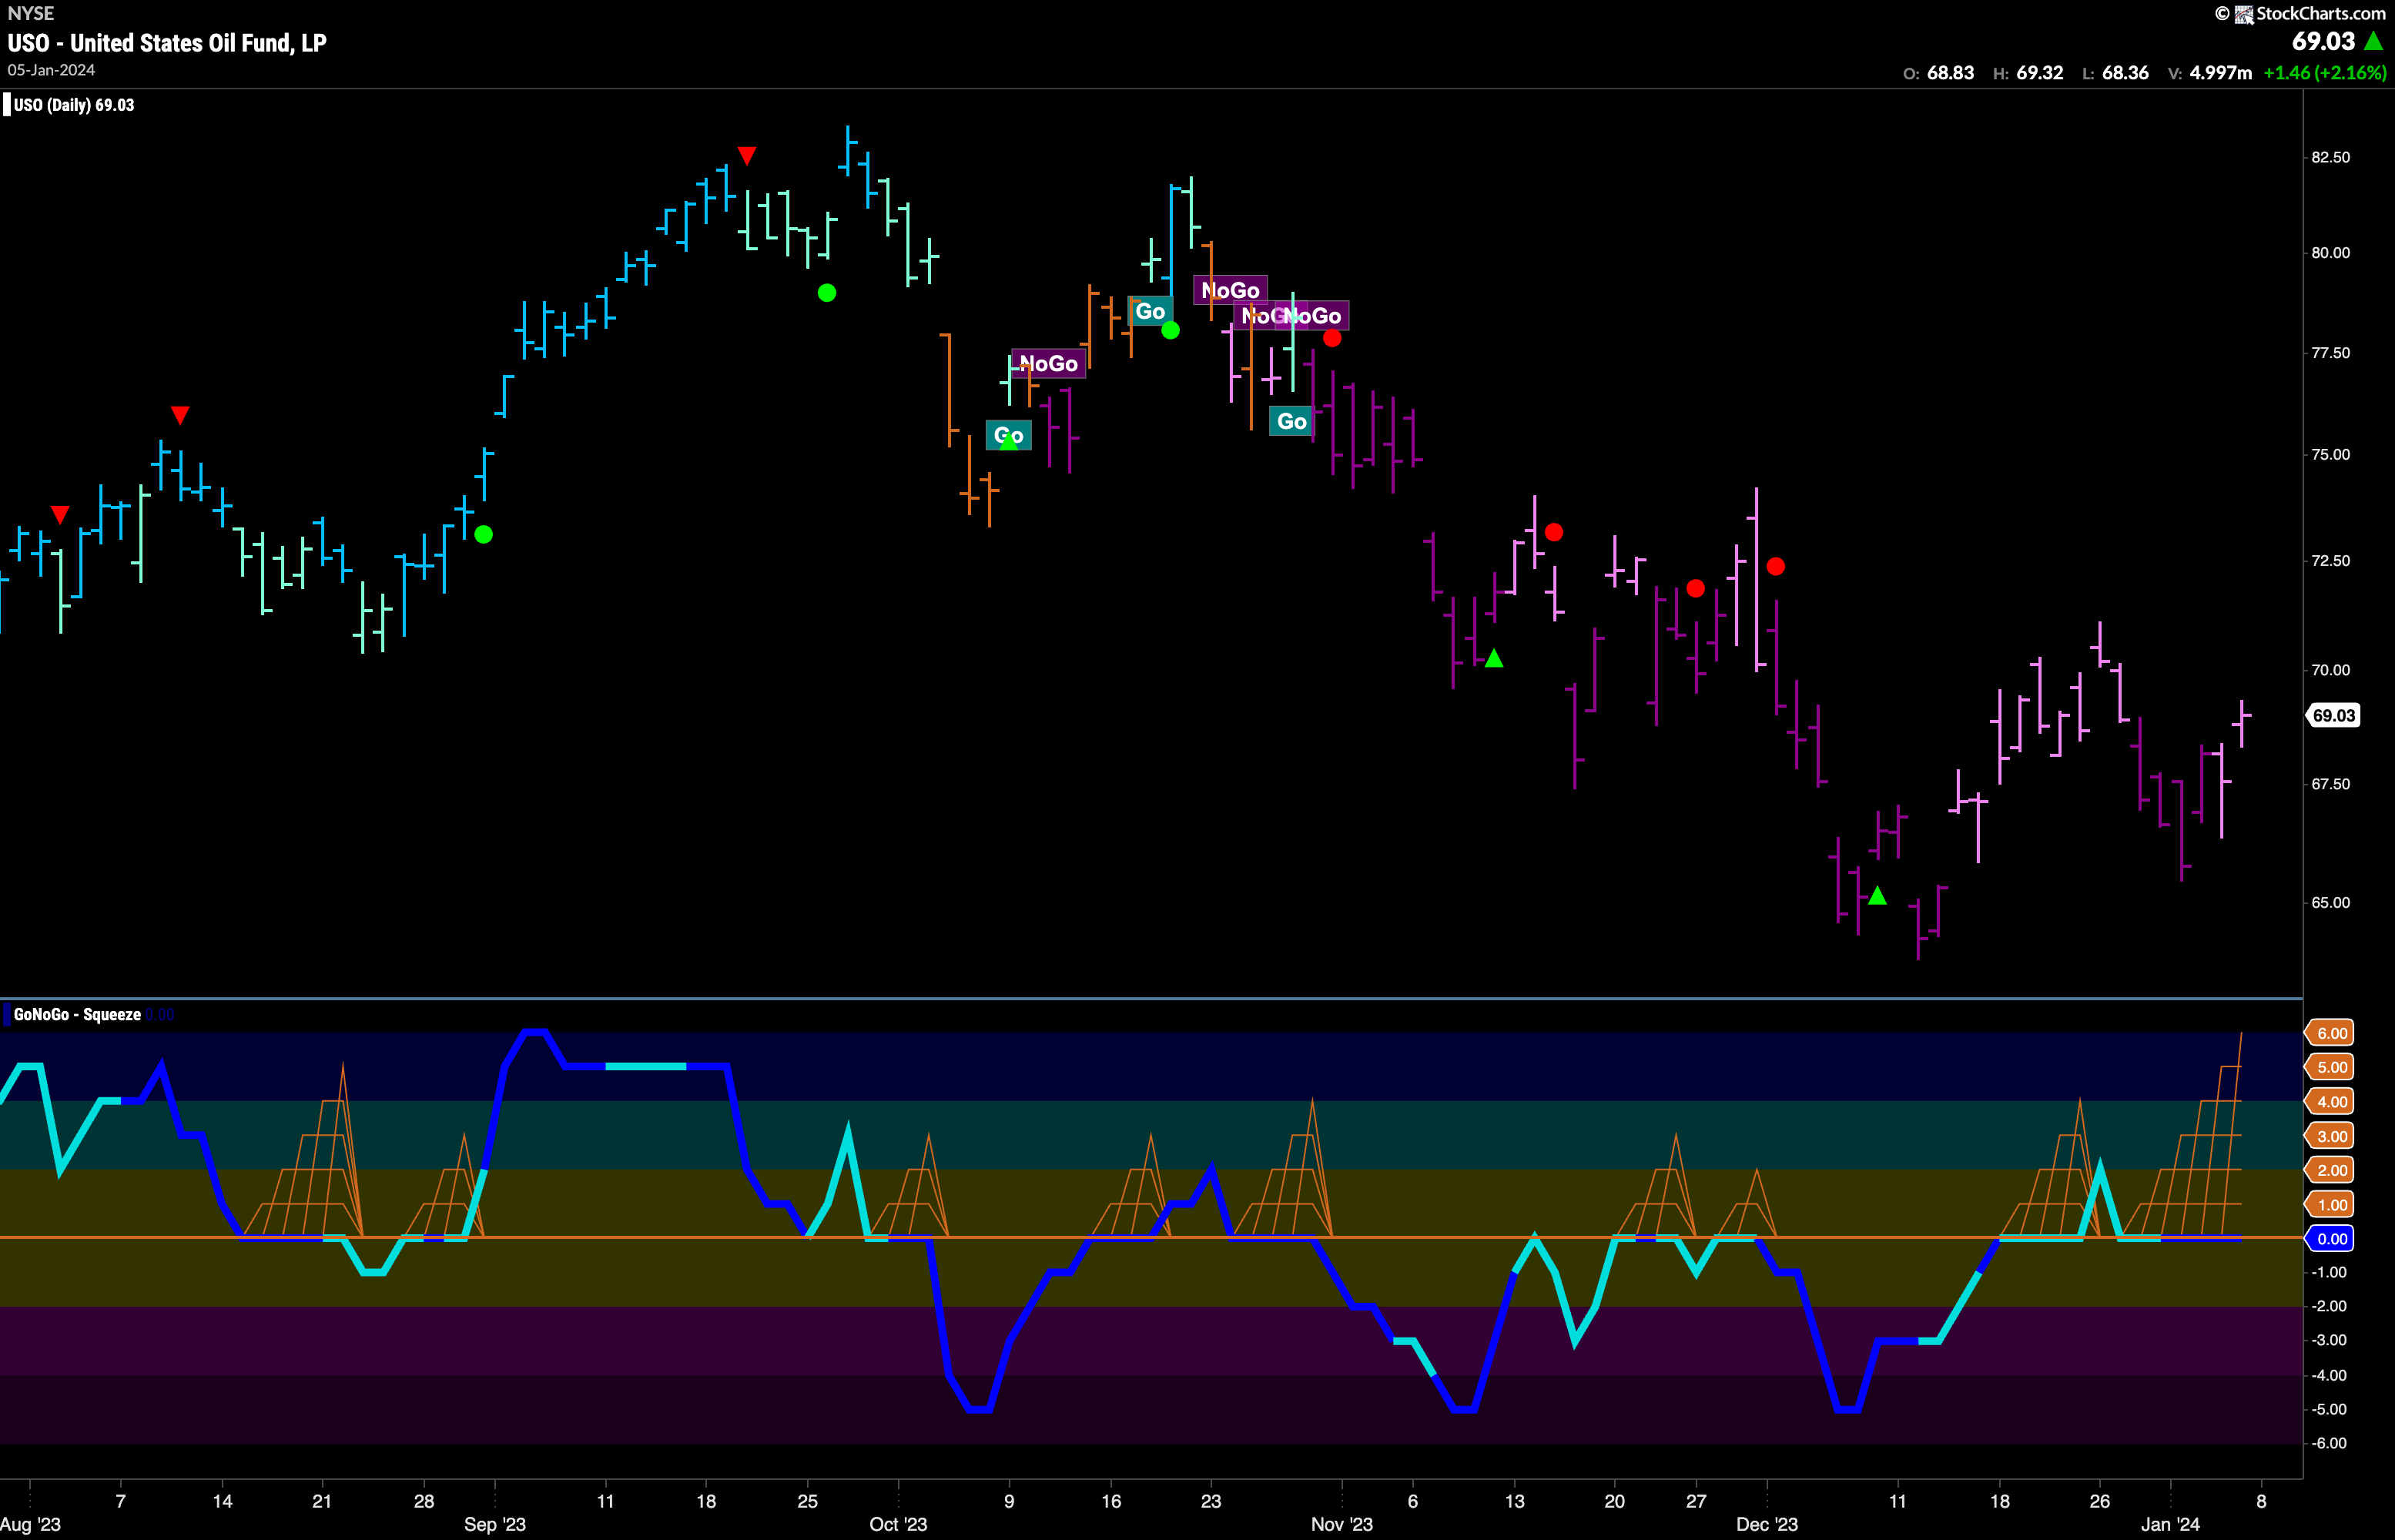
Oil prices seem to have set a higher low as price rallied in the second half of last week. However, there remains little directional momentum as GoNoGo Oscillator rides the zero line causing the climbing grid of GoNoGo Squeeze to rise to its Max. The direction of the break out of this Squeeze will help determine price’s next direction. If the Squeeze is broken into positive territory then we will look for price to follow its higher low with a higher high and a potential change in trend from “NoGo” to “Go”.
Gold Looks for Support in “Go” Trend.
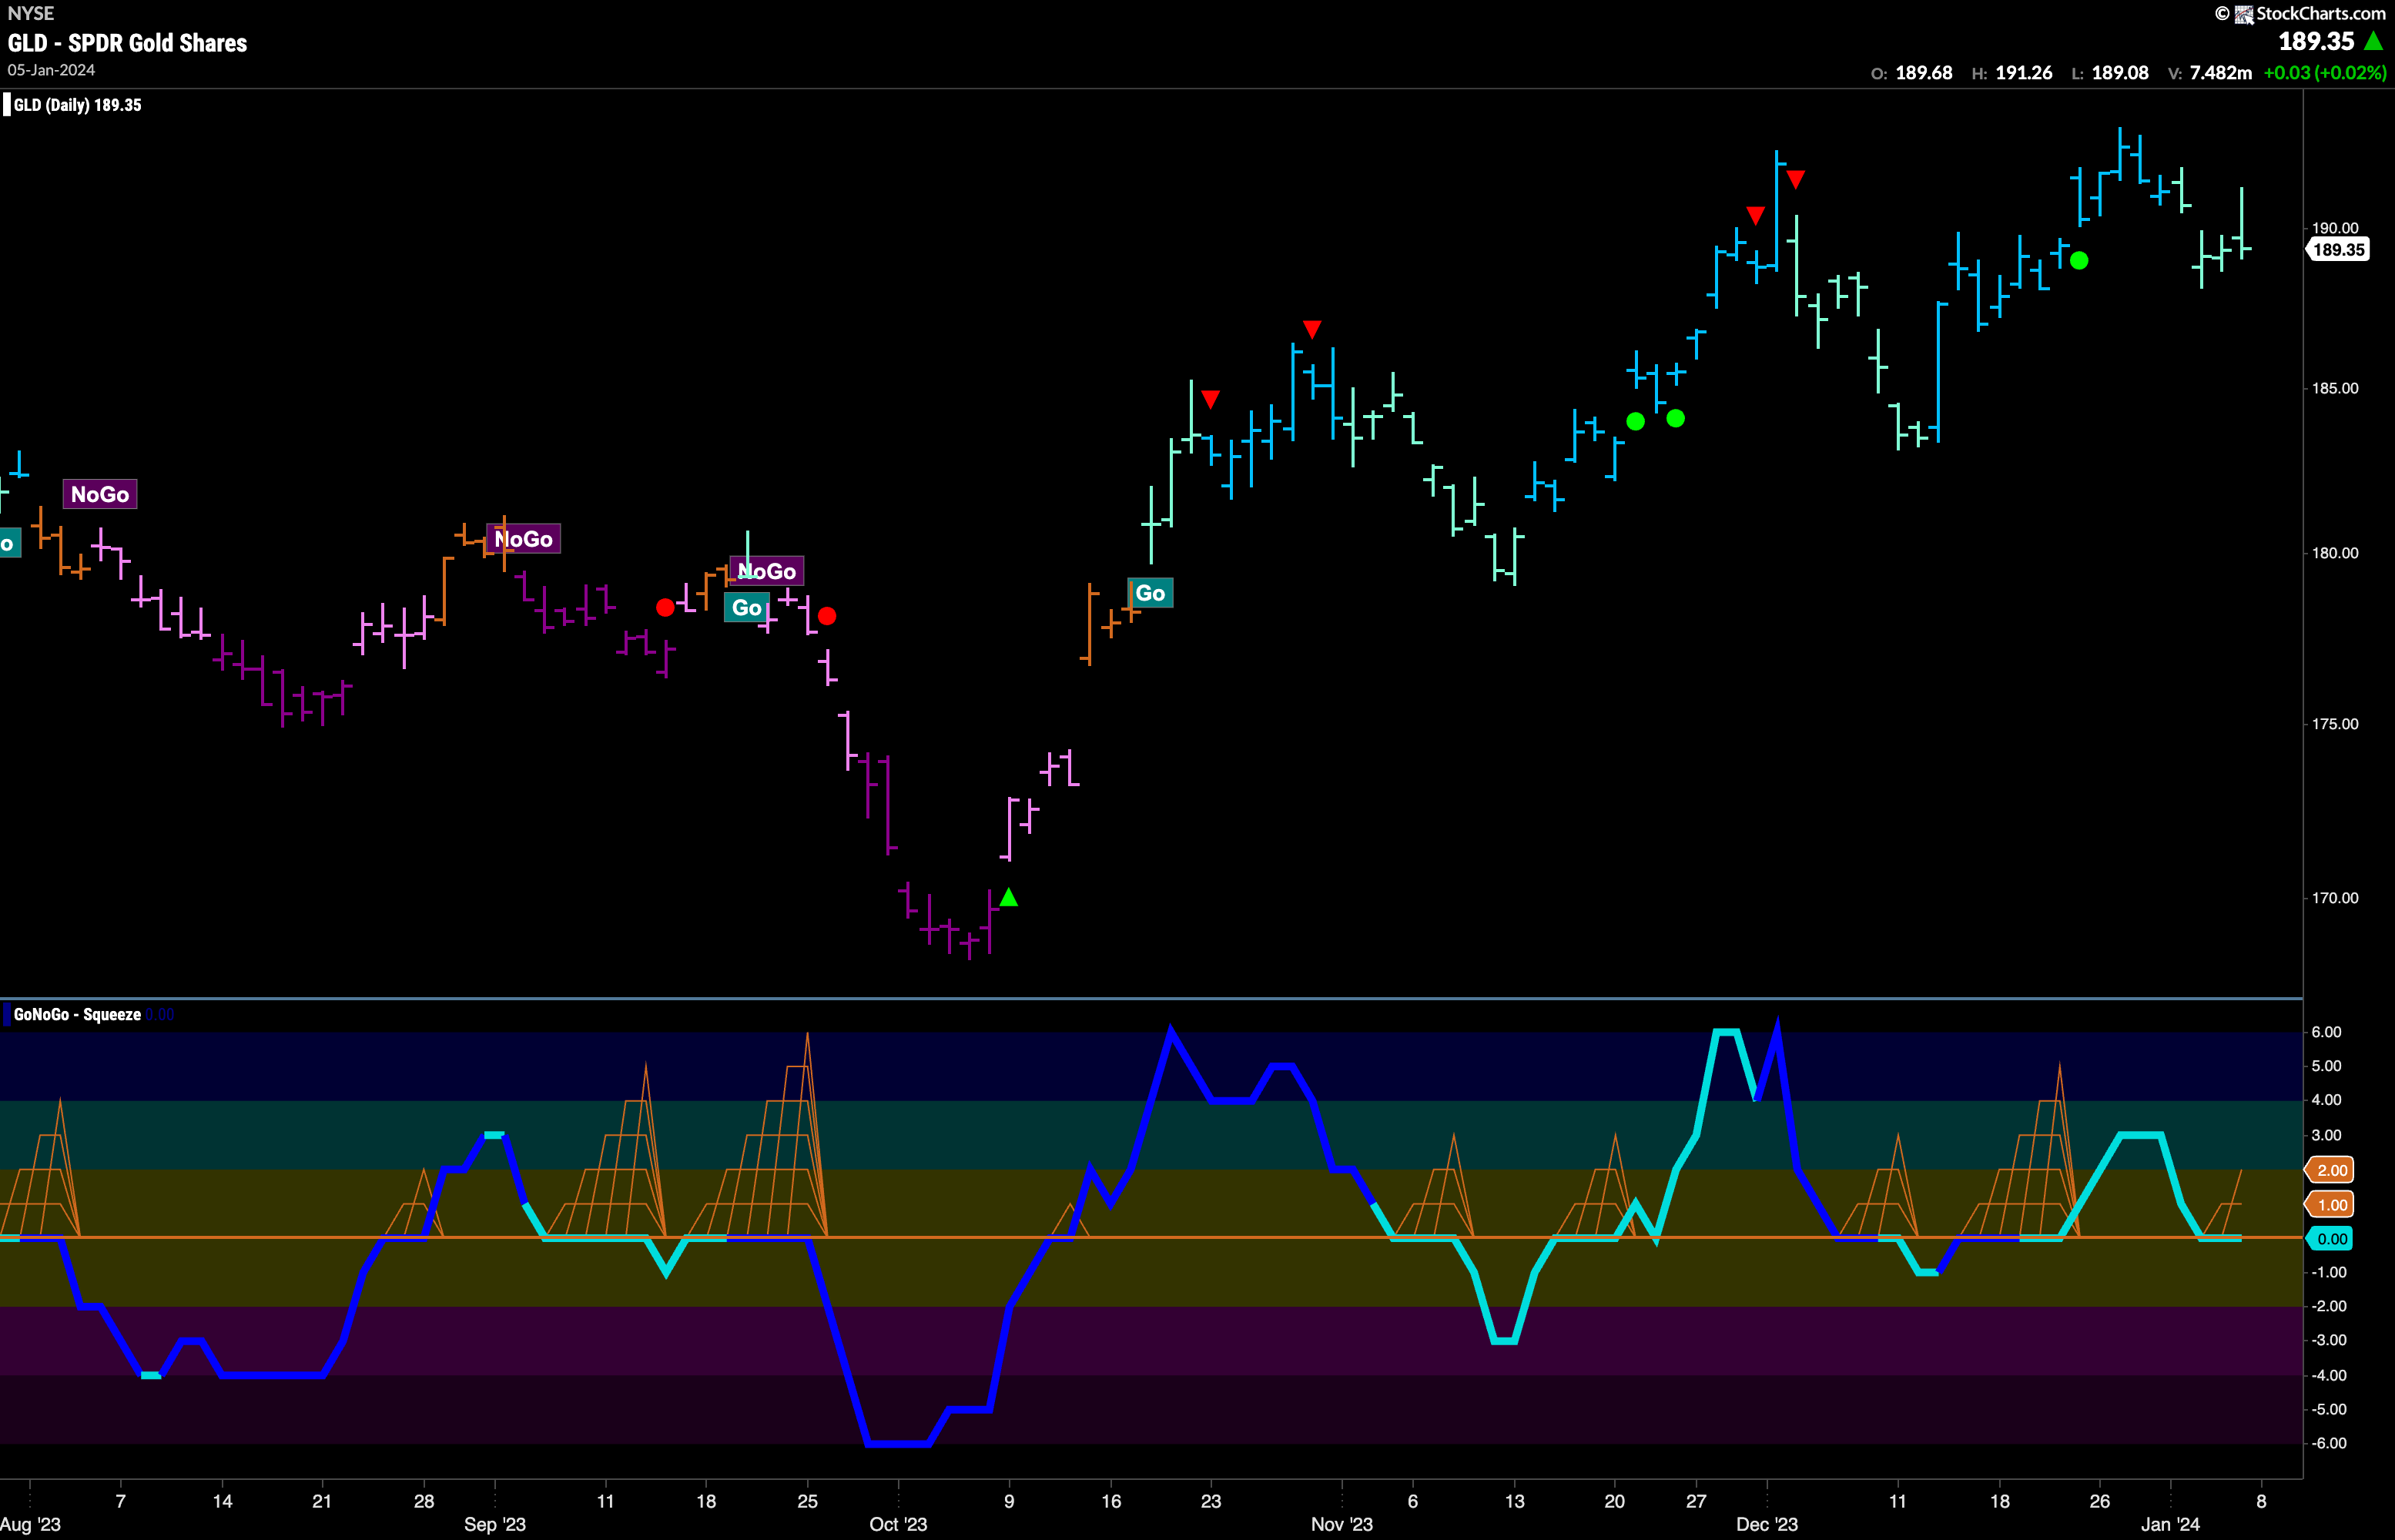
GoNoGo Trend shows that the “Go” trend was able to persist this week but the indicator paints weaker aqua bars as price fell from its recent high. GoNoGo Oscillator has fallen again to test the zero line from above. We will look to see if it can find support at this level. If it does, we will be able to say that momentum is resurgent in the direction of the underlying “Go” trend and will look for price to make an attempt at a new high.
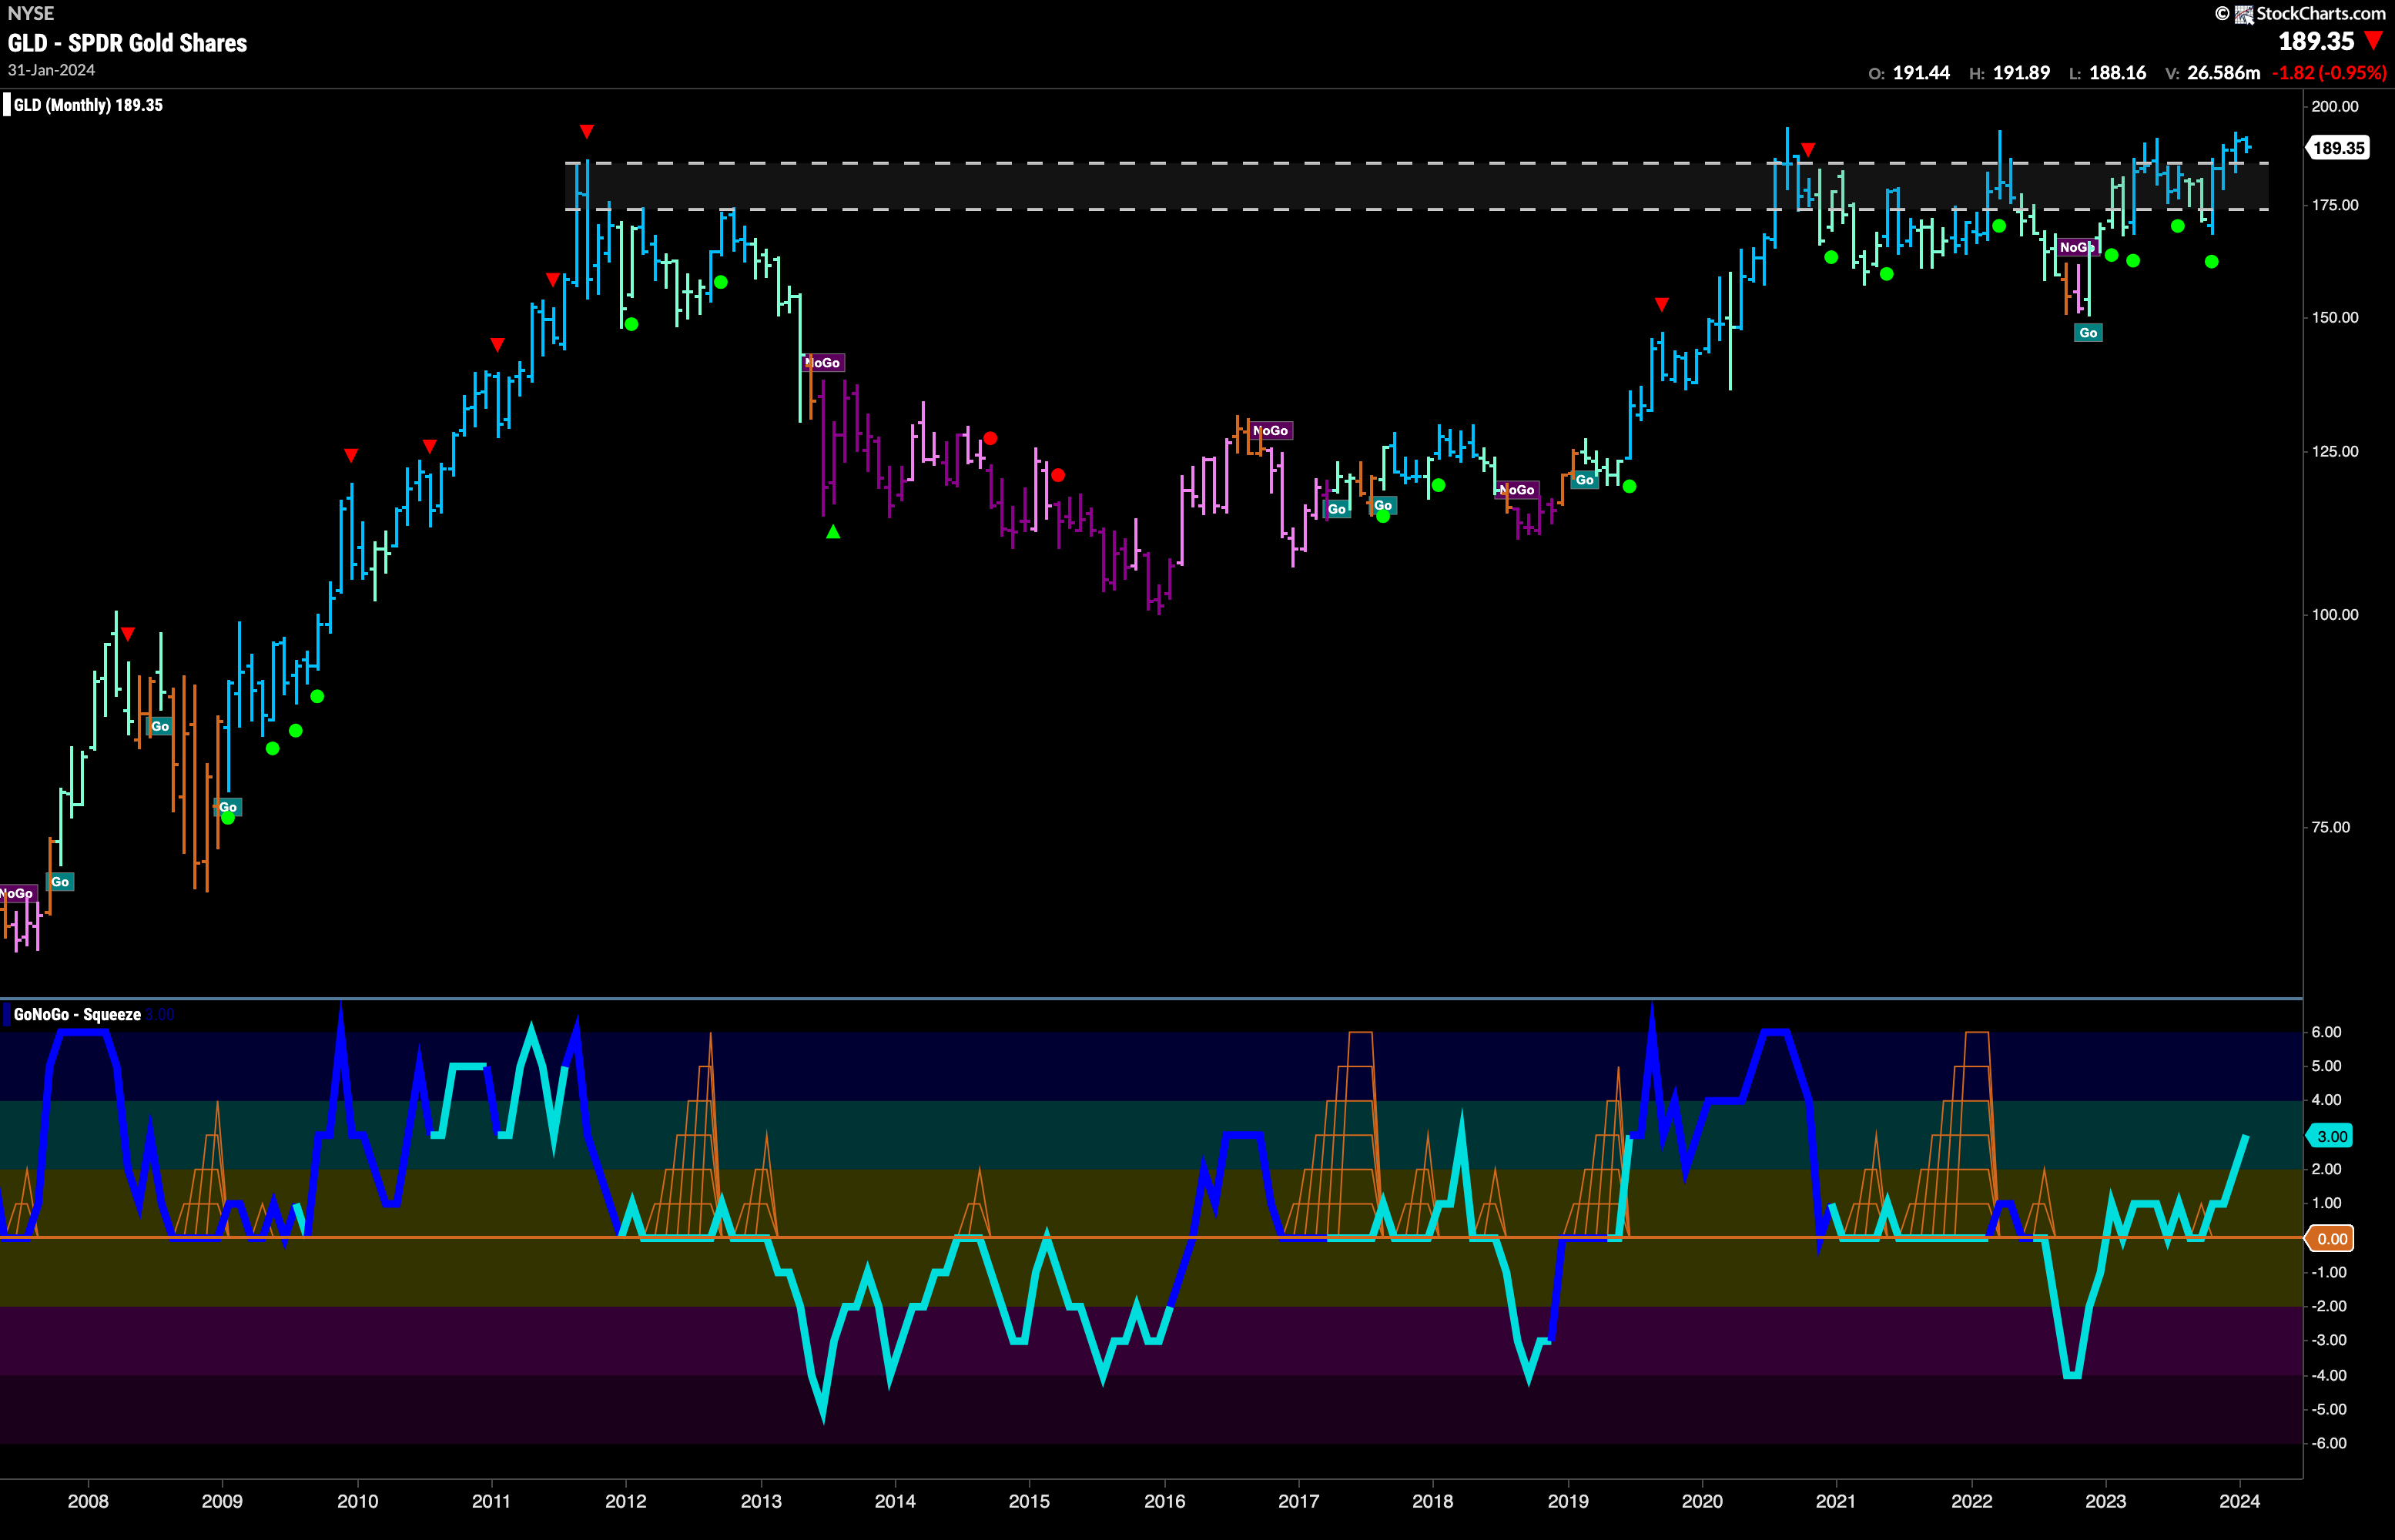
The monthly chart continues to be bullish. It is early in the month of January and while prices fall slightly we are still above the top of the channel that we see on the chart. If we can consolidate at these levels then a break out seems more likely and the beginning of the move higher that has taken over a decade to begin may well be about to happen.
Sector RelMap
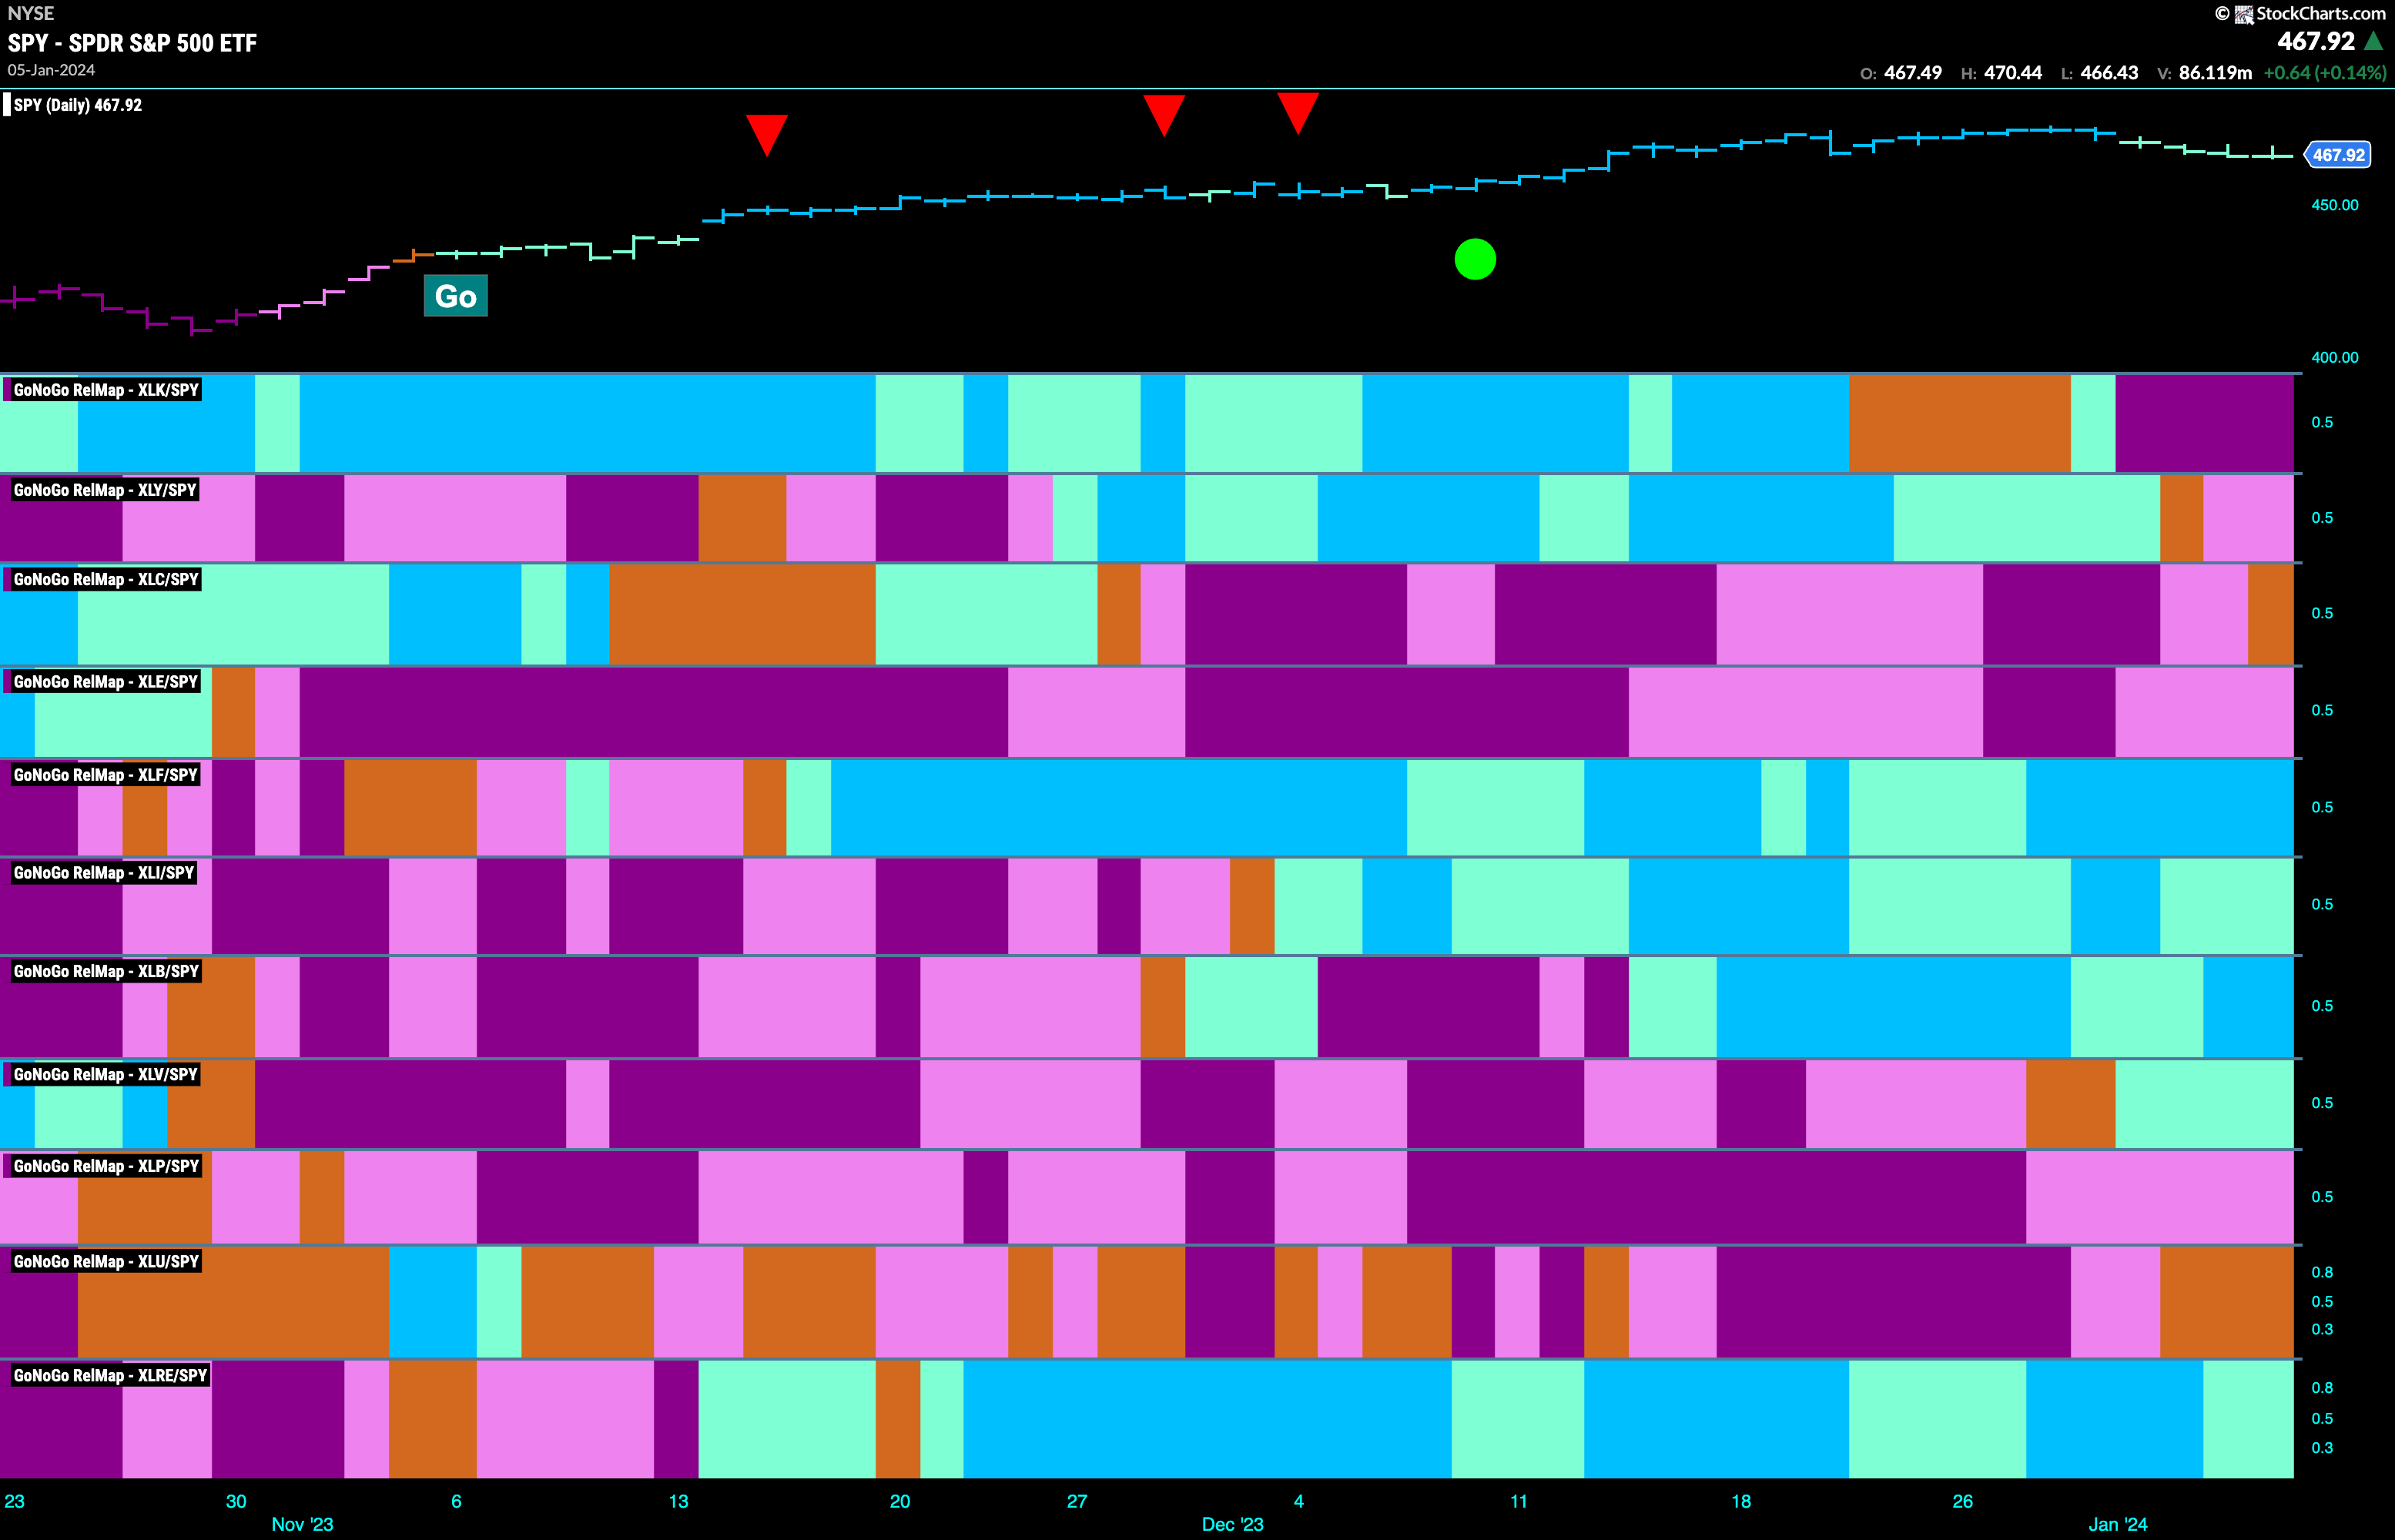
Below is the GoNoGo Sector RelMap. This GoNoGo RelMap applies the GoNoGo Trend to the relative strength ratios of the sectors to the base index. Looking at this map, we can quickly see where the relative outperformance is coming from as well as which sectors are lagging on a relative basis. 5 sectors are outperforming the base index this week. $XLF, $XLI, $XLB, $XLV and $XLRE, are painting “Go” bars.
Healthcare Sub-Group RelMap
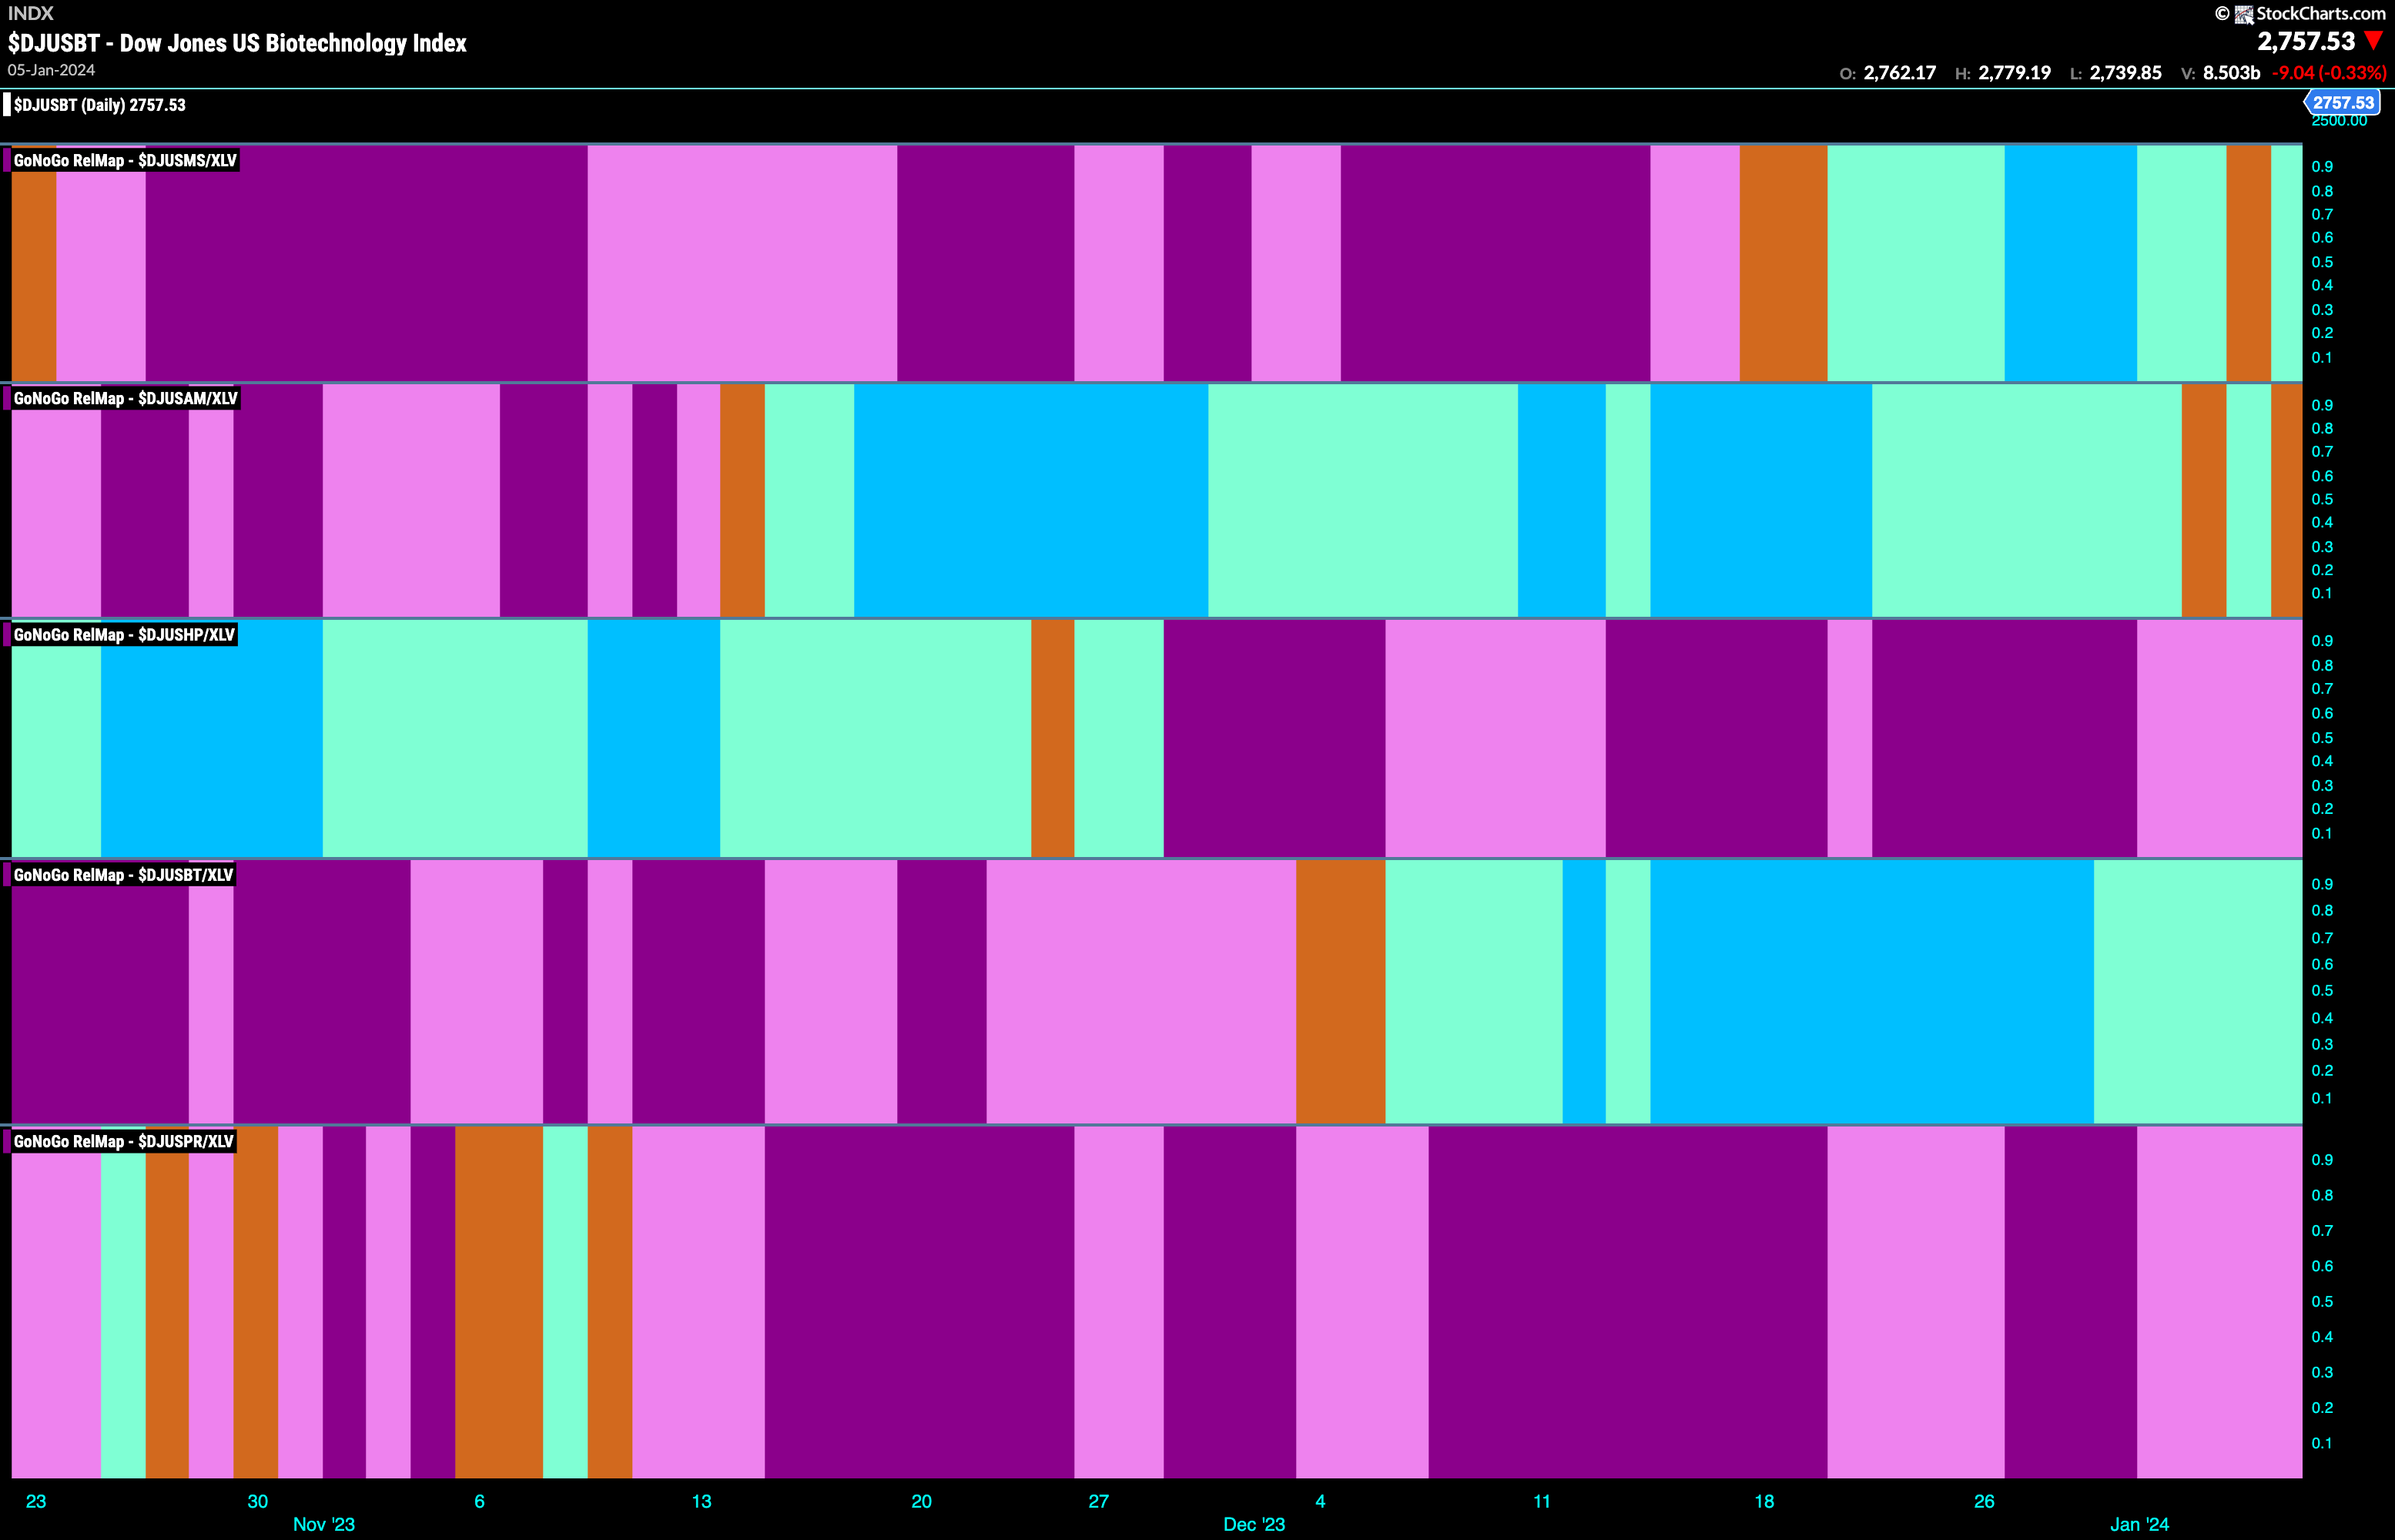
The GoNoGo Sector RelMap above shows that the materials sector continues to outperform and paints strong blue relative “Go” bars. Below is the GoNoGo RelMap showing the sub groups of the materials sector relative to the sector. We can see that there are several sub groups that are in relative “Go” trends. In the 4th panel, we can see that biotech has been in a relatively persistent “Go” trend.
$VTGN Setting up for Go Trend Continuation
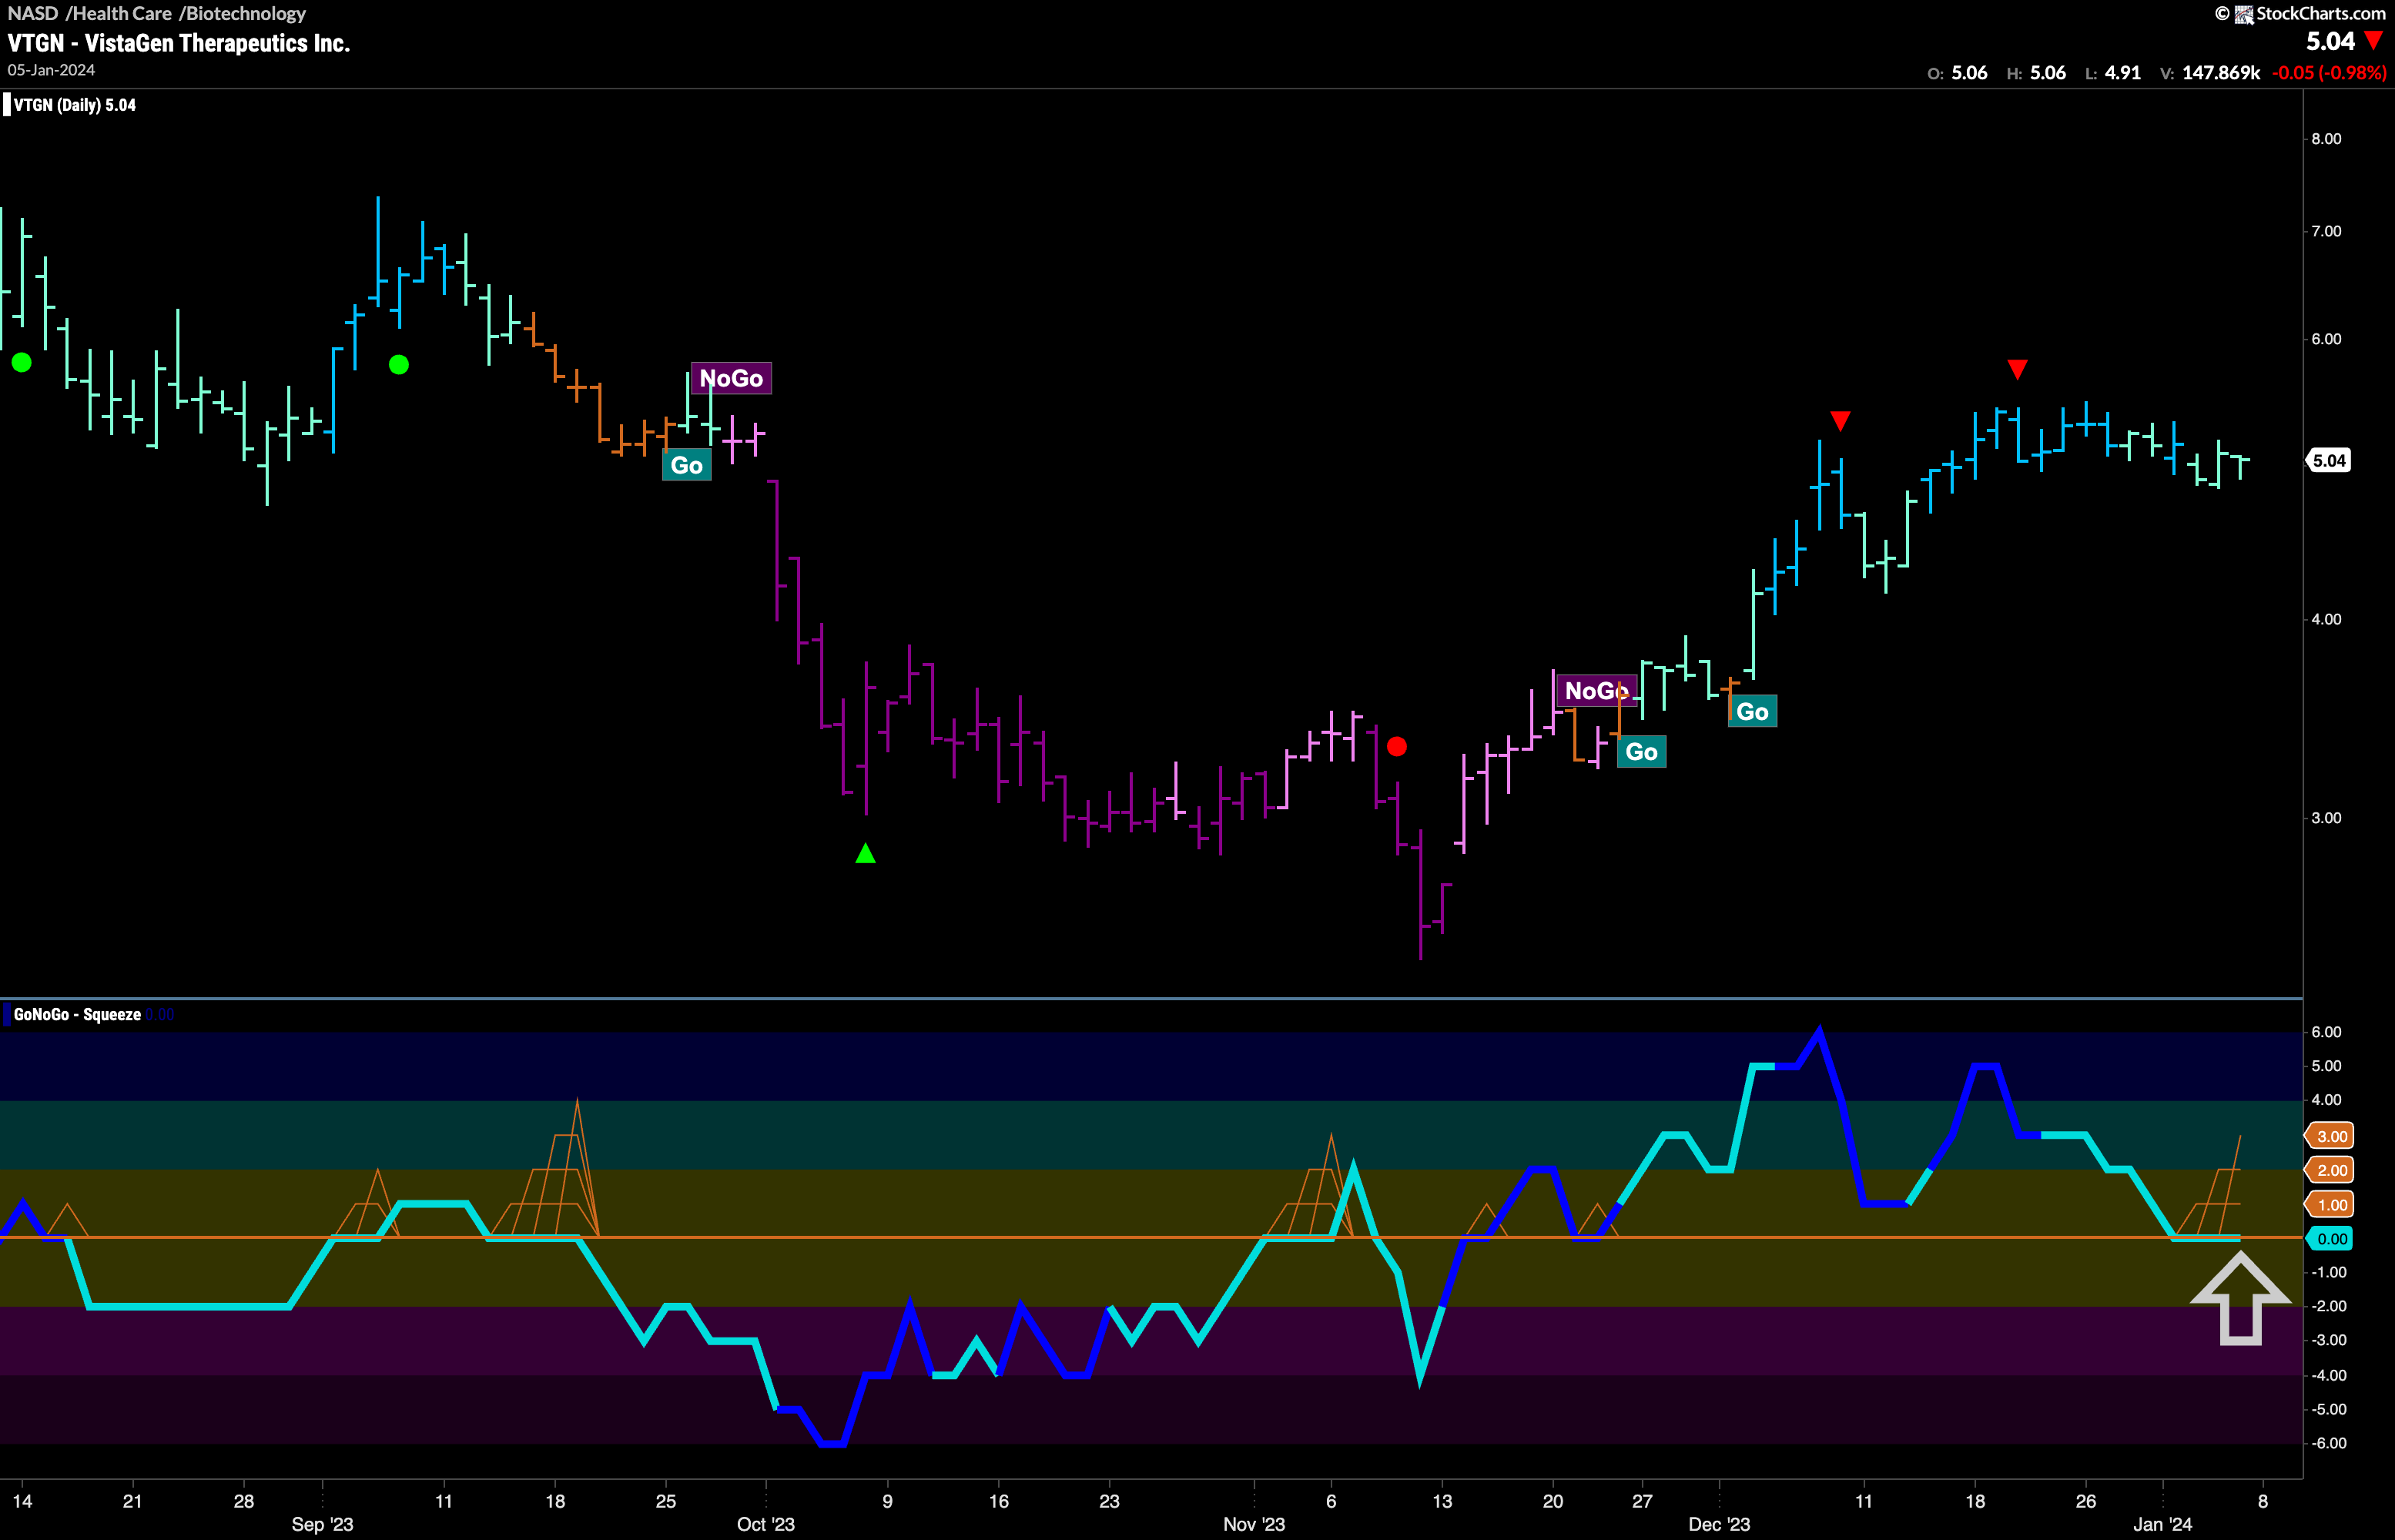
VistaGen Therapeutics entered a “Go” trend in late November of last year. After setting higher highs and higher lows through most of December we saw price move sideways over the last few weeks ever since the Go Countertrend Correction Icon (red arrow) late last month. As GoNoGo Trend painted more weak aqua “Go” bars GoNoGo Oscillator fell to the zero line where it has remained for the last few bars. We see the beginnings of a GoNoGo Squeeze build and we will watch to see if the Oscillator finds support at this level and rallies back into positive territory. If it does, we will expect price to make an attack at a new higher high with momentum realigned with the “Go” trend.
$RENB Enters Weekly “Go” Trend
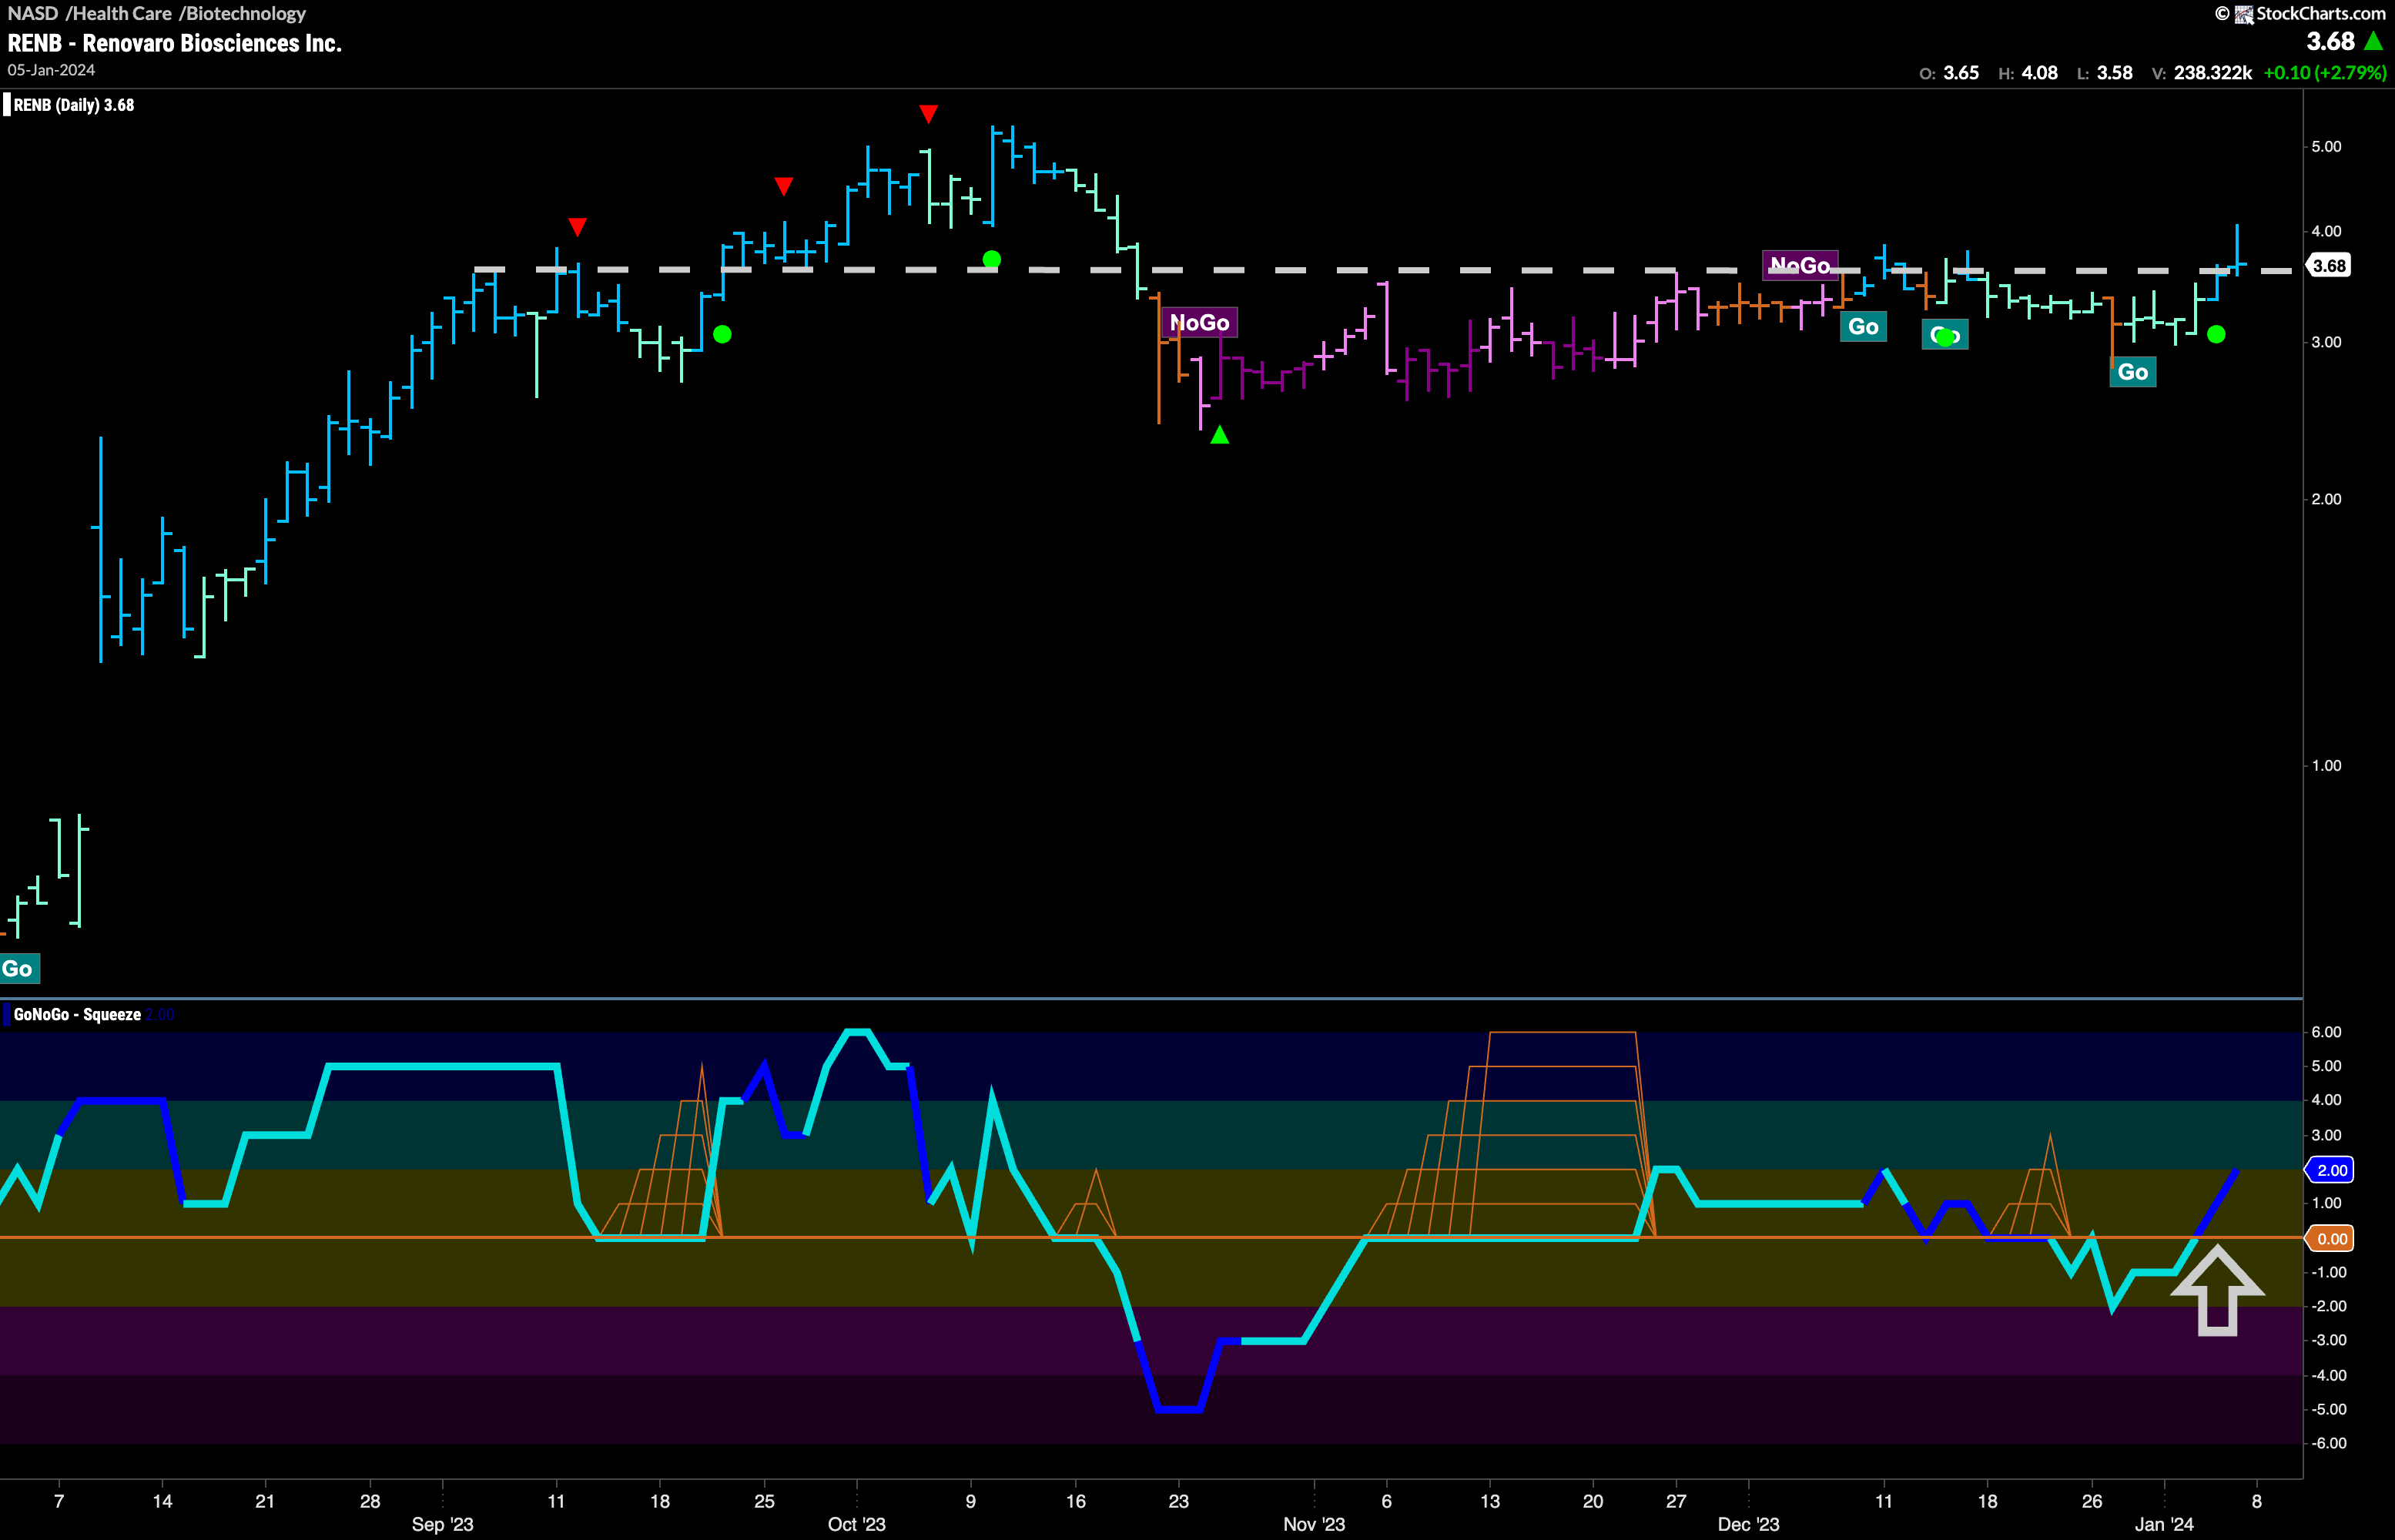
The daily chart below of Renovaro Biosciences shows that for several months there has been little price movement to speak of. We see GoNoGo Trend making a continued effort to paint “Go” colors as price tries to move higher. GoNoGo Oscillator has also been fighting in an attempt to break away from the zero line. With GoNoGo Trend painting strong blue bars and GoNoGo Oscillator breaking back above zero on heavy volume, we will look for price to move higher from here and set an initial target around $5.
