The major U.S. stock indexes slipped on Monday and Tuesday but came back in a big way late in the week, rising around 2% overall to record their second positive week in a row.
Ten of the 11 S&P 500 sectors finished the week in positive territory. The consumer discretionary (+3.6%), materials (+3.6%), and real estate (+3.5%) sectors each gained around 3.5%, while the communication services sector (-0.4%) was the lone holdout.
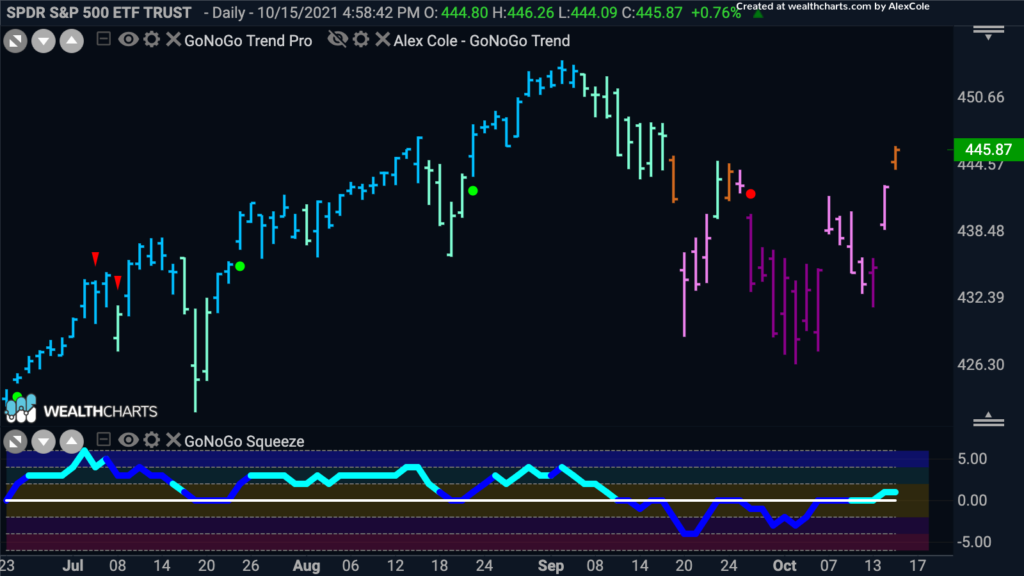
Strong earnings reports and a decline in weekly unemployment claims helped to fuel a stock market rally on Thursday. The S&P 500’s 1.7% surge was that index’s biggest daily gain in more than seven months; the NASDAQ also added 1.7% and the Dow was up 1.5%. S&P 500 setting up for a re-entry into the Go trend. The S&P 500 closed above its 50-day moving average on Thursday, and the follow-through from buyers carried over into Friday. These strong price gains Thursday and Friday ended the NoGo period for GoNoGo Trend which climbed back to neutral. Importantly, GoNoGo Oscillator rallied back to positive territory after forming a volatility squeeze.
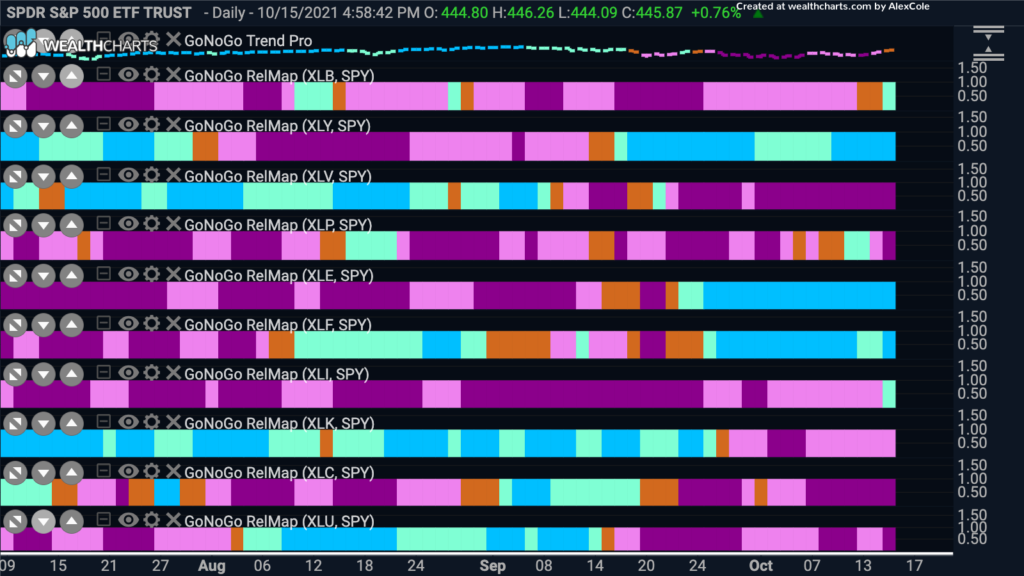
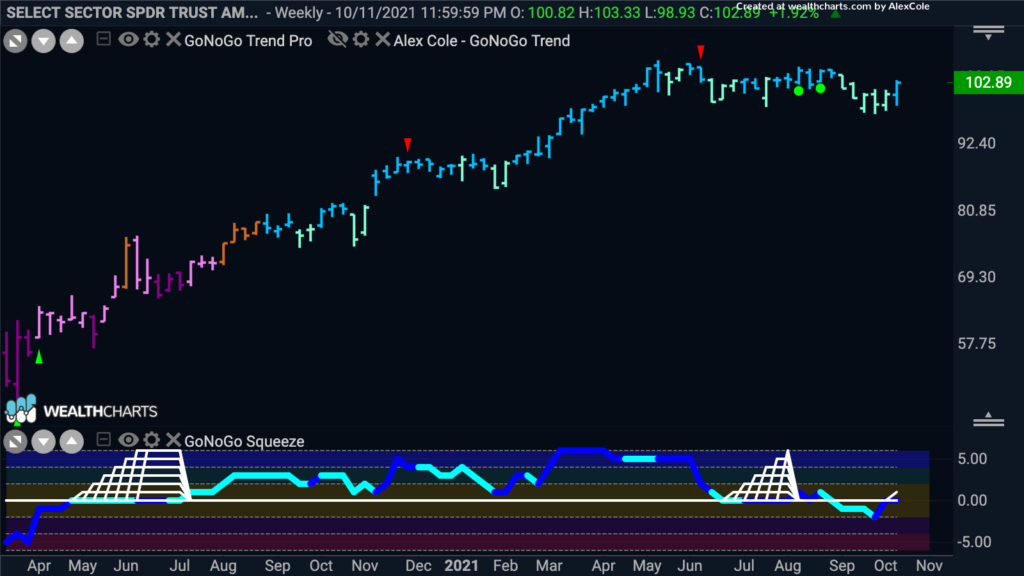
At the sector level, we saw new “Go” trends in Building Materials $XLB and Industrials $XLI relative to the S&P 500 benchmark:
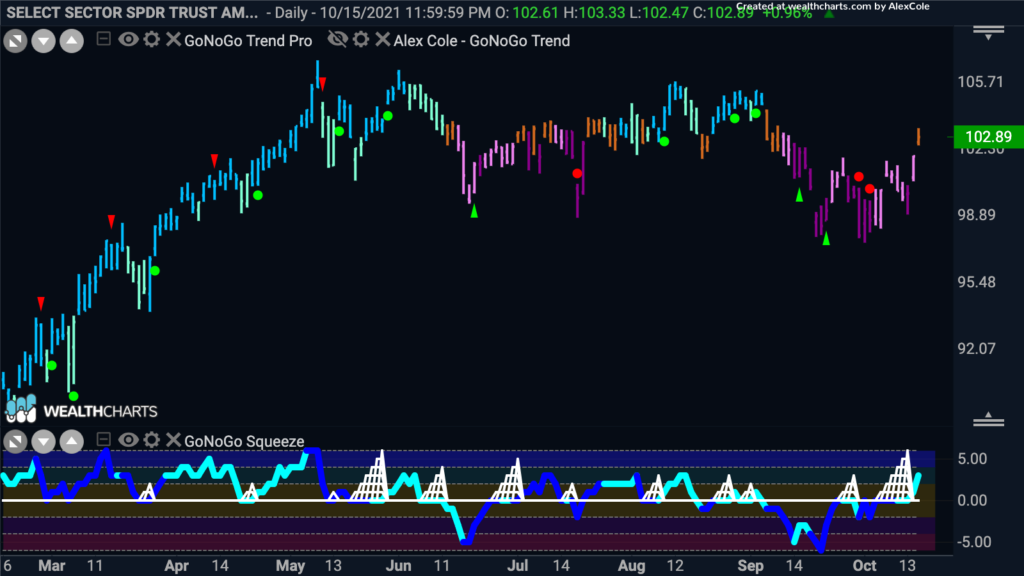
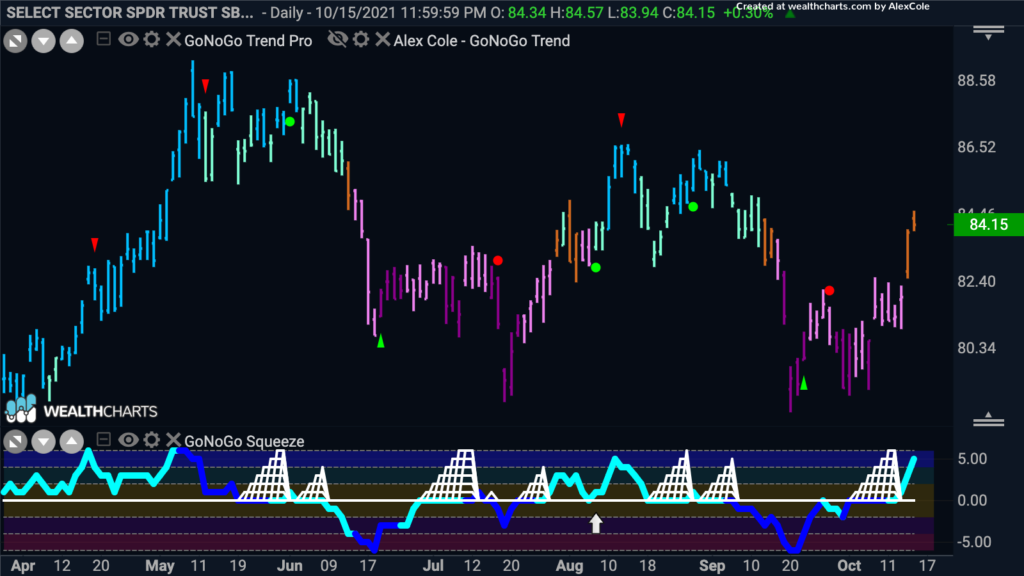
On an absolute basis, Industrials and Builders rallied sharply into the end of the week. The trend conditions are still in neutral, but GoNoGo Oscillator is showing a breakout of a max squeeze into positive territory.
On a weekly basis, $XLI may be setting up for a breakthrough of GoNoGo Oscillator above the zero line on heavy volume:
Taking a look at Copper, we can see the powerful rally last week:
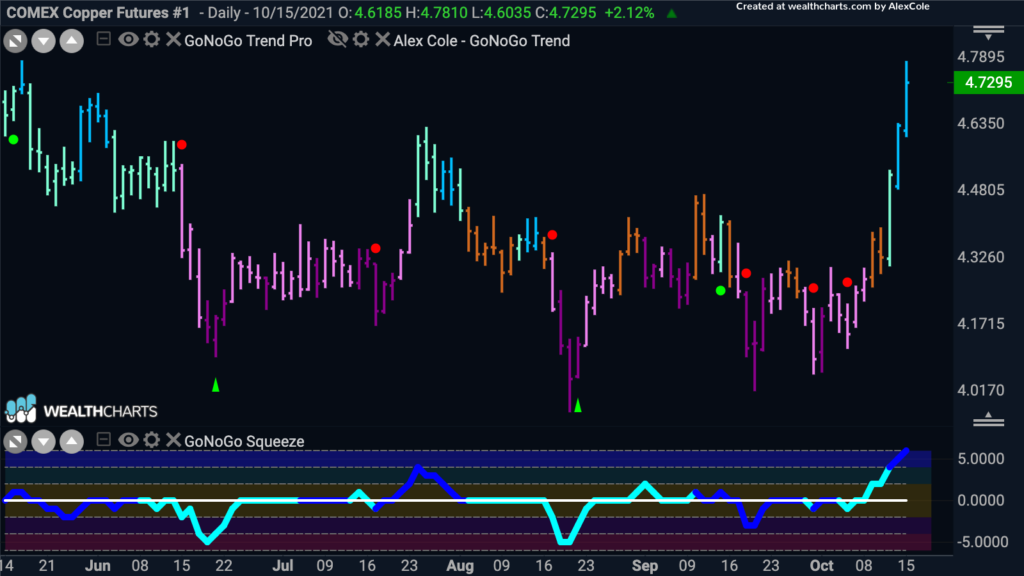
Continuous contract futures ($HG1!) broke out above long-term resistance and sustained a Go trend through much of last week’s trading.
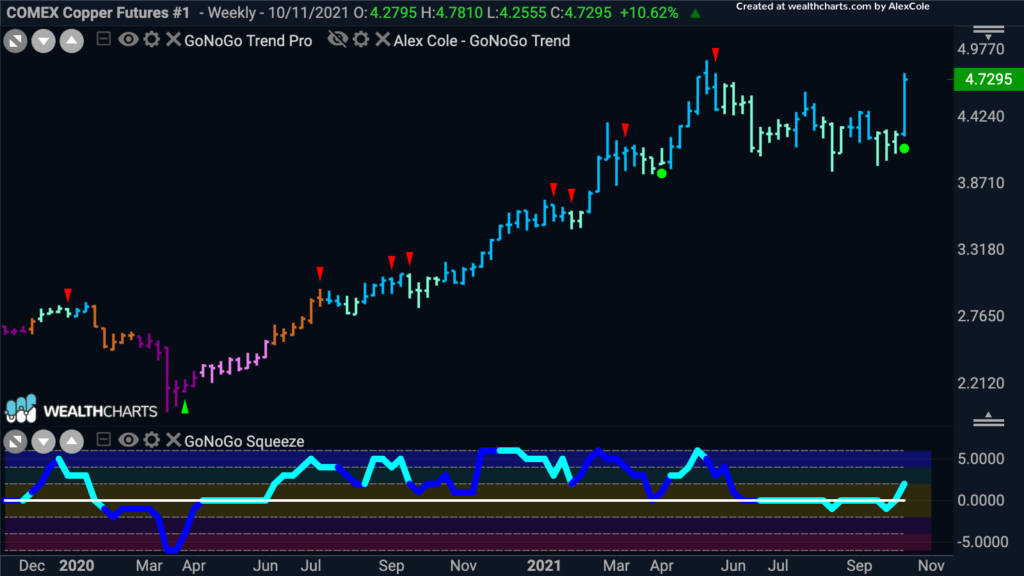
Looking at the weekly data, last week’s rally brought Copper futures right back to former highs. We will be looking at GoNoGo Oscillator for signs of strong enough momentum to get past overhead supply at these levels.
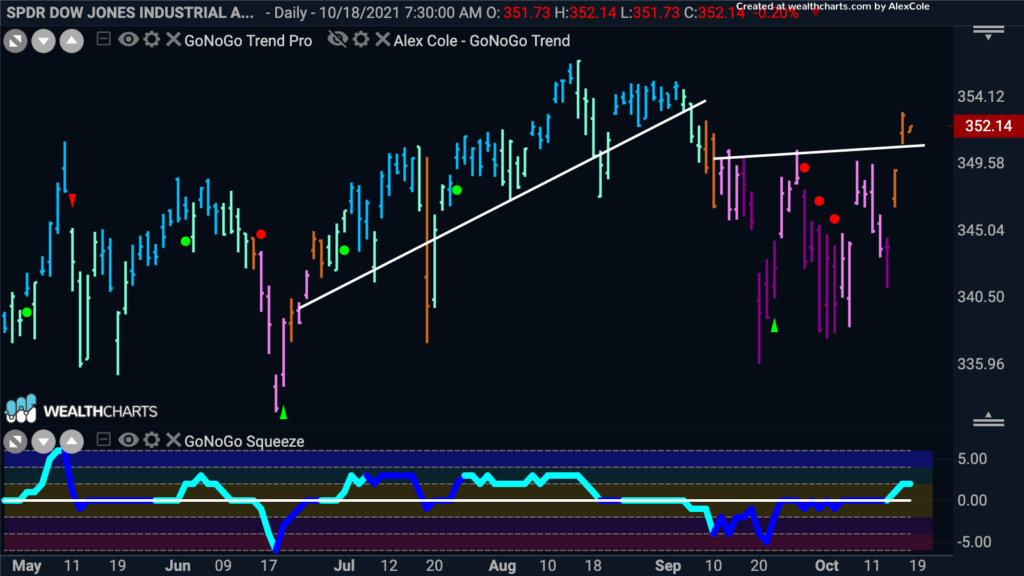
Dow Theory tells us that the transportation average should confirm the trend of the industrial average. As you can see in the GoNoGo Chart below, there was a distinct divergence from June through September. The Industrials rally was NOT confirmed by the transports. However, since mid-September Industrials and Transports have been rallying together. The Transportation average has just entered a Go trend last week, and we see the Industrial Average ETF $DJI gapped up on Friday within a neutral trend. We’ll look to see if this rally is sustained in the week ahead.
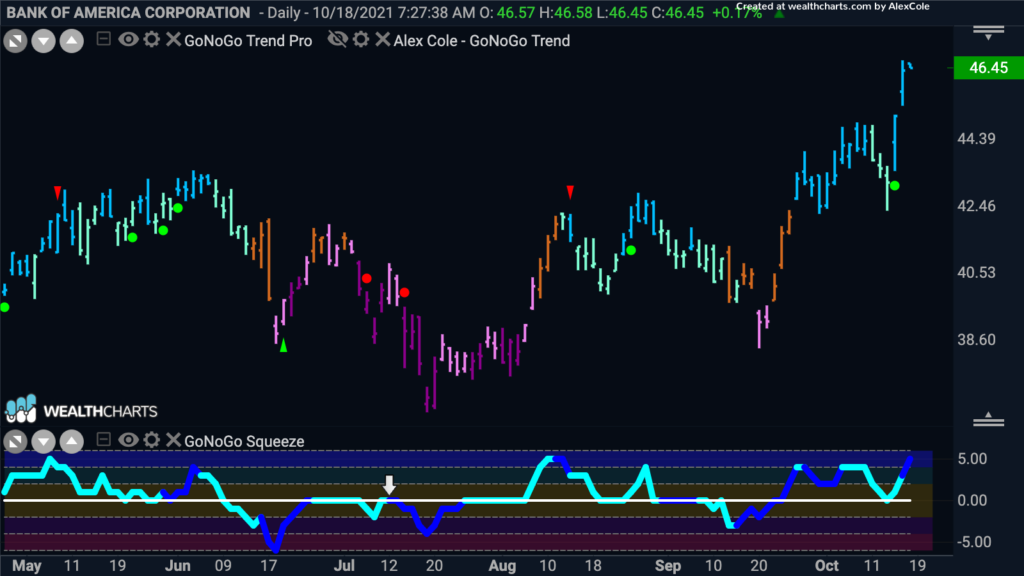
The start of the Q3 earnings-reporting season went well with most companies (predominately banks) exceeding expectations. See the daily GoNoGo Chart below of Bank of America $BAC gapping up on Friday in a surge of positive momentum on heavy volume:
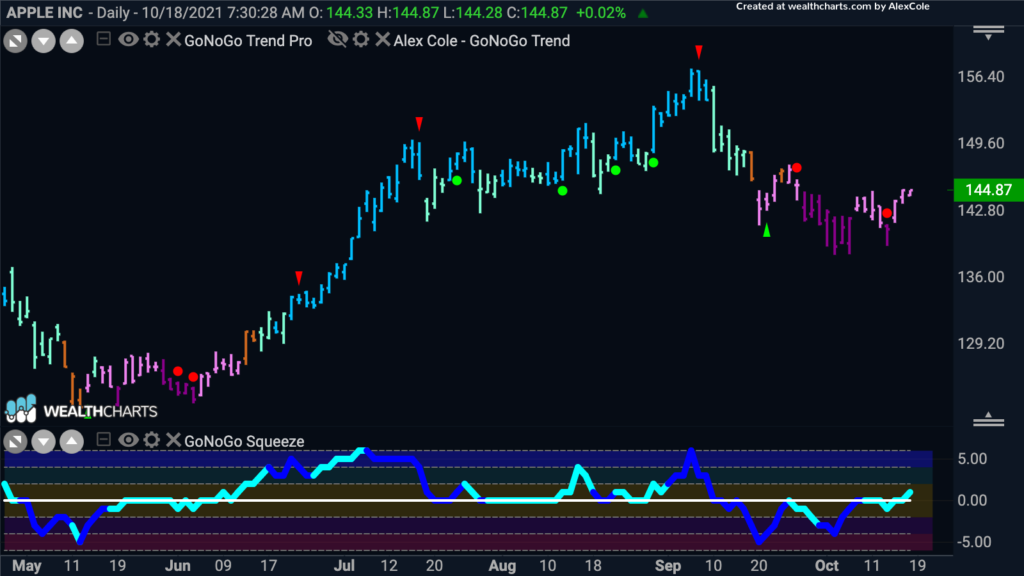
For the fundamentally persuaded folks out there, Apple Inc will be hosting a public product release today. However, amid the reflationary backdrop, valuations are concerning for investors and the daily GoNoGo Chart still indicates a “NoGo” on the daily timeframe:
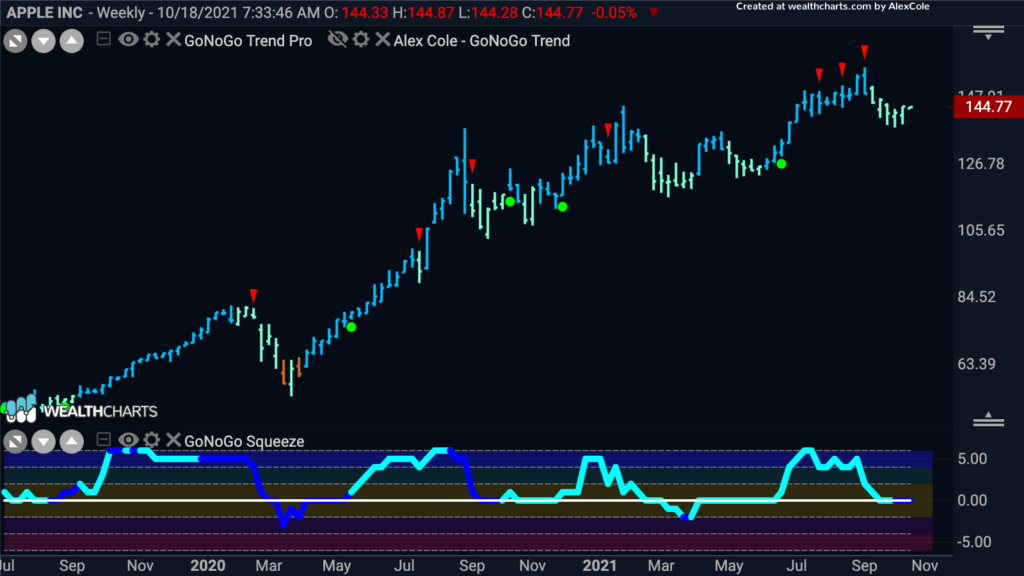
But, on a weekly view, $AAPL has held the “Go” trend:
CryptoCurrency:
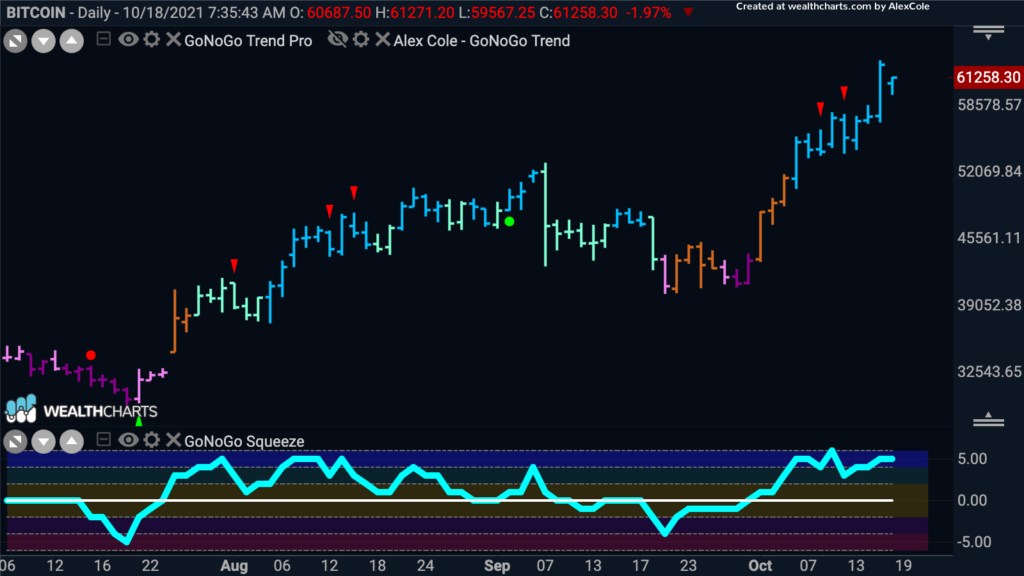
Bitcoin broke above $60,000 in last week’s trading. The original cryptocurrency created in 2009, $BTCUSD reached back to it’s all-time high set roughly 6 months ago. As of Friday, Bitcoin’s price had jumped about 40% since the end of September.


