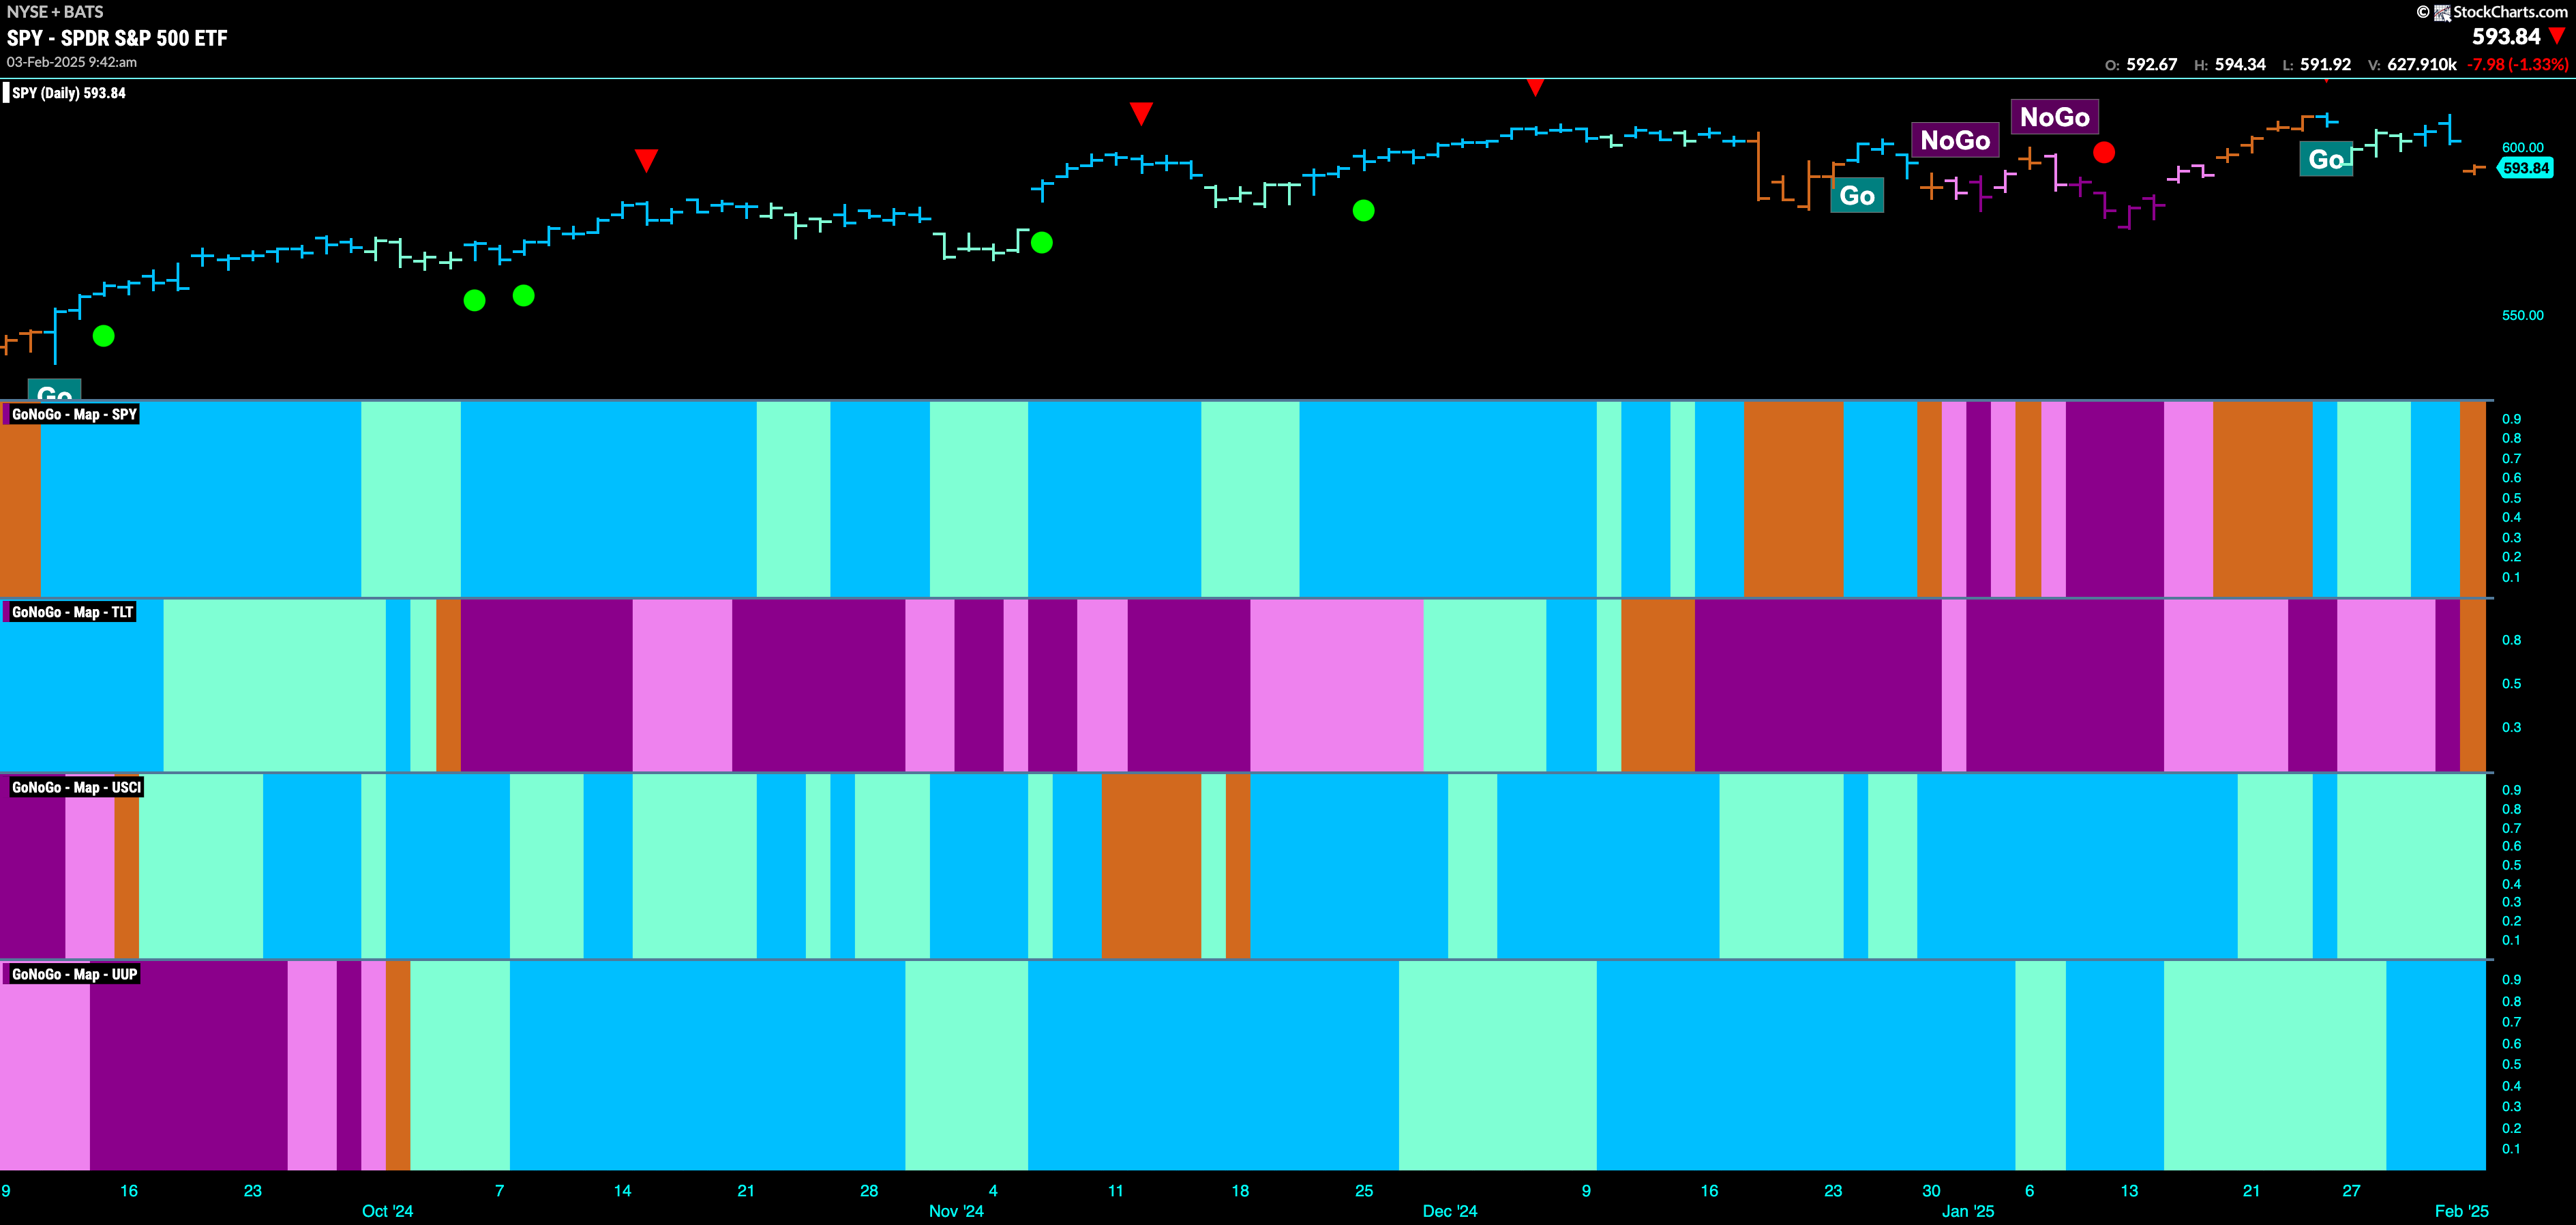
Good morning and welcome to this week’s Flight Path. The equity “Go” was short lived as we see a fresh amber “Go Fish” bar that represents market uncertainty today. The same is true for treasury bond prices that have come out of a “NoGo” trend with an amber “Go Fish” bar. U.S. commodities are still painting “Go” bars but we saw a complete week of weaker aqua bars this past week. The dollar saw strength return with several bright blue “Go” bars.
$SPY Gaps Lower on Uncertainty
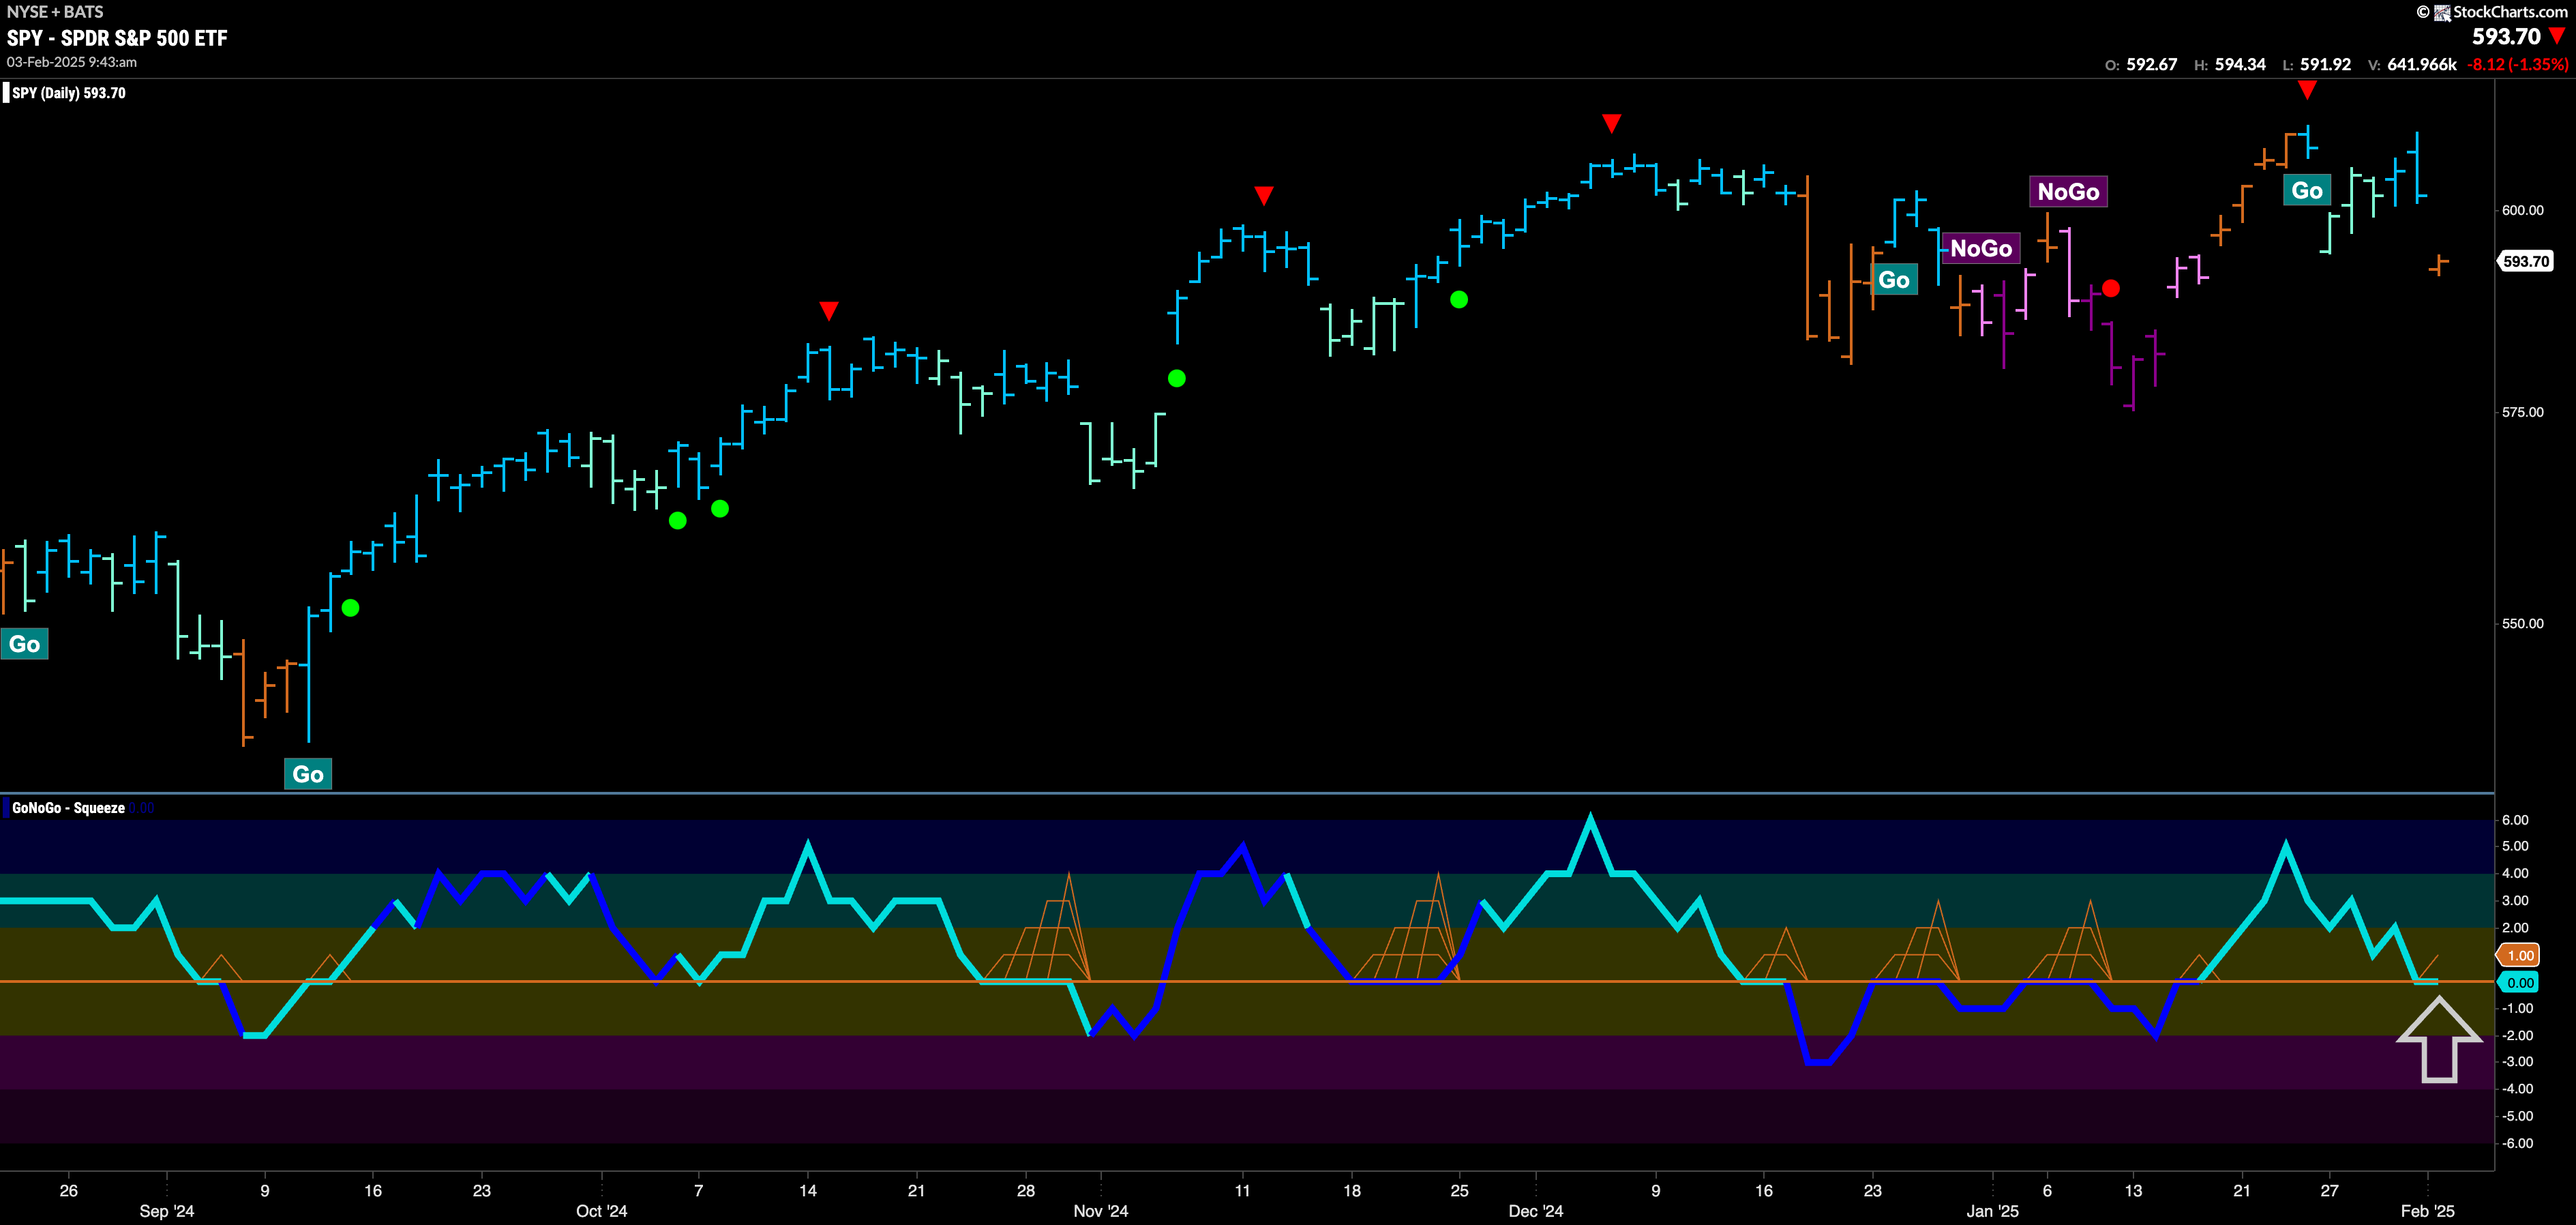
The GoNoGo chart below shows that after just over a week of a new “Go” trend the market suffered a drop and we see an amber “Go Fish” bar. This comes after we saw a Go Countertrend Correction Icon (red arrow) at the last high. GoNoGo Oscillator has fallen to test the zero line from above and we will watch closely to see if it finds support at this level. It will be very telling what happens at this point. If the oscillator finds support and can bounce back into positive territory that would be a good sign for those looking for the “Go” trend to return.
On the longer term chart, GoNoGo Trend is still painting strong blue “Go” bars after price set a barely higher high. We turn our attention to the zero line and we see that the oscillator is retesting that level quickly. It will be very important on the longer time frame that the oscillator finds support here as well. We will look for the oscillator to recapture positive territory and that would give price the help it needs to remain in a “Go” trend and perhaps search for new highs. 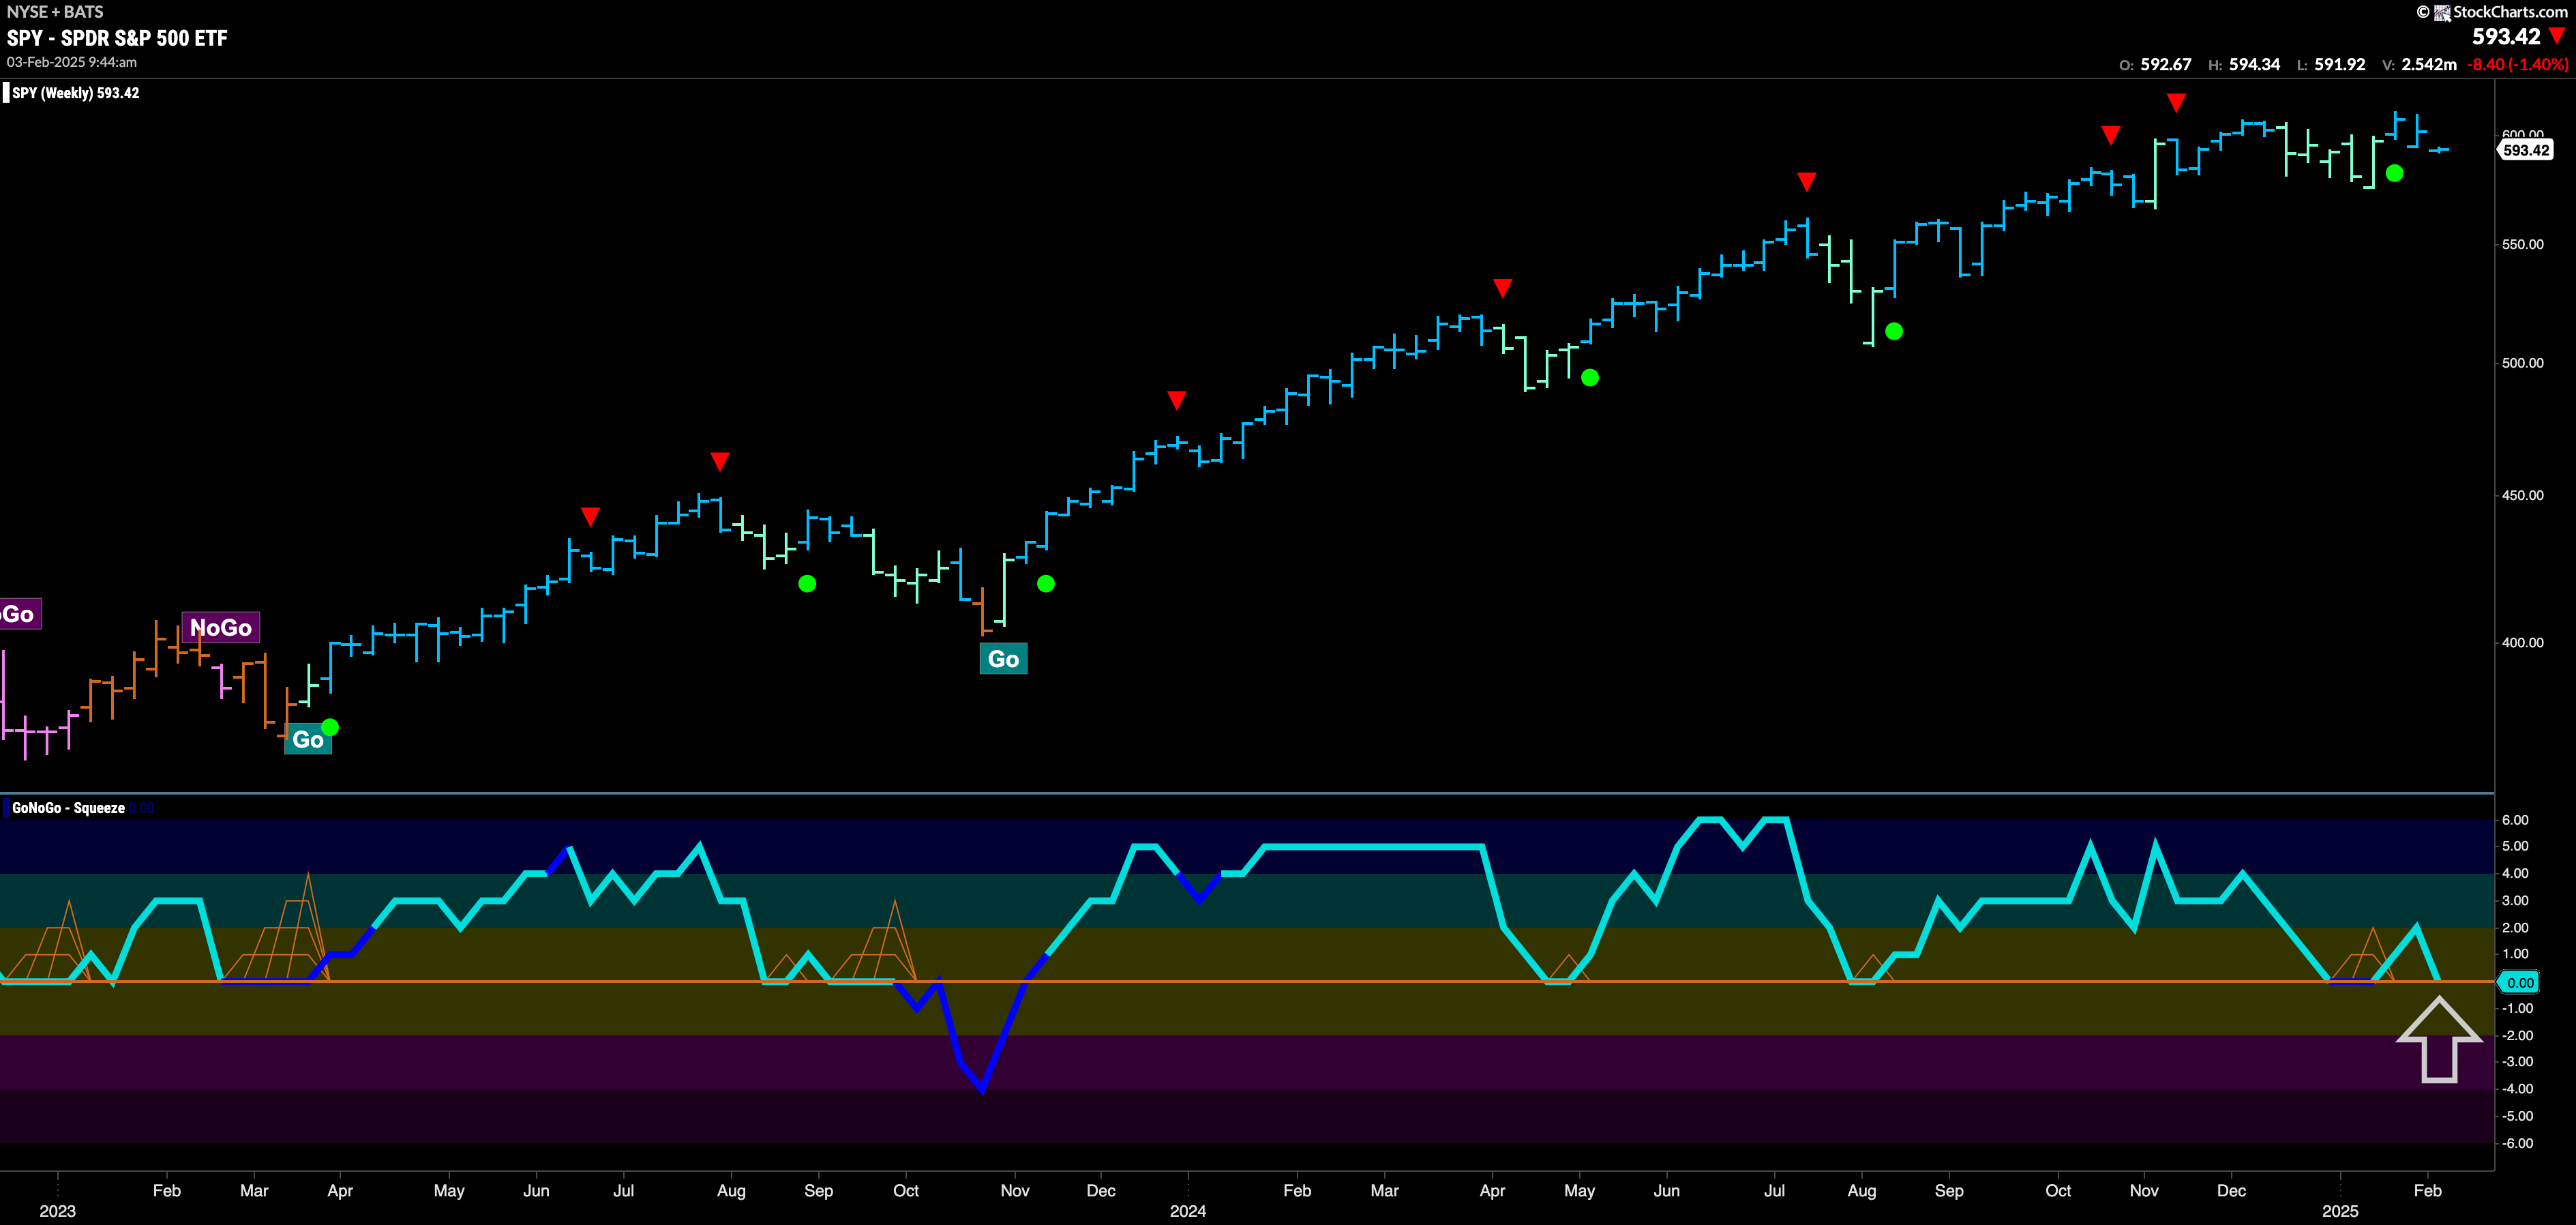
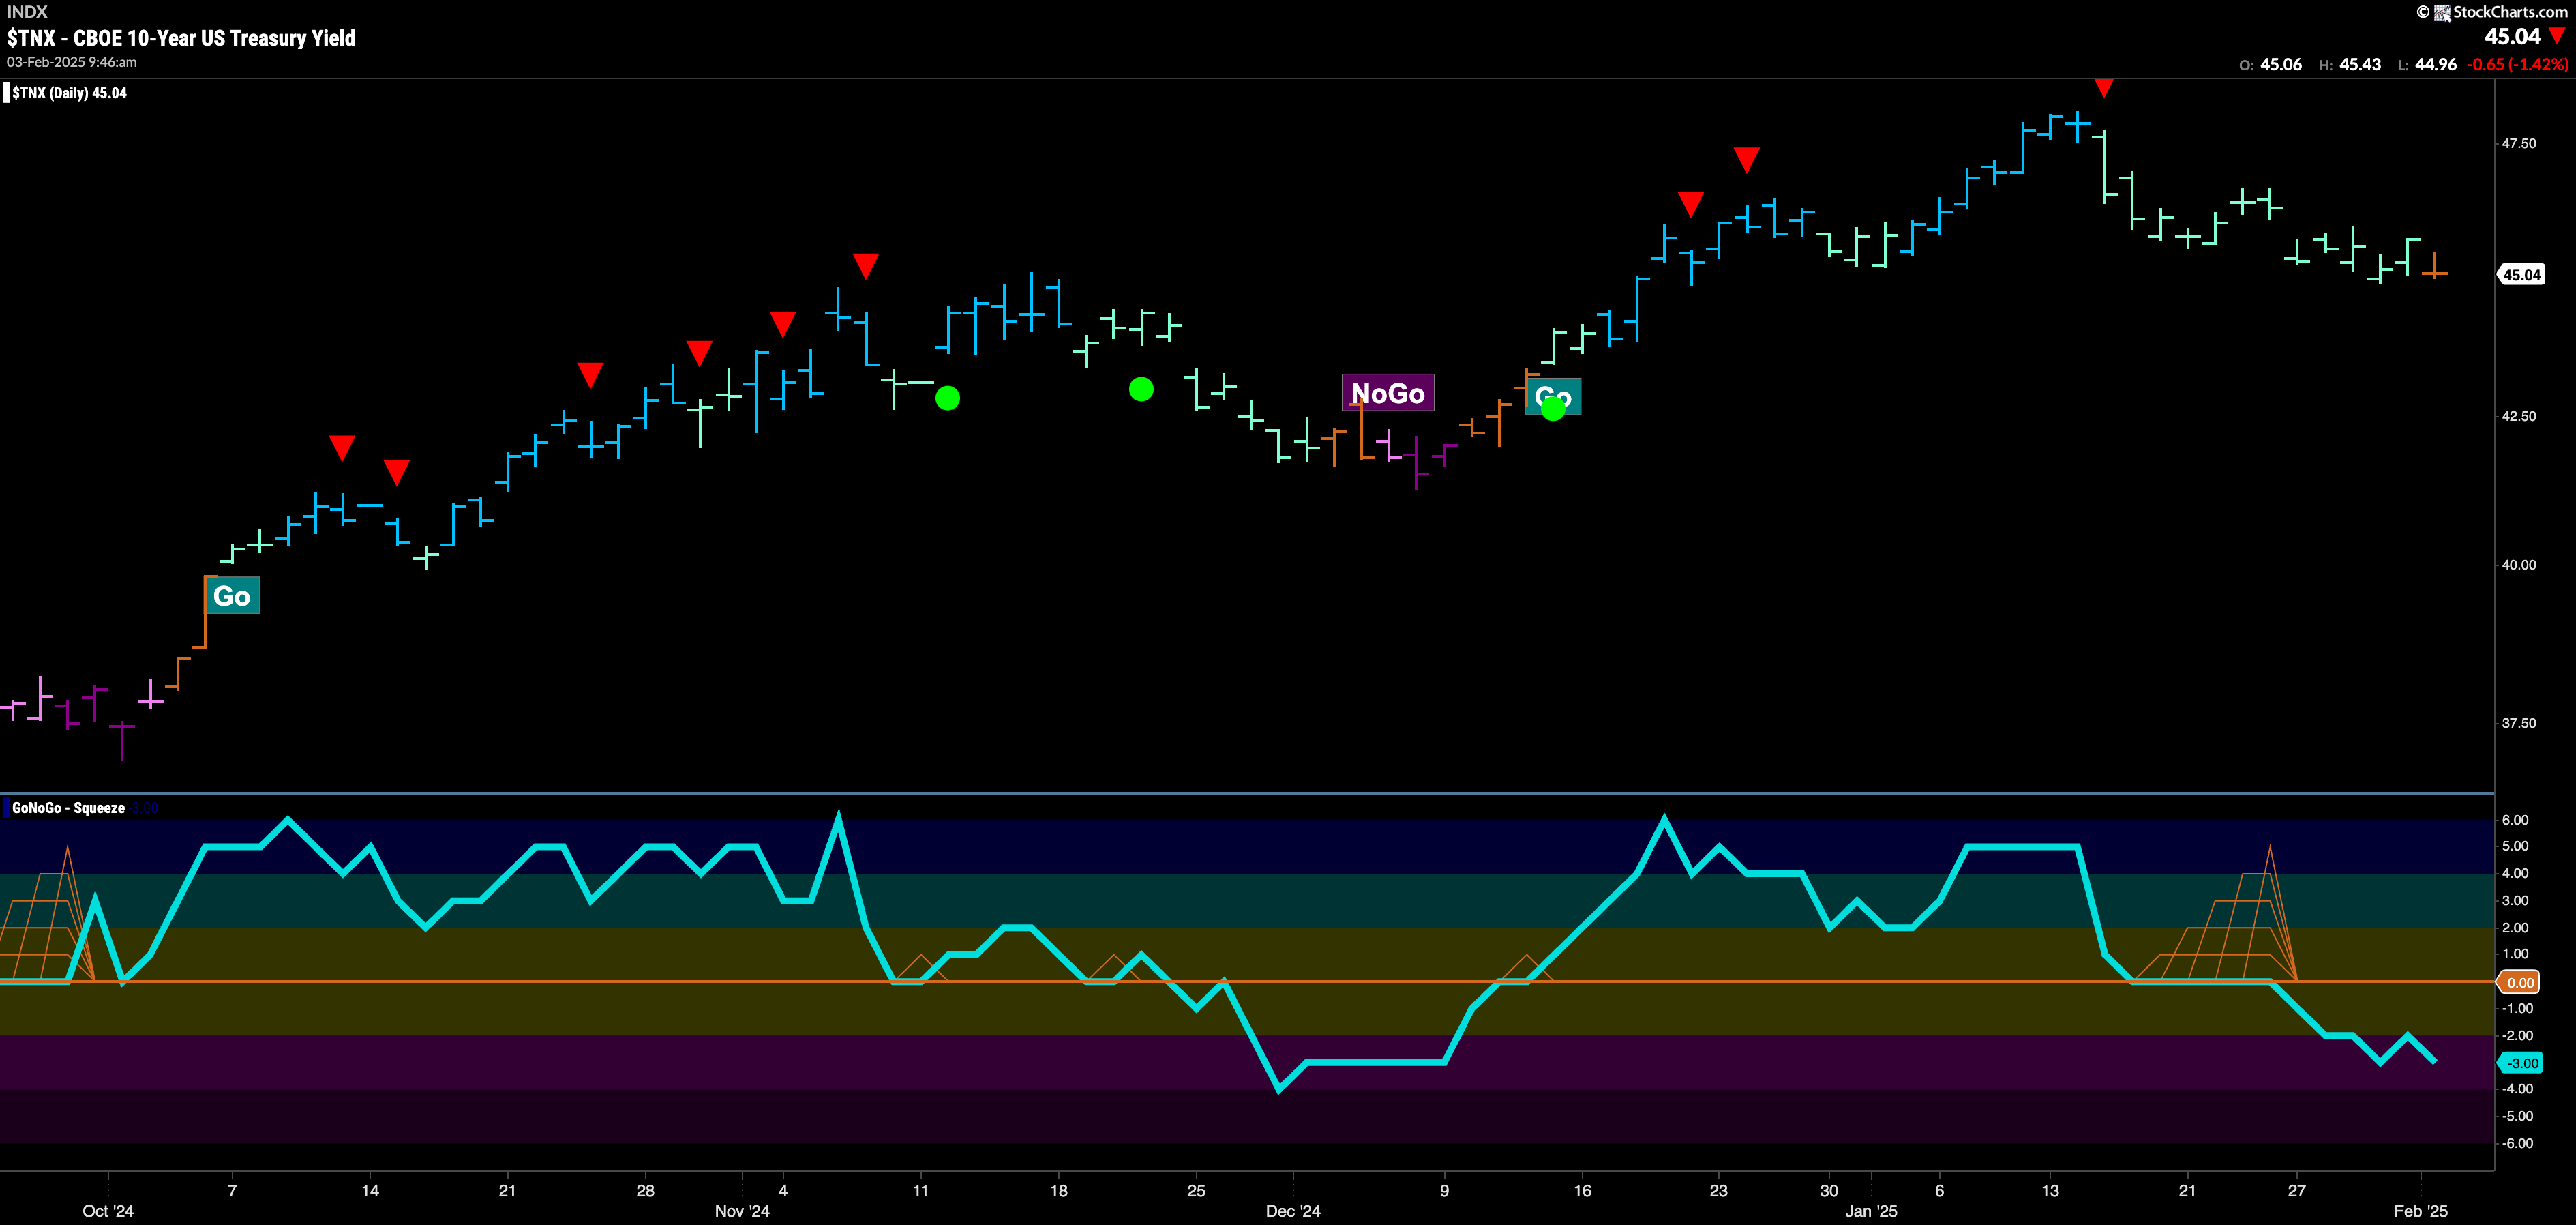
Treasury Rates Flash Uncertainty Early Monday Morning
GoNoGo Trend shows that the “Go” trend has finally given way as of this note to an amber “Go Fish” bar. This comes after GoNoGo Oscillator broke out of a GoNoGo Squeeze a few bars prior. This break down in momentum showed us that market enthusiasm was out of step with the “Go” trend and gave us an early warning that something like this could happen. We will watch to see in which direction the trend proceeds. With momentum at a value of -3 there is more downside pressure on price.
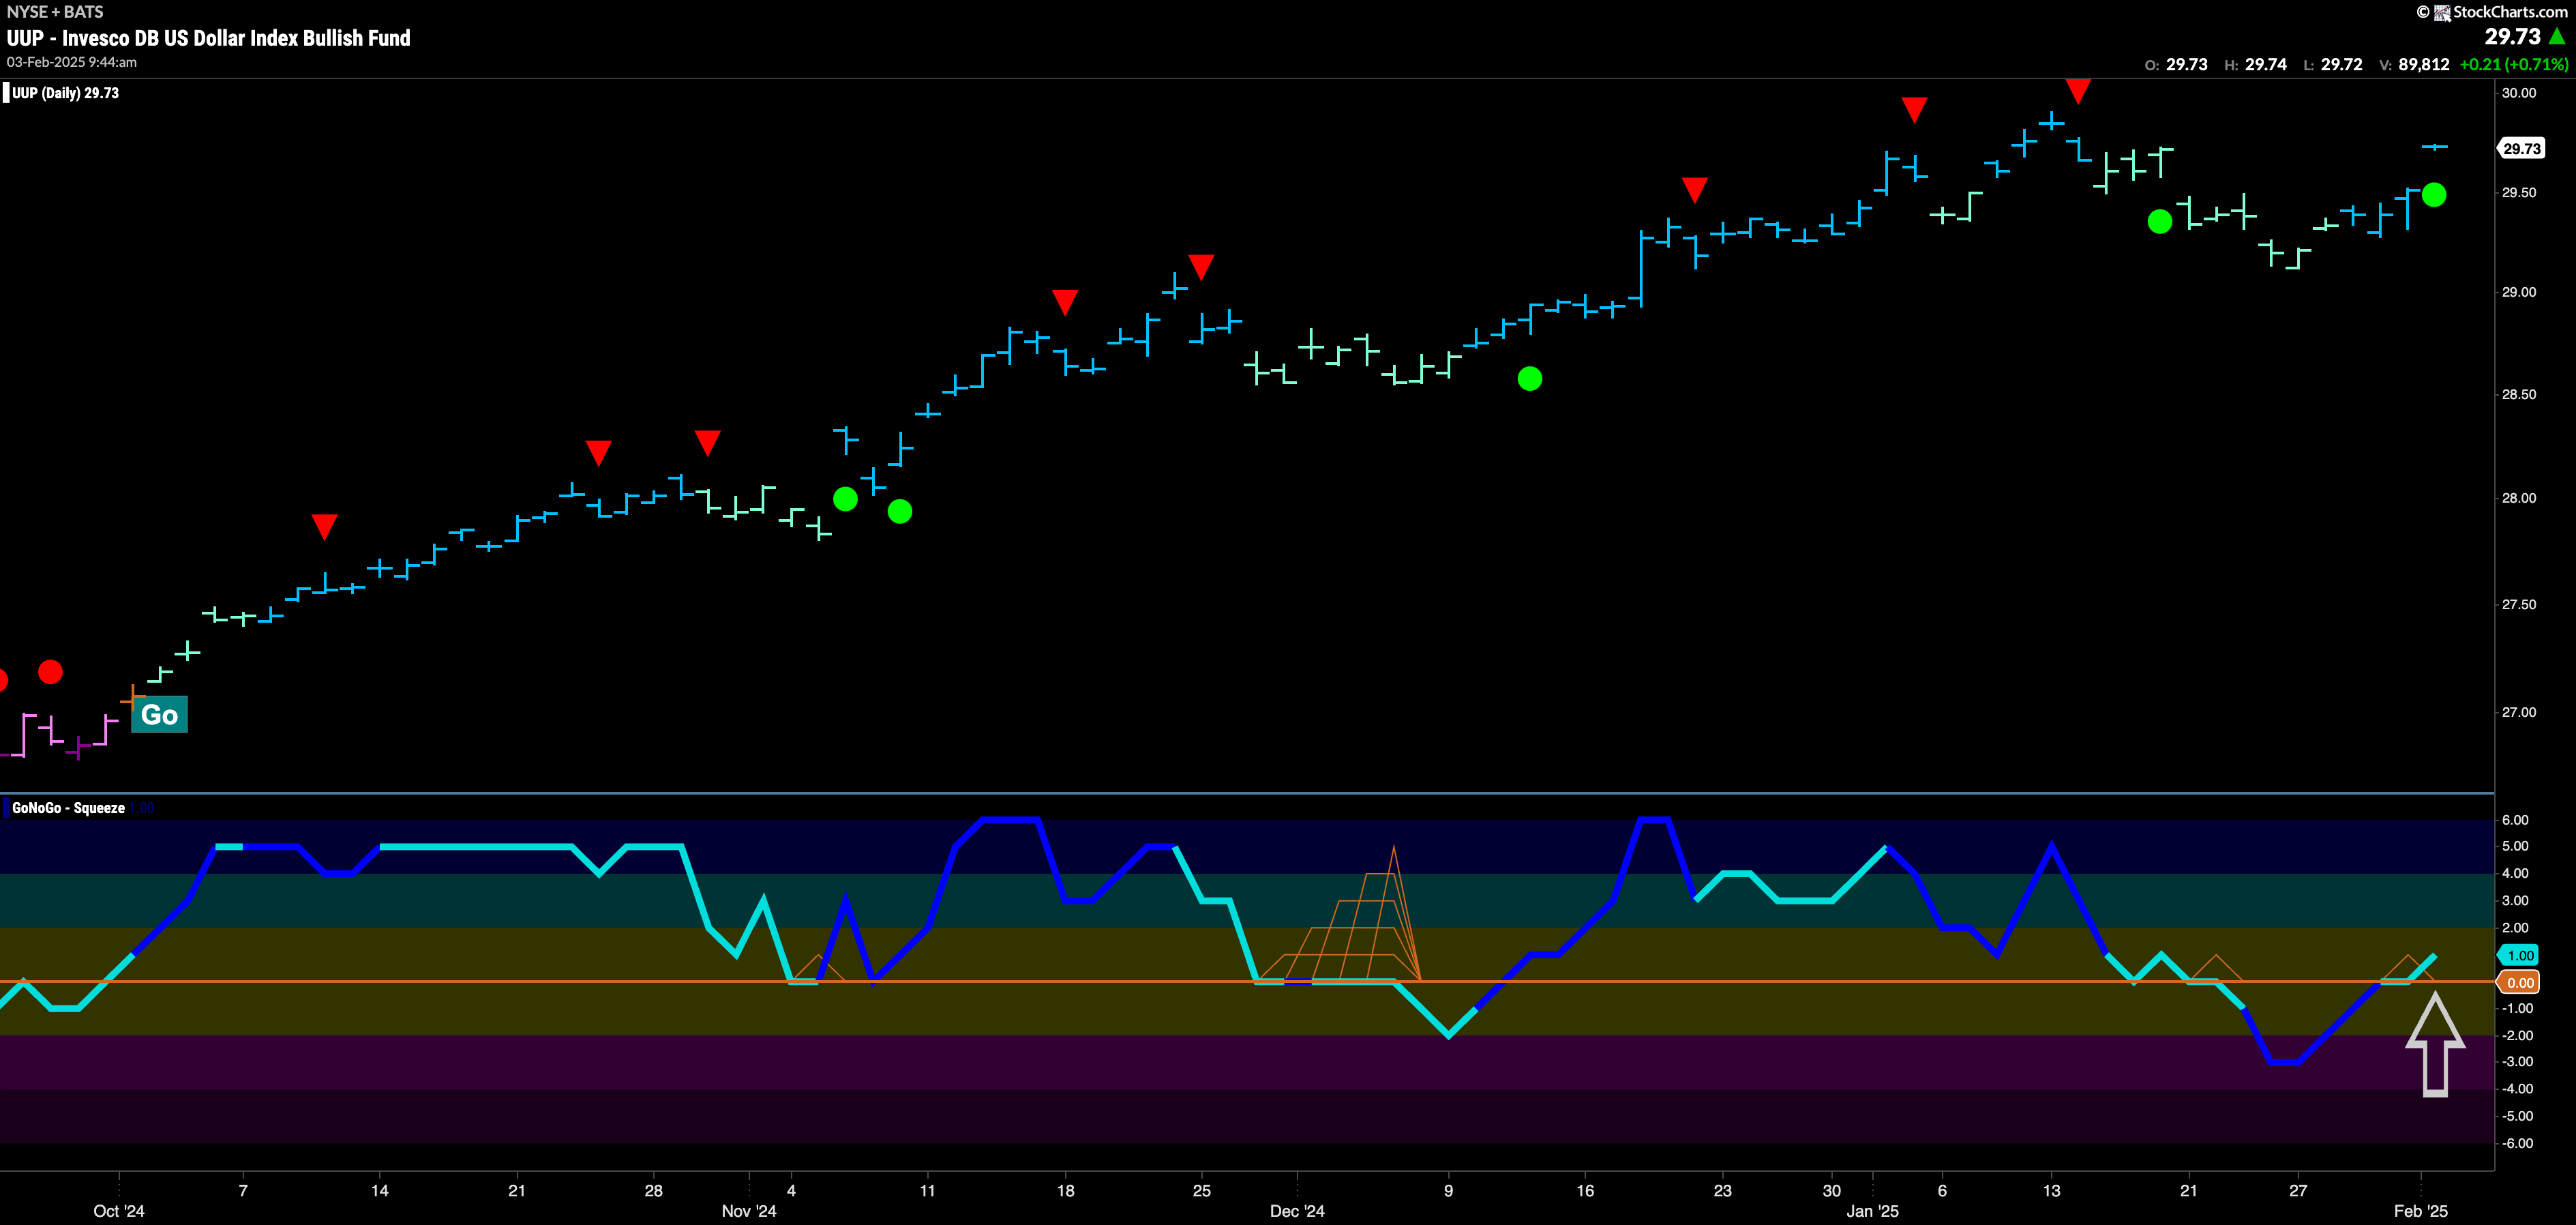
The Dollar Finds Strength in “Go” Trend
GoNoGo Trend showed that the “Go” trend found its feet last week as it was able to paint several strong blue “Go” bars after two weeks of paler aqua. We also now see that GoNoGo Oscillator has recovered from its foray into negative territory and is peeking above the zero line. This tells us that momentum is back on the side of the “Go” trend and is confirming price movement. We will look for this resurgence in the direction of the trend to perhaps give price the push it needs to attack prior highs.
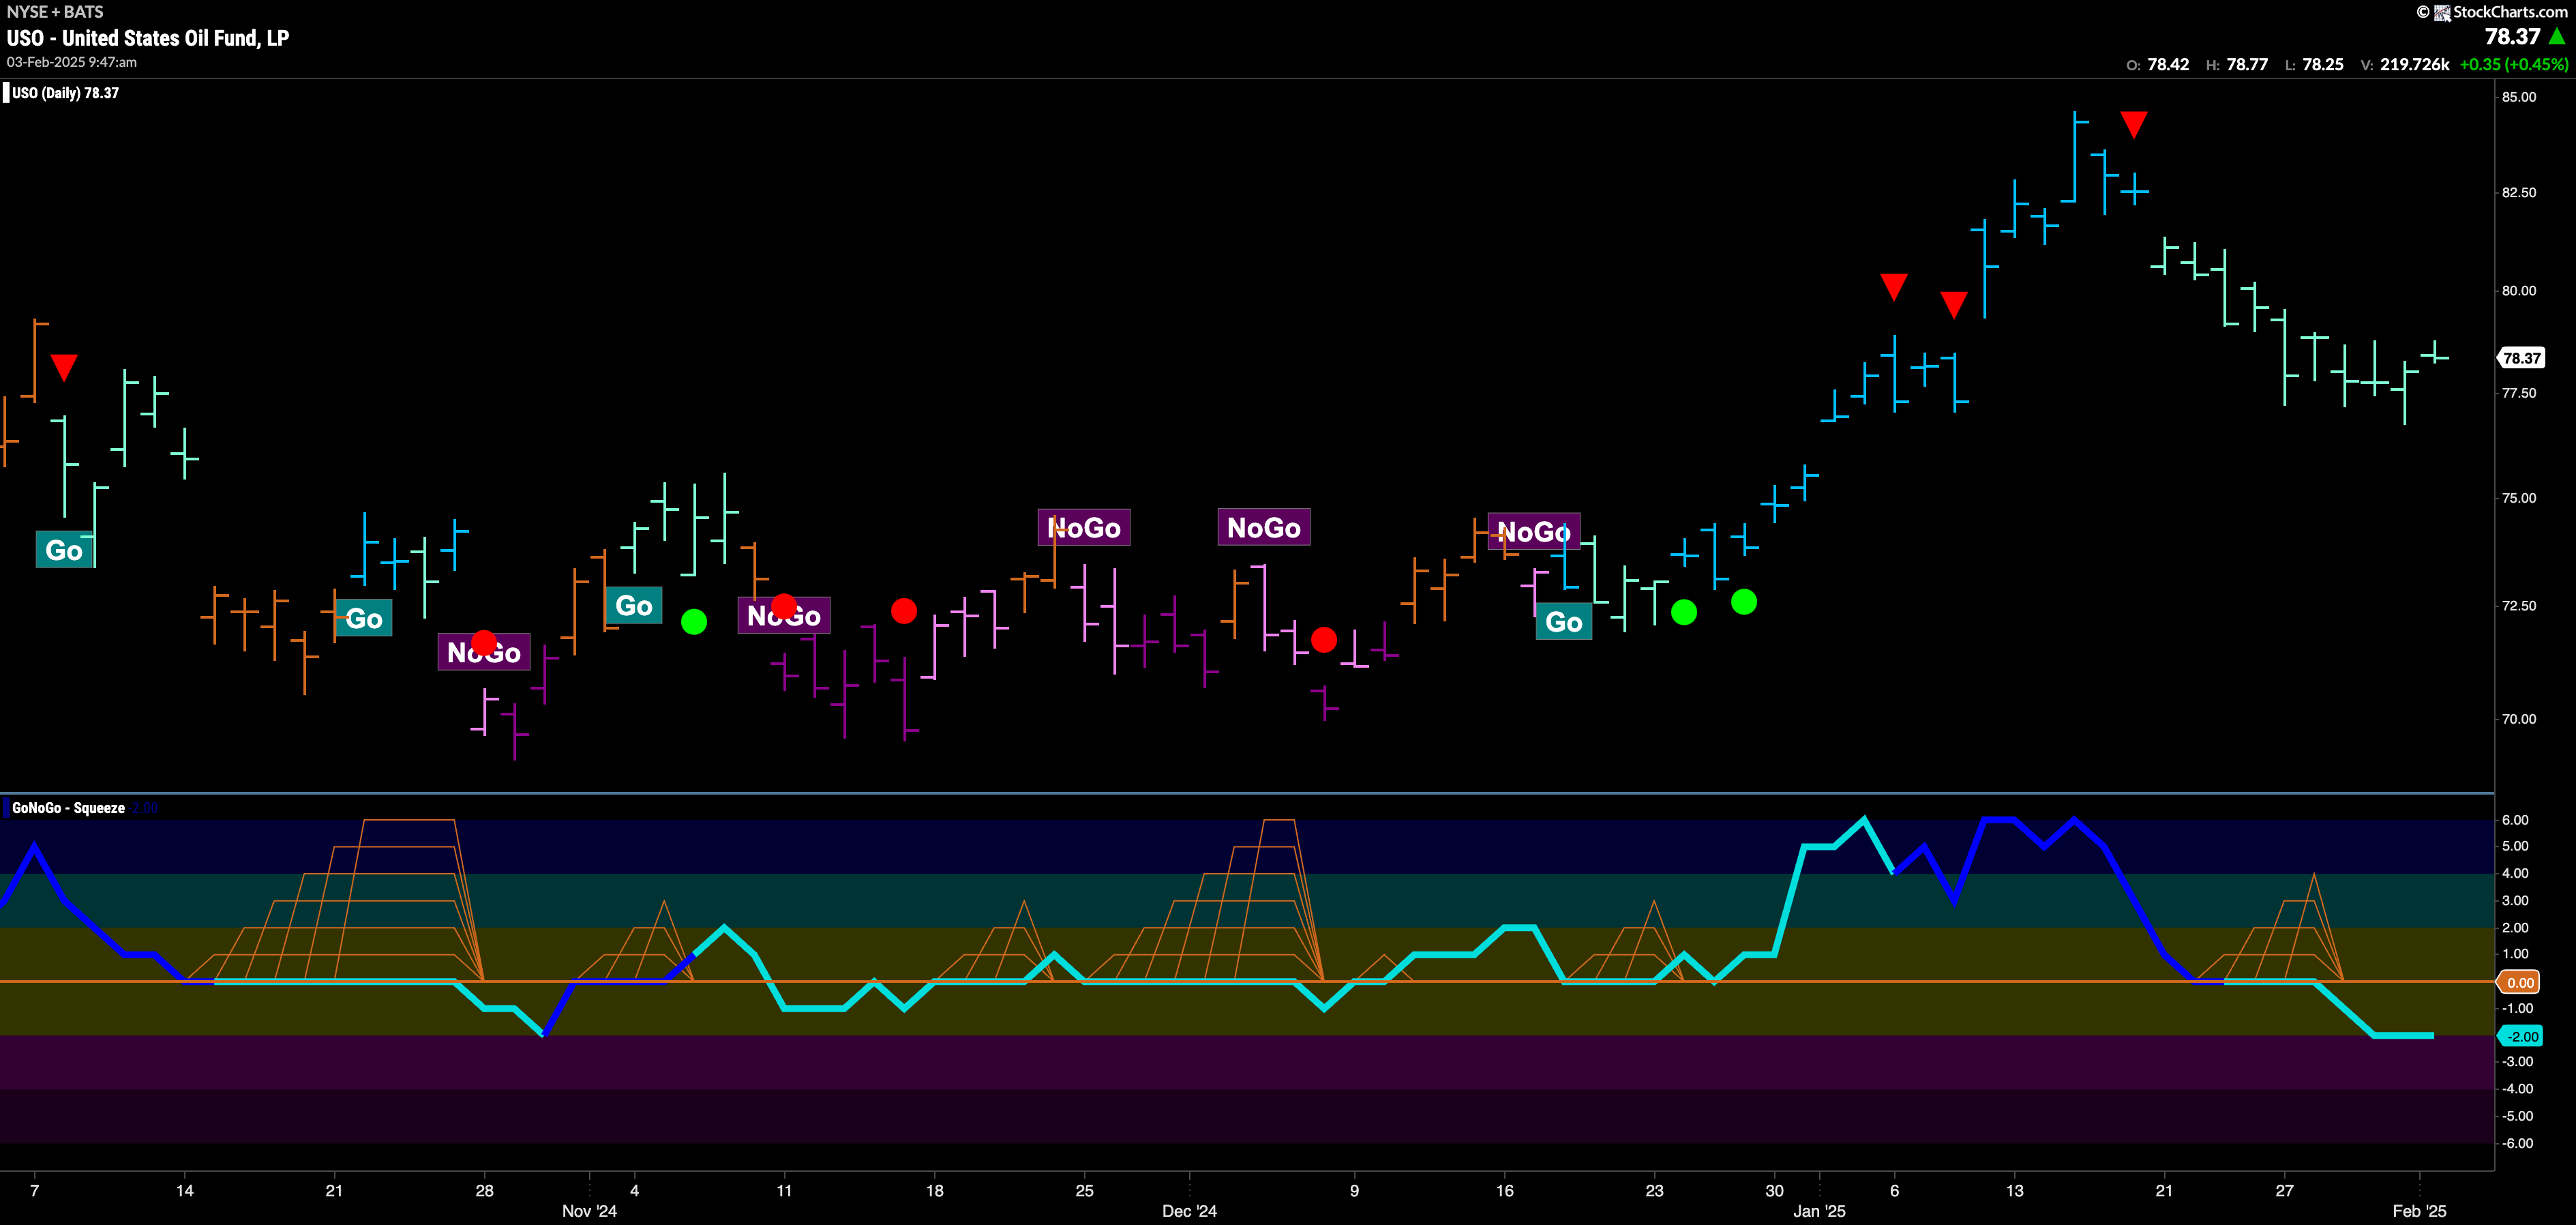
$USO Sees Indicator Paint Continued Weakness
$USO continues to see GoNoGo Trend paint weaker aqua “Go” bars. After hitting a high a few weeks ago we saw a Go Countertrend Correction Icon (red arrow) indicating that price would struggle to move higher in the short term. Indeed, we have seen a string of paler aqua bars as price has fallen. GoNoGo Oscillator fell into negative territory several bars ago and so momentum does not support the “Go” trend. We will look to see if it recovers to the zero line or if we see a change in trend in the price panel above.
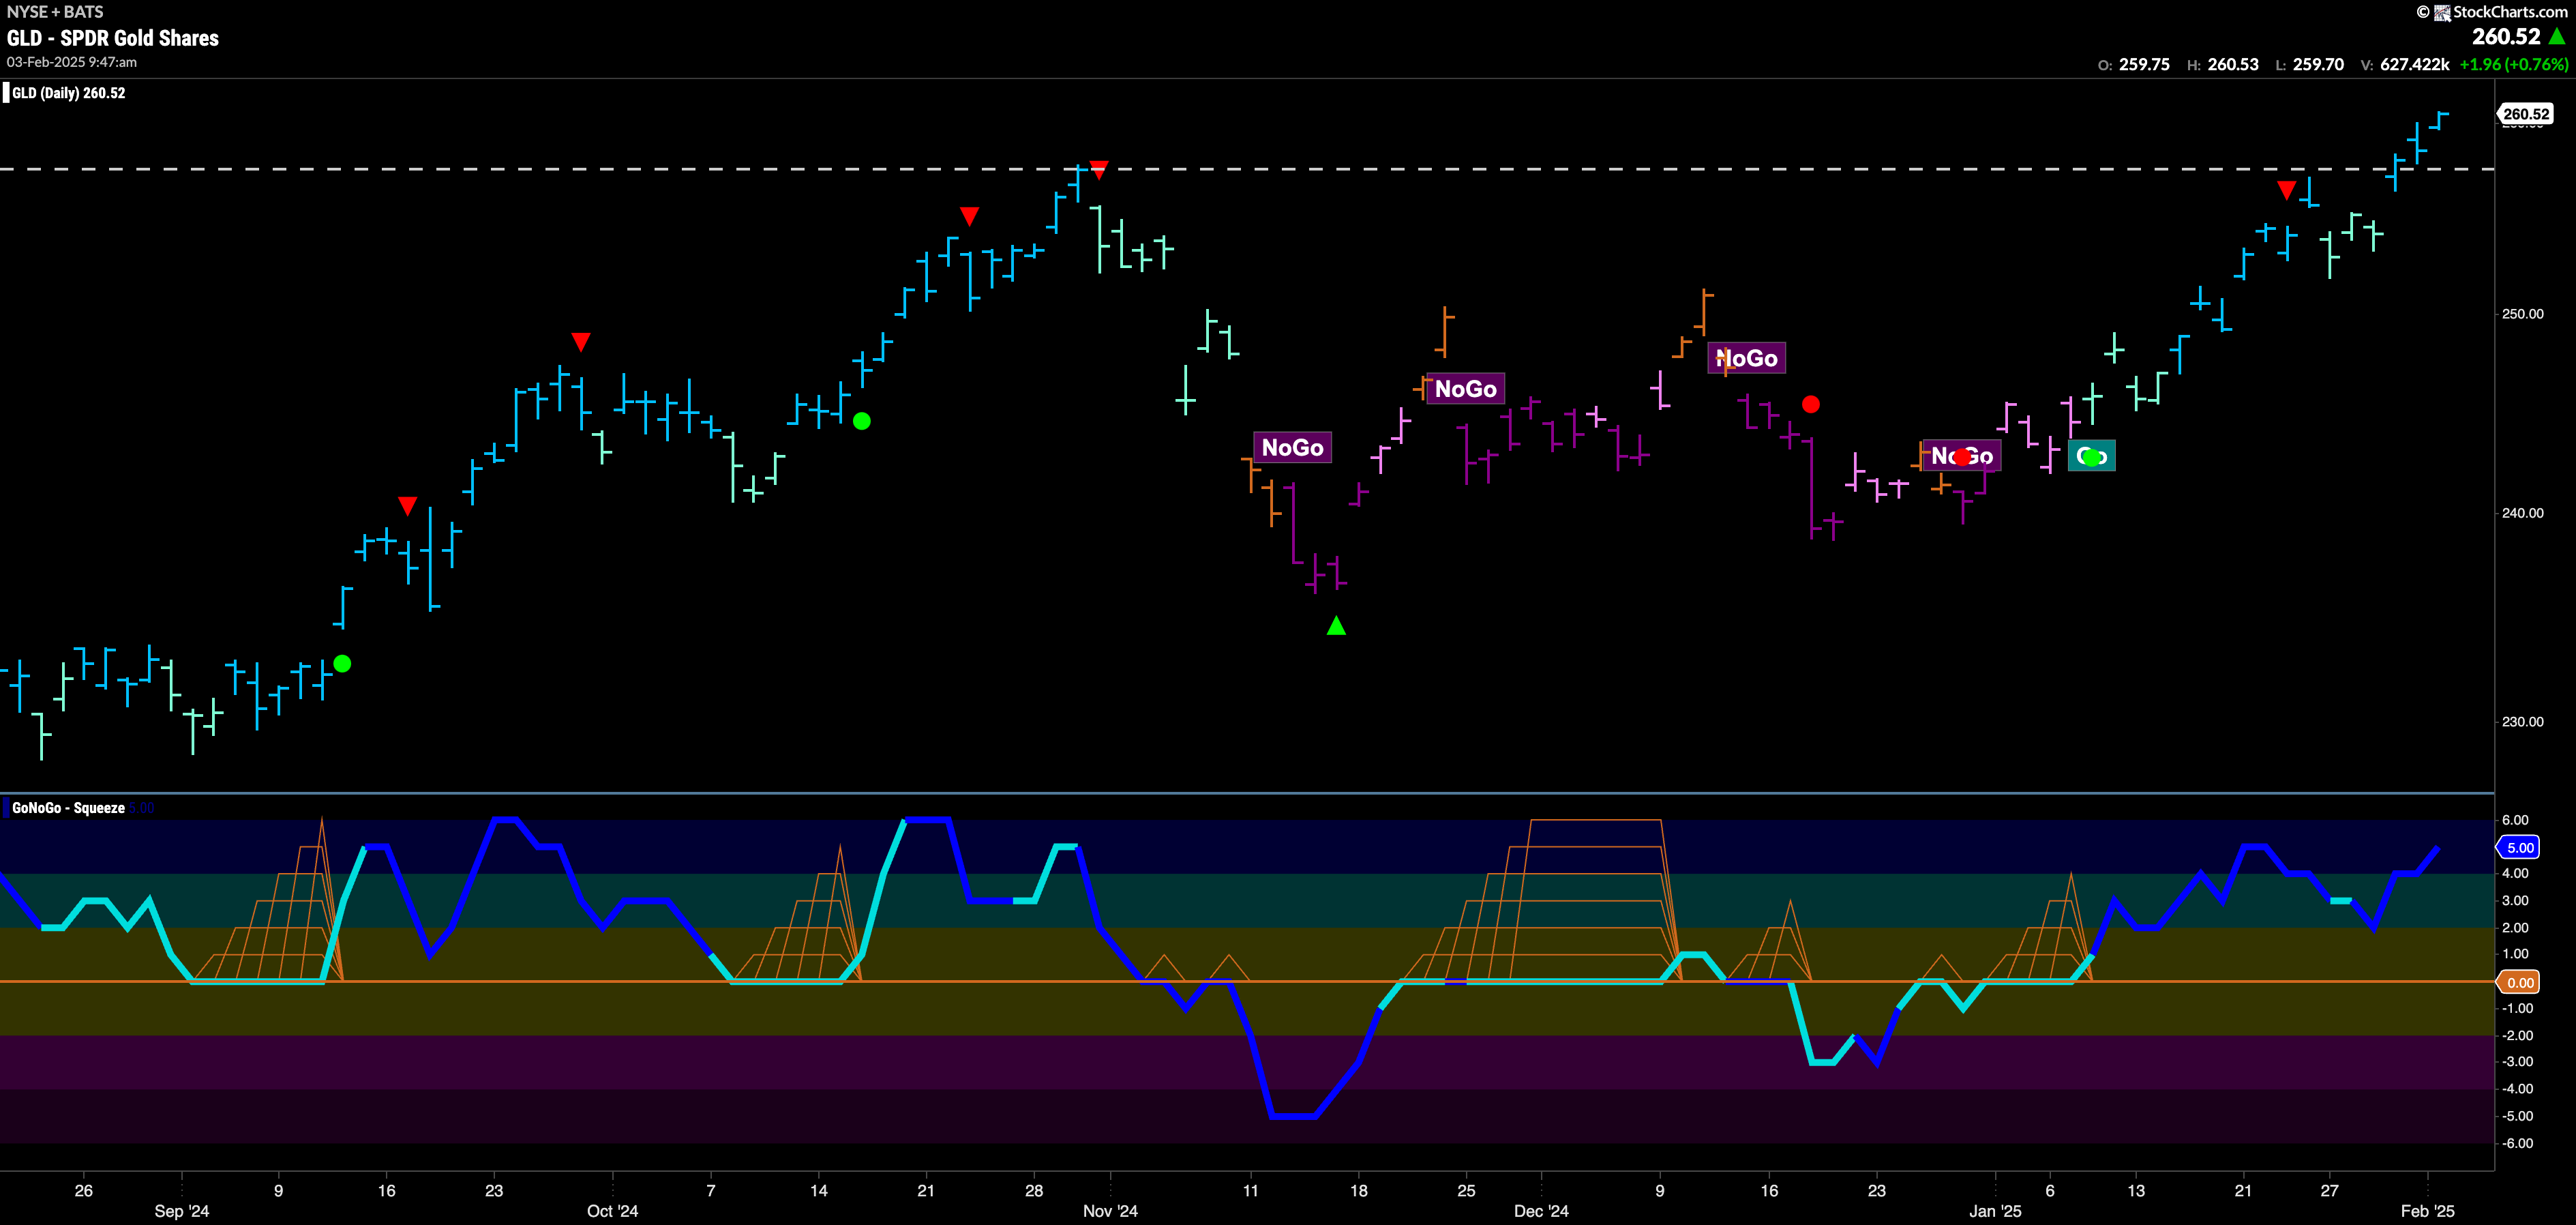
$GLD Sets New Higher High after Breaking above Resistance
After failing once to overcome resistance from prior highs, we saw the “Go” trend break above that resistance on strong blue bars. This tells us that the “Go” trend is healthy as we set a new higher high. GoNoGo Oscillator is surging toward overbought territory and volume is heavy. We will watch to see if this enthusiasm will help price consolidate at these new higher levels and if prior resistance will act as possible support going forward.
Sector RelMap
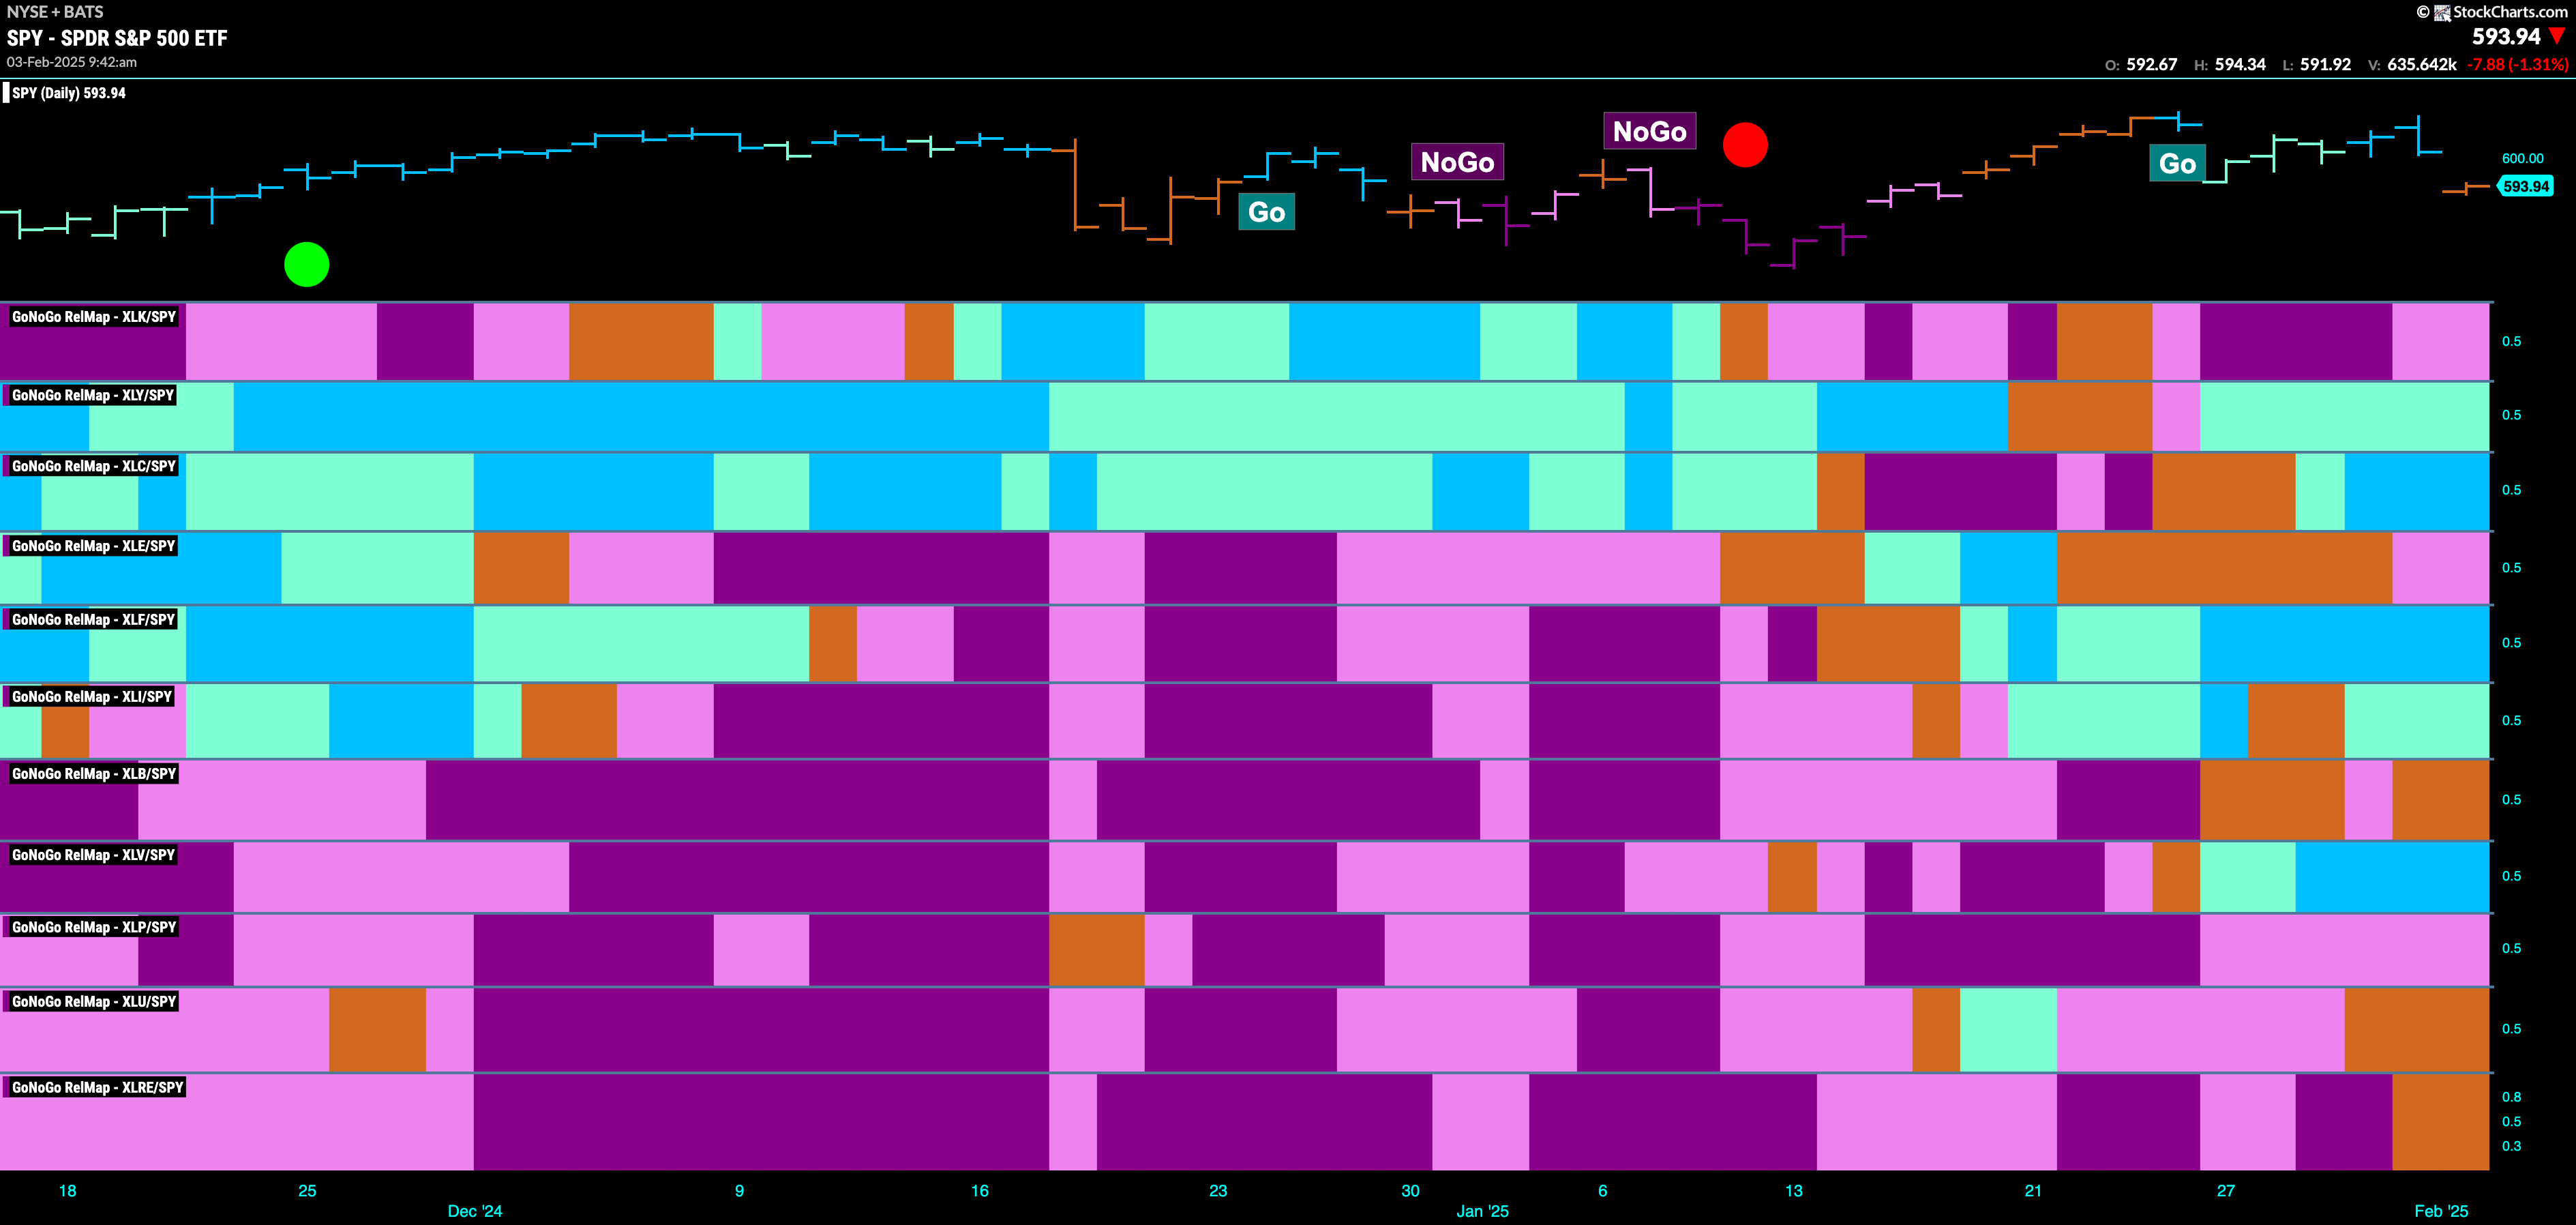
Below is the GoNoGo Sector RelMap. This GoNoGo RelMap applies the GoNoGo Trend to the relative strength ratios of the sectors to the base index. With this view we can get a sense of the relative out performance and relative underperformance of the sectors. 5 sectors are in relative “Go” trends. $XLY, $XLC, $XLF, $XLI, and $XLV are painting relative “Go” bars.
Healthcare Sub-Group RelMap
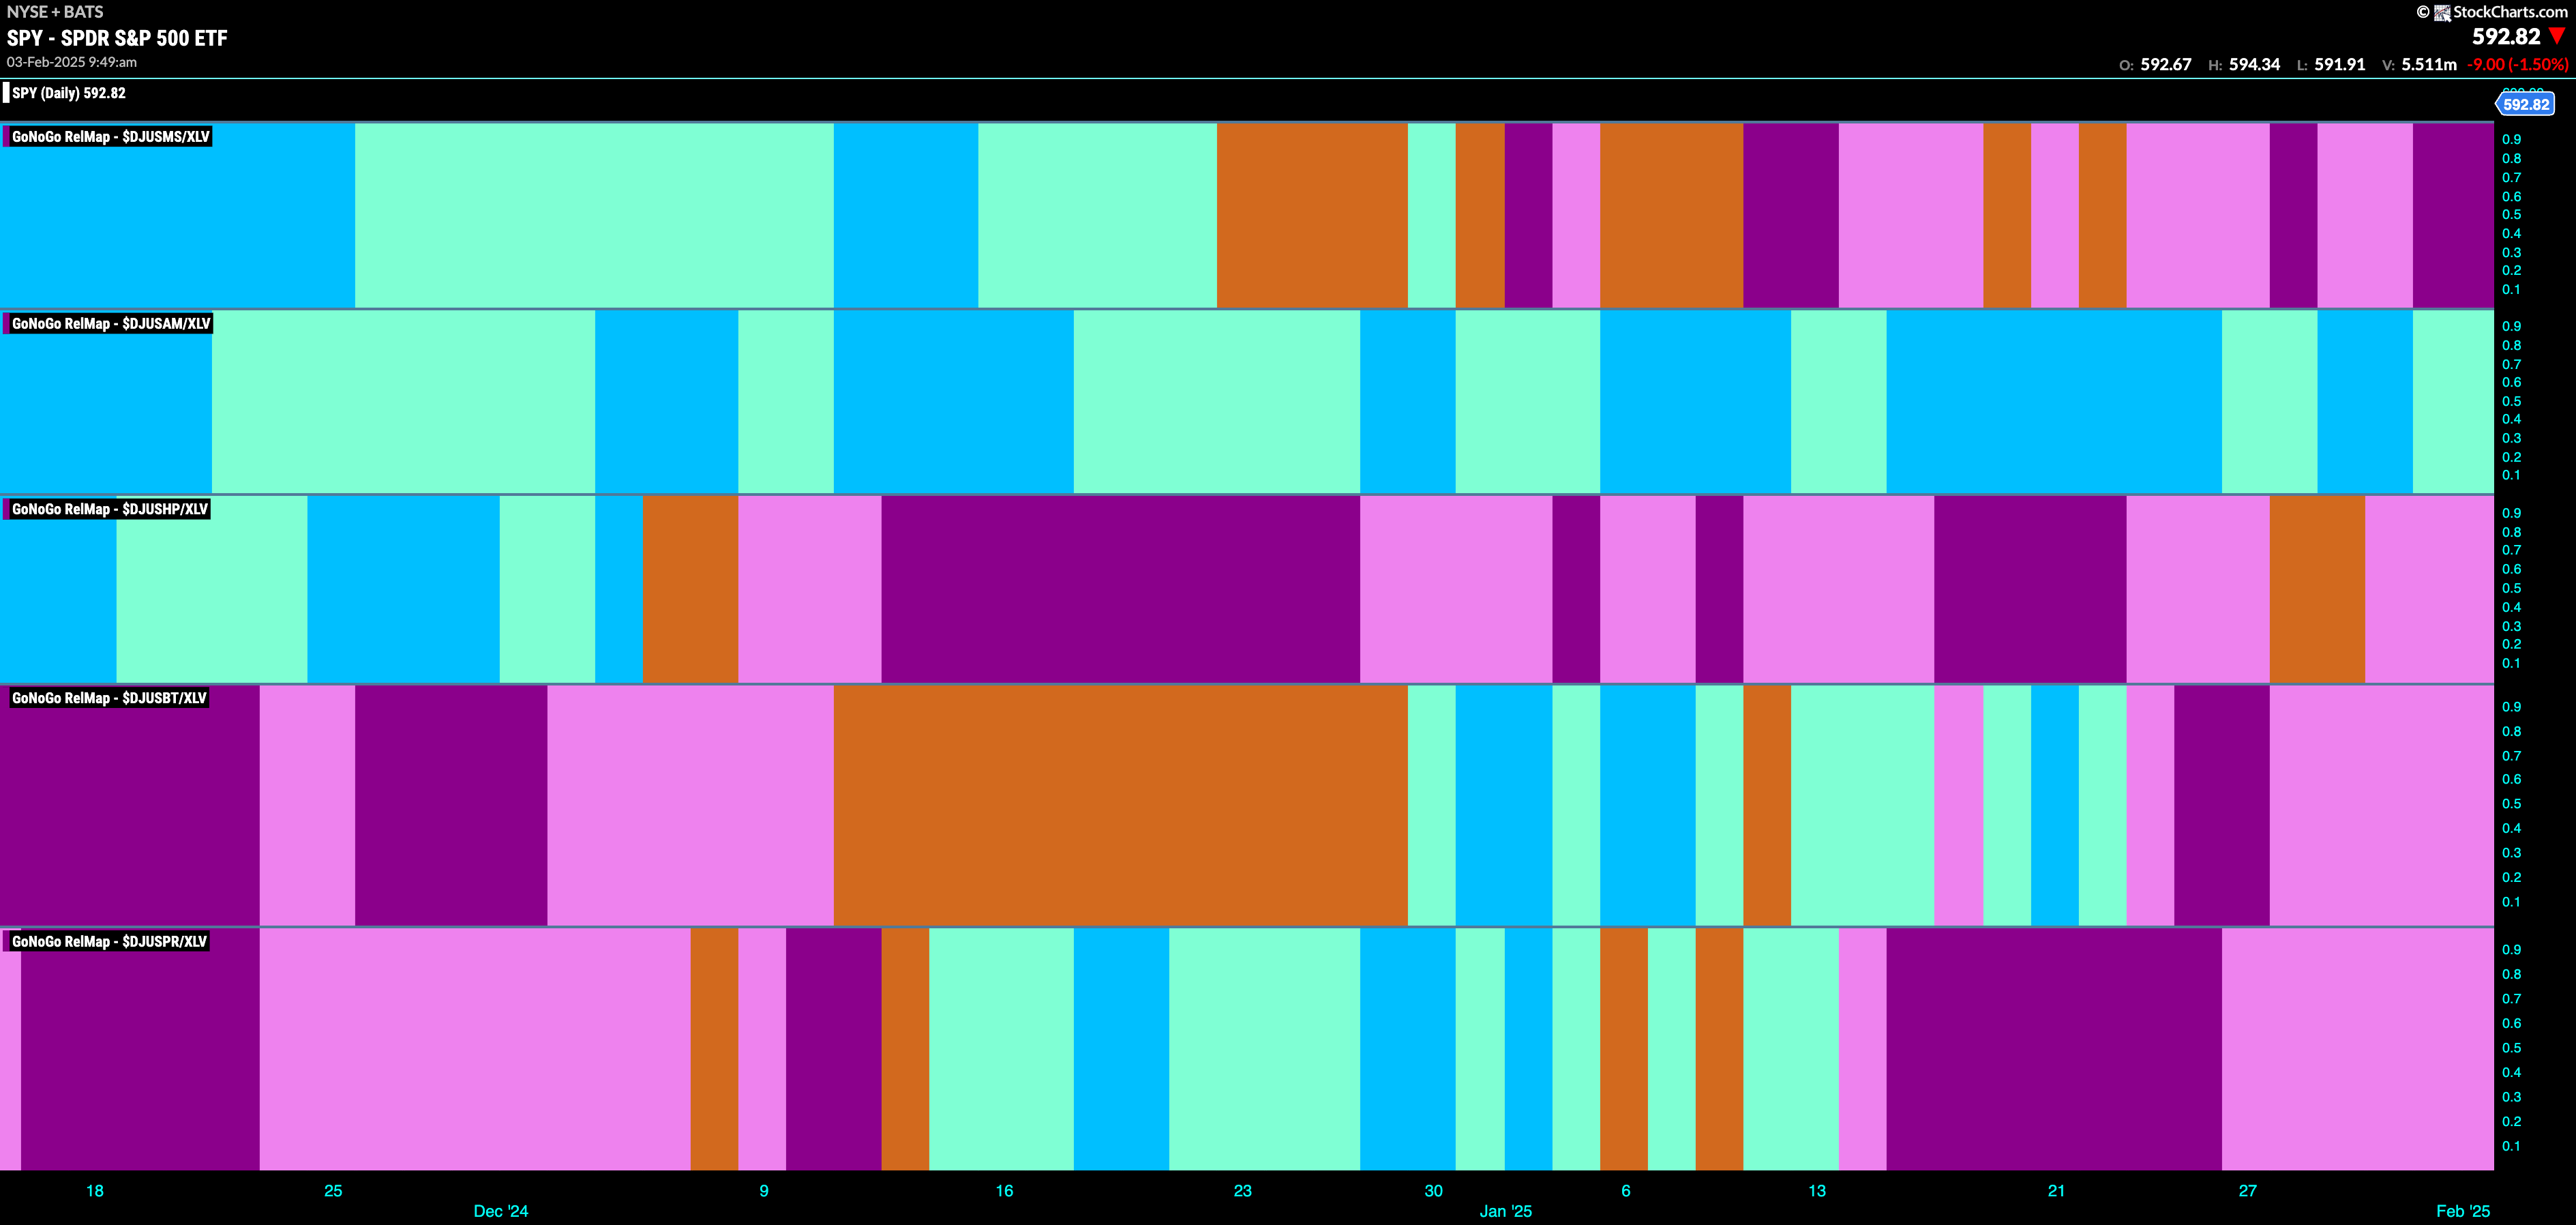
The chart below shows a relative trend breakdown of the sub groups within the healthcare sector this week. The Sub-Group RelMap plots the GoNoGo Trend of each sub index to the $XLV. We saw in the above GoNoGo Sector RelMap that $XLV is strong relatively speaking as it paints bright blue relative “Go” bars to the S&P 500. If we look at the breakdown of the groups in the map below we can see where that outperformance is coming from. Painting “Go” bars in the 2nd panel is the medical equipment sub group.
$CLPT looks for Support in “Go” Trend
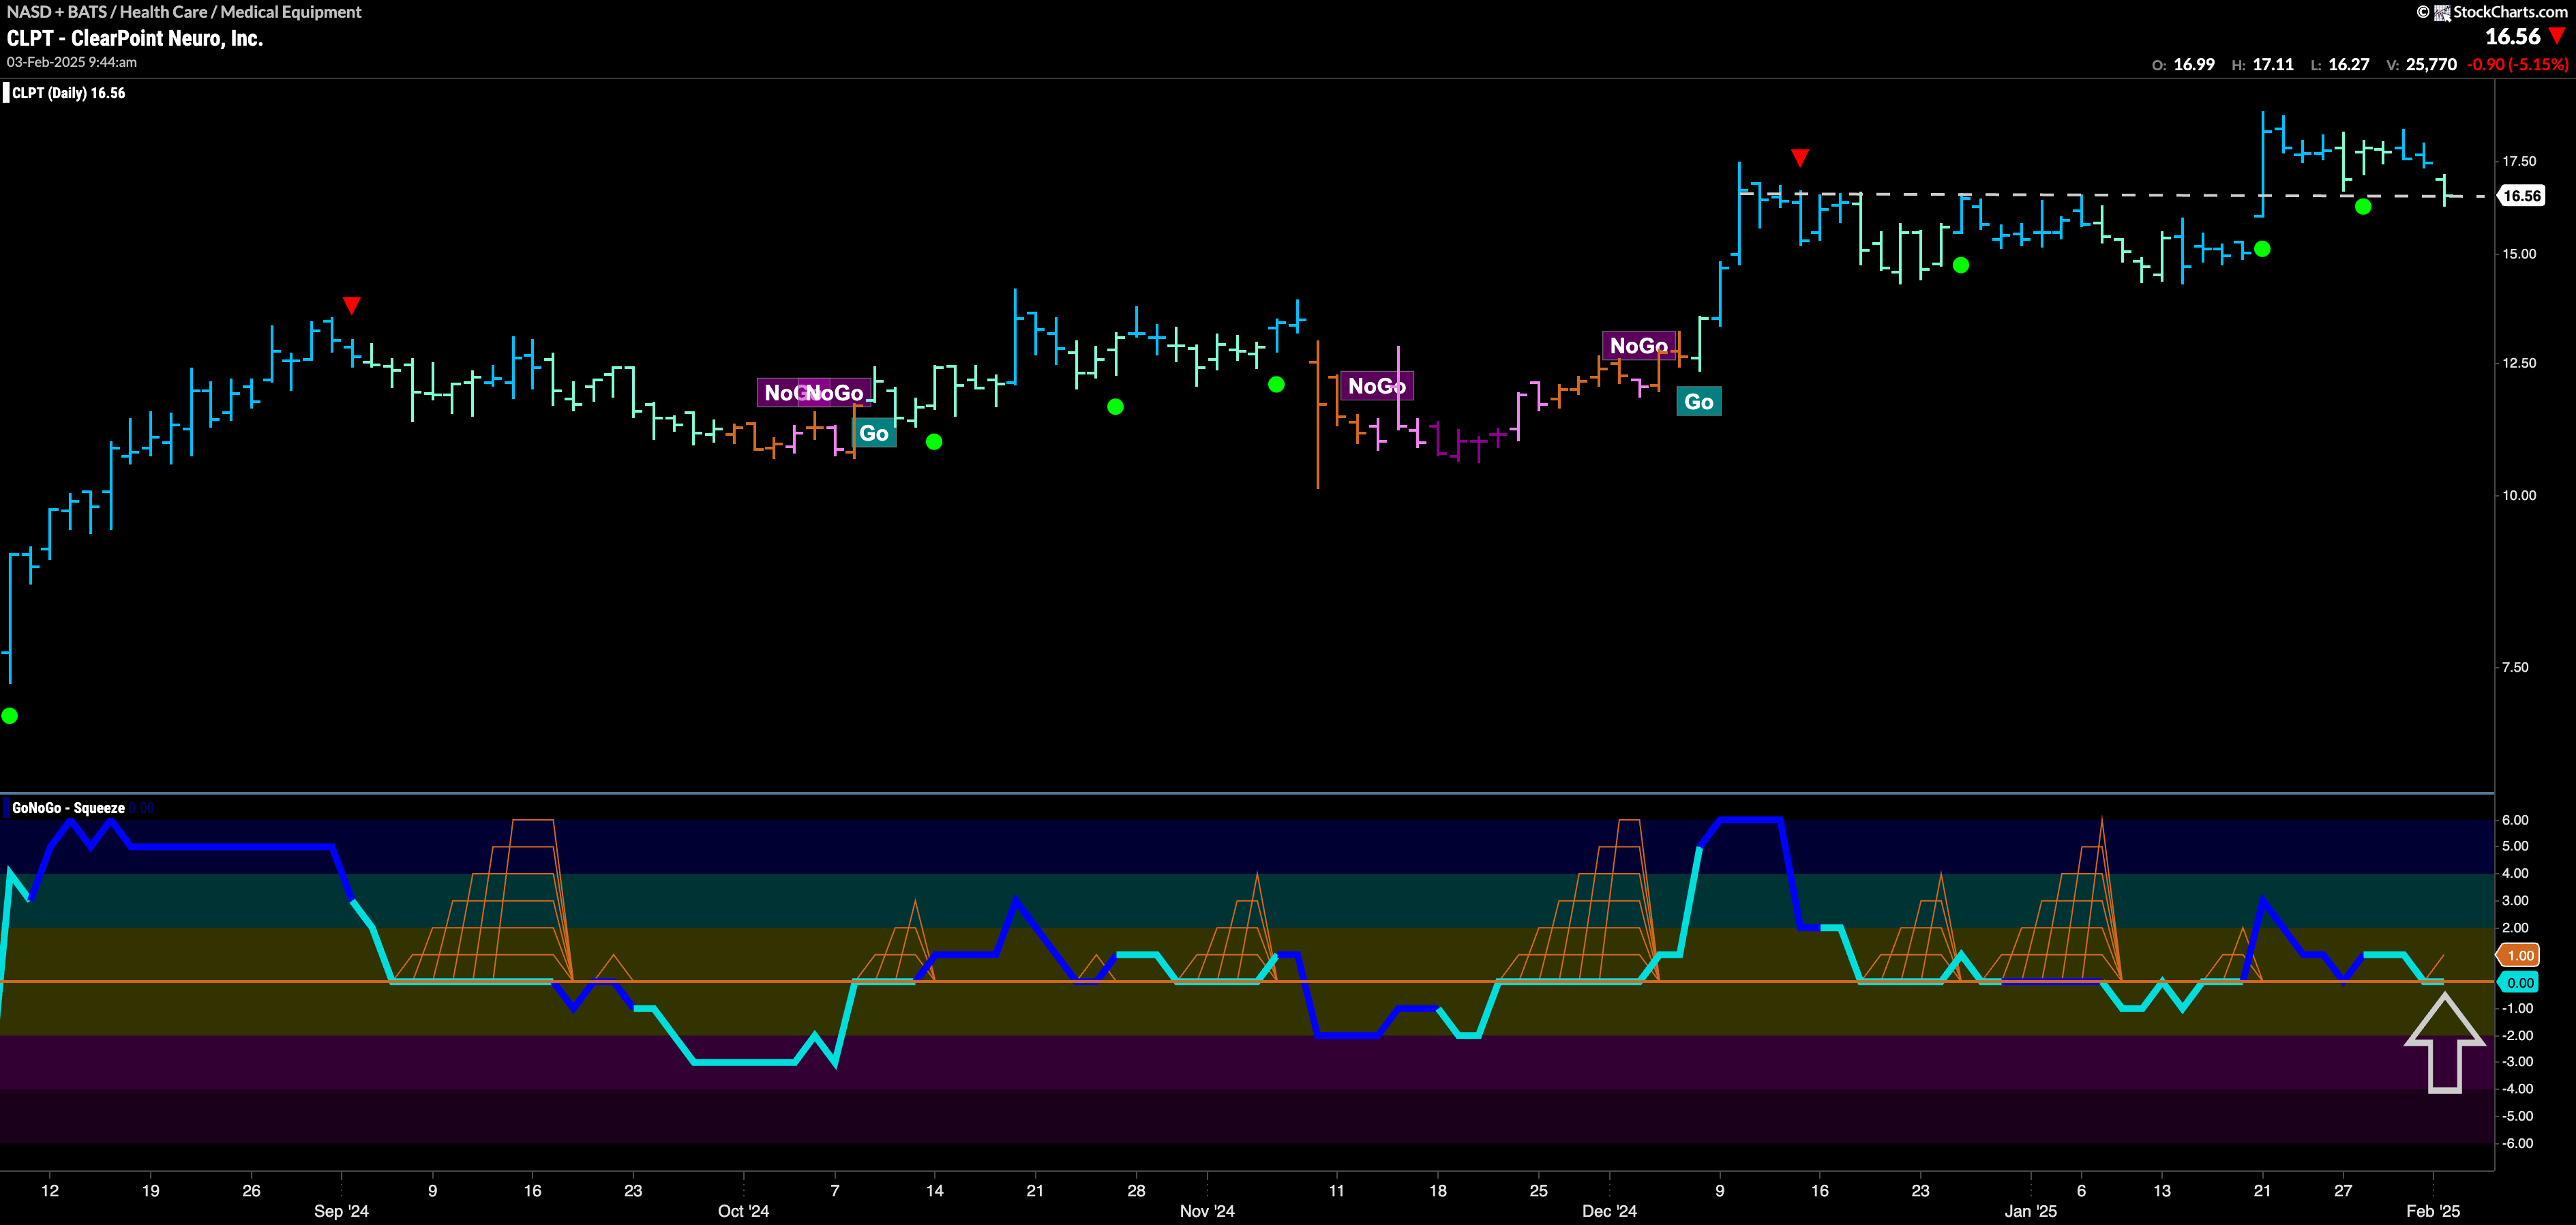
With a “Go” trend in place, we can see that price is looking for support at a level that was resistance. This is the concept of polarity playing out. We can see in the lower panel that GoNoGo Oscillator is also looking for support at the zero line. If it finds it, then we will likely see price make an attempt at another higher high.
$NPCE Looks to Consolidate after Higher High
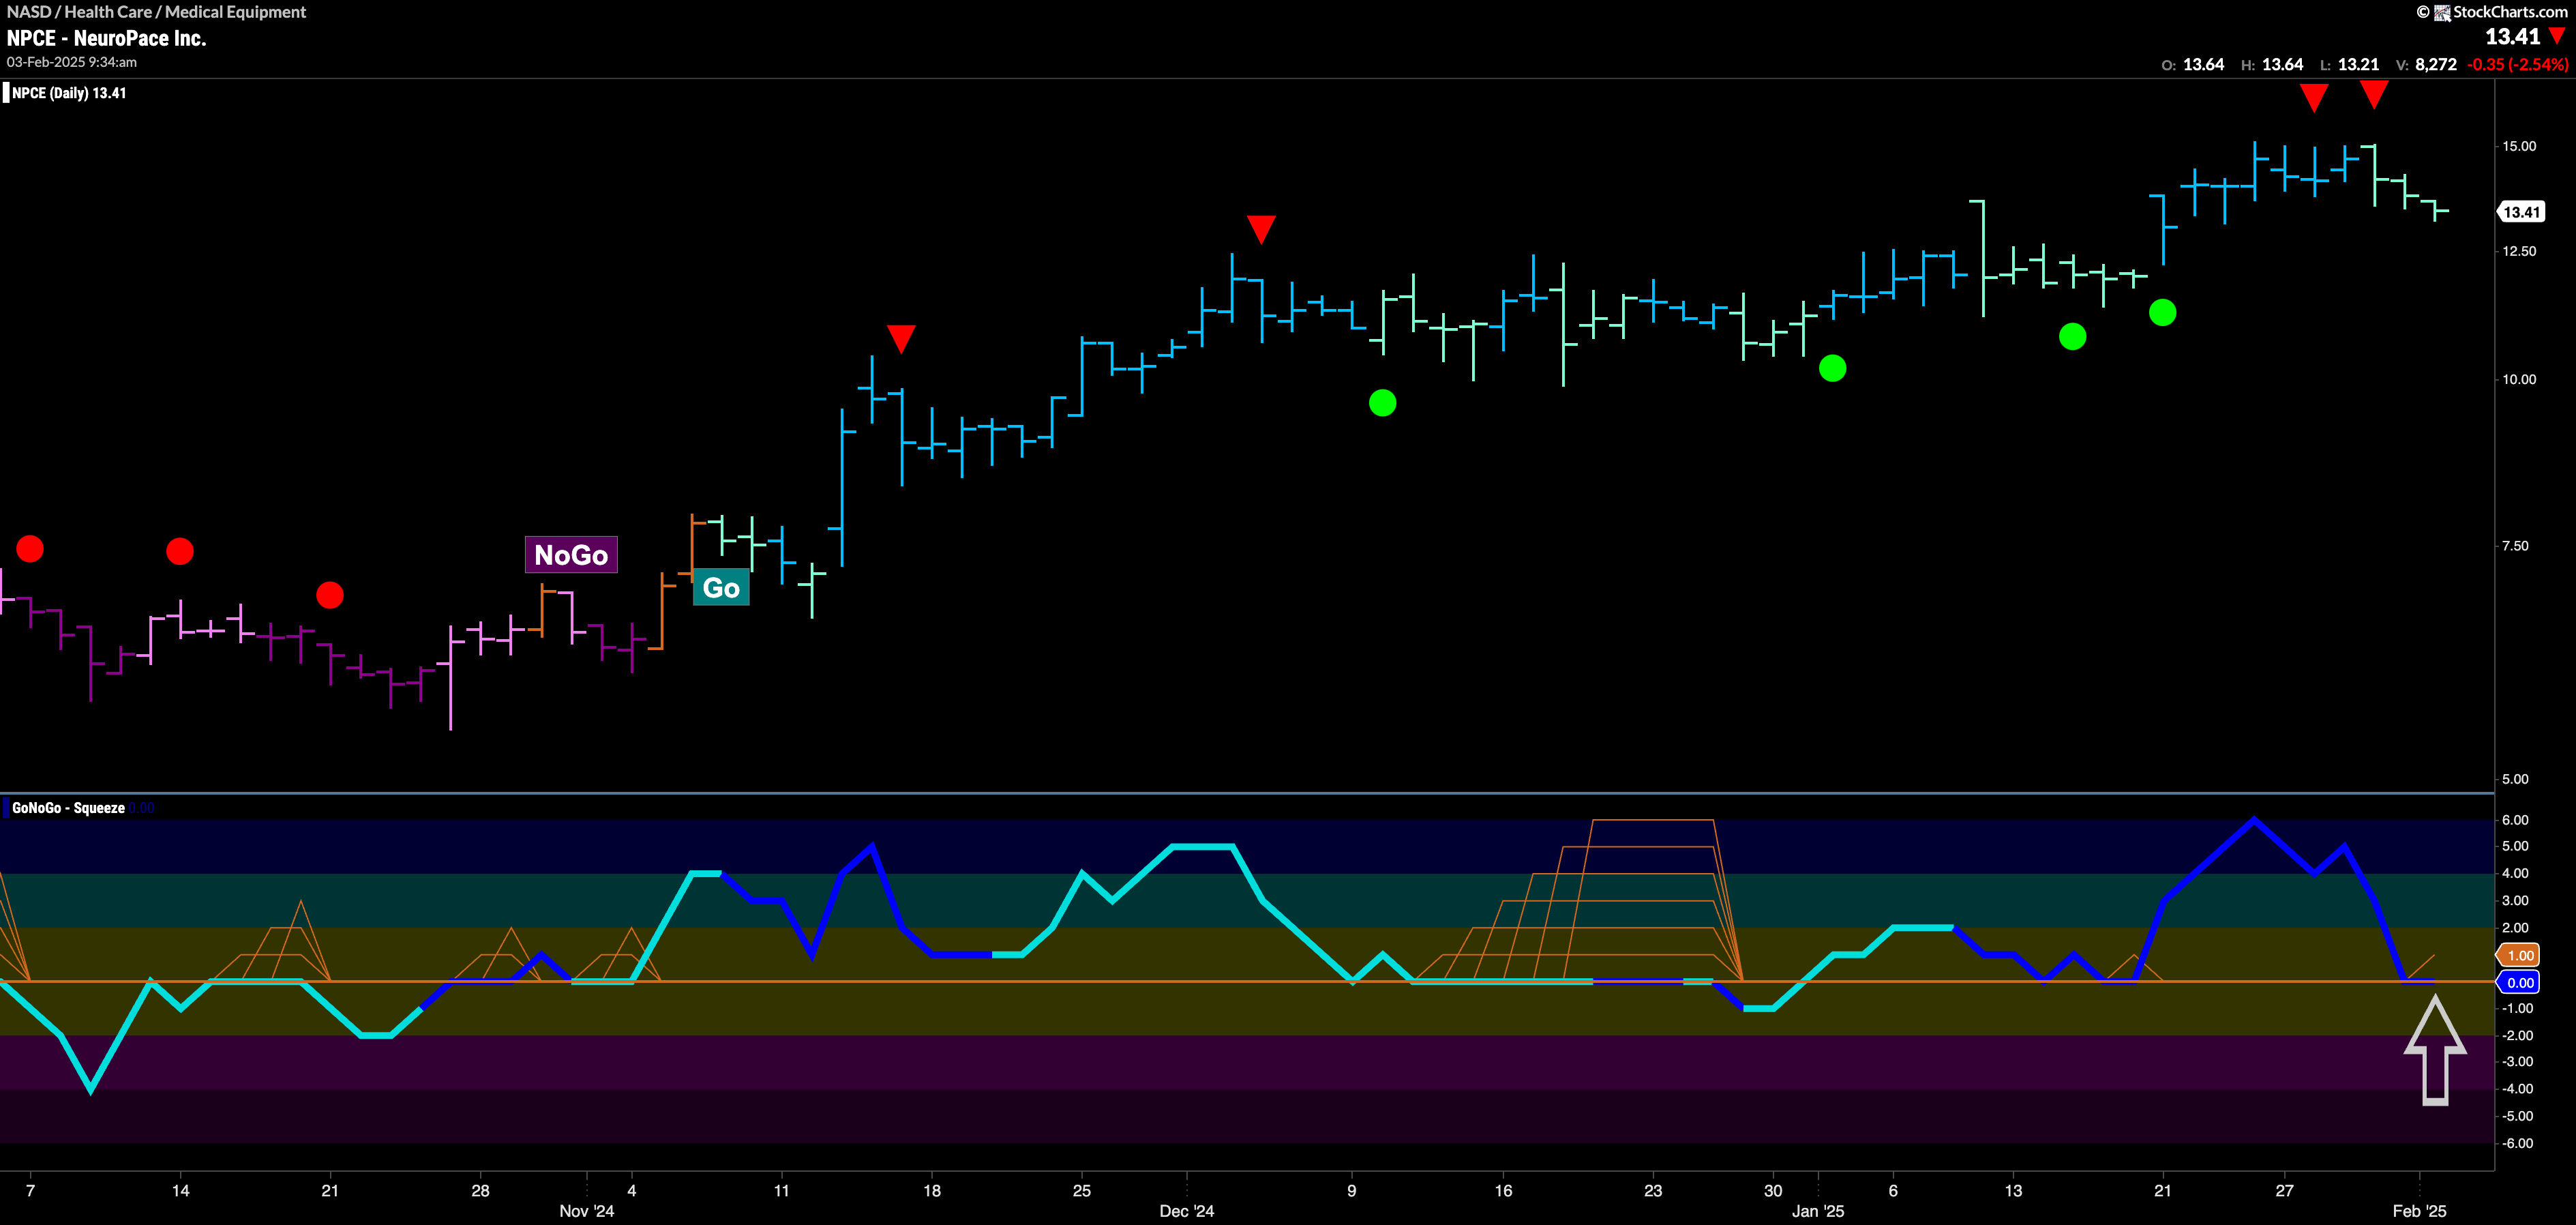
$NPCE has been in a “Go” trend since late last year. We have seen a series of higher highs and higher lows that pushed price to $15. At the last high, we saw a couple of Go Countertrend Correction Icons (red arrows) indicating that price may struggle in the short term. Since then, we have seen some weaker aqua bars as price has fallen from the high. With heavy volume, we see the GoNoGo Oscillator testing the zero line from above. We will watch to see if it finds support here. If it does, we will look for price to set a new higher high.
