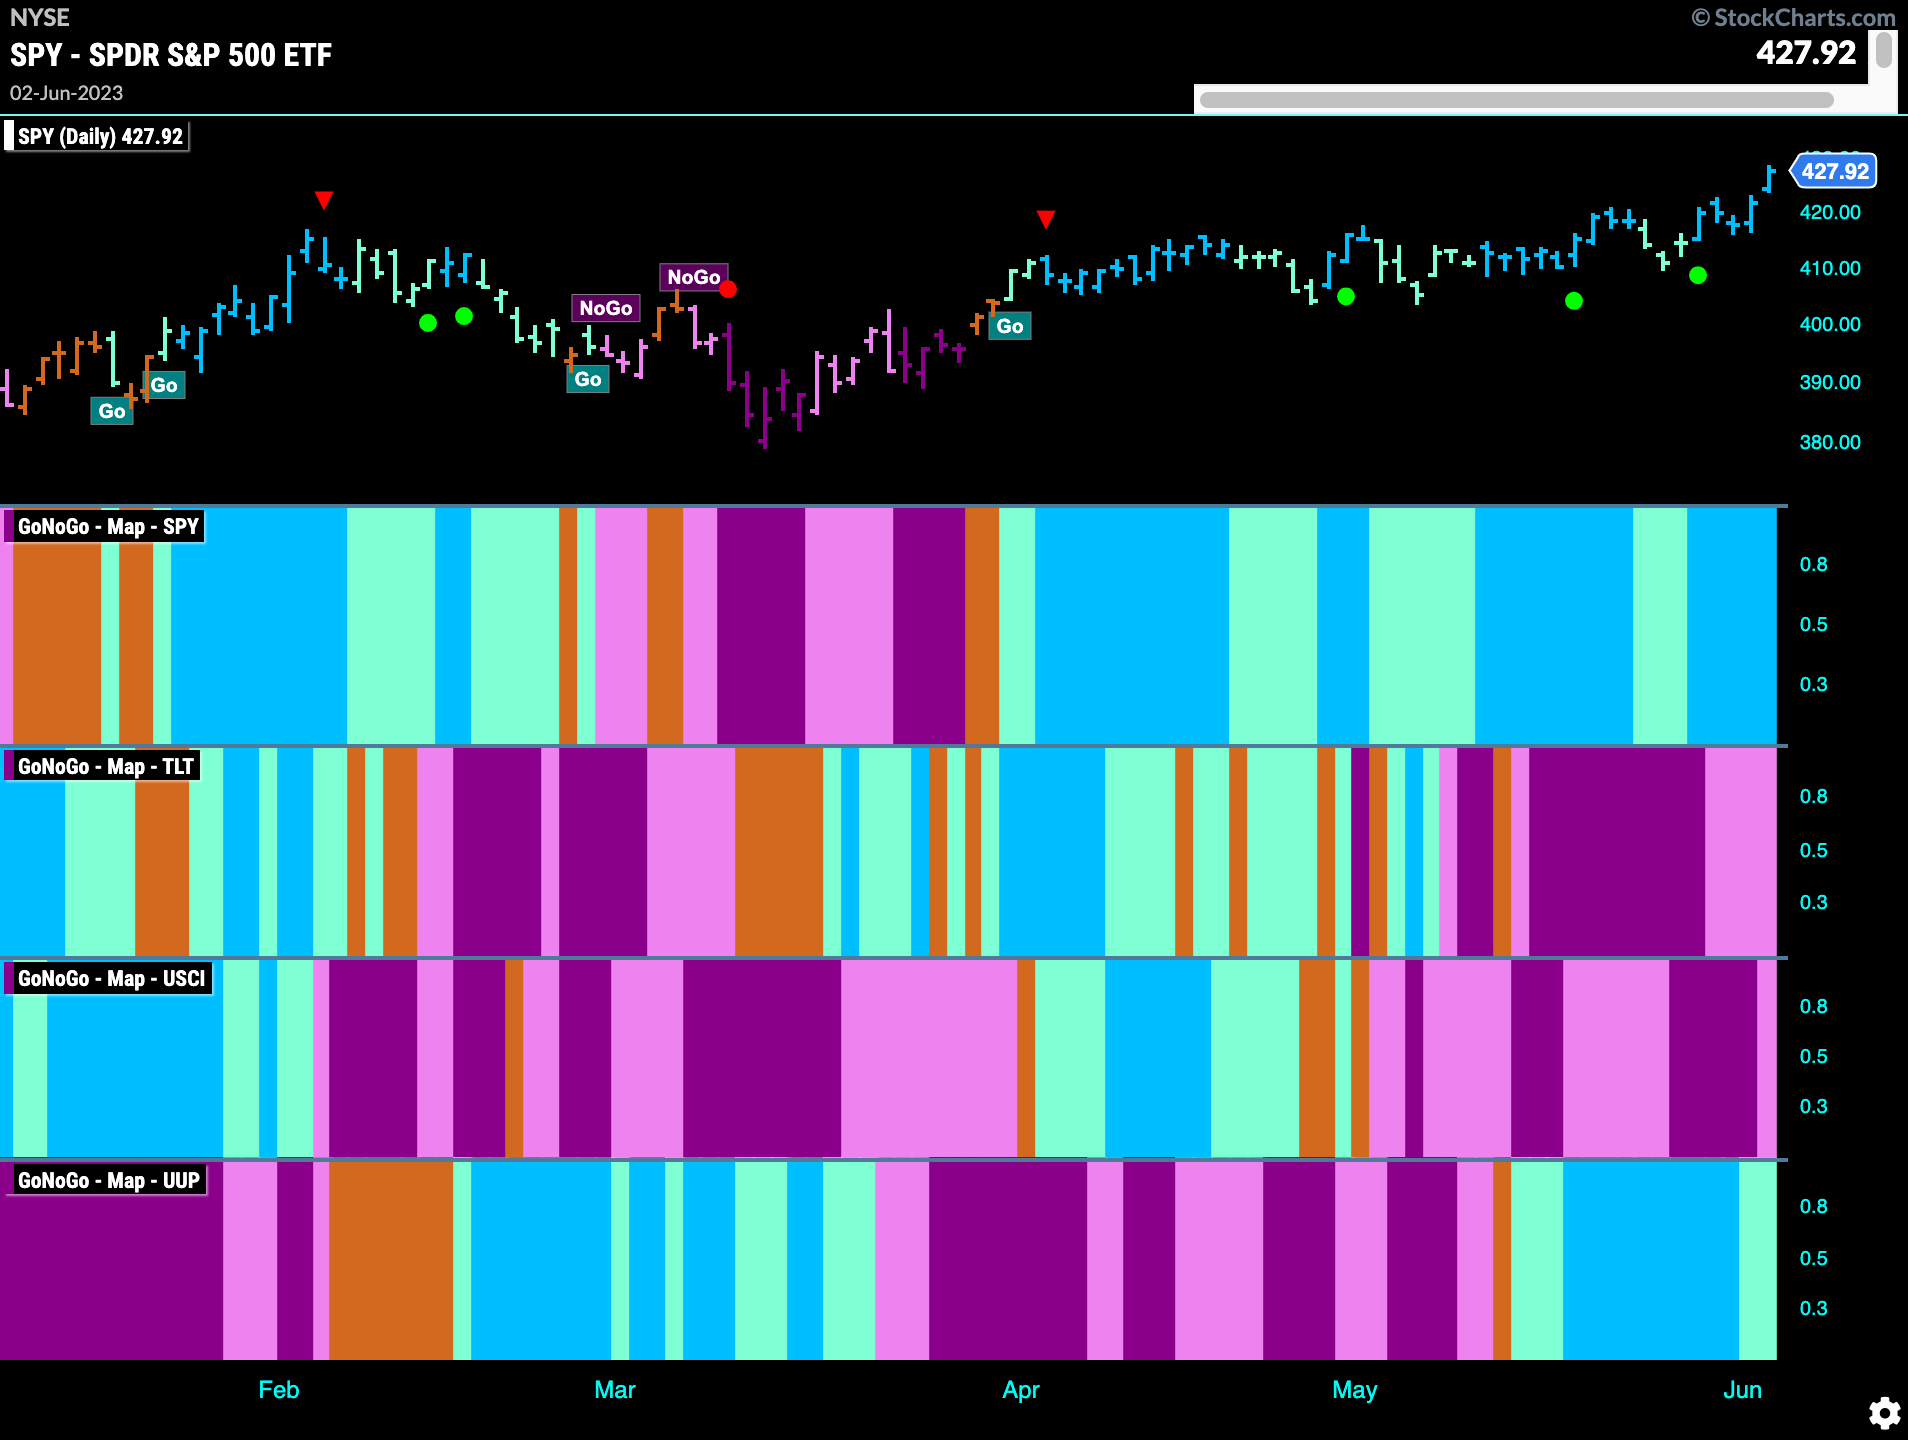
Good morning and welcome to this week’s Flight Path. Equities maintained the “Go” trend last week painting a string of strong blue bars. Treasury bond prices continued to struggle painting pink “NoGo” bars as the week came to a close. Commodity prices maintained “NoGo” bars with mostly strong purple this week. The dollar continued to paint “Go” bars as well.
Equity Prices Test Resistance From Prior High
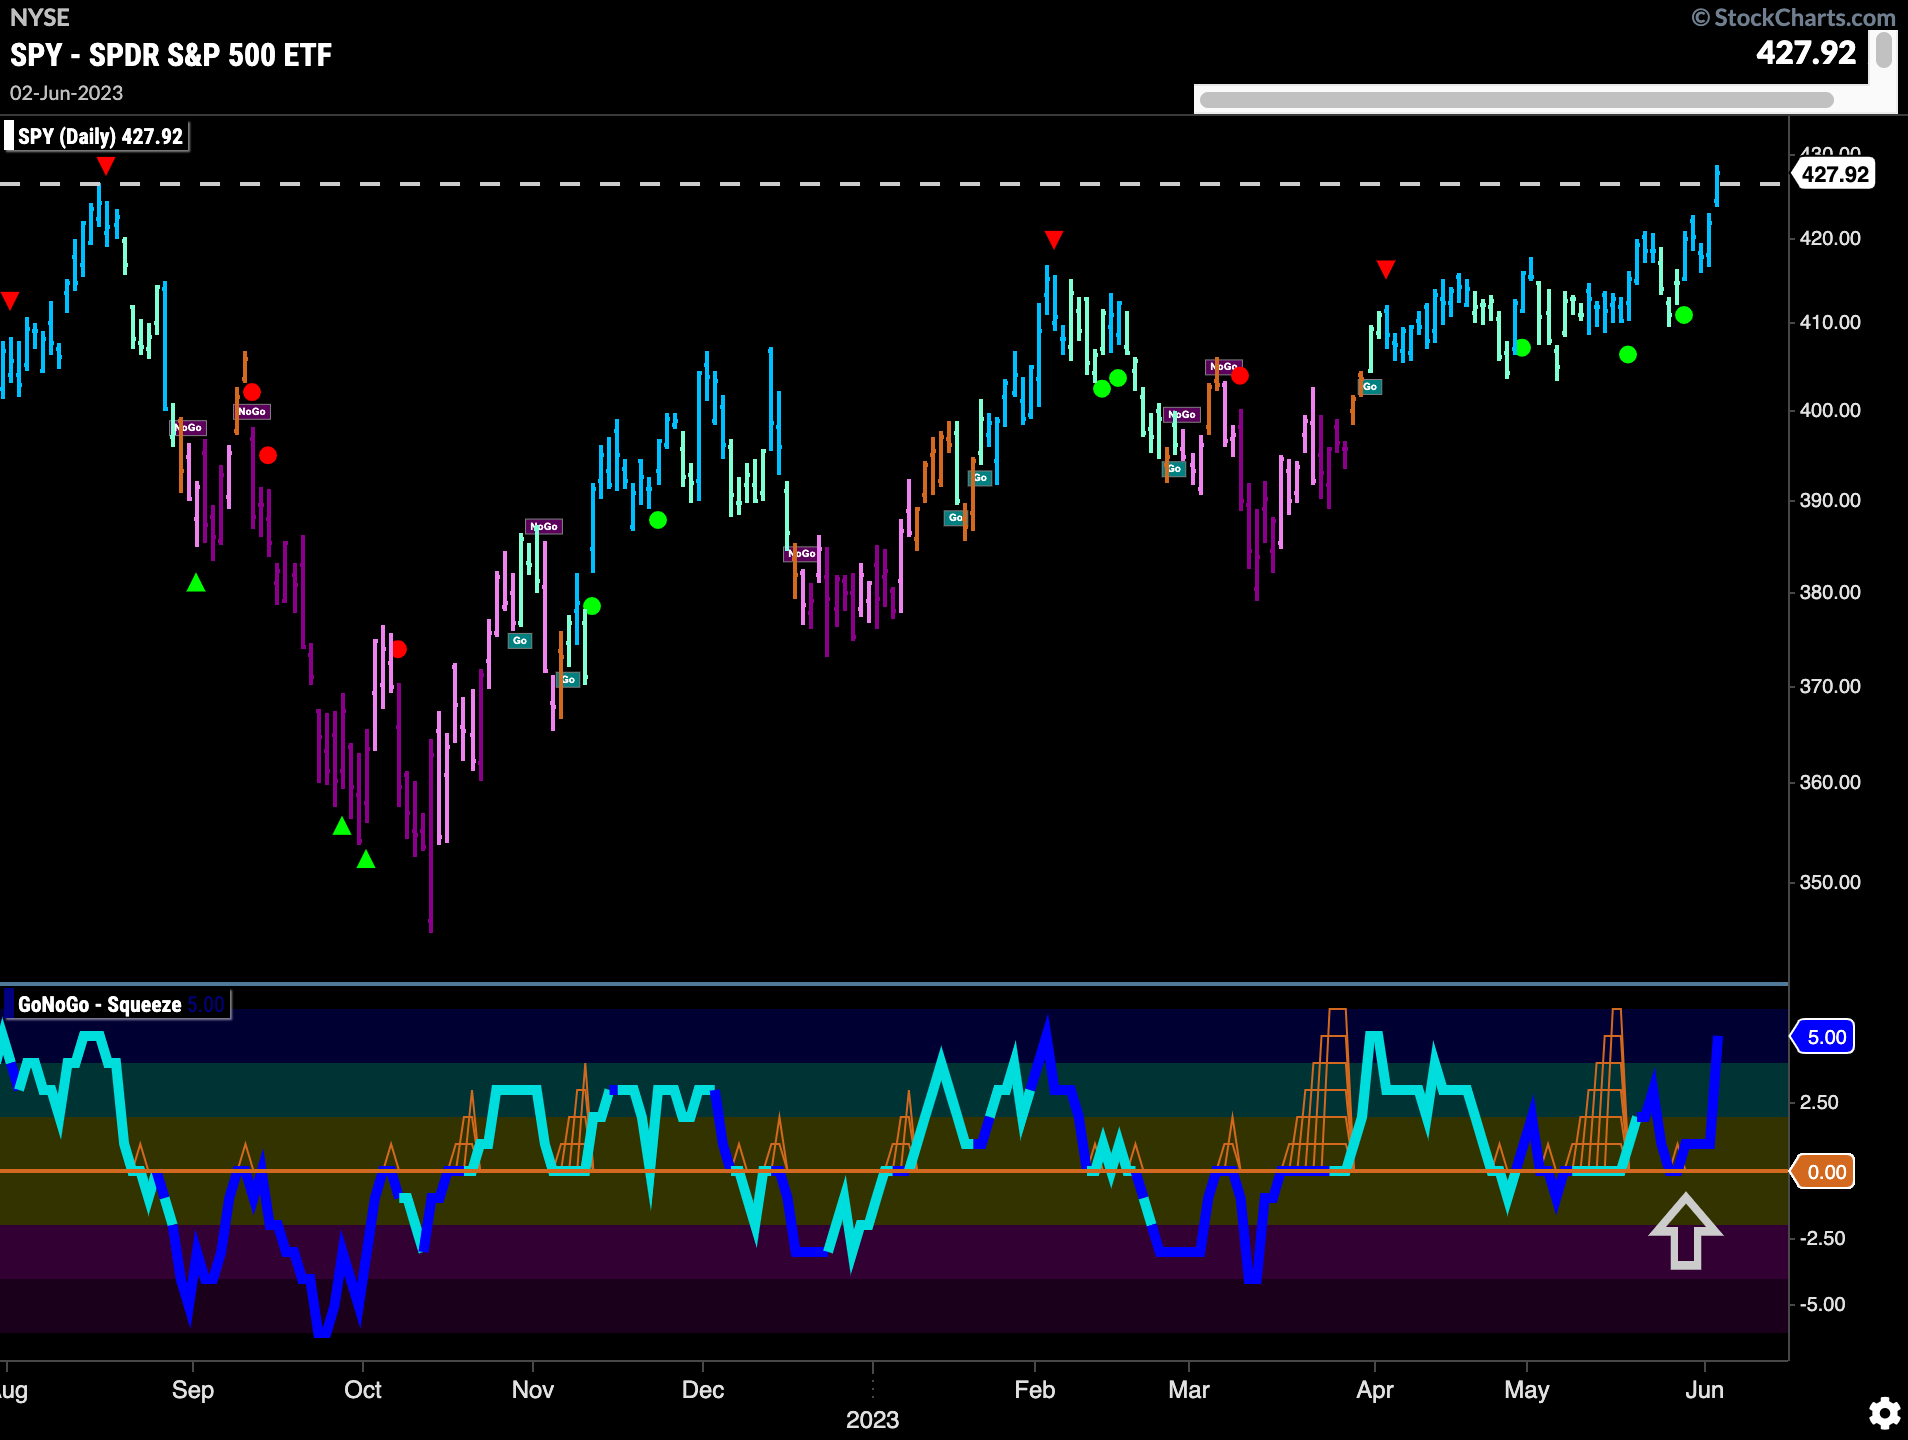
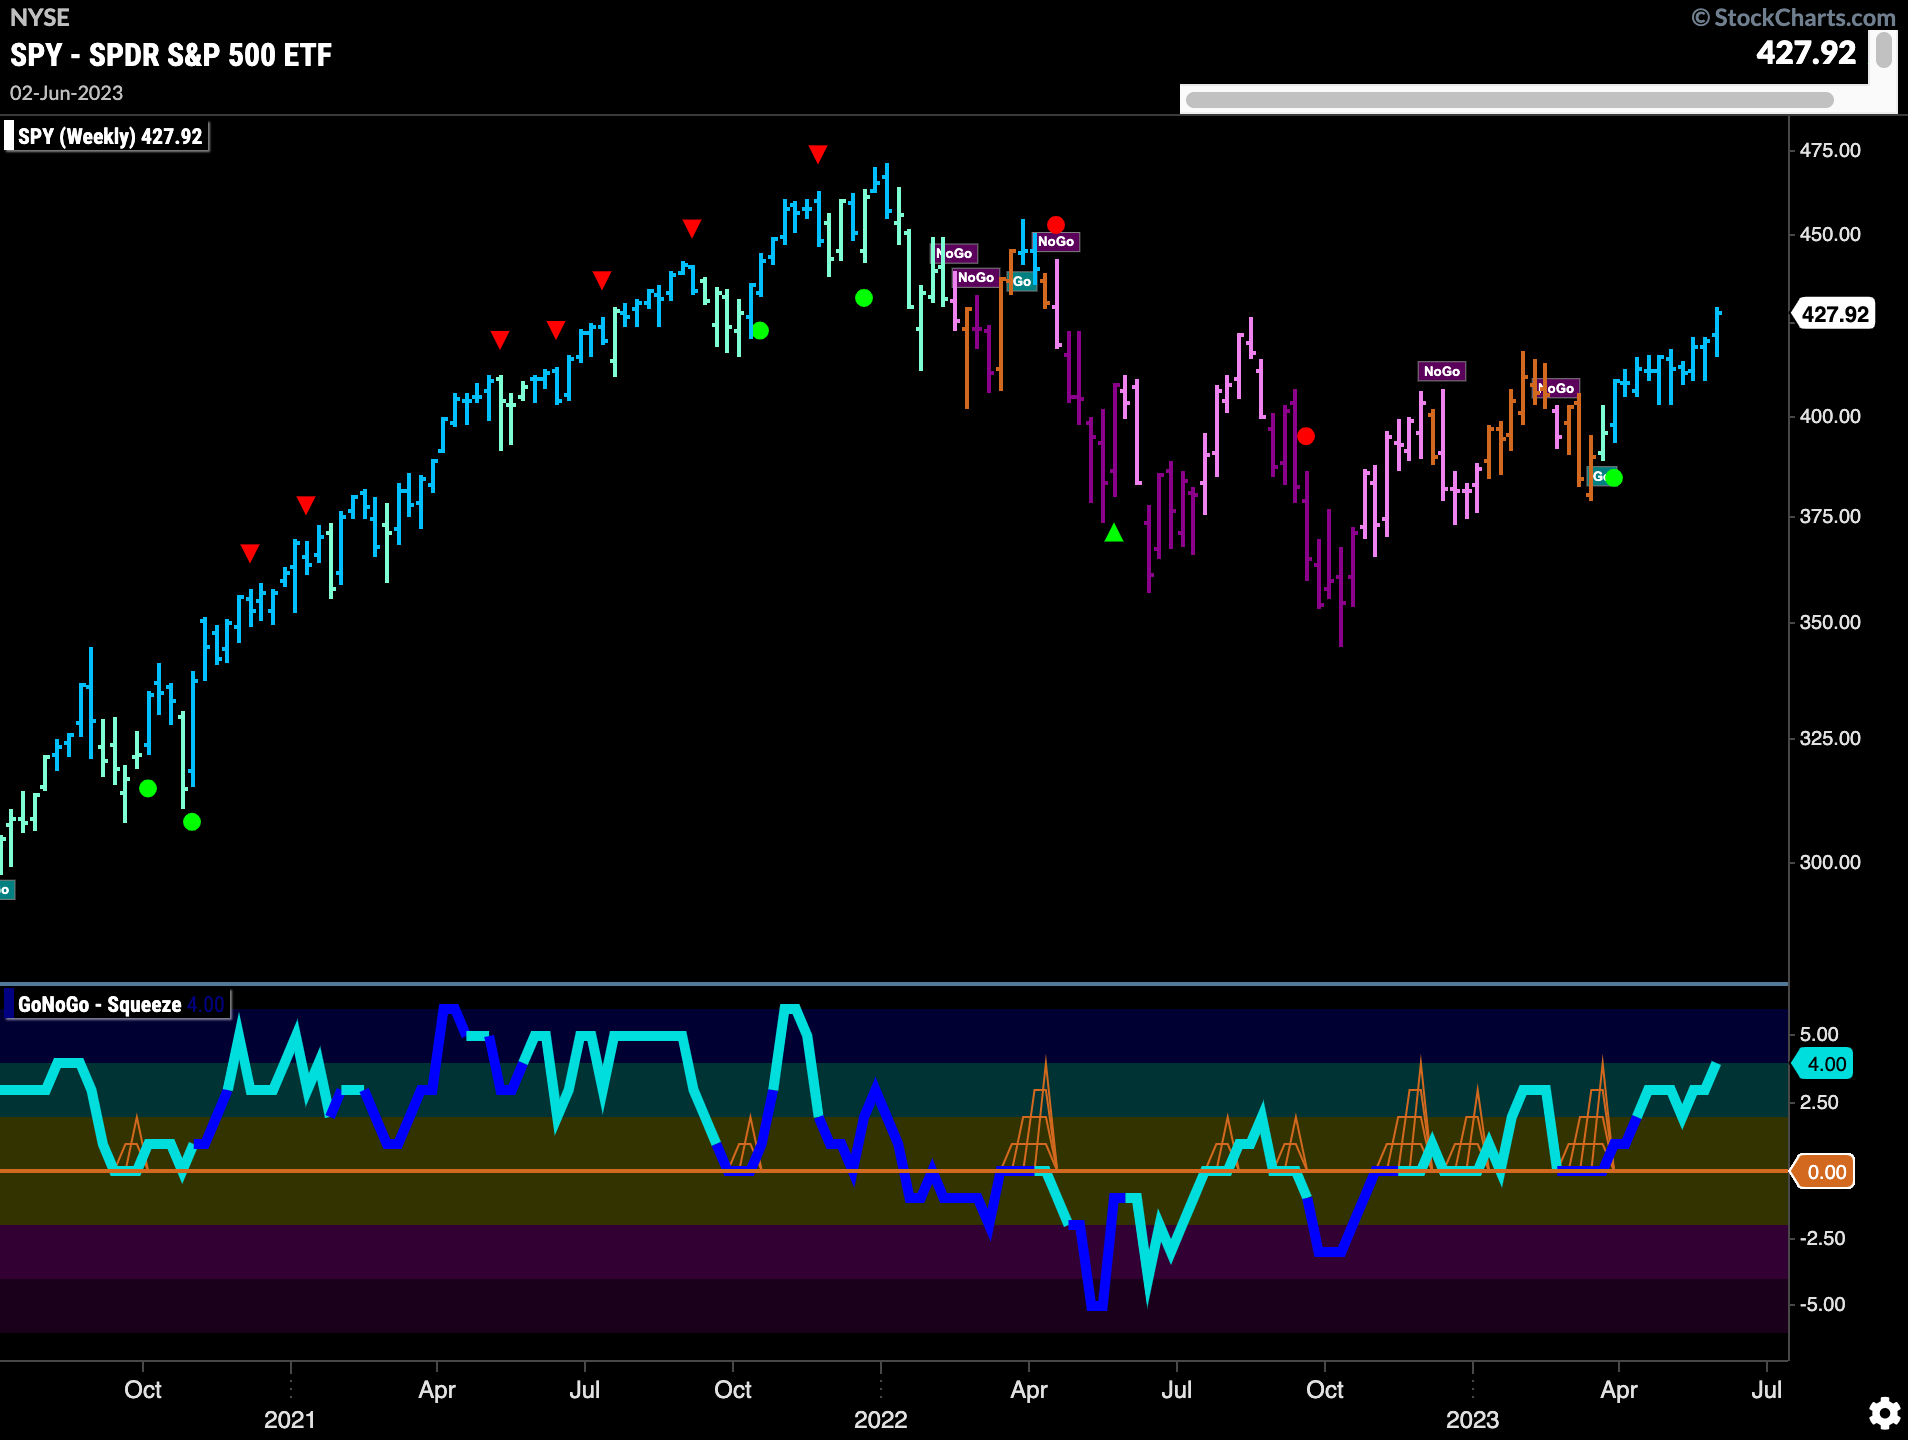
$SPY showed strength last week as we saw GoNoGo Oscillator find support at zero and with heavy volume the market pushed price higher. Friday’s strong price action saw price testing the high from summer ’22. We will see if price can consolidate at these levels this week.
The longer term weekly chart shows just how strong price action has been for the past few months. Uninterrupted strong blue bars show that the “Go” trend is in good shape as GoNoGo Oscillator is in positive territory but not overbought.
Treasury Rates Fail at Downward Sloping Resistance
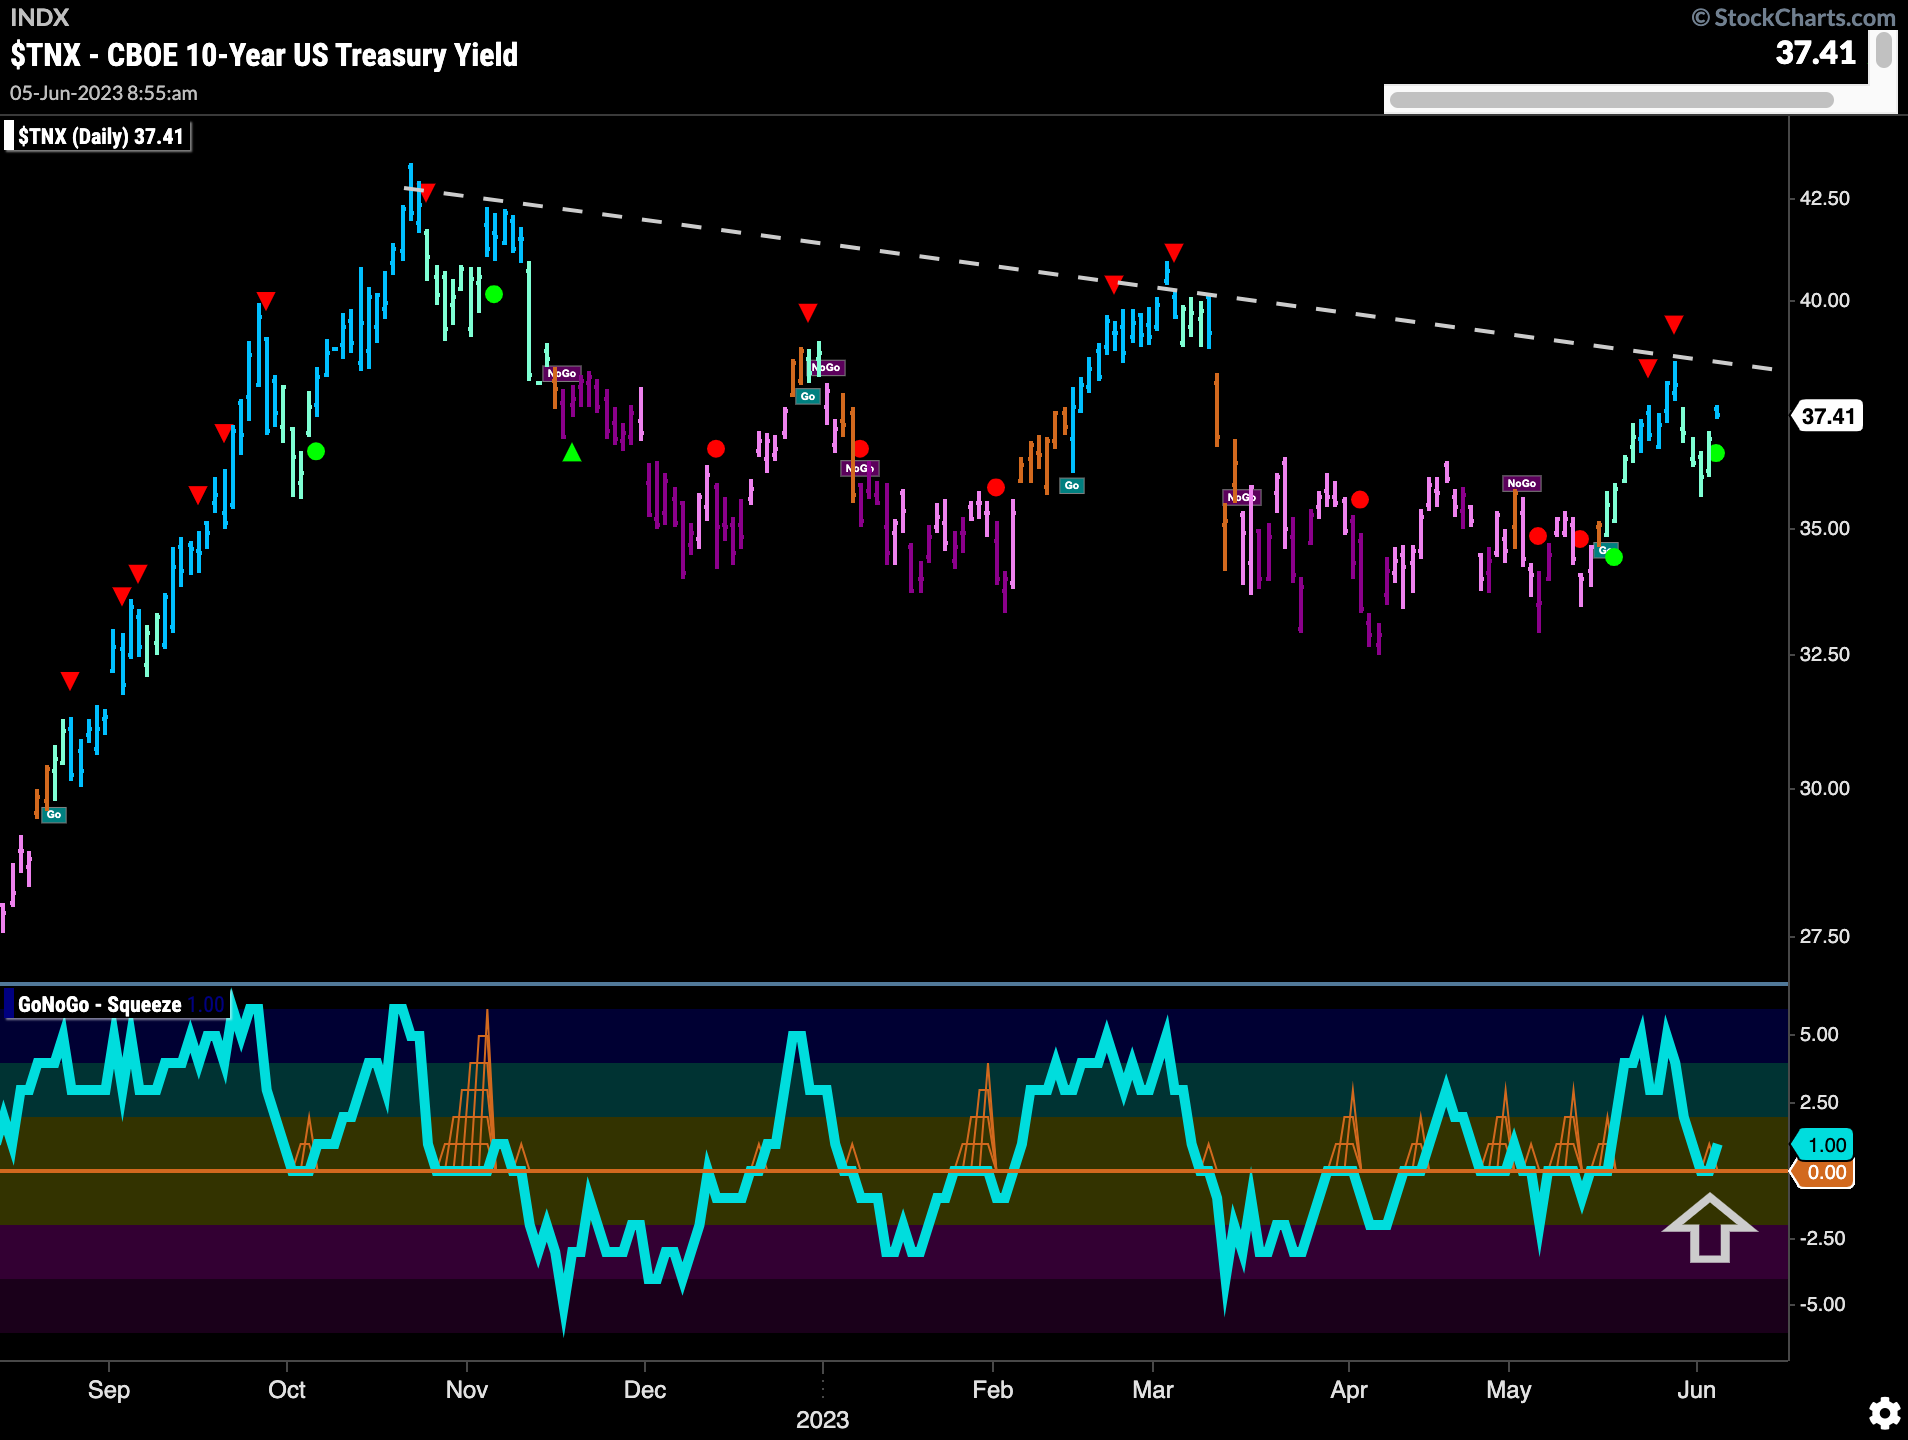
Treasury rates are still in a “Go” trend but we saw difficulty this week as price fell away quickly from its most recent high. GoNoGo Oscillator fell to test the zero line from above and we will watch to see if it is able to find support at that level.
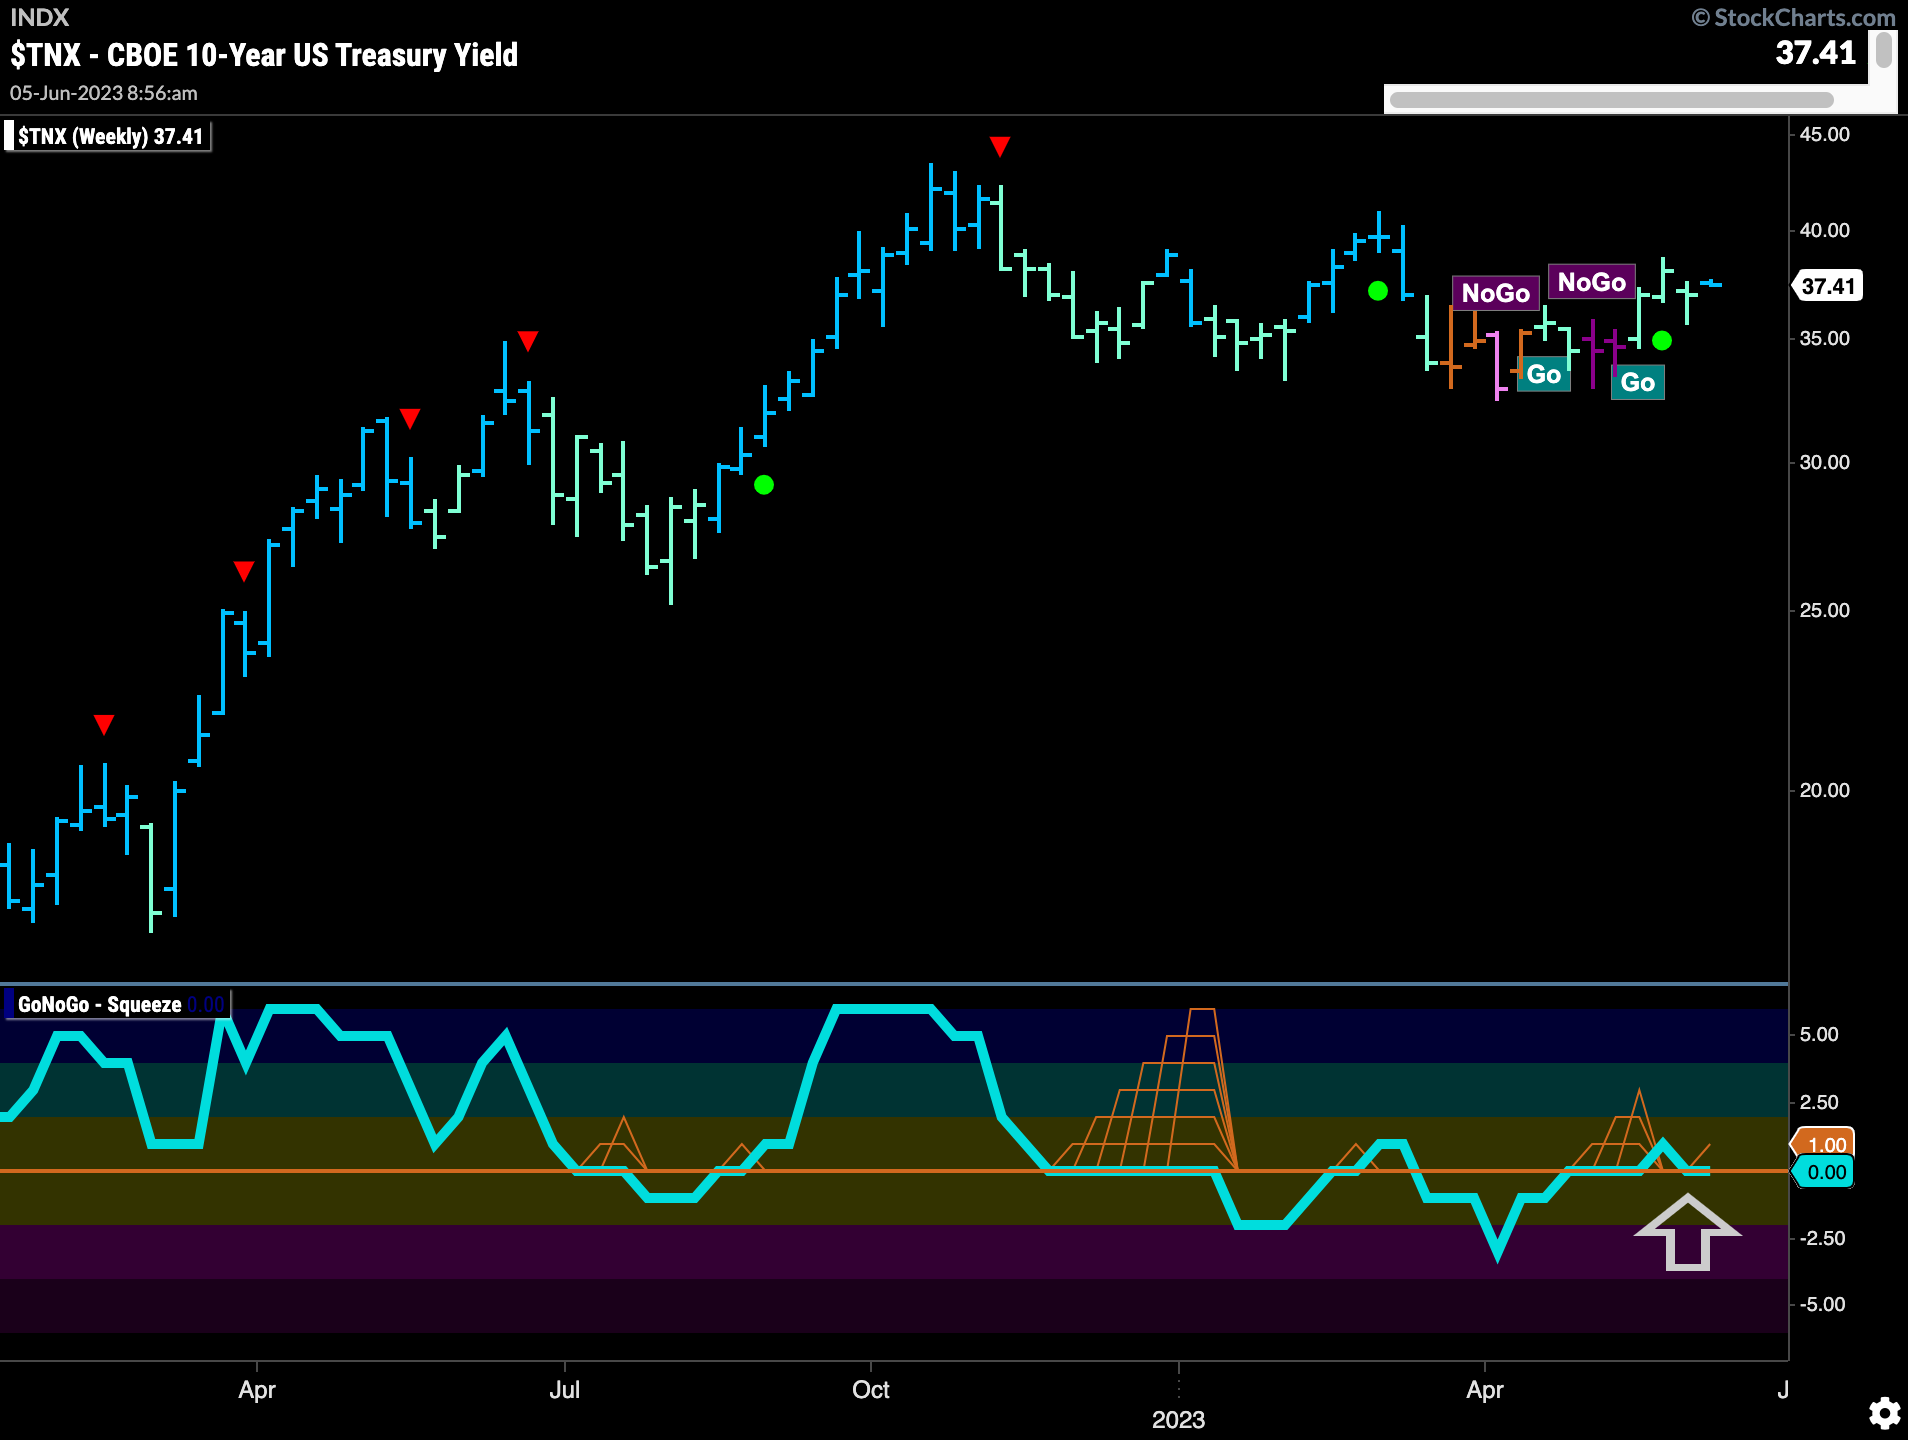
The weekly chart shows that while prices are in a “Go” trend there has not been much movement higher for several months. GoNoGo Oscillator is at the zero line once more and we will pay close attention to the direction of momentum over the coming week. Rates remain elevated but do not appear to be racing higher.
Dollar’s Still Pushing Up Against Resistance
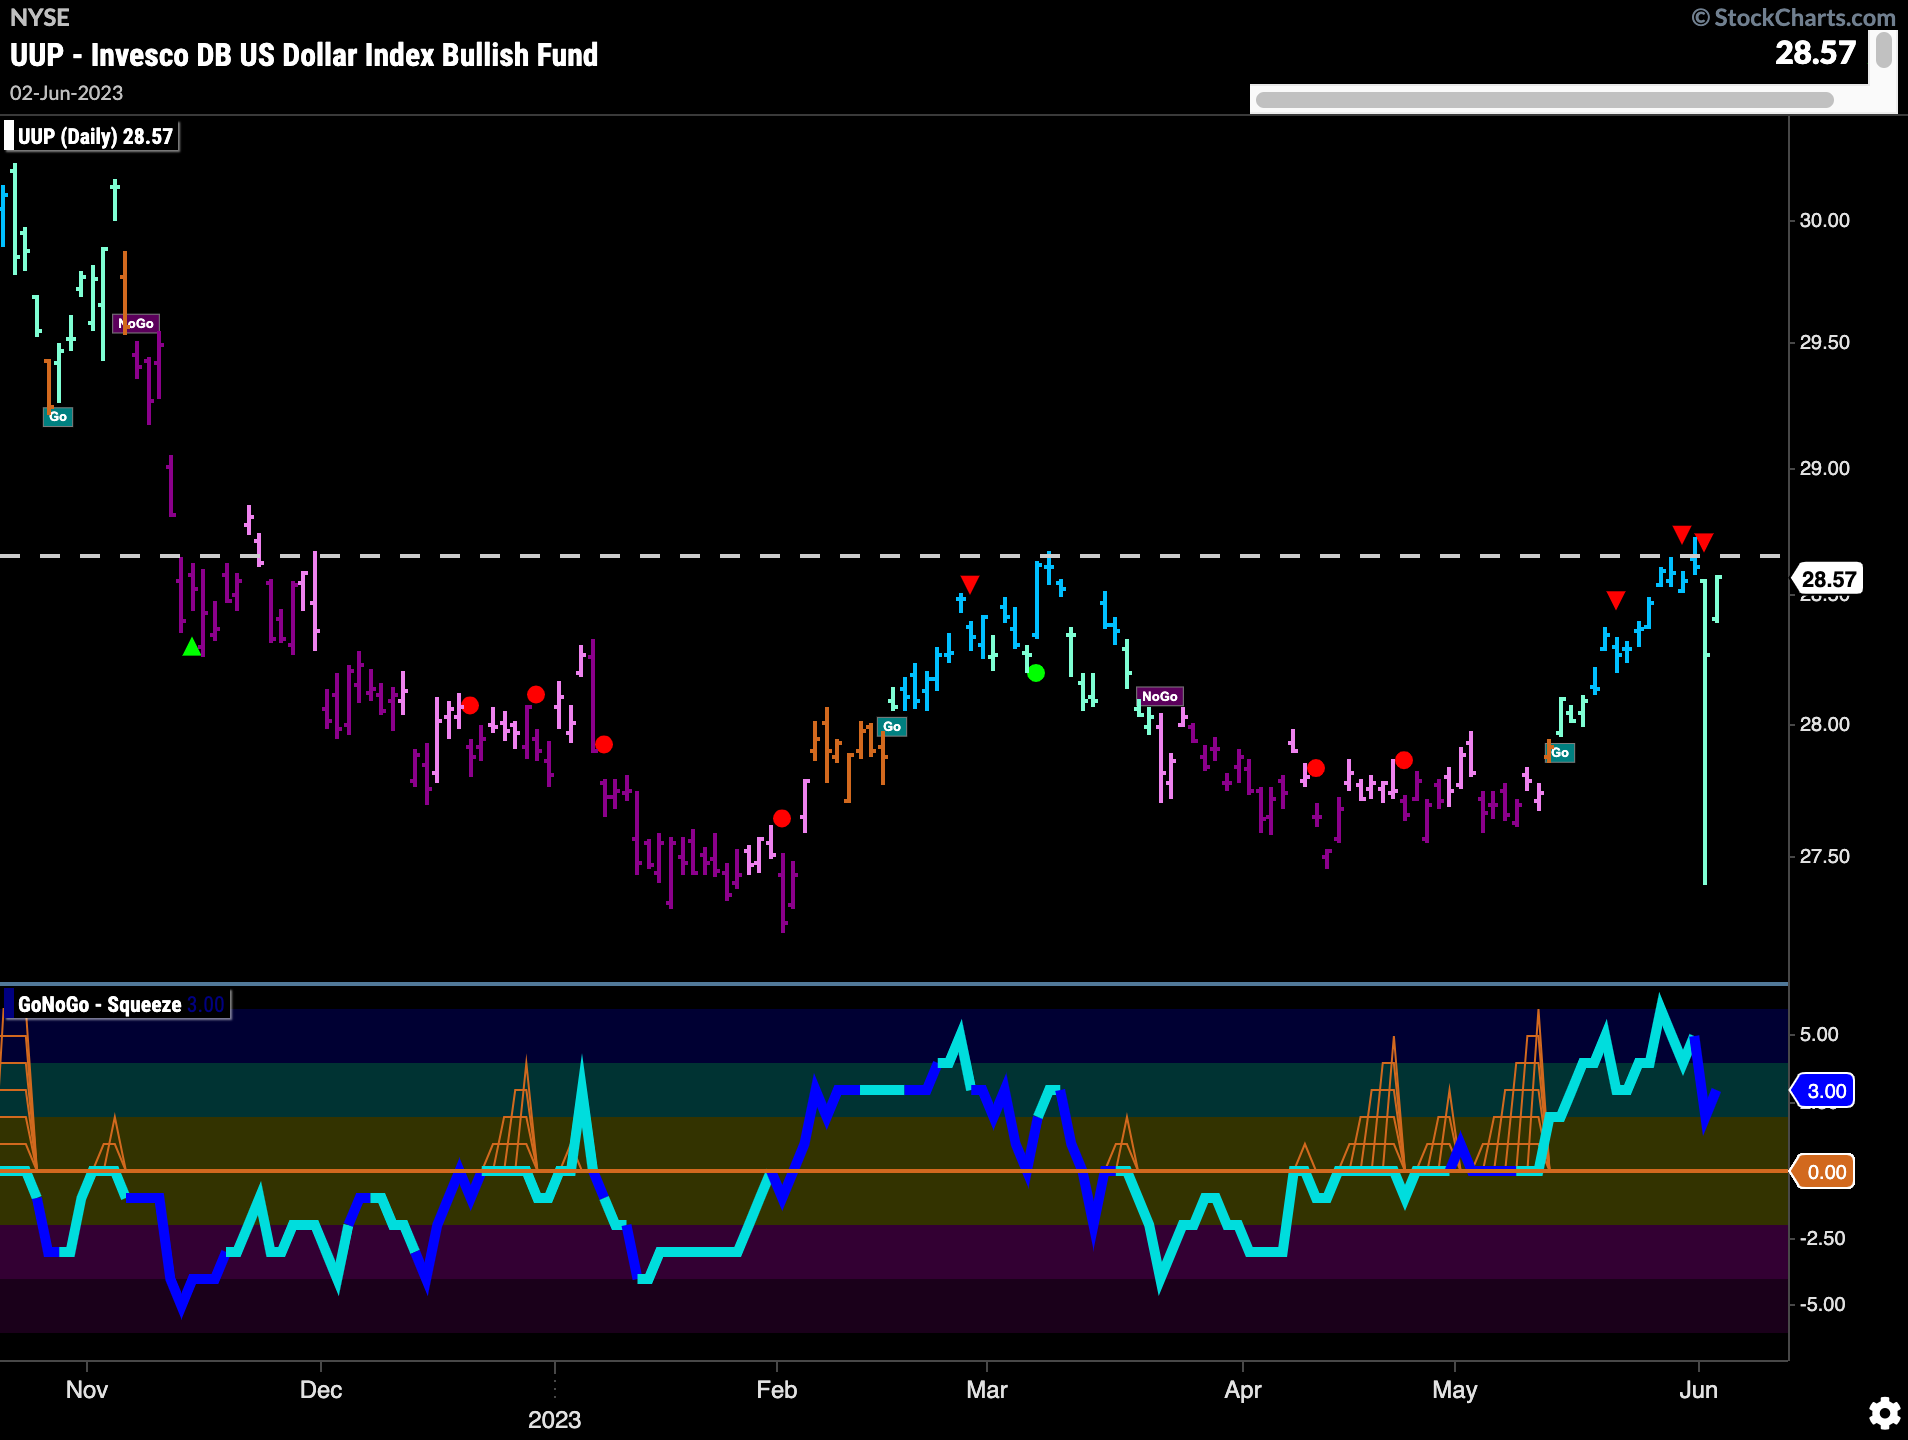
GoNoGo Trend painted “Go” bars again all week but the end of the week saw paler aqua bars. As price tries to stay within striking distance of the resistance from the prior high we look at the oscillator which is falling close to the zero line. Volume is heavy and so we know there is a lot of market participation at these levels. It will be important to see whether GoNoGo Oscillator finds support at zero.
Nothing Doing on Oil
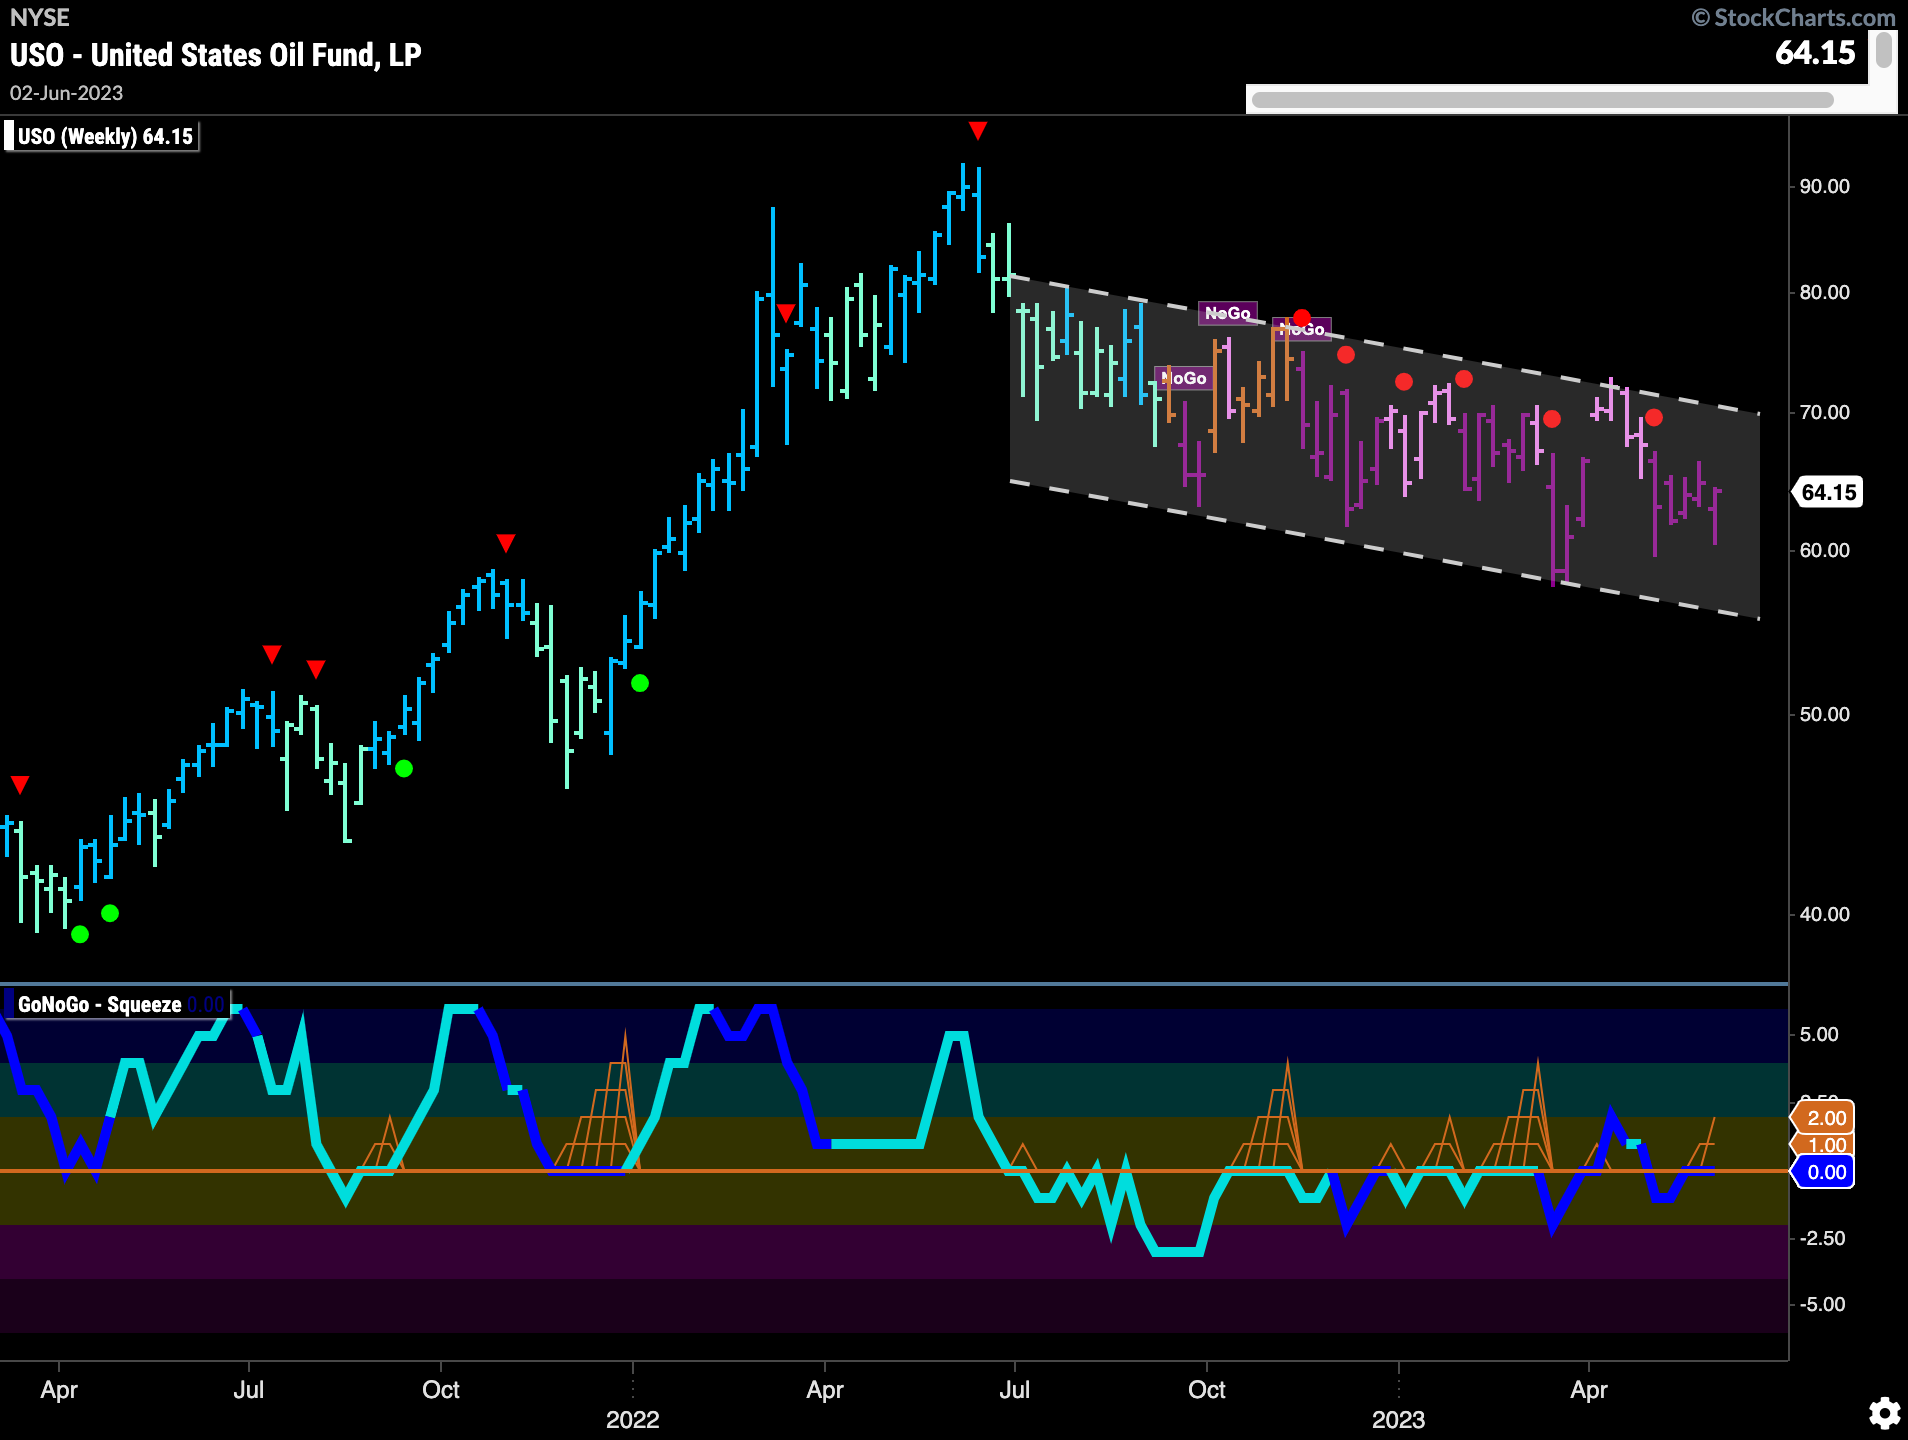
Smack dab in the middle of the downward sloping trend channel there is not too much different to report on the price movement of oil. Strong purple bars tell us that the “NoGo” trend is very much in place. GoNoGo Oscillator has been struggling to move away from the zero line and it is at that level once again. With little directional momentum there is not much to suggest a big move for oil any time soon.
Gold Still Lacks Lustre
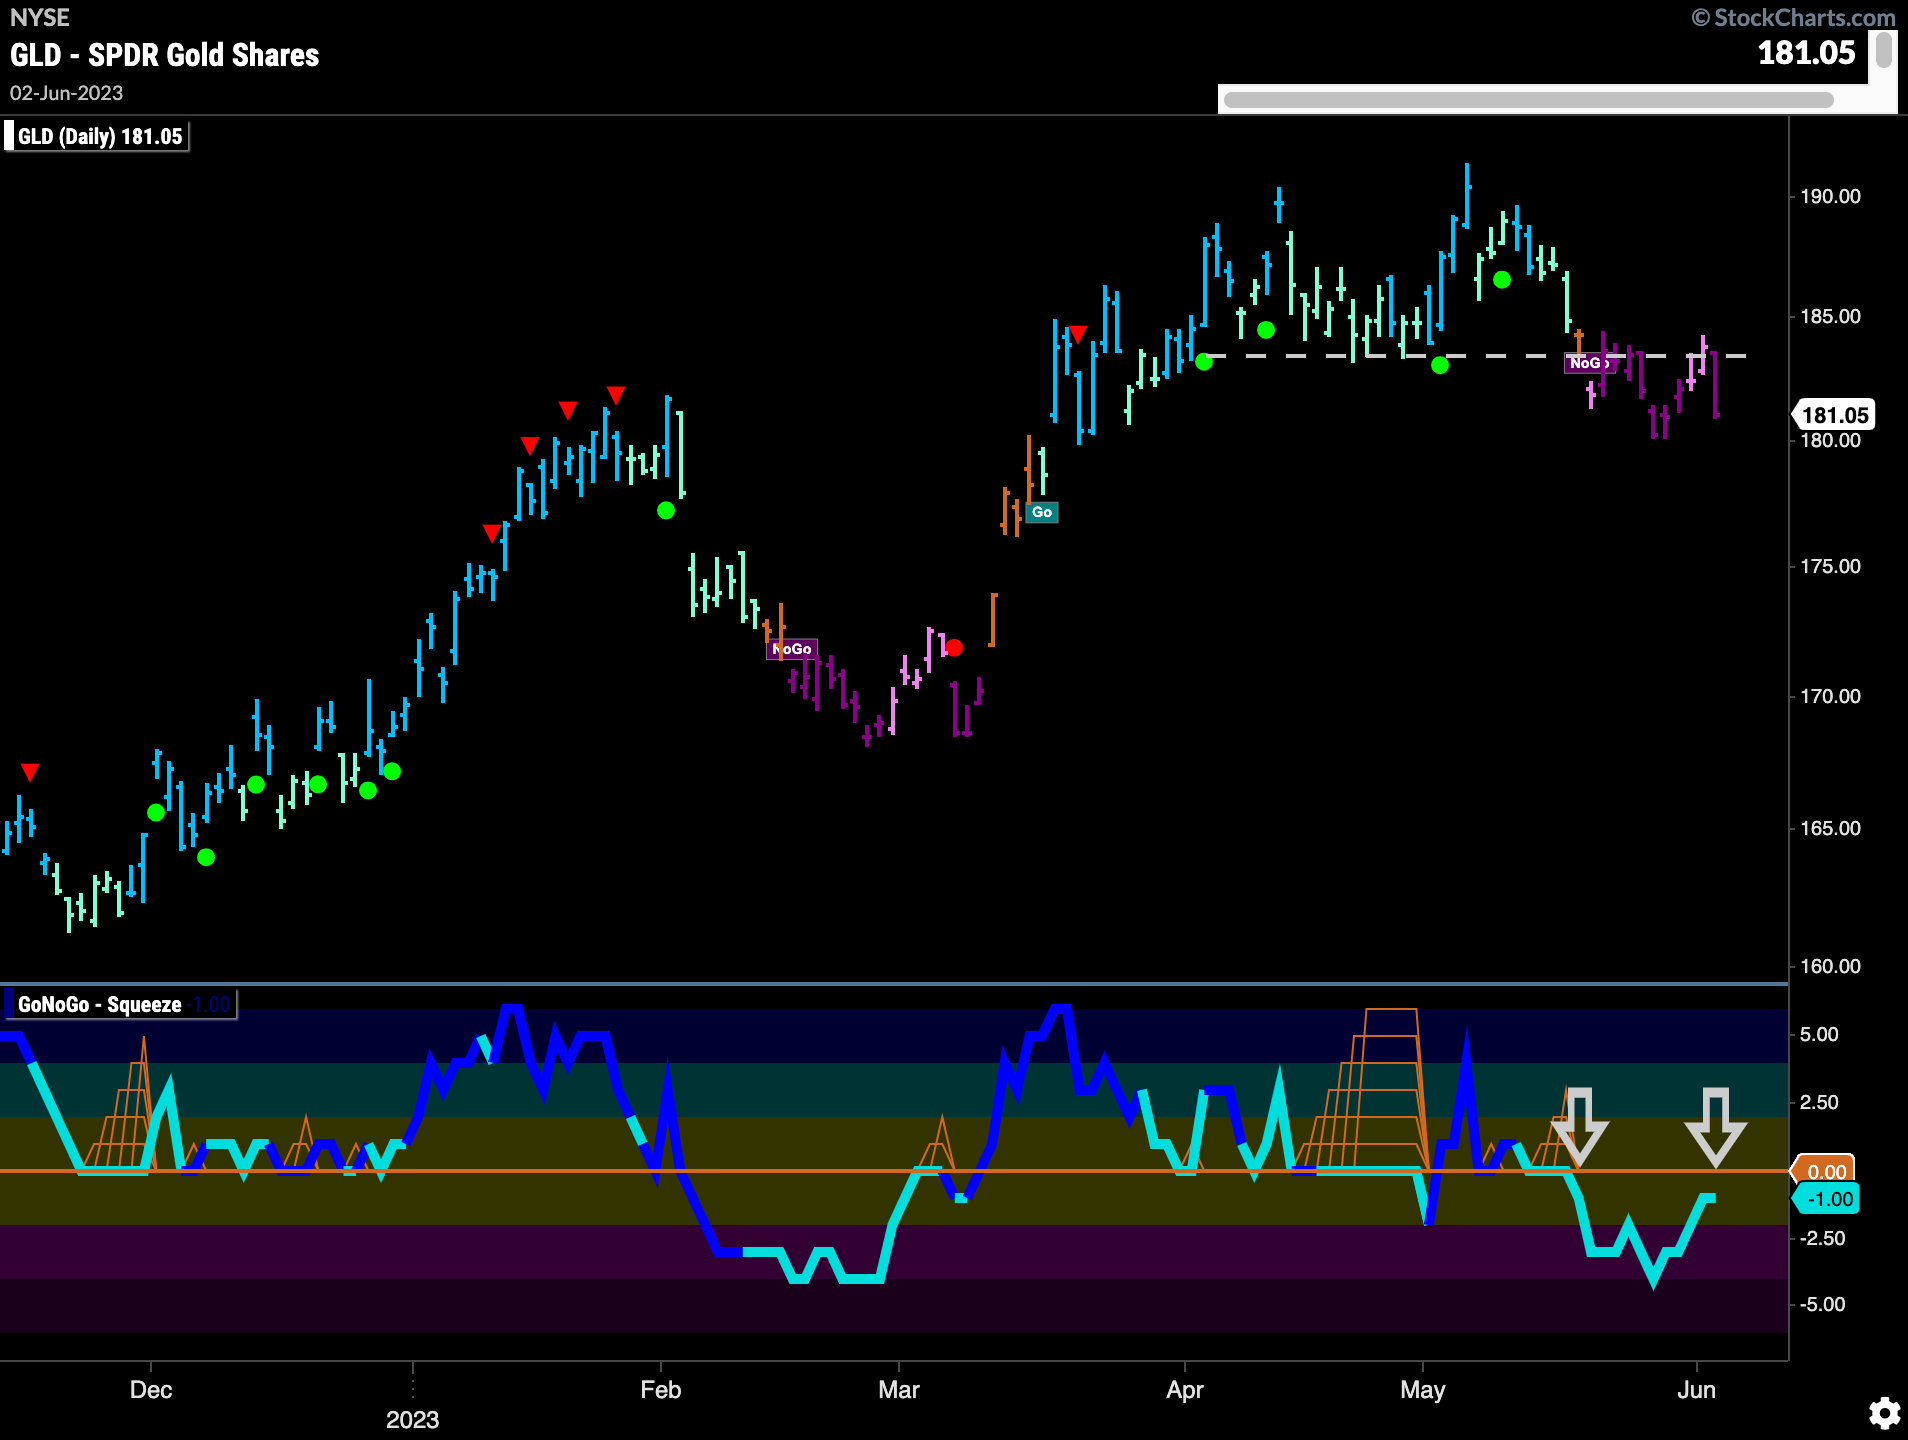
The price chart below shows that price retested a level that we expected to be resistance due to the concept of polarity. Friday saw price fall away from that level sharply and paint a strong purple “NoGo” bar. GoNoGo Oscillator is rising close to the zero line and we will watch to see if it gets rejected by that level again.
Sector RelMap
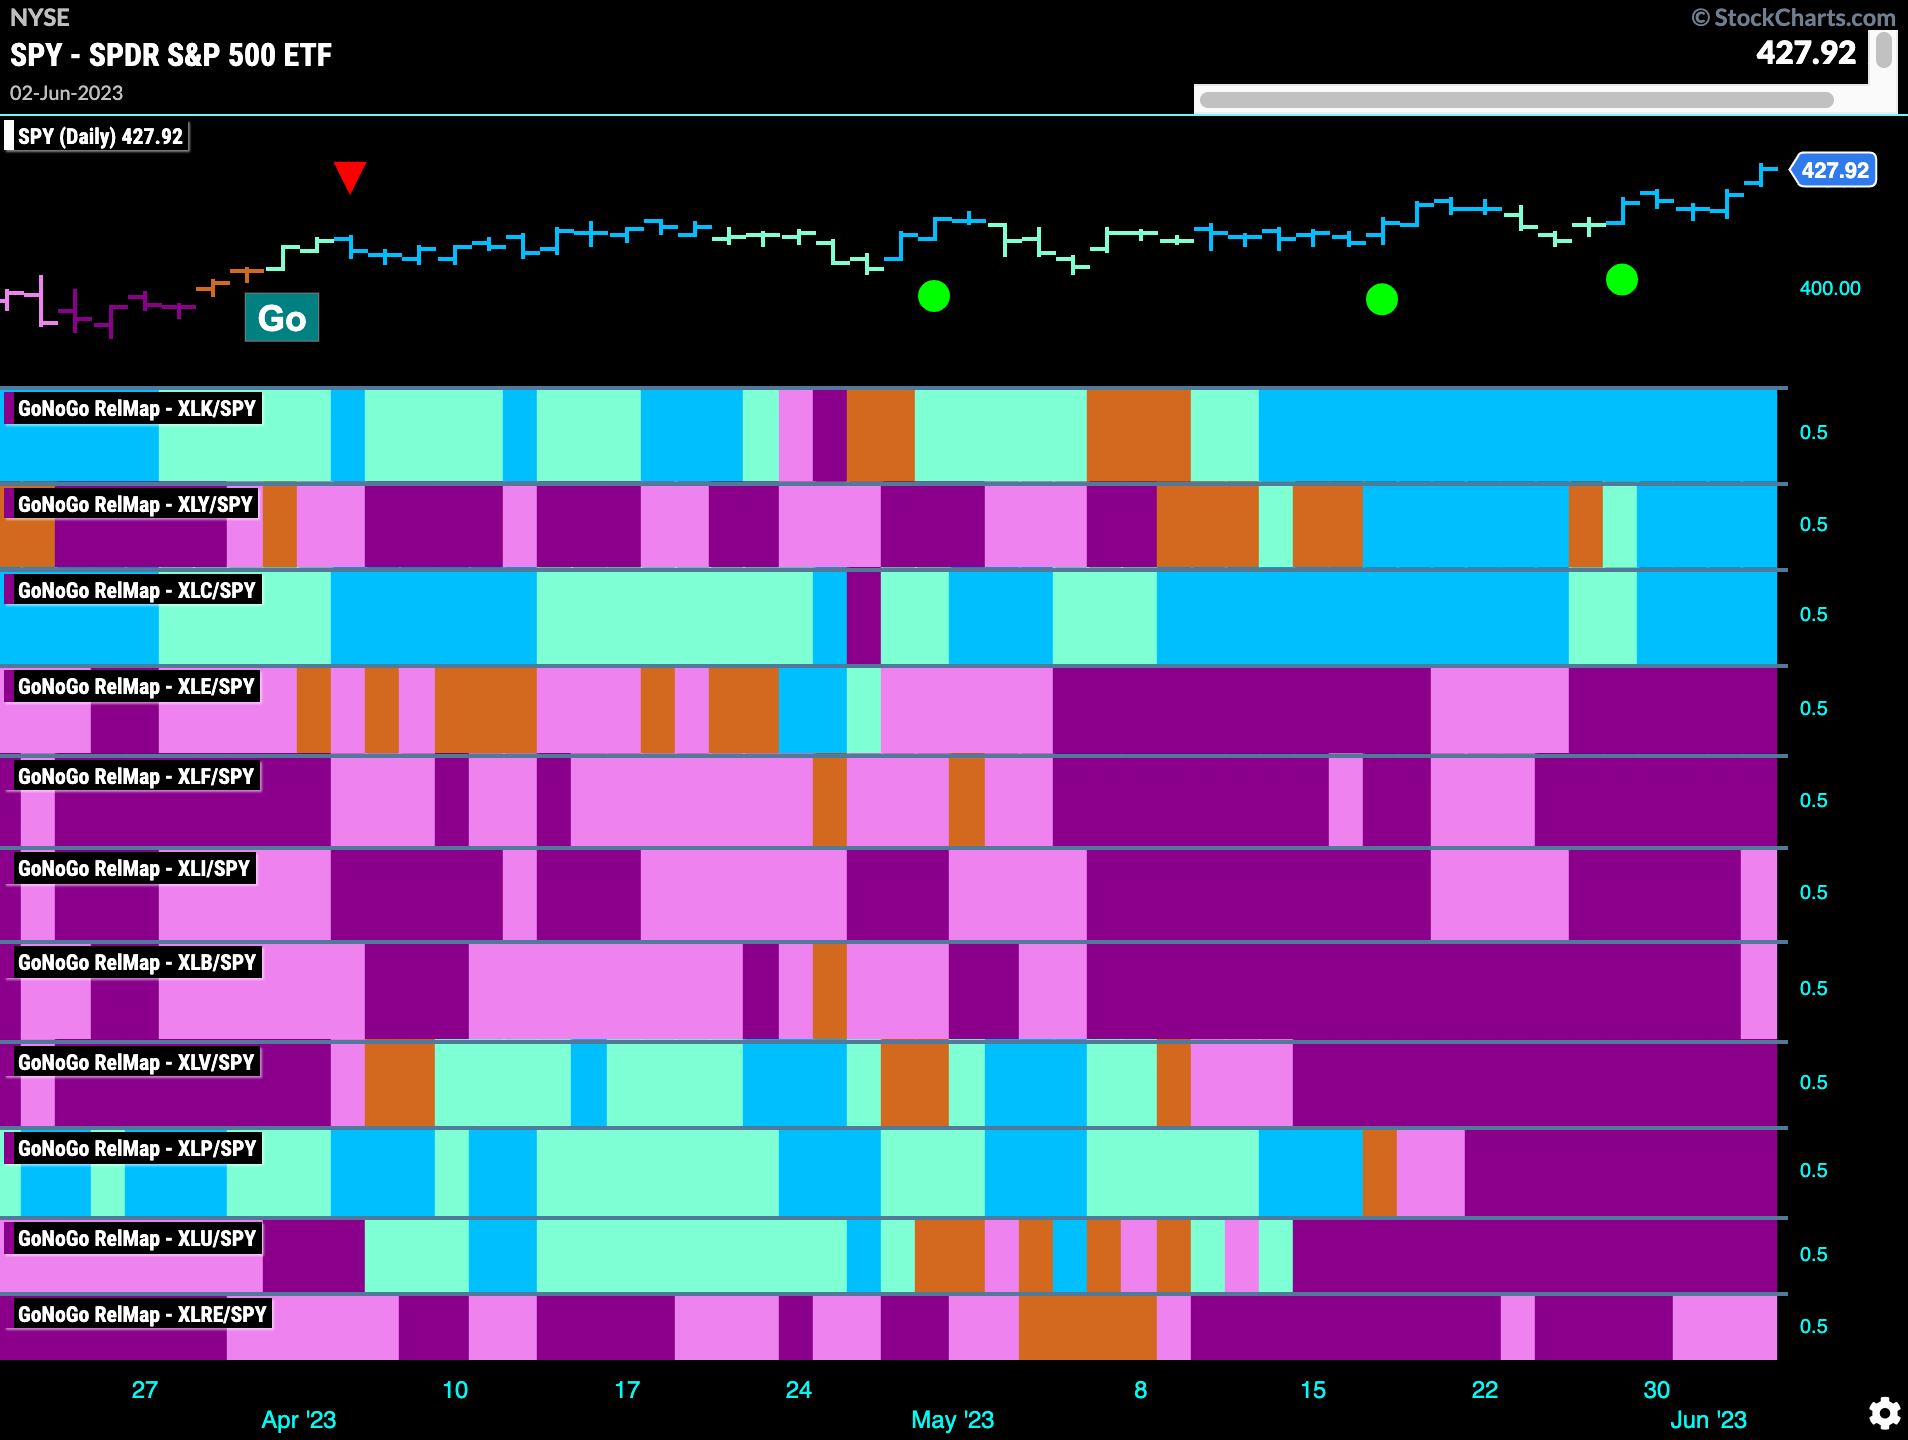
Below is the GoNoGo Sector RelMap. This GoNoGo RelMap applies the GoNoGo Trend to the relative strength ratios of the sectors to the base index. Looking at this map, we can quickly see where the relative outperformance is coming from as well as which sectors are lagging on a relative basis. 3 sectors are outperforming the base index this week. $XLK, $XLY, and $XLC are painting “Go” bars.
$GOOG to Move Higher?
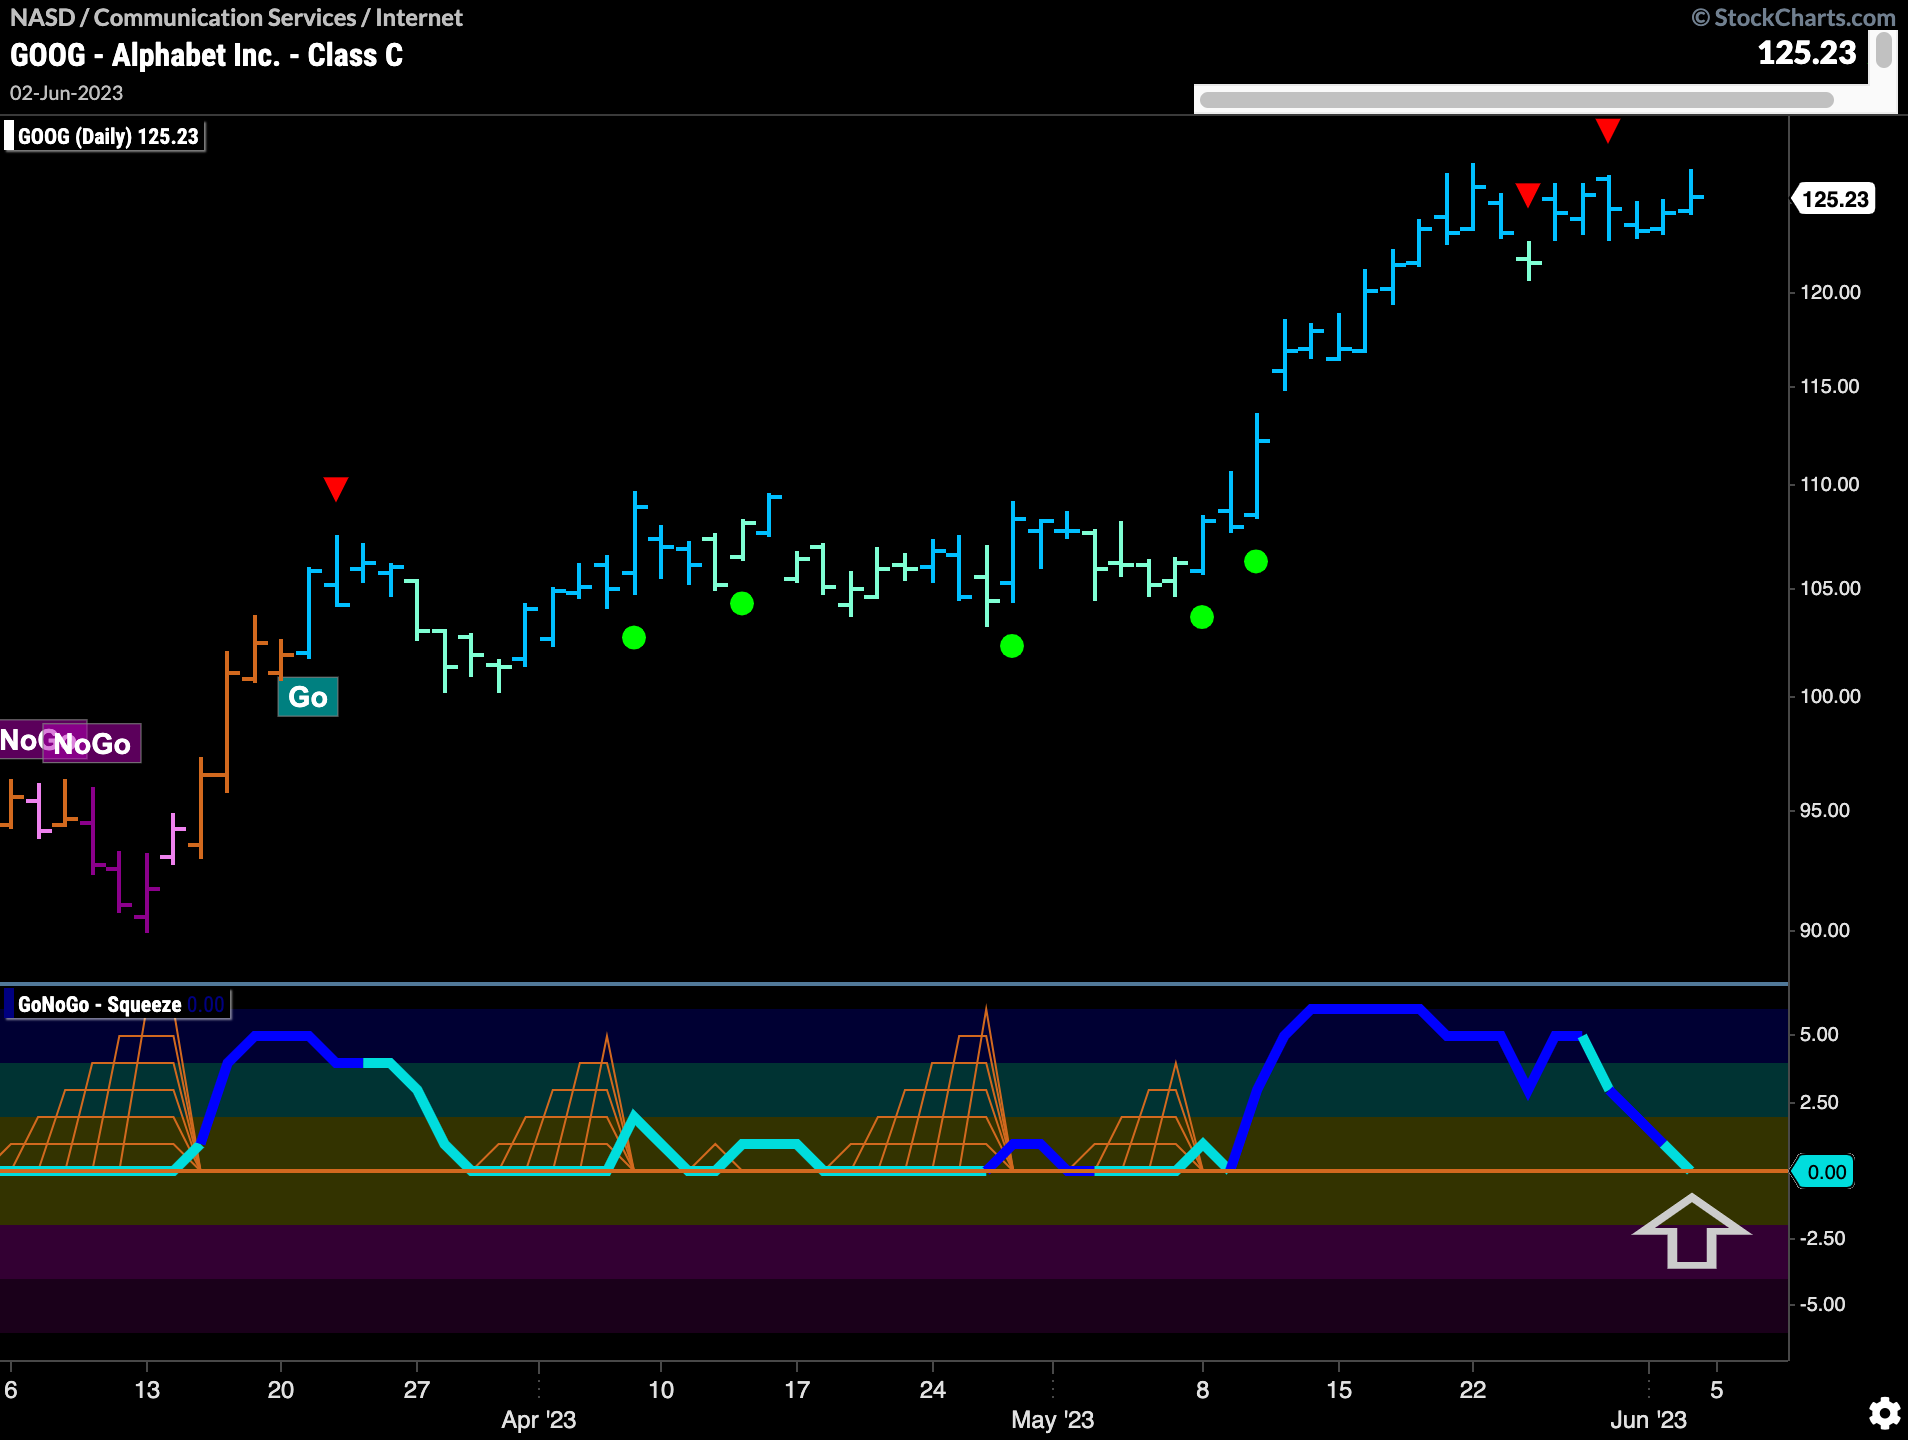
We know from last week’s note that within the outperforming communications sector the internet index is a leader. The chart below of $GOOG shows that price maybe setting up for an attack on a higher high. Having consolidated the recent price gains, GoNoGo Oscillator is testing the zero line from above. We will look for support here and signs of trend continuation (green circle) which would let us know that momentum is resurgent in the direction of the “Go” trend.
$TSLA Powering Up?
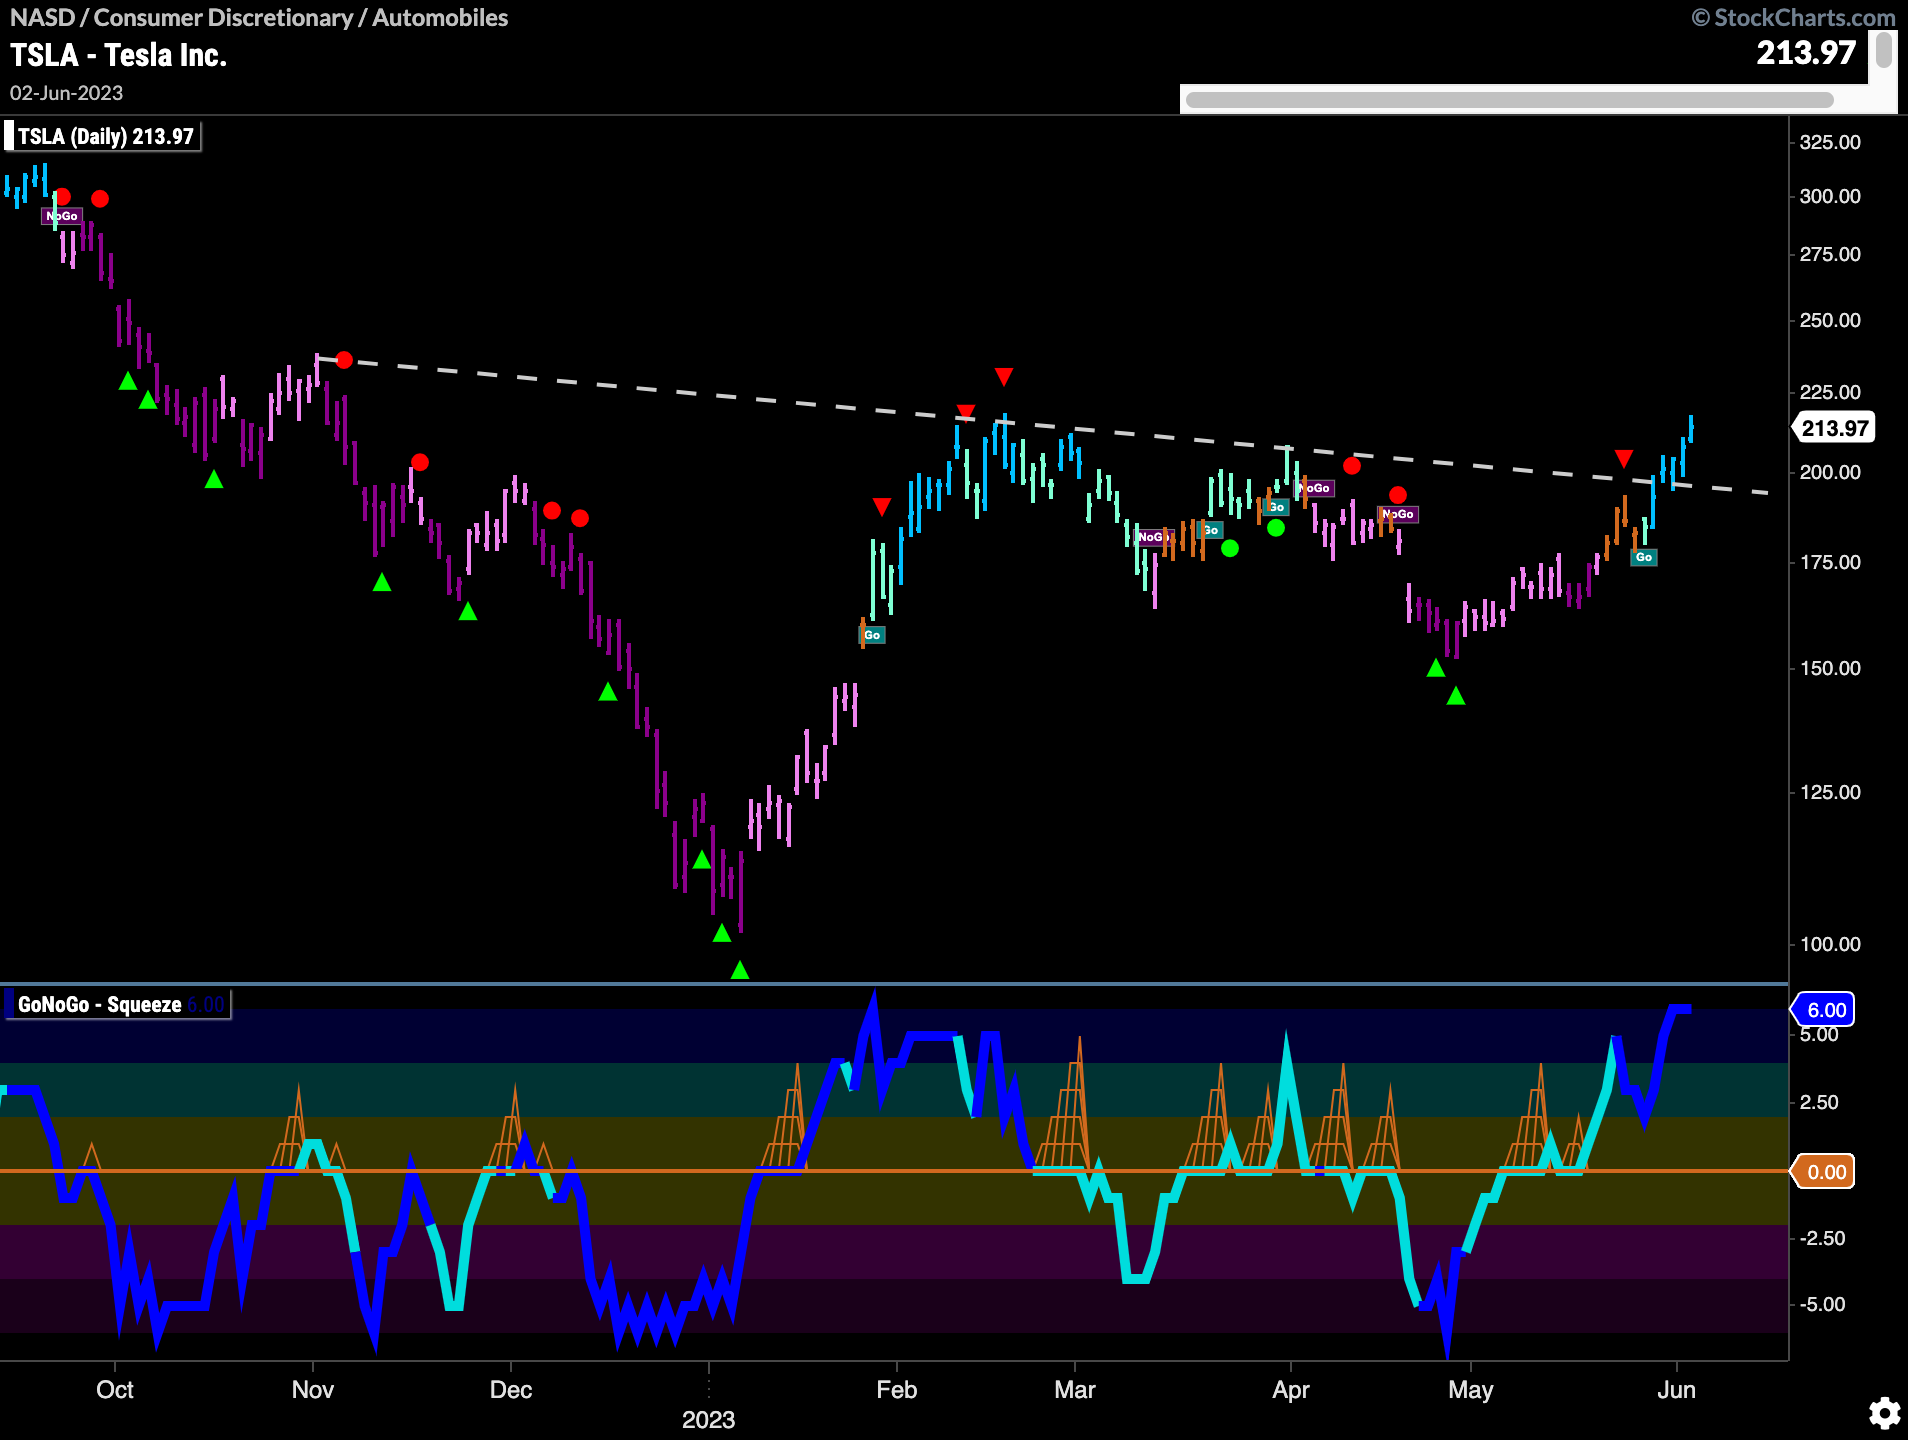
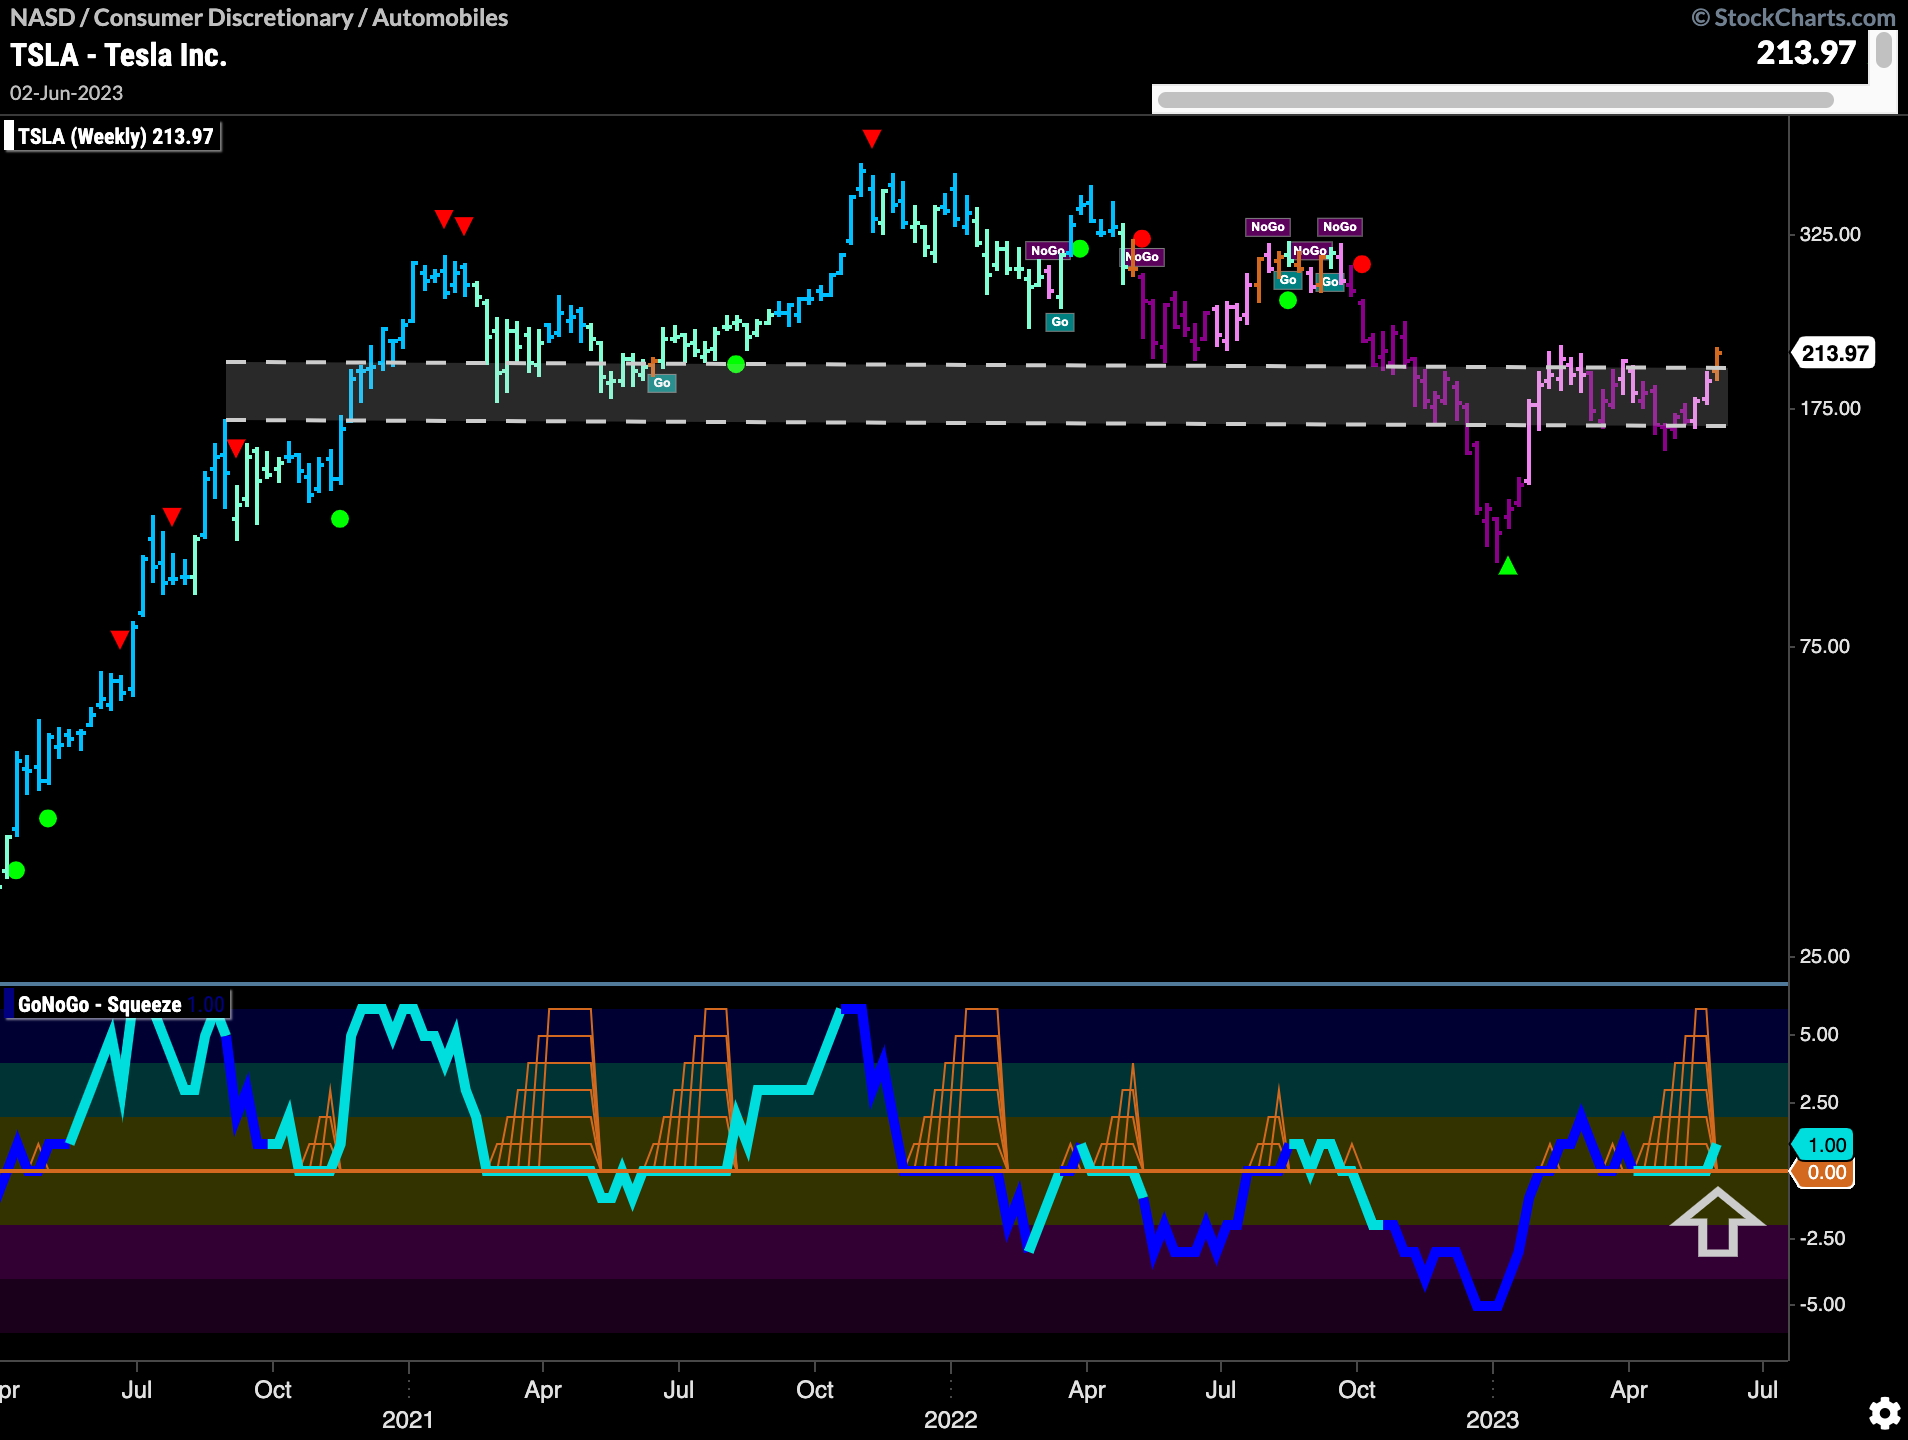
The discretionary sector is another growth sector leading the S&P higher. $TSLA has struggled to make gains over the past few months without a new higher high. Not anymore, as last week saw a push in price that took it above downward sloping resistance. Having set a higher low, GoNoGo Trend is painting strong blue bars as price tries to climb and solidify a new high.
The weekly chart shows how much market participation there has been at these levels. There has been a lot of congestion for price to get through as we can see below. This time, as price rises to the top of the channel we see GoNoGo Trend paint an amber “Go Fish” bar as the “NoGo” releases is grip for now. Also, encouragingly, GoNoGo Oscillator is breaking out of a Max GoNoGo Squeeze into positive territory. This suggests there is some positive momentum that could support higher prices.
$MSTR Represents Possible Early Opportunity
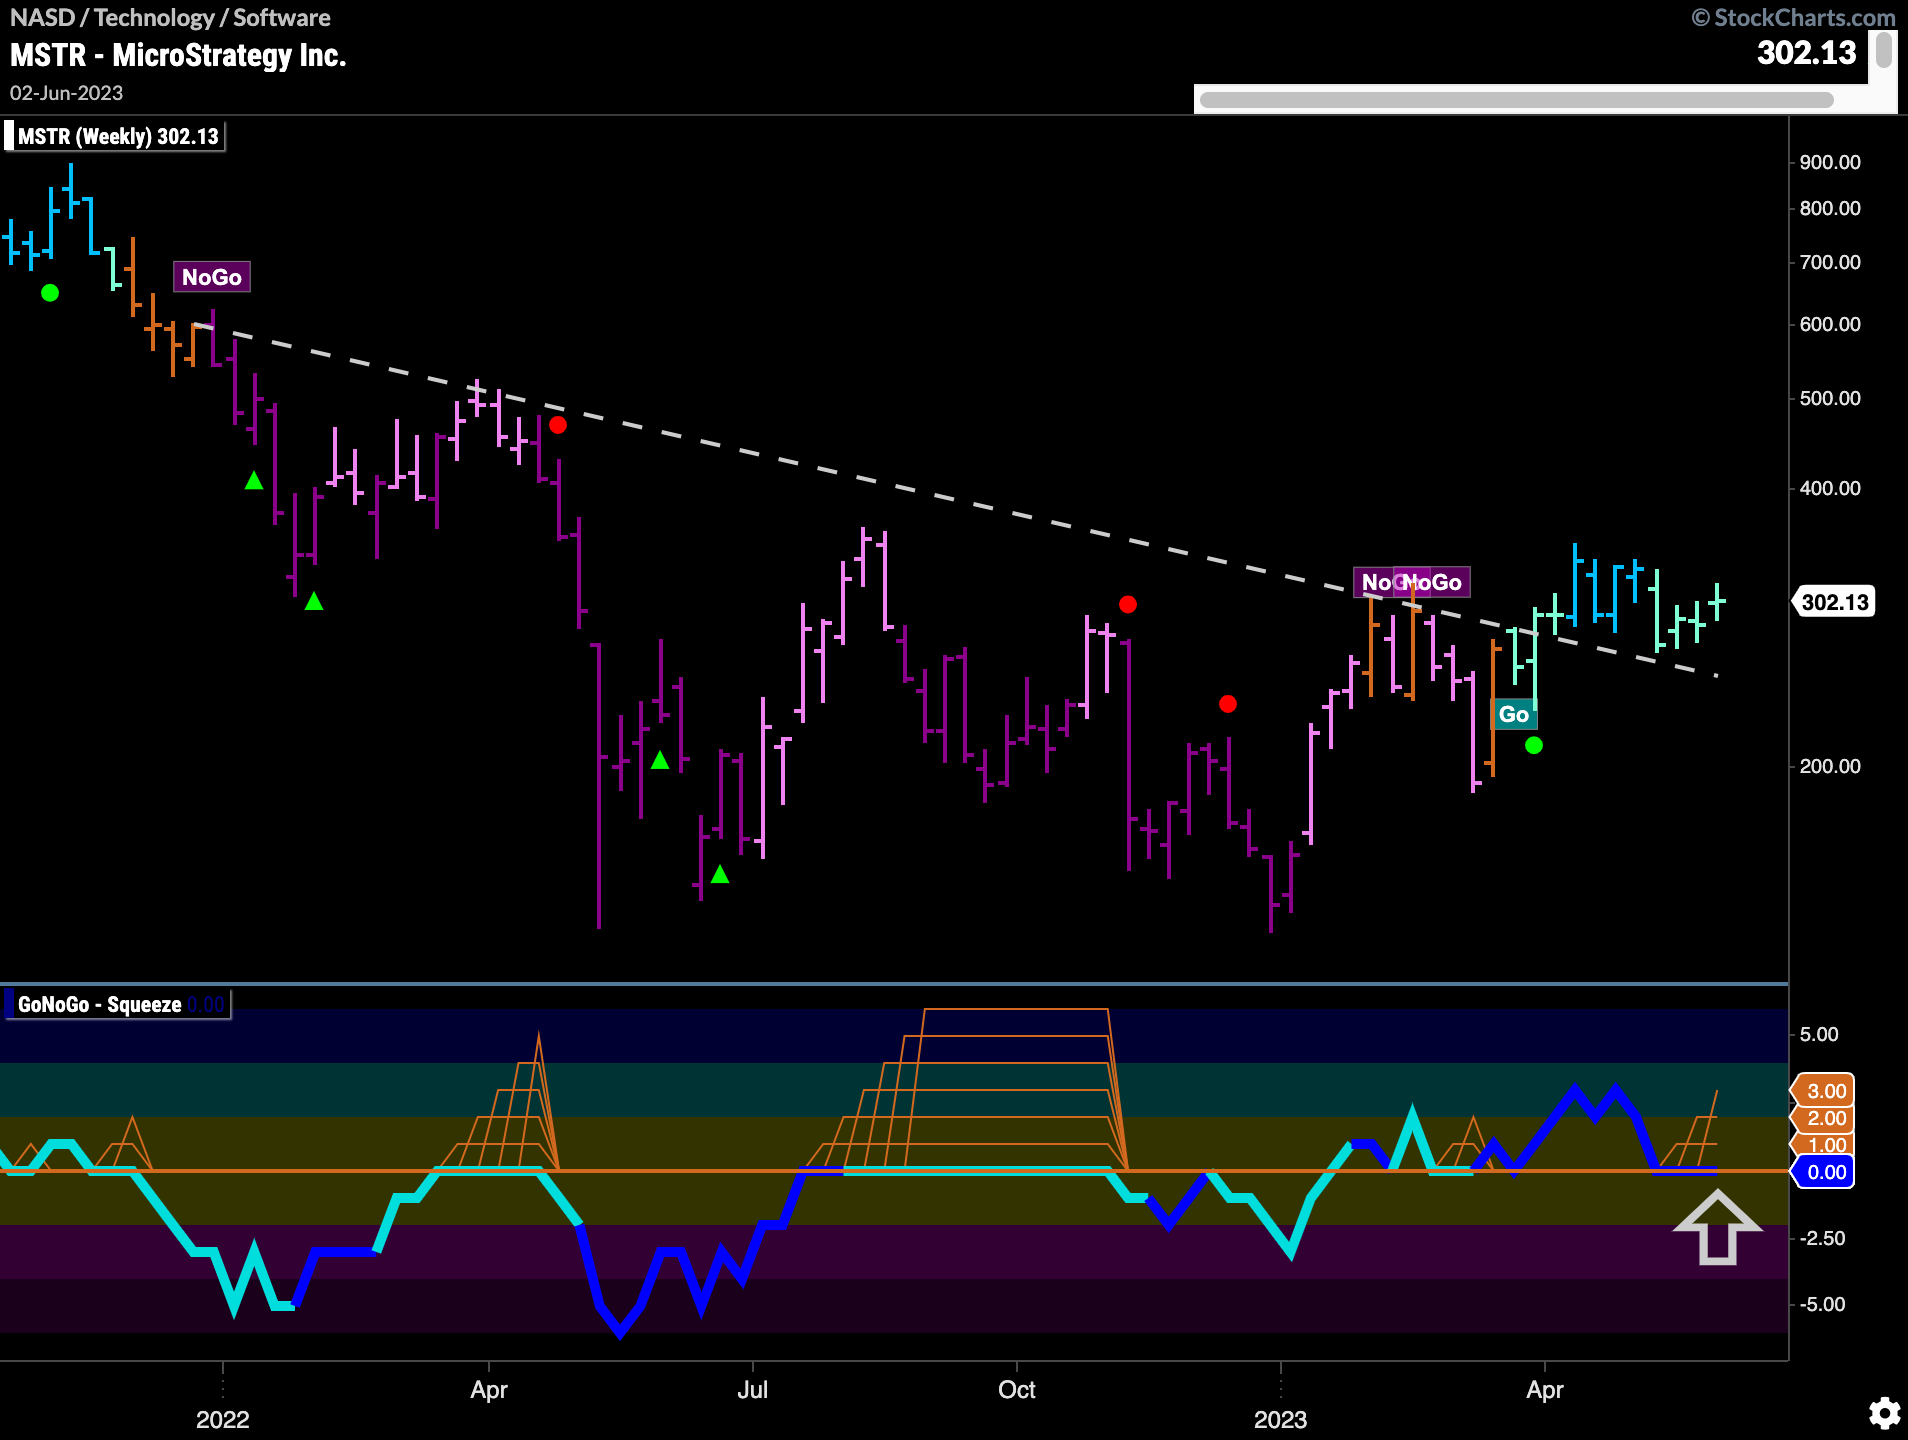
The technology sector is leading the market and so we can look around to see if there are any securities poised to play catch up. $MSTR has not seen the higher highs that many companies within the sector have see. But, GoNoGo Trend painted two weaker aqua bars to end last week. We turn our eye to the GoNoGo Oscillator and see that it is in a Max GoNoGo Squeeze. We will watch to see if the oscillator can break out of the Squeeze into positive territory. This would tell us that momentum is on the side of the new “Go” trend and we would see a Go Trend Continuation Icon (green circle) under the price bar.
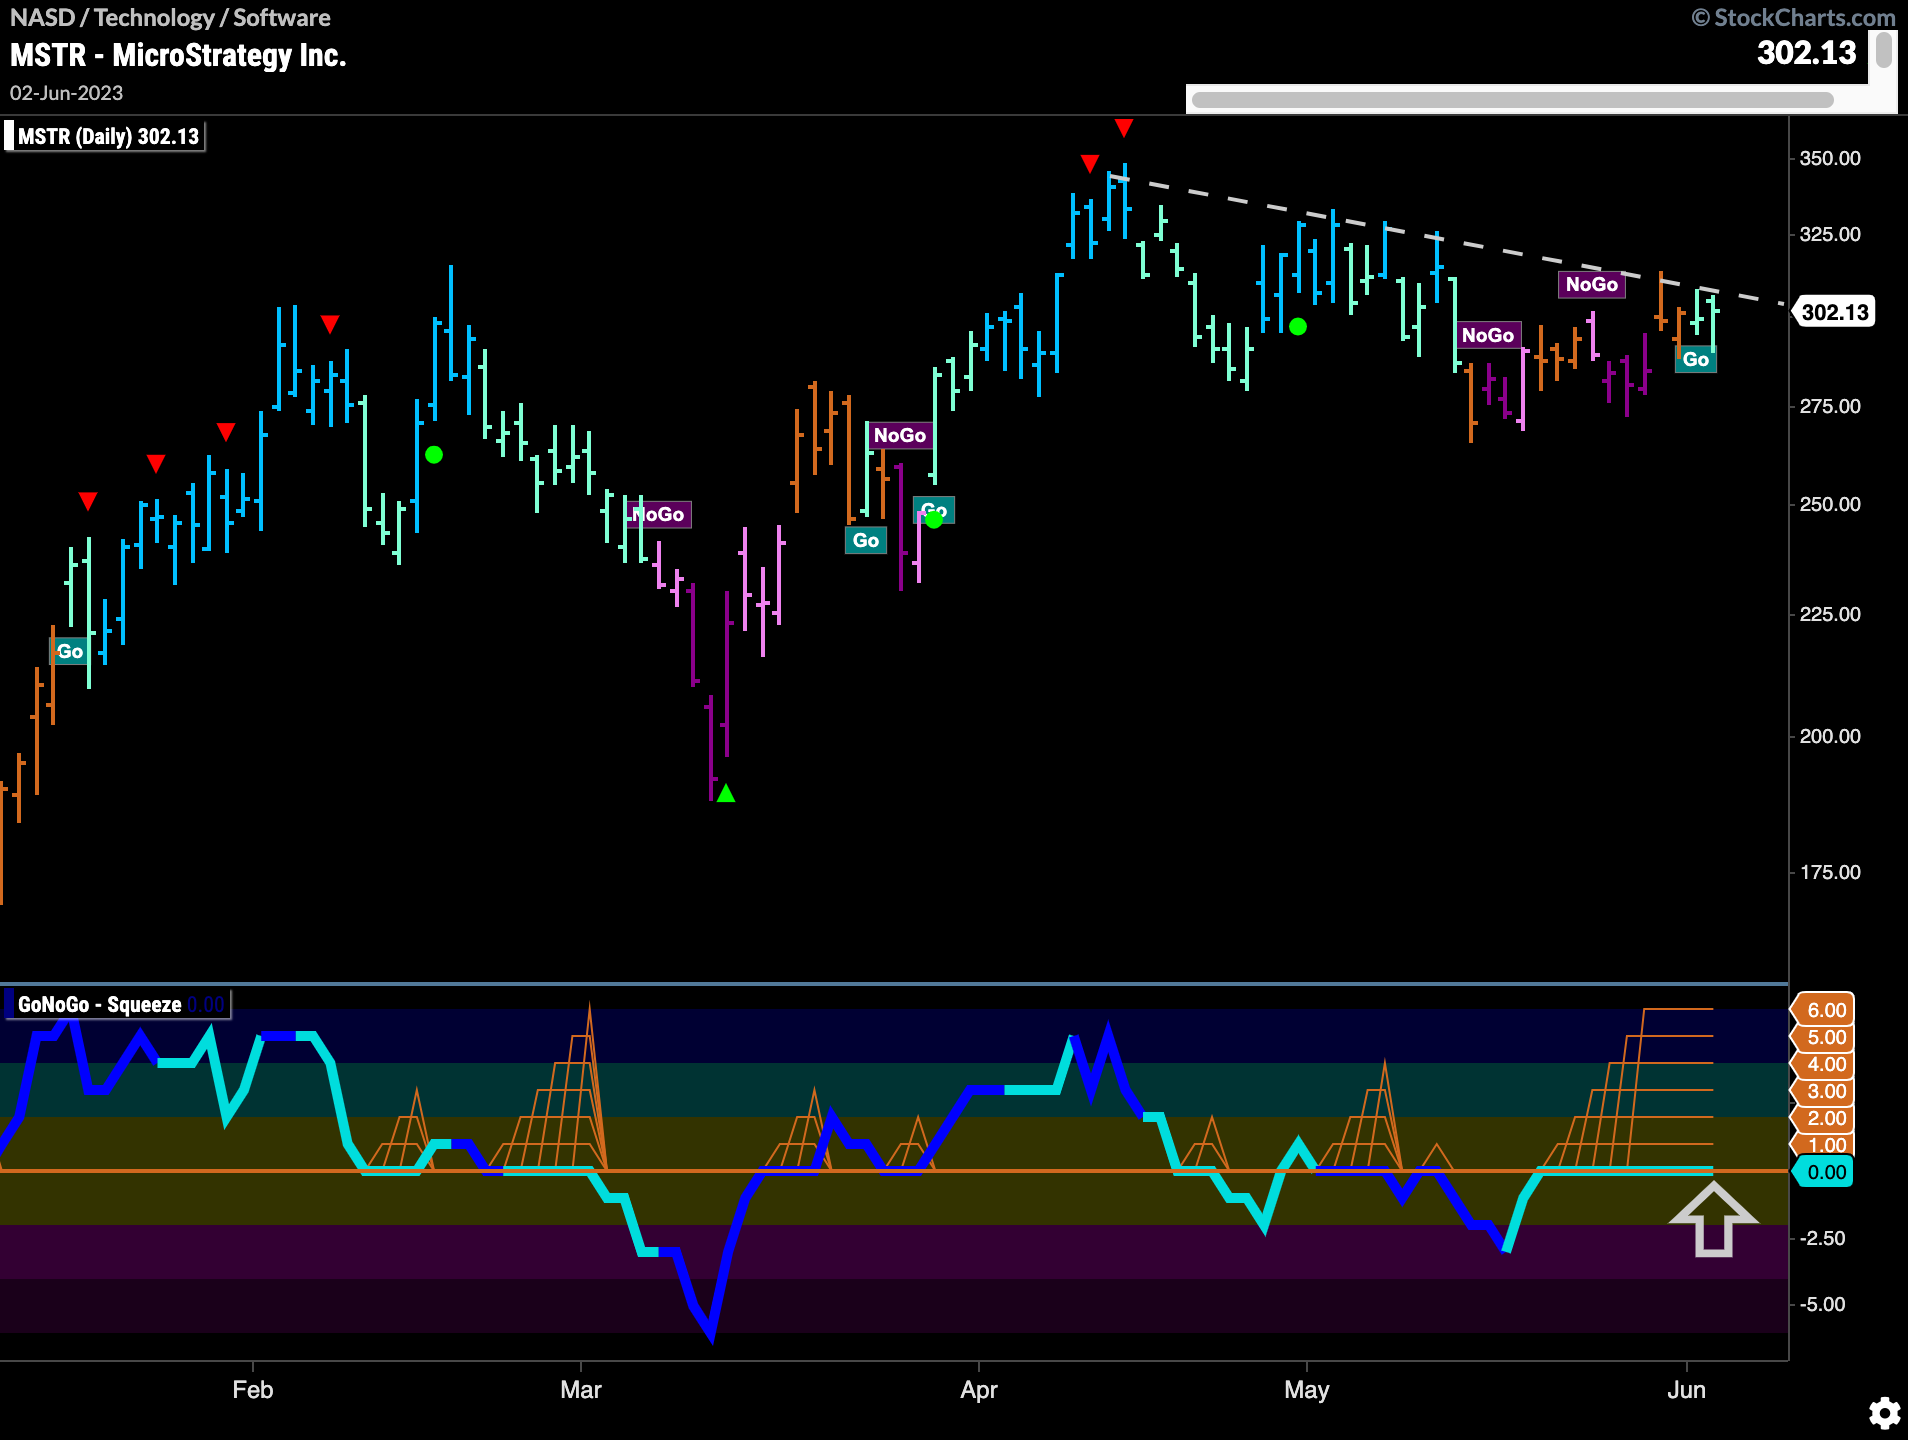
The weekly chart below shows us that this “Go” trend in price may be just beginning. Having broken above downward sloping resistance several weeks ago GoNoGo Trend began to paint “Go” bars. Price is now consolidating at these levels and GoNoGo Oscillator is back testing the zero level and volume is heavy. We will look for the oscillator to break back into positive territory. This could give price the push it needs to move to new highs.
