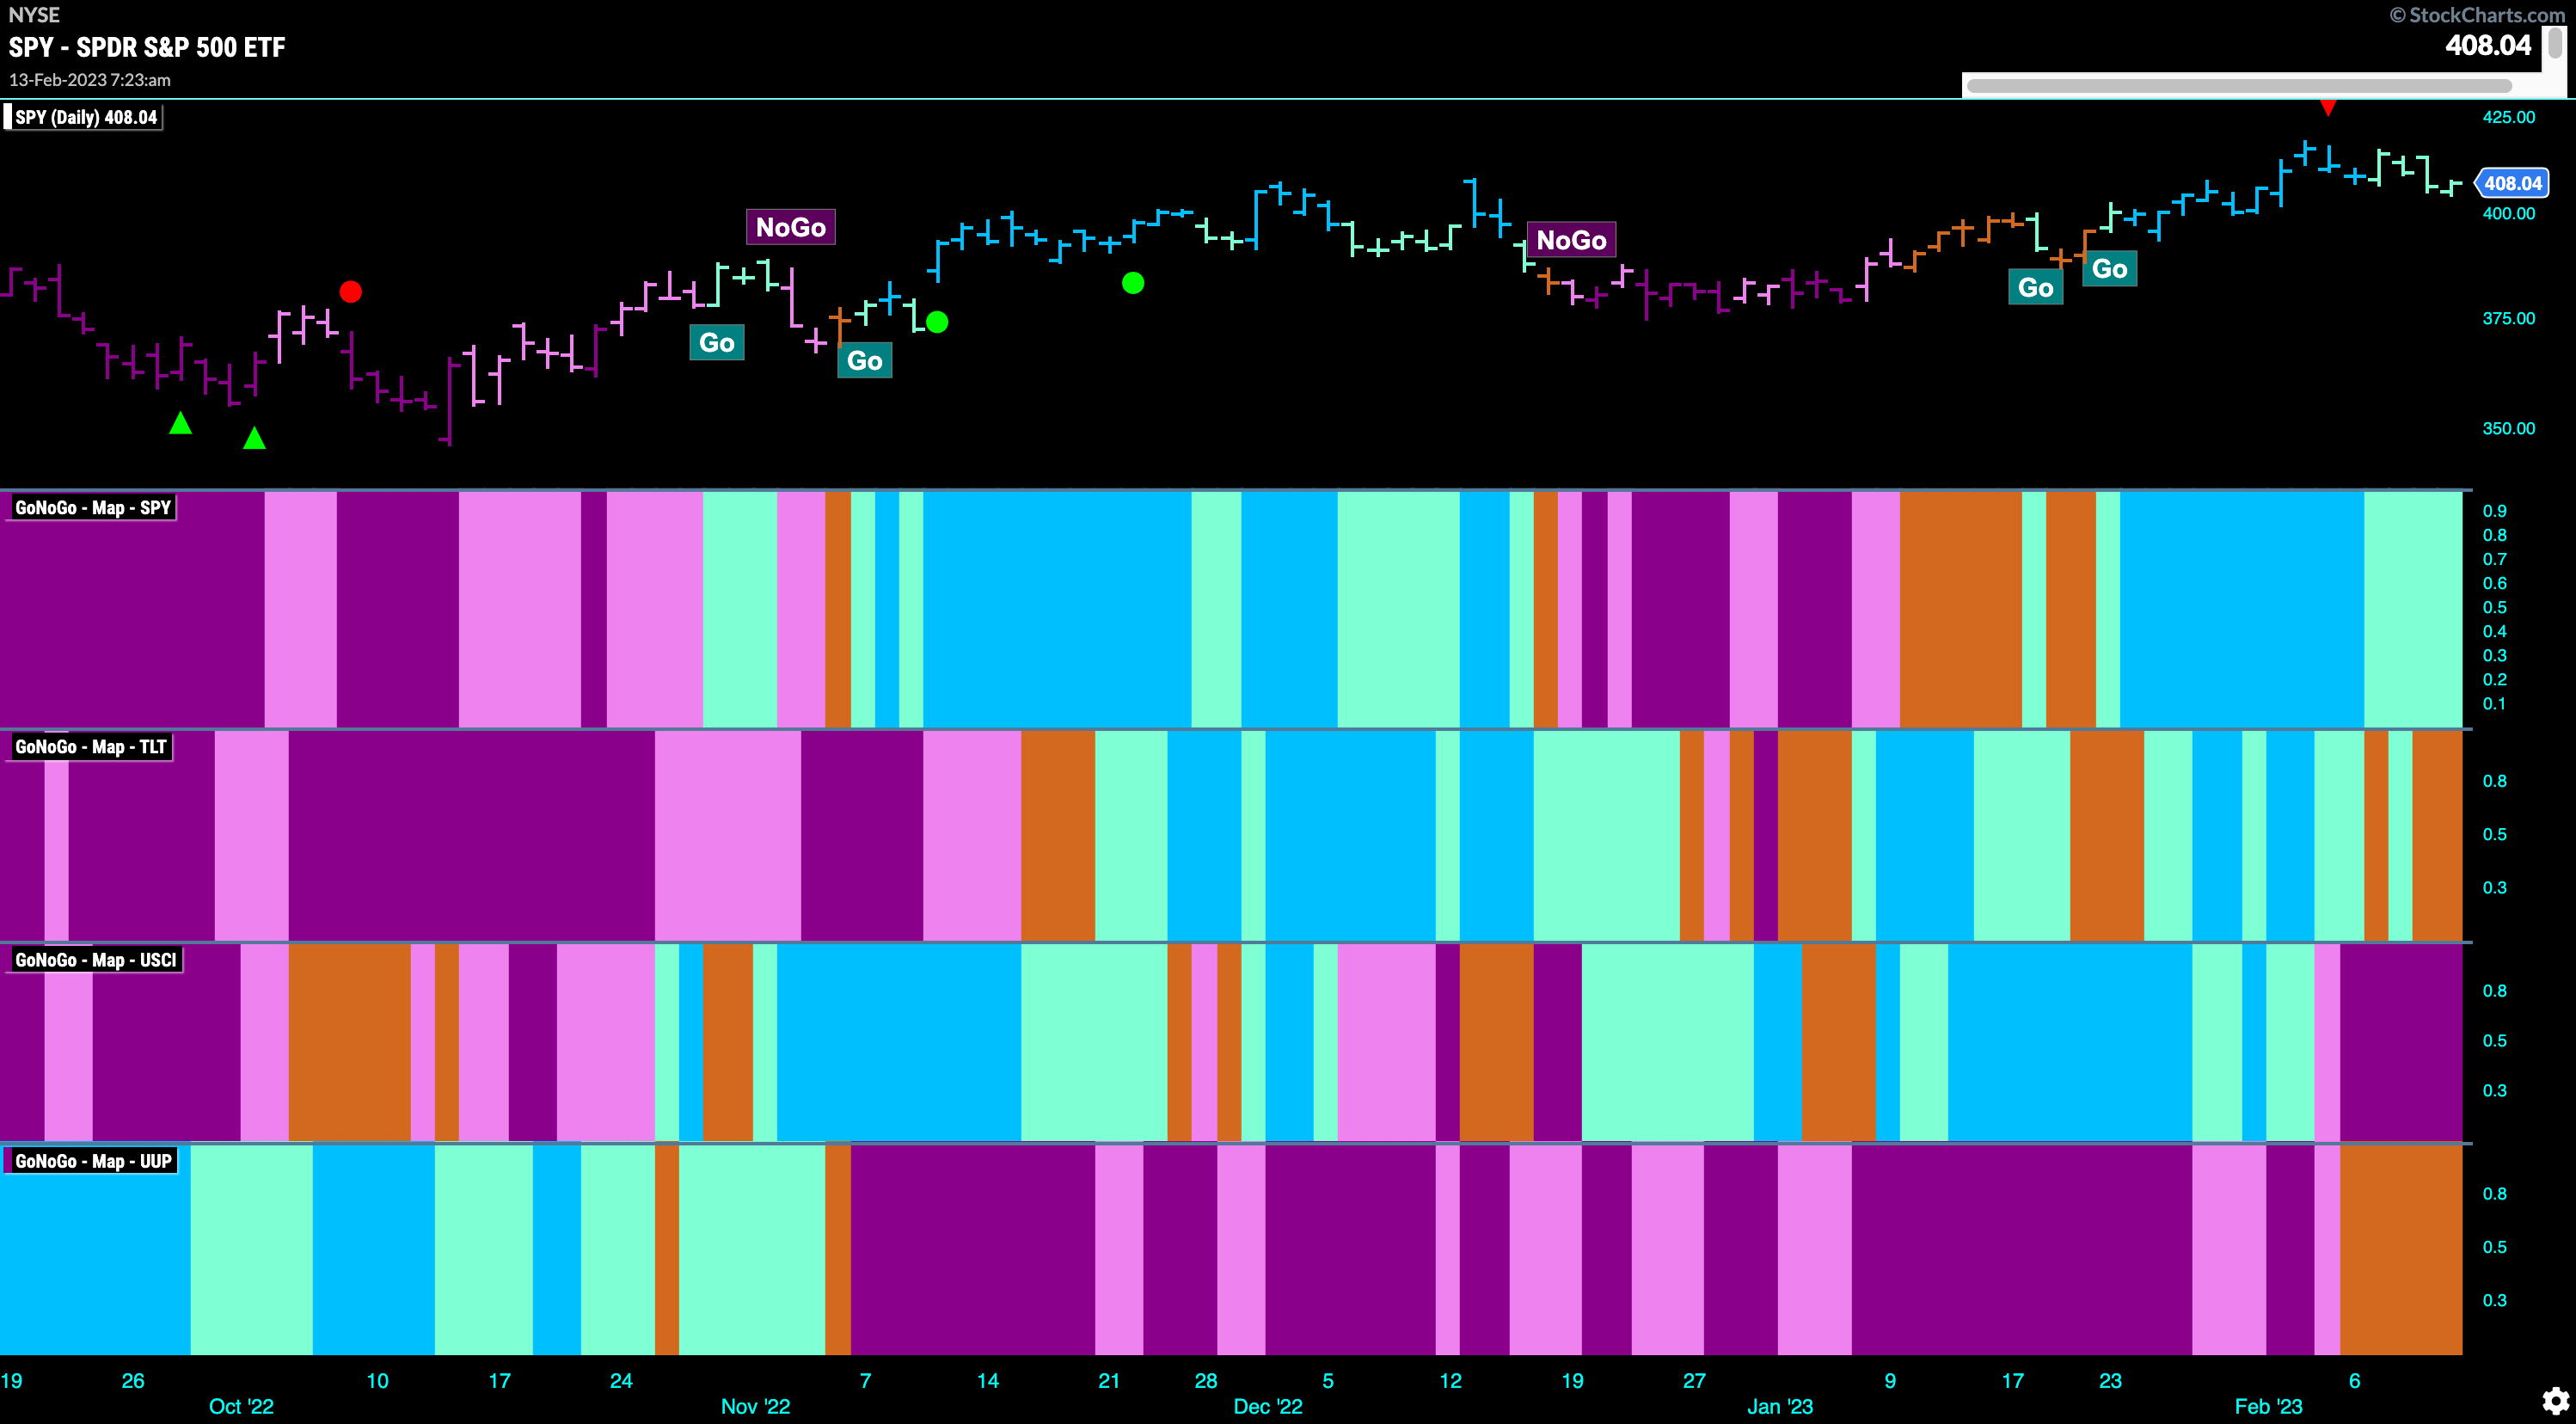
Good morning and welcome to this week’s Flight Path. Let’s take a look at the GoNoGo Asset map below. Equities were able to maintain a “Go” trend this week but we did see weakness creep in as most of the week painted paler aqua bars. Treasury bond prices faltered and ended the week with amber “Go Fish” bars. Commodities saw the “NoGo” strengthen and paint purple bars. The dollar saw a structural change as well as the “NoGo” is over for the moment as we saw a string of amber “Go Fish” bars.
Equities Come off Recent High
GoNoGo Trend the trend weakened this week as paler aqua “Go” bars dominate. This comes after we saw a Go Countertrend Correction Icon (red circle) at the recent high. This informed us that in the short term price may struggle to go higher. GoNoGo Oscillator is at the zero line after falling on heavy volume and we will watch to see if this level holds as support as it should if this “Go” trend is to persist. 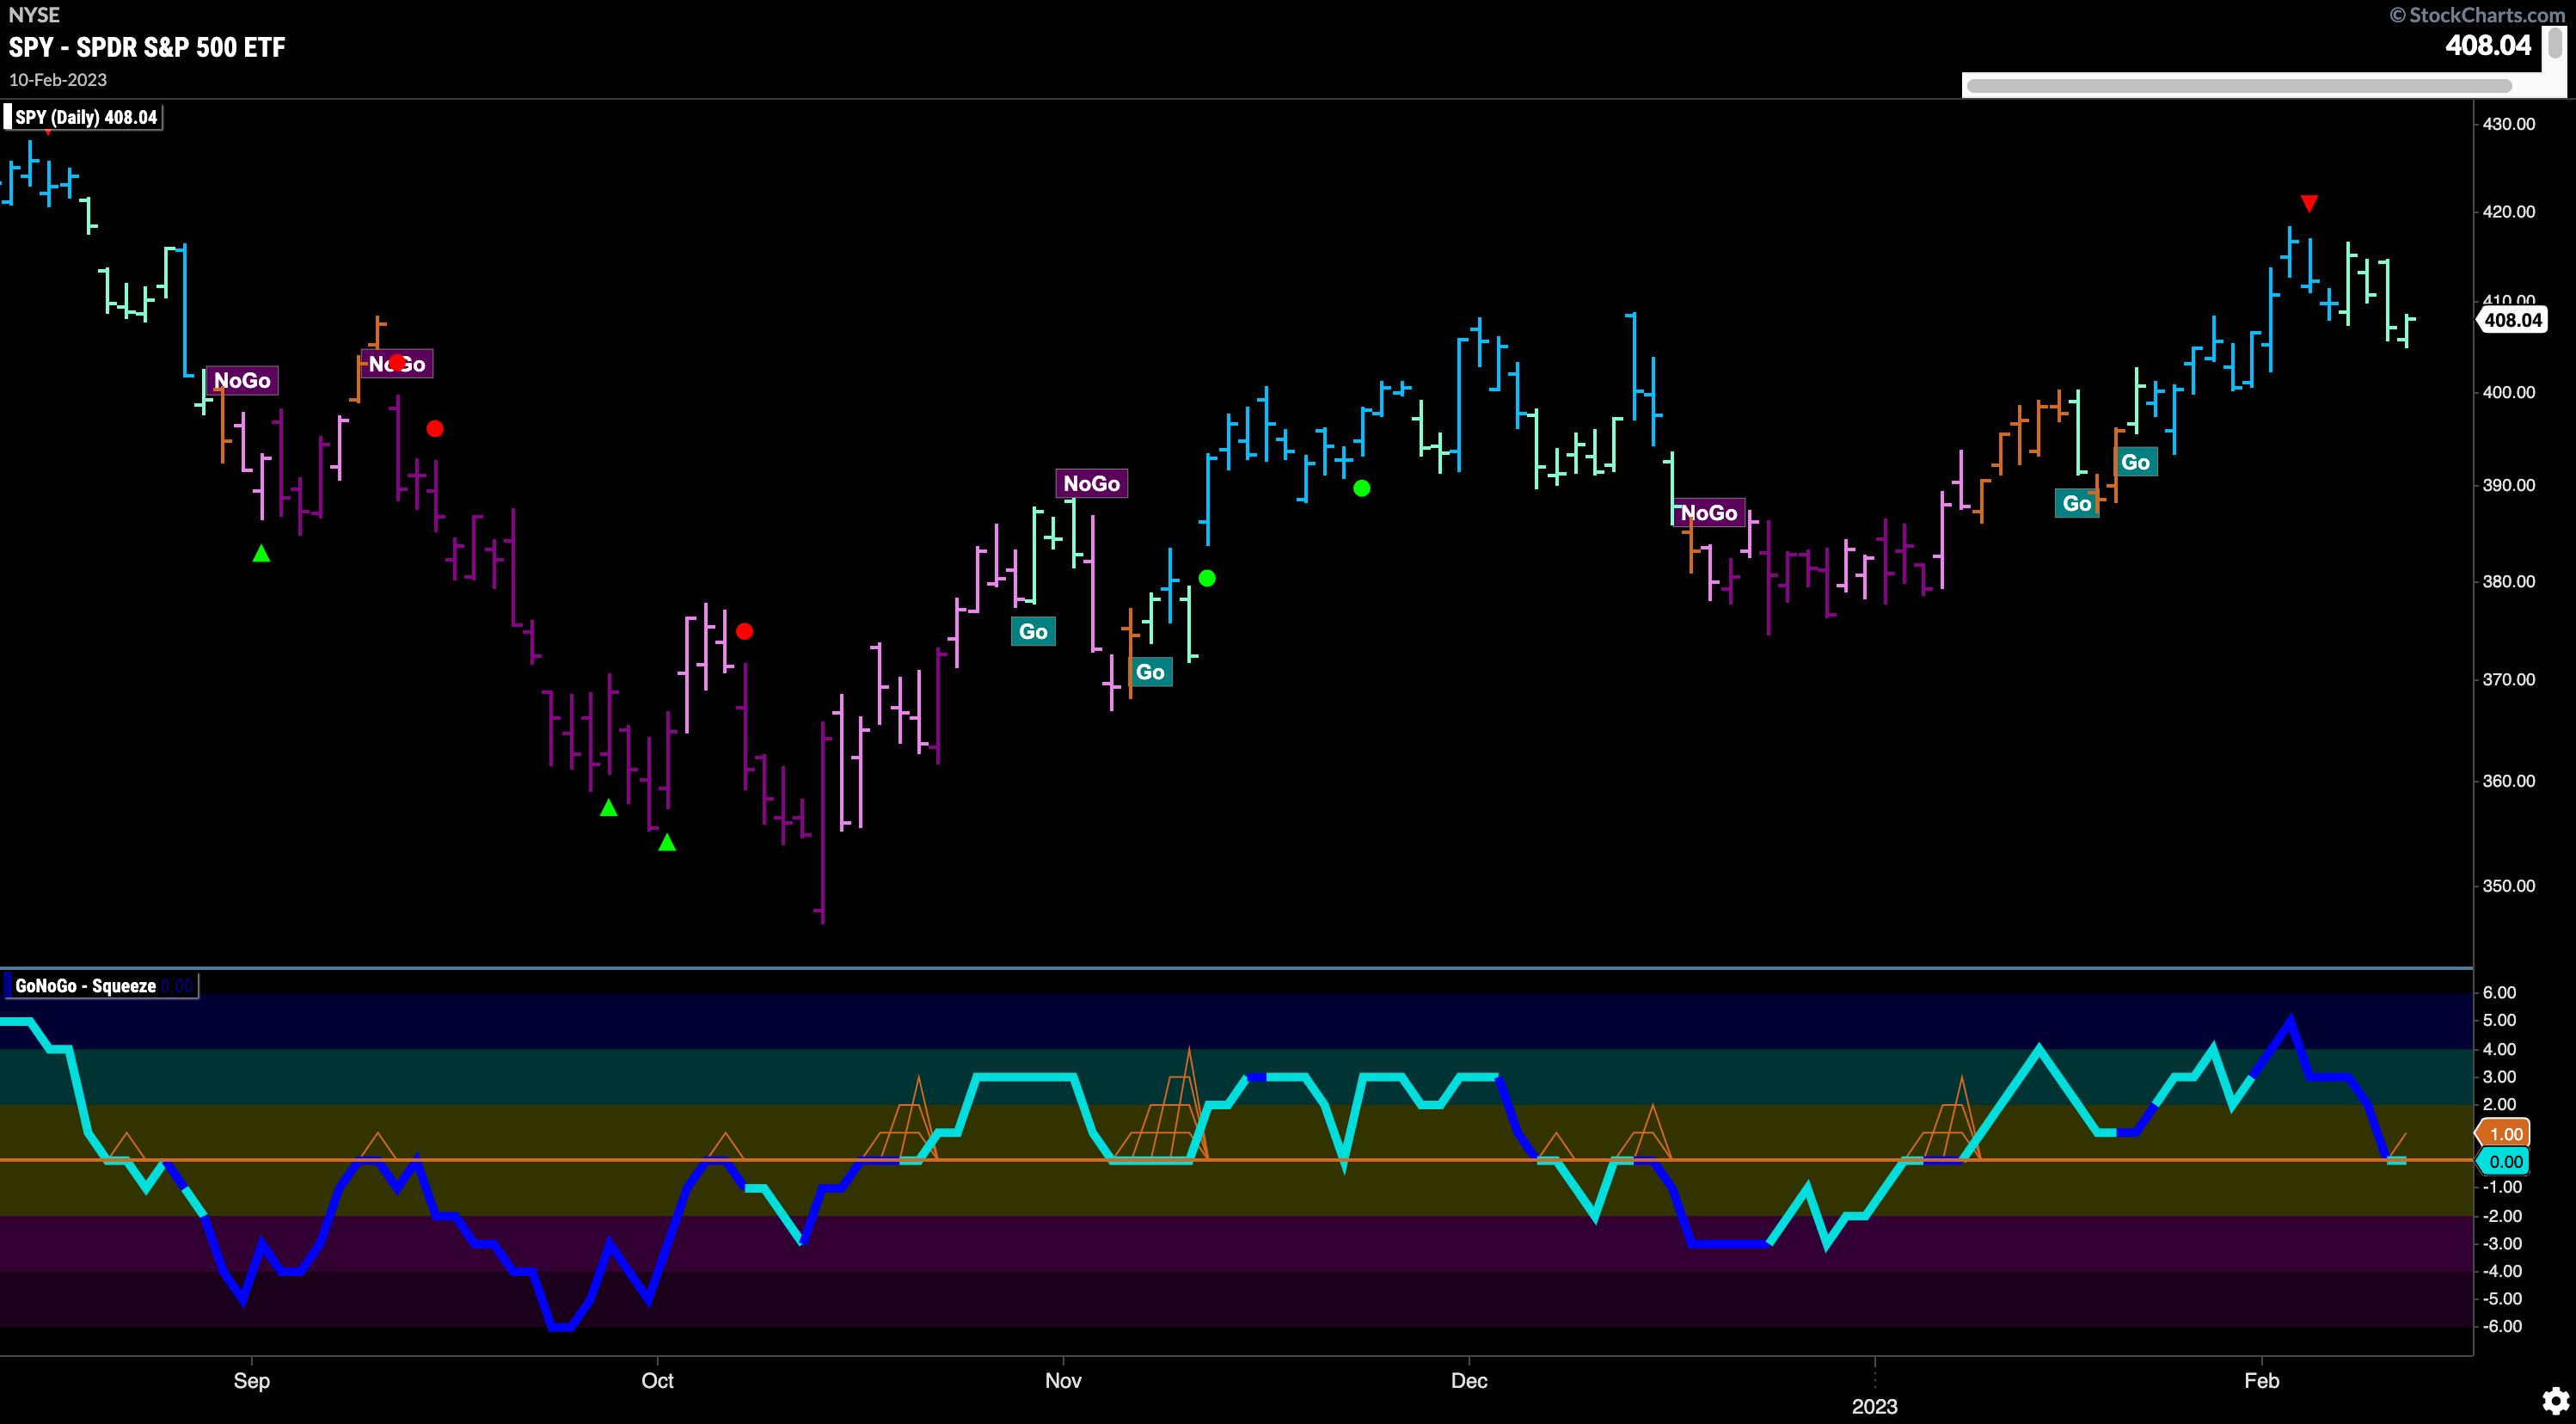
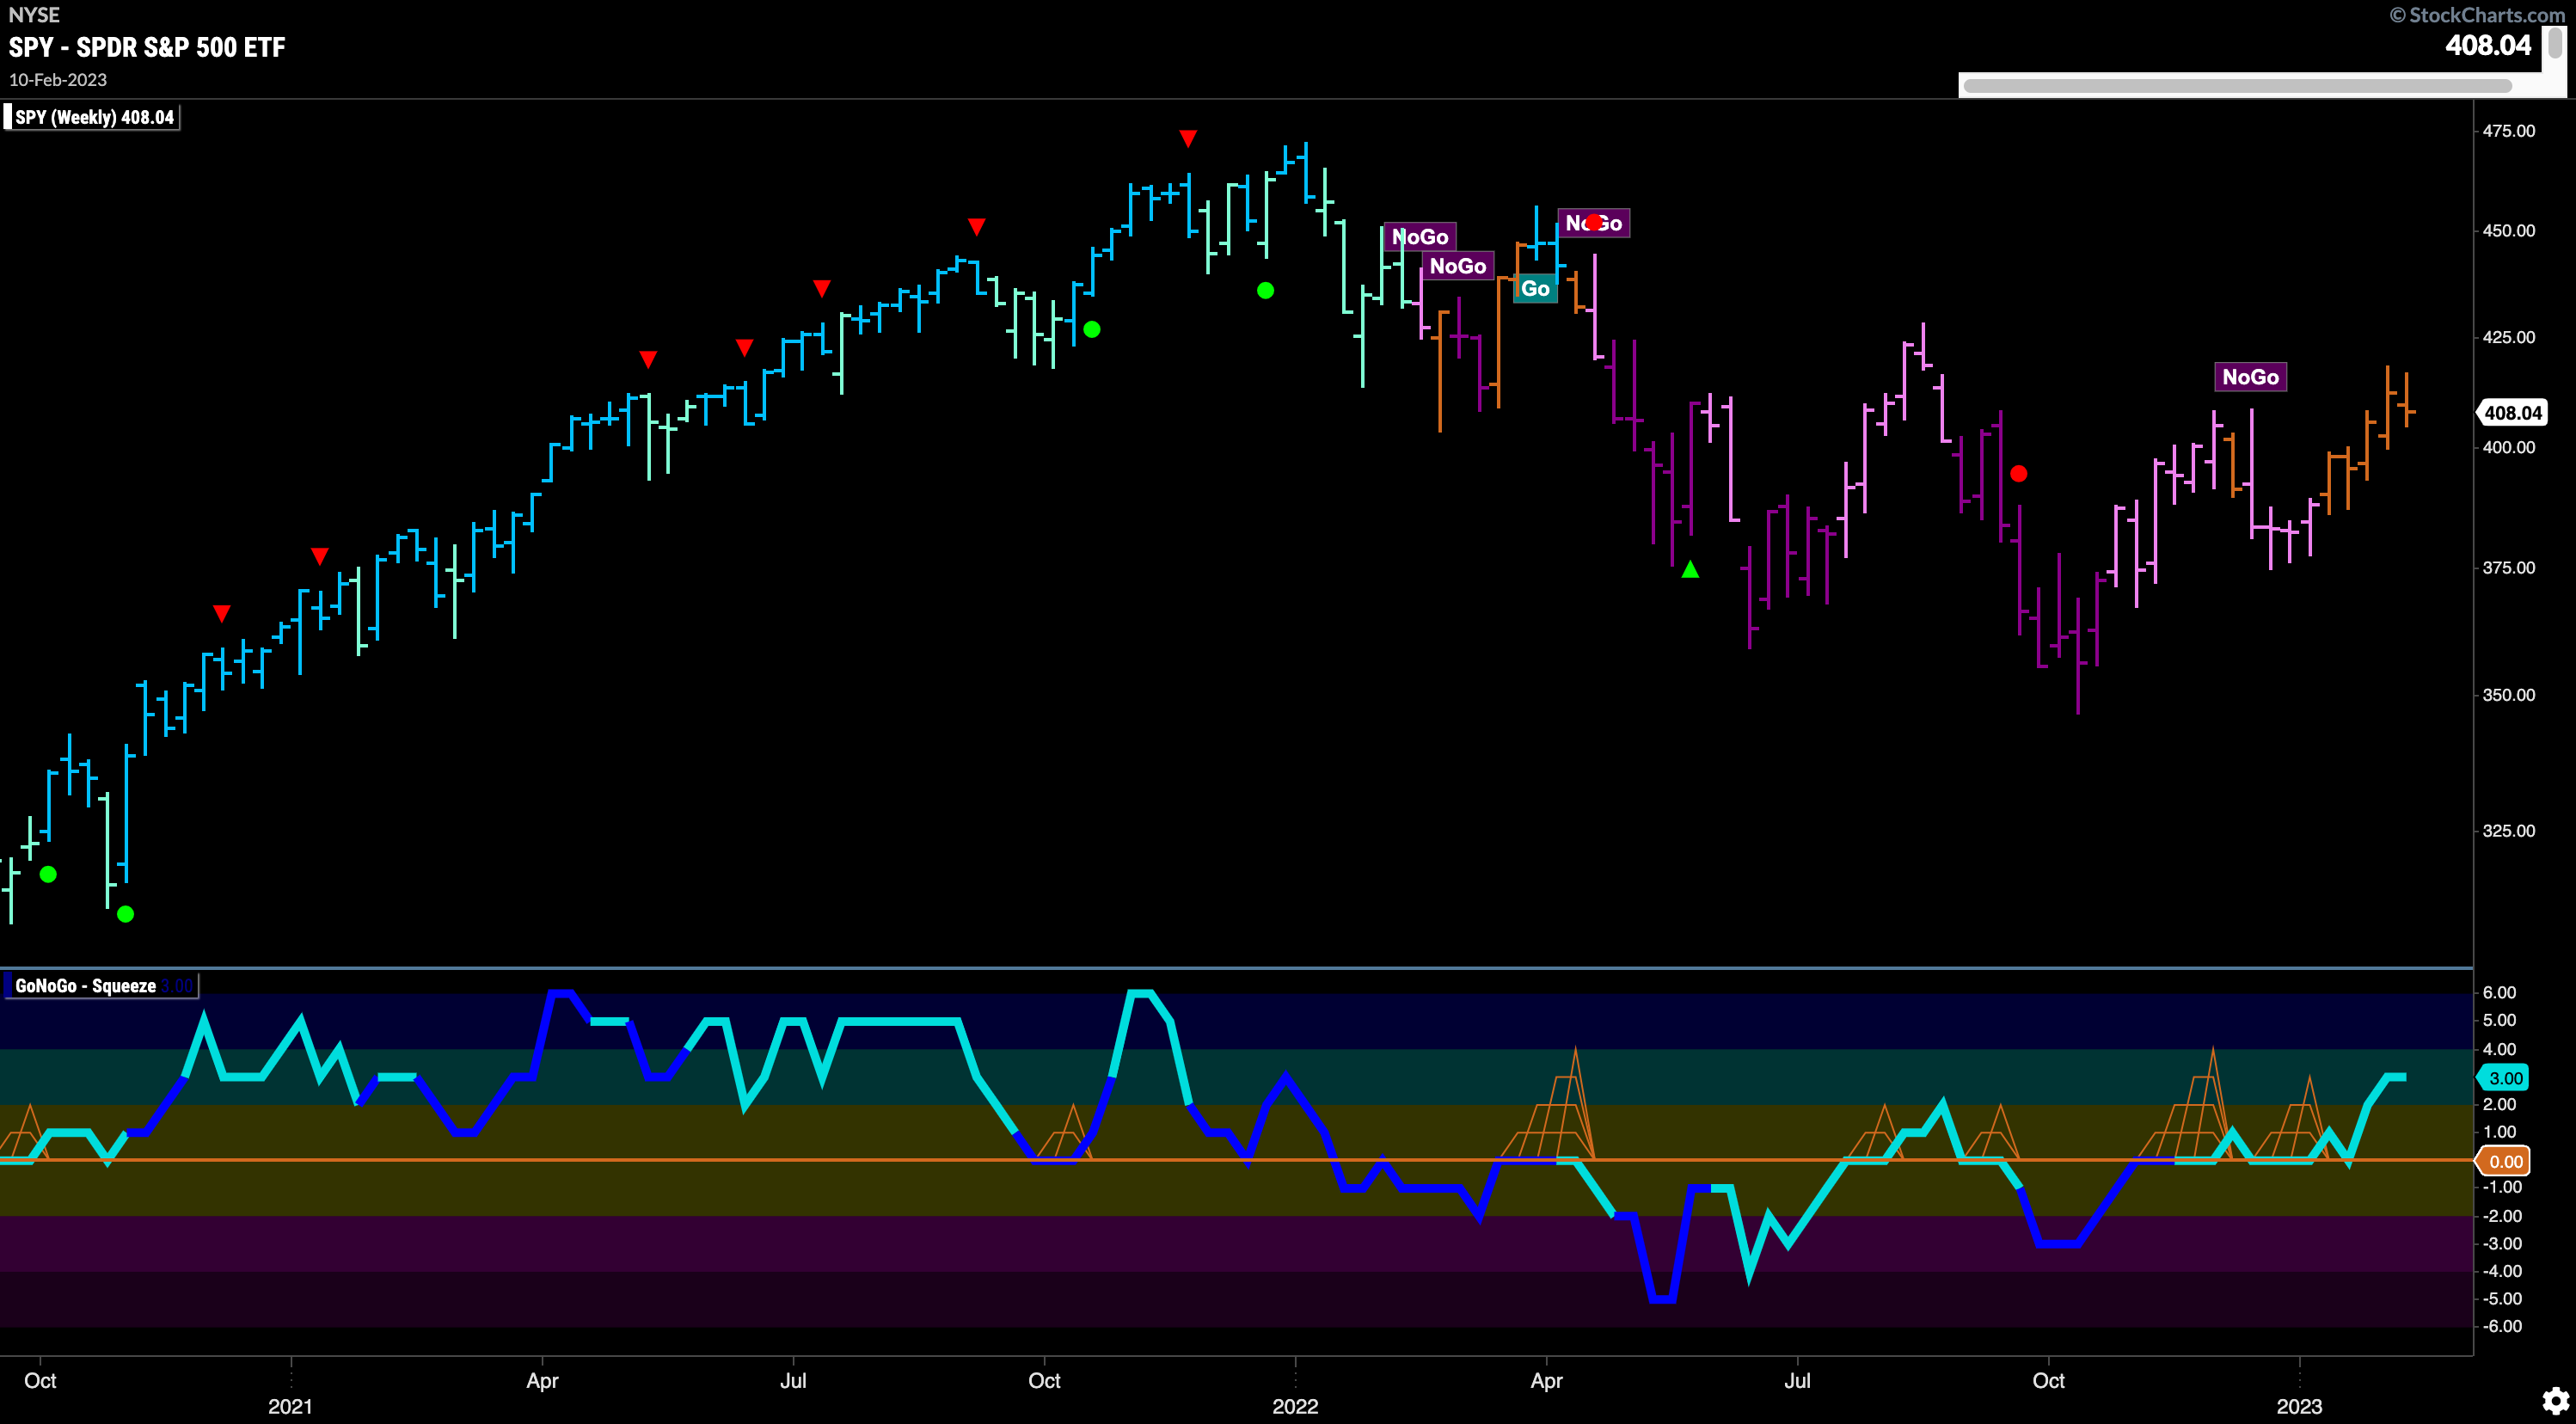
The longer term weekly chart shows another amber “Go Fish” bar this week as GoNoGo Trend still doesn’t see enough directional movement to paint “Go” or “NoGo” bars. GoNoGo Oscillator is solidly in positive territory after having found support at that level several times. This could suggest that the momentum is on the side of price entering a “Go” trend. We will watch the weight of the evidence as we enter a new week.
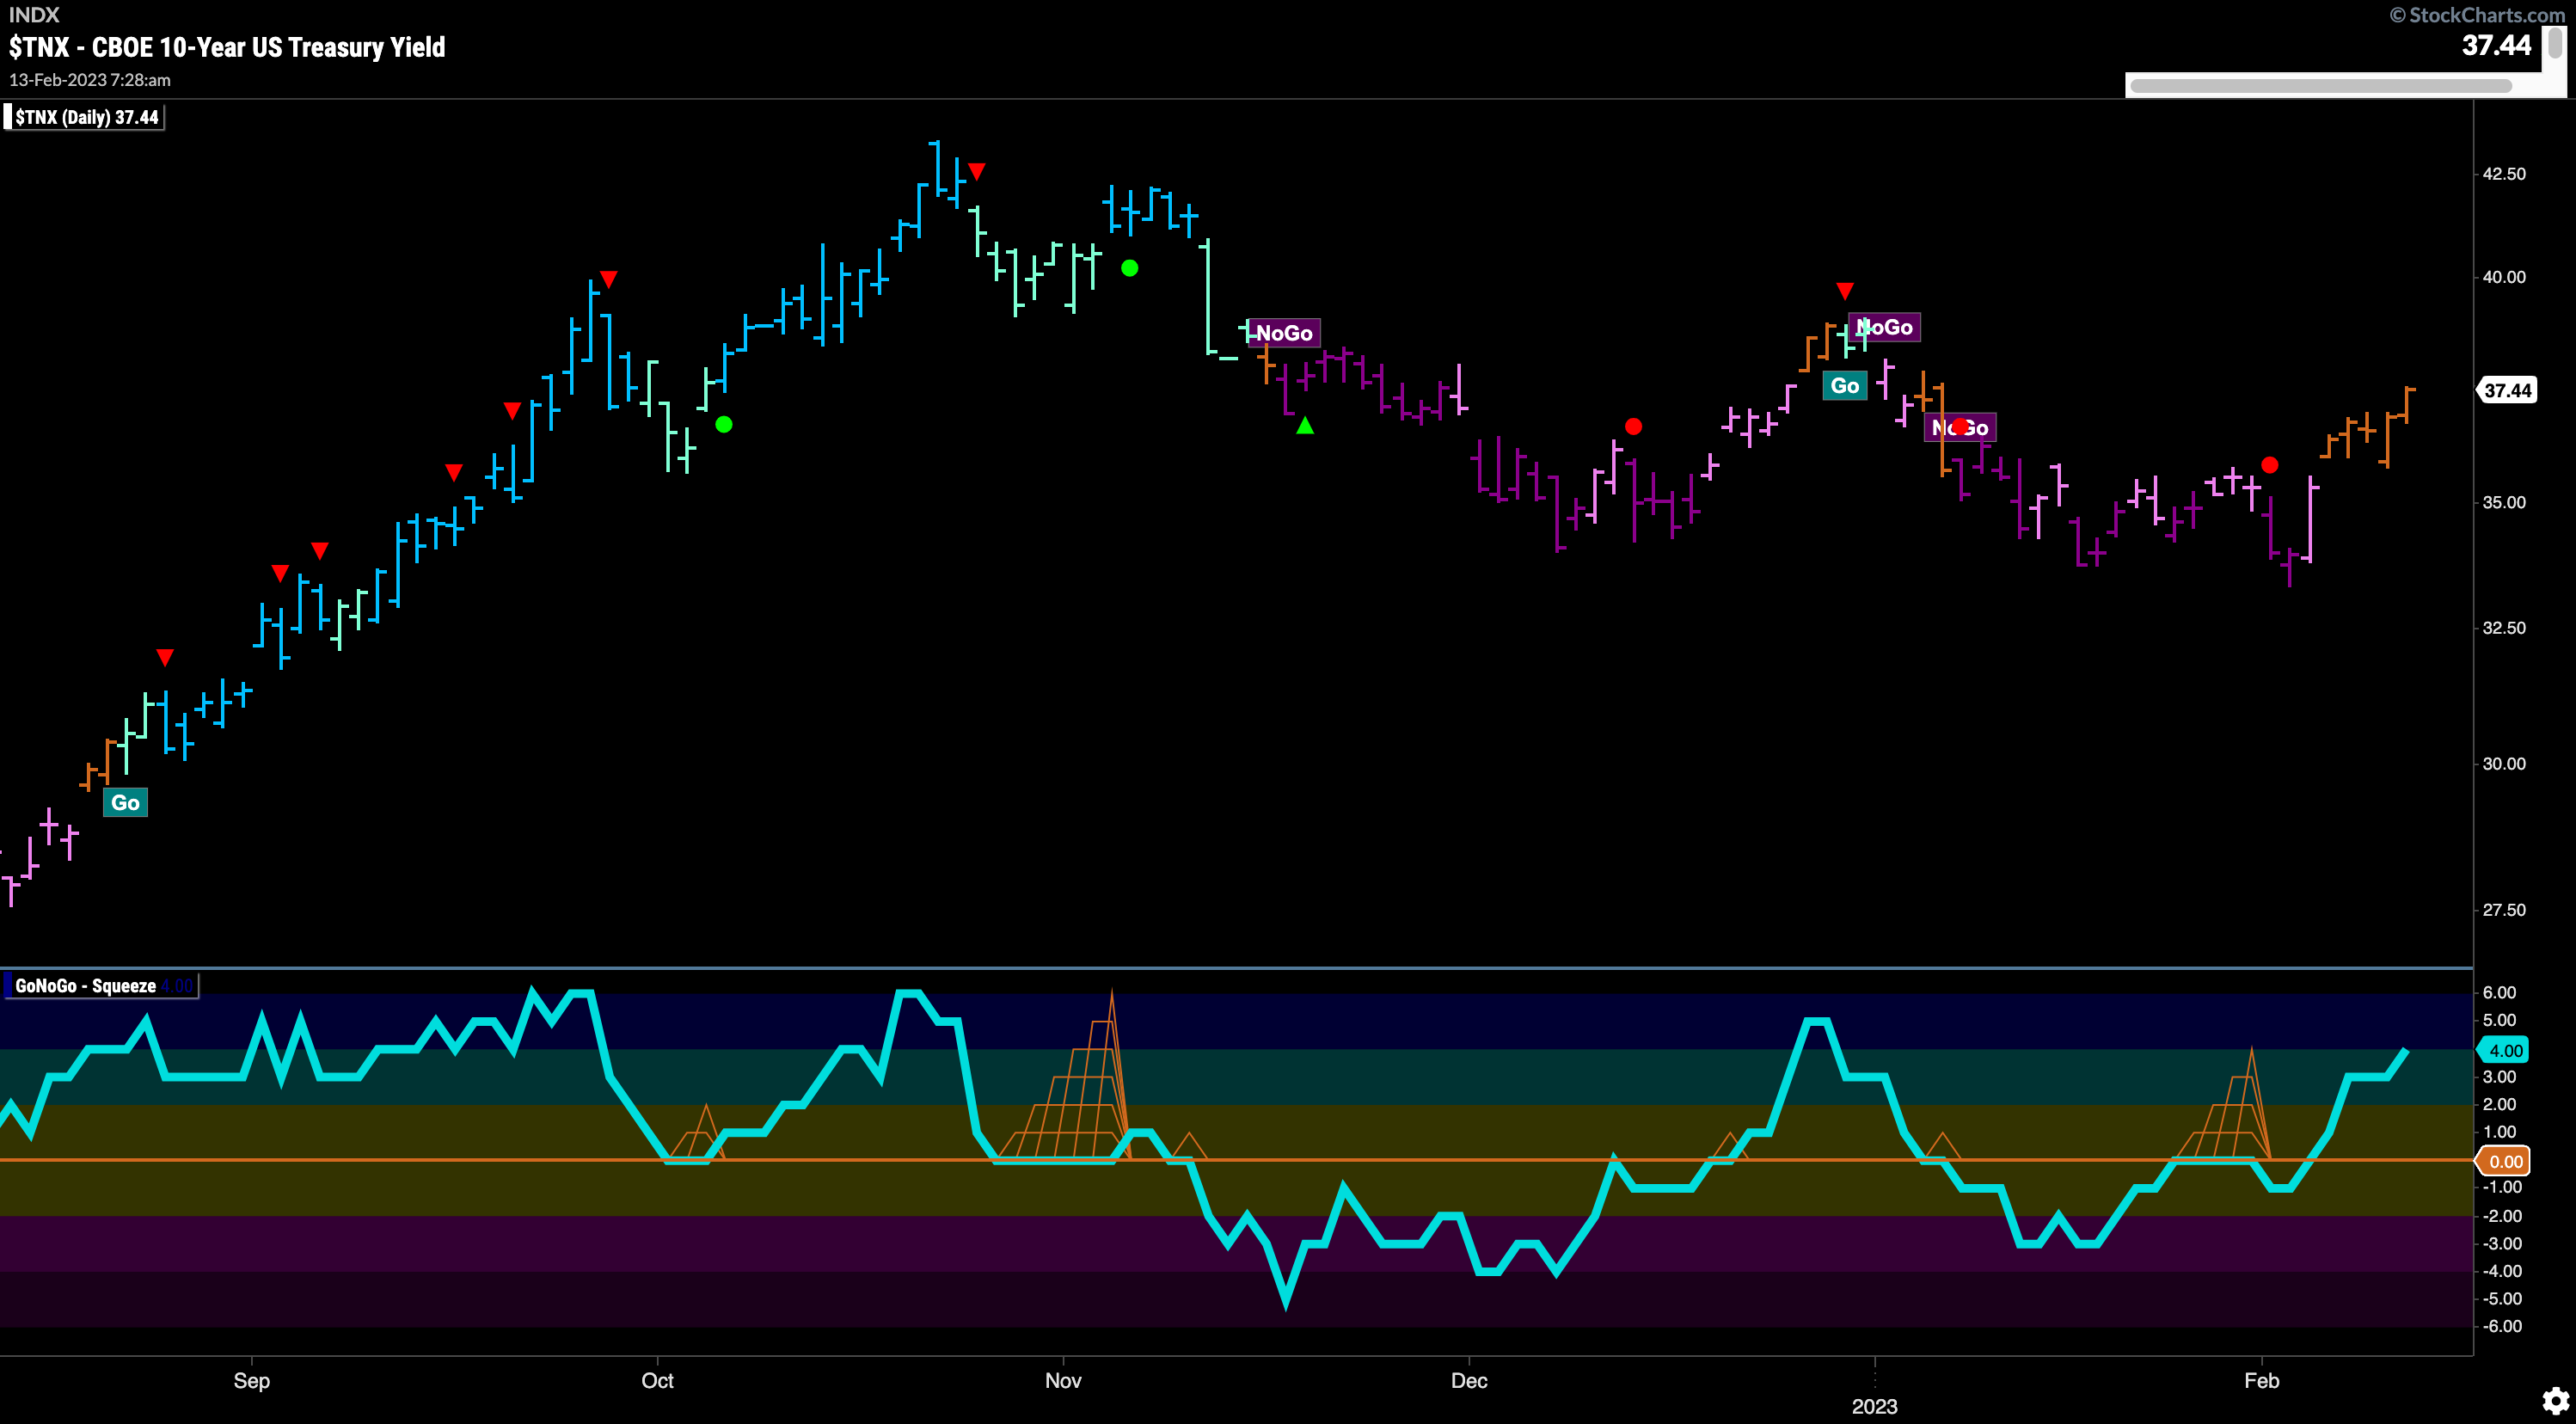
Treasury Rates Also at Inflection Point as GoNoGo Trend says “Go Fish”
Treasury rates continued to rally off the recent lows and painted amber “Go Fish” bars every day of the week. As price has crept higher, GoNoGo Oscillator broke into positive territory telling us that momentum is now positive. This suggests that there is more buying pressure currently as GoNoGo Trend tries to move from amber into “Go” colors.
The Dollar Sees Positive Momentum on Heavy Volume
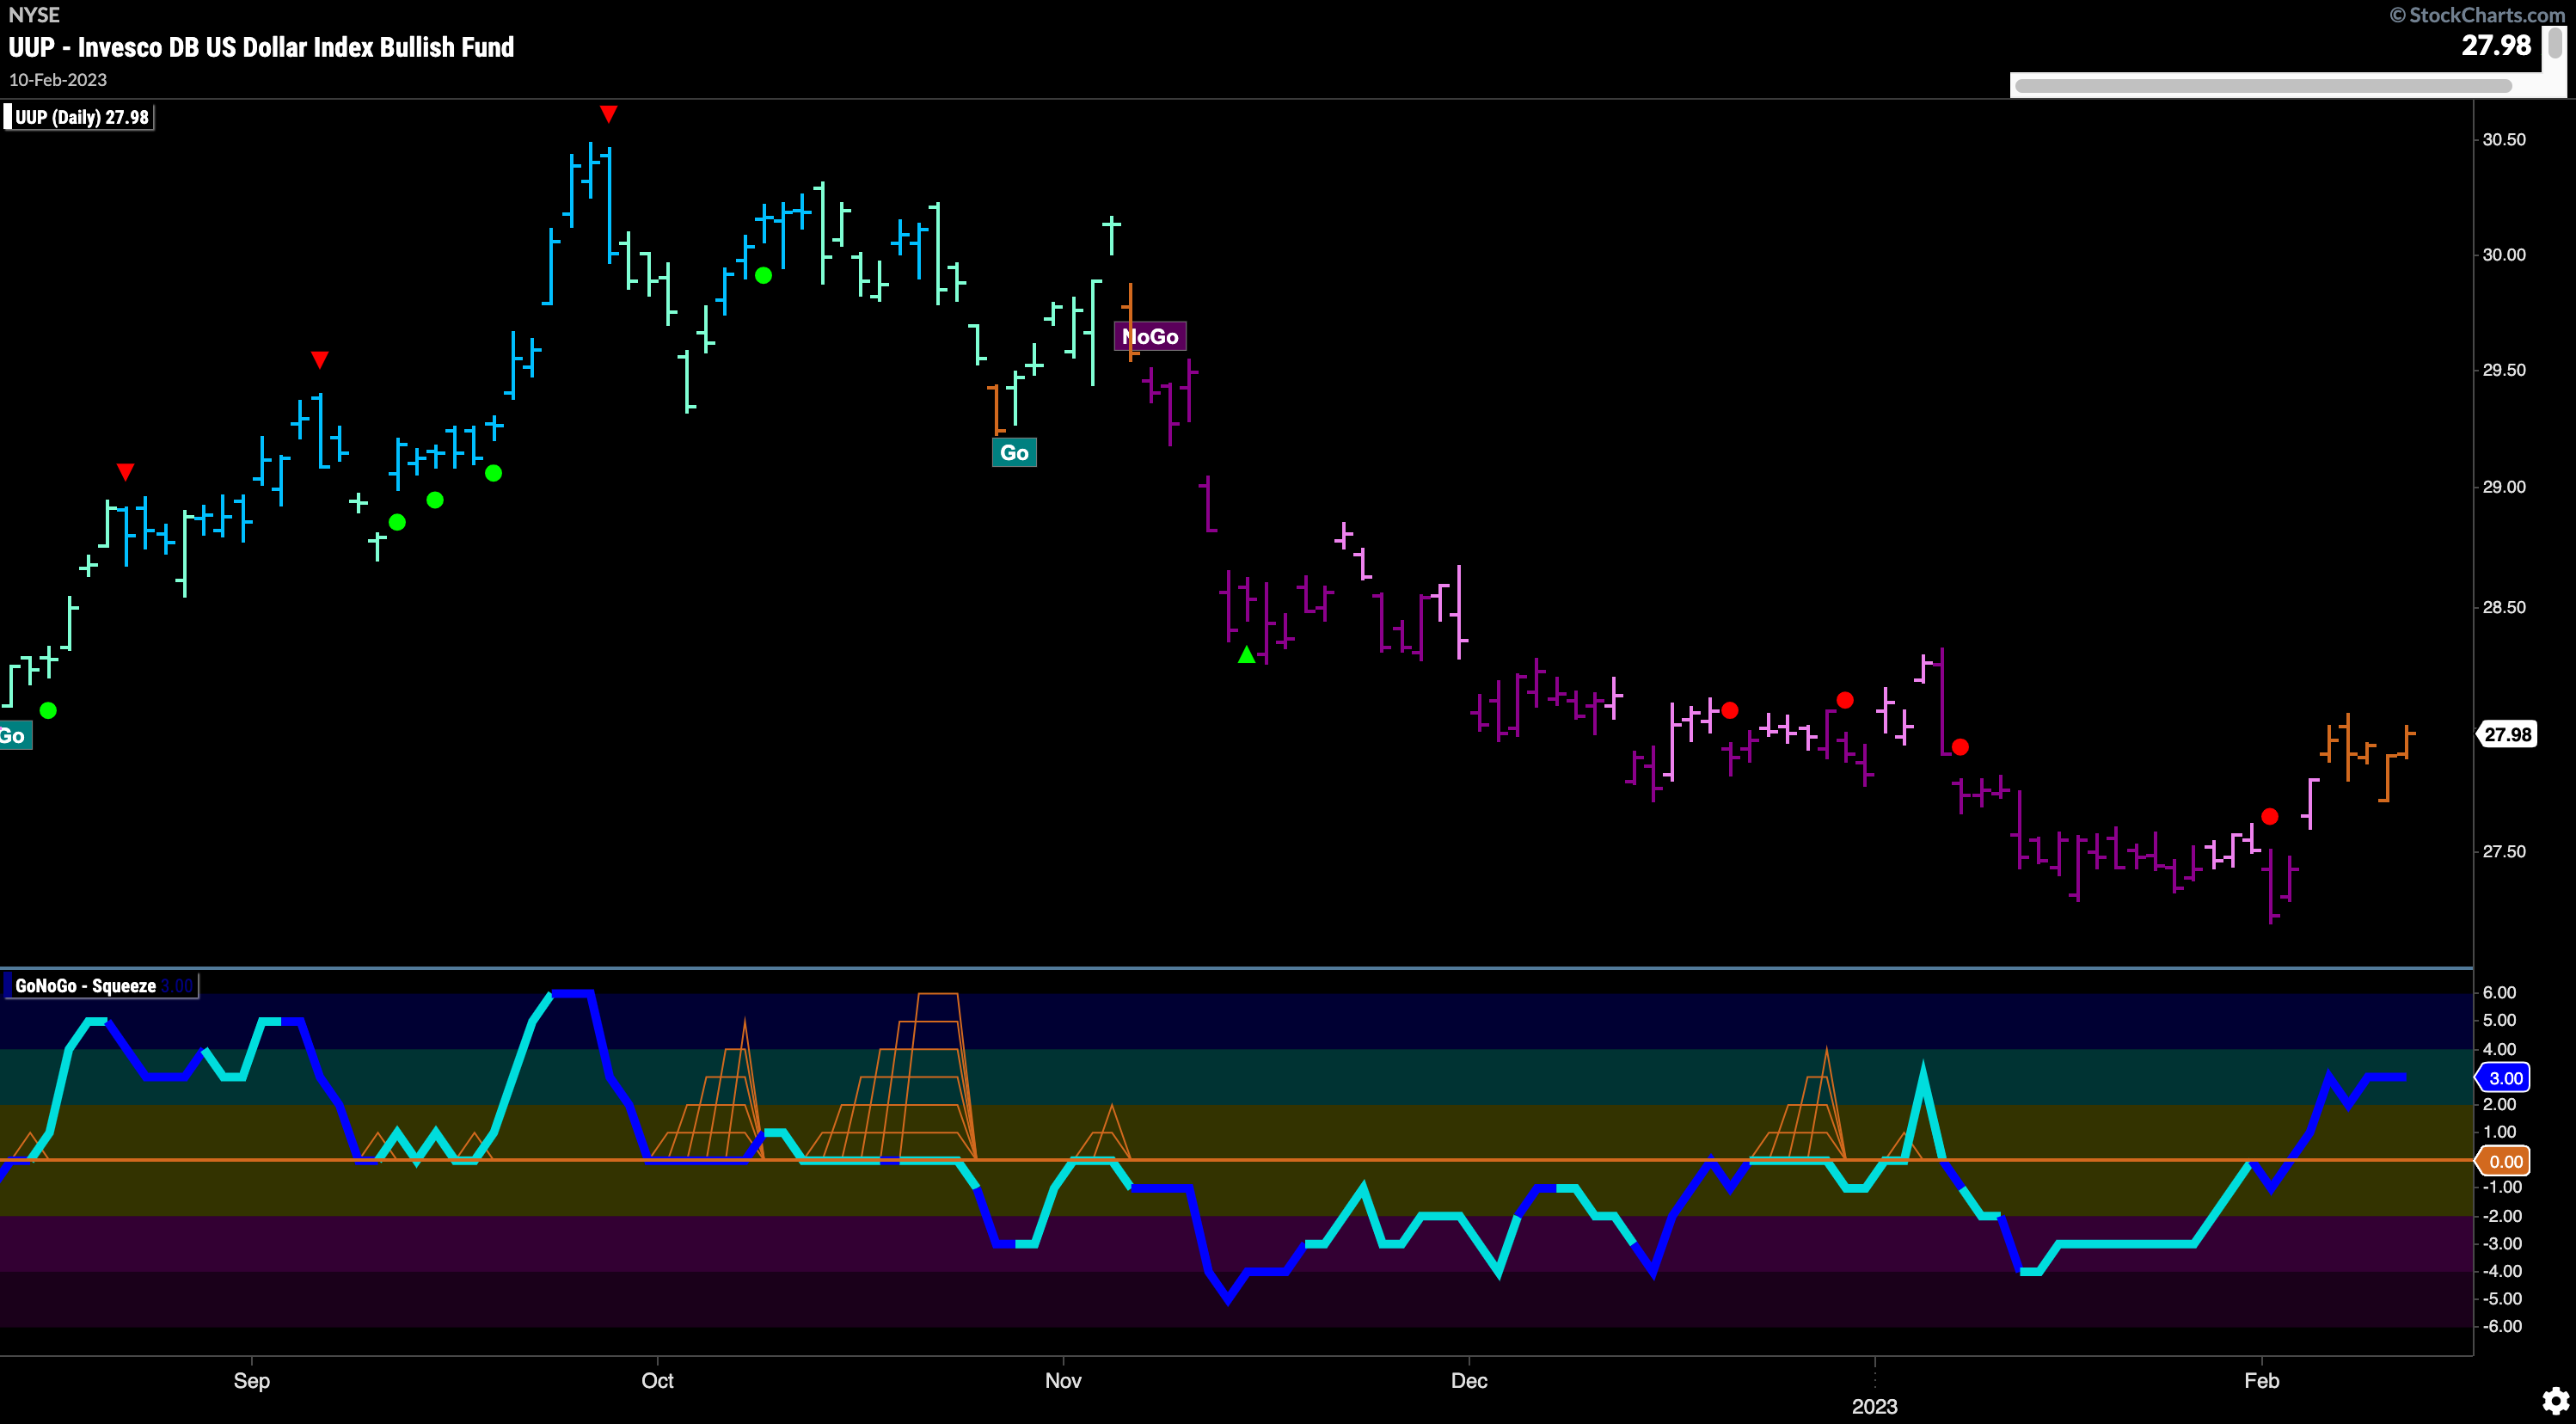
The dollar has also moved out of its “NoGo” trend but as of yet has failed to find a “Go” trend. After the last low, price has rallied enough for GoNoGo Trend to paint neutral “Go Fish” bars. GoNoGo Oscillator burst through the zero line from below into positive territory ahead of the trend color change and on heavy volume. This suggests there is some market activity behind these rising prices that could be enough to send price into a “Go” trend.
Gold Hanging on by a Thread to “Go” Trend
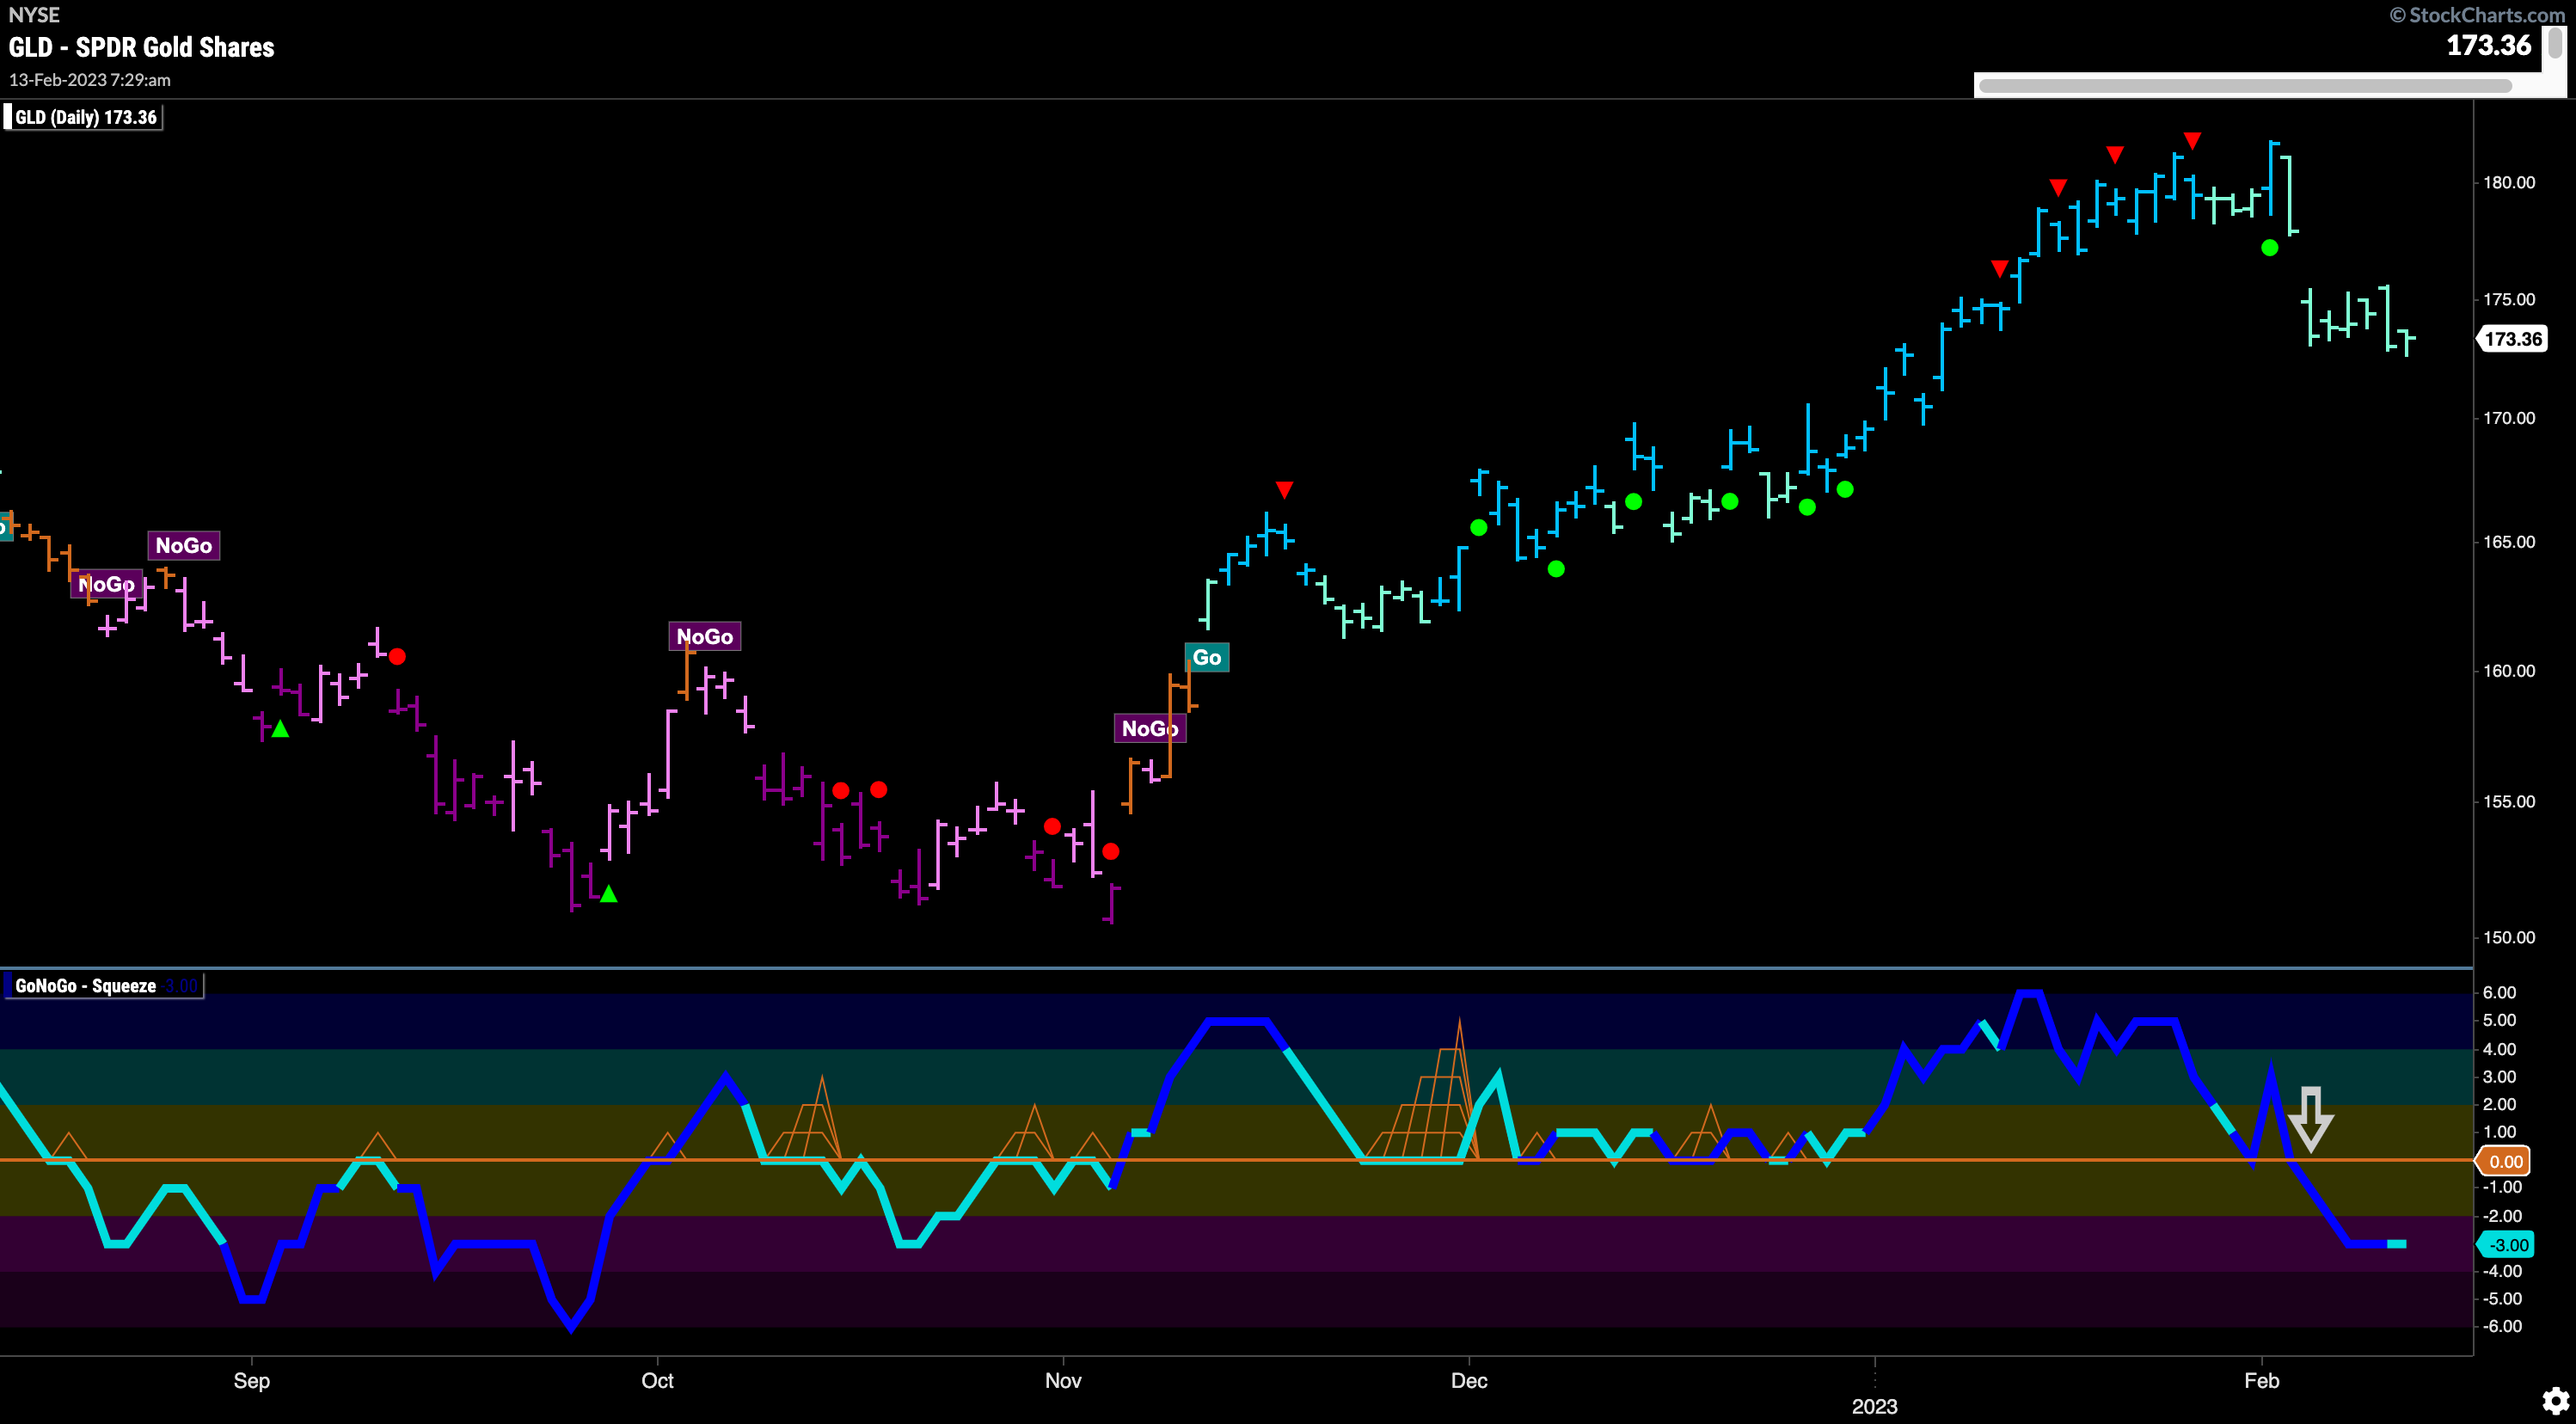
Gold prices haven’t moved too much since they gapped down a week ago. GoNoGo Trend continues to paint weaker aqua “Go” bars and GoNoGo Oscillator has remained in negative territory after breaking through zero from above on heavy volume. This is of course, a threat to the “Go” trend. We will watch to see if this downside momentum continues and pushes price out of the “Go” trend.
Oil’s Strong Week Puts Oscillator Back at Zero
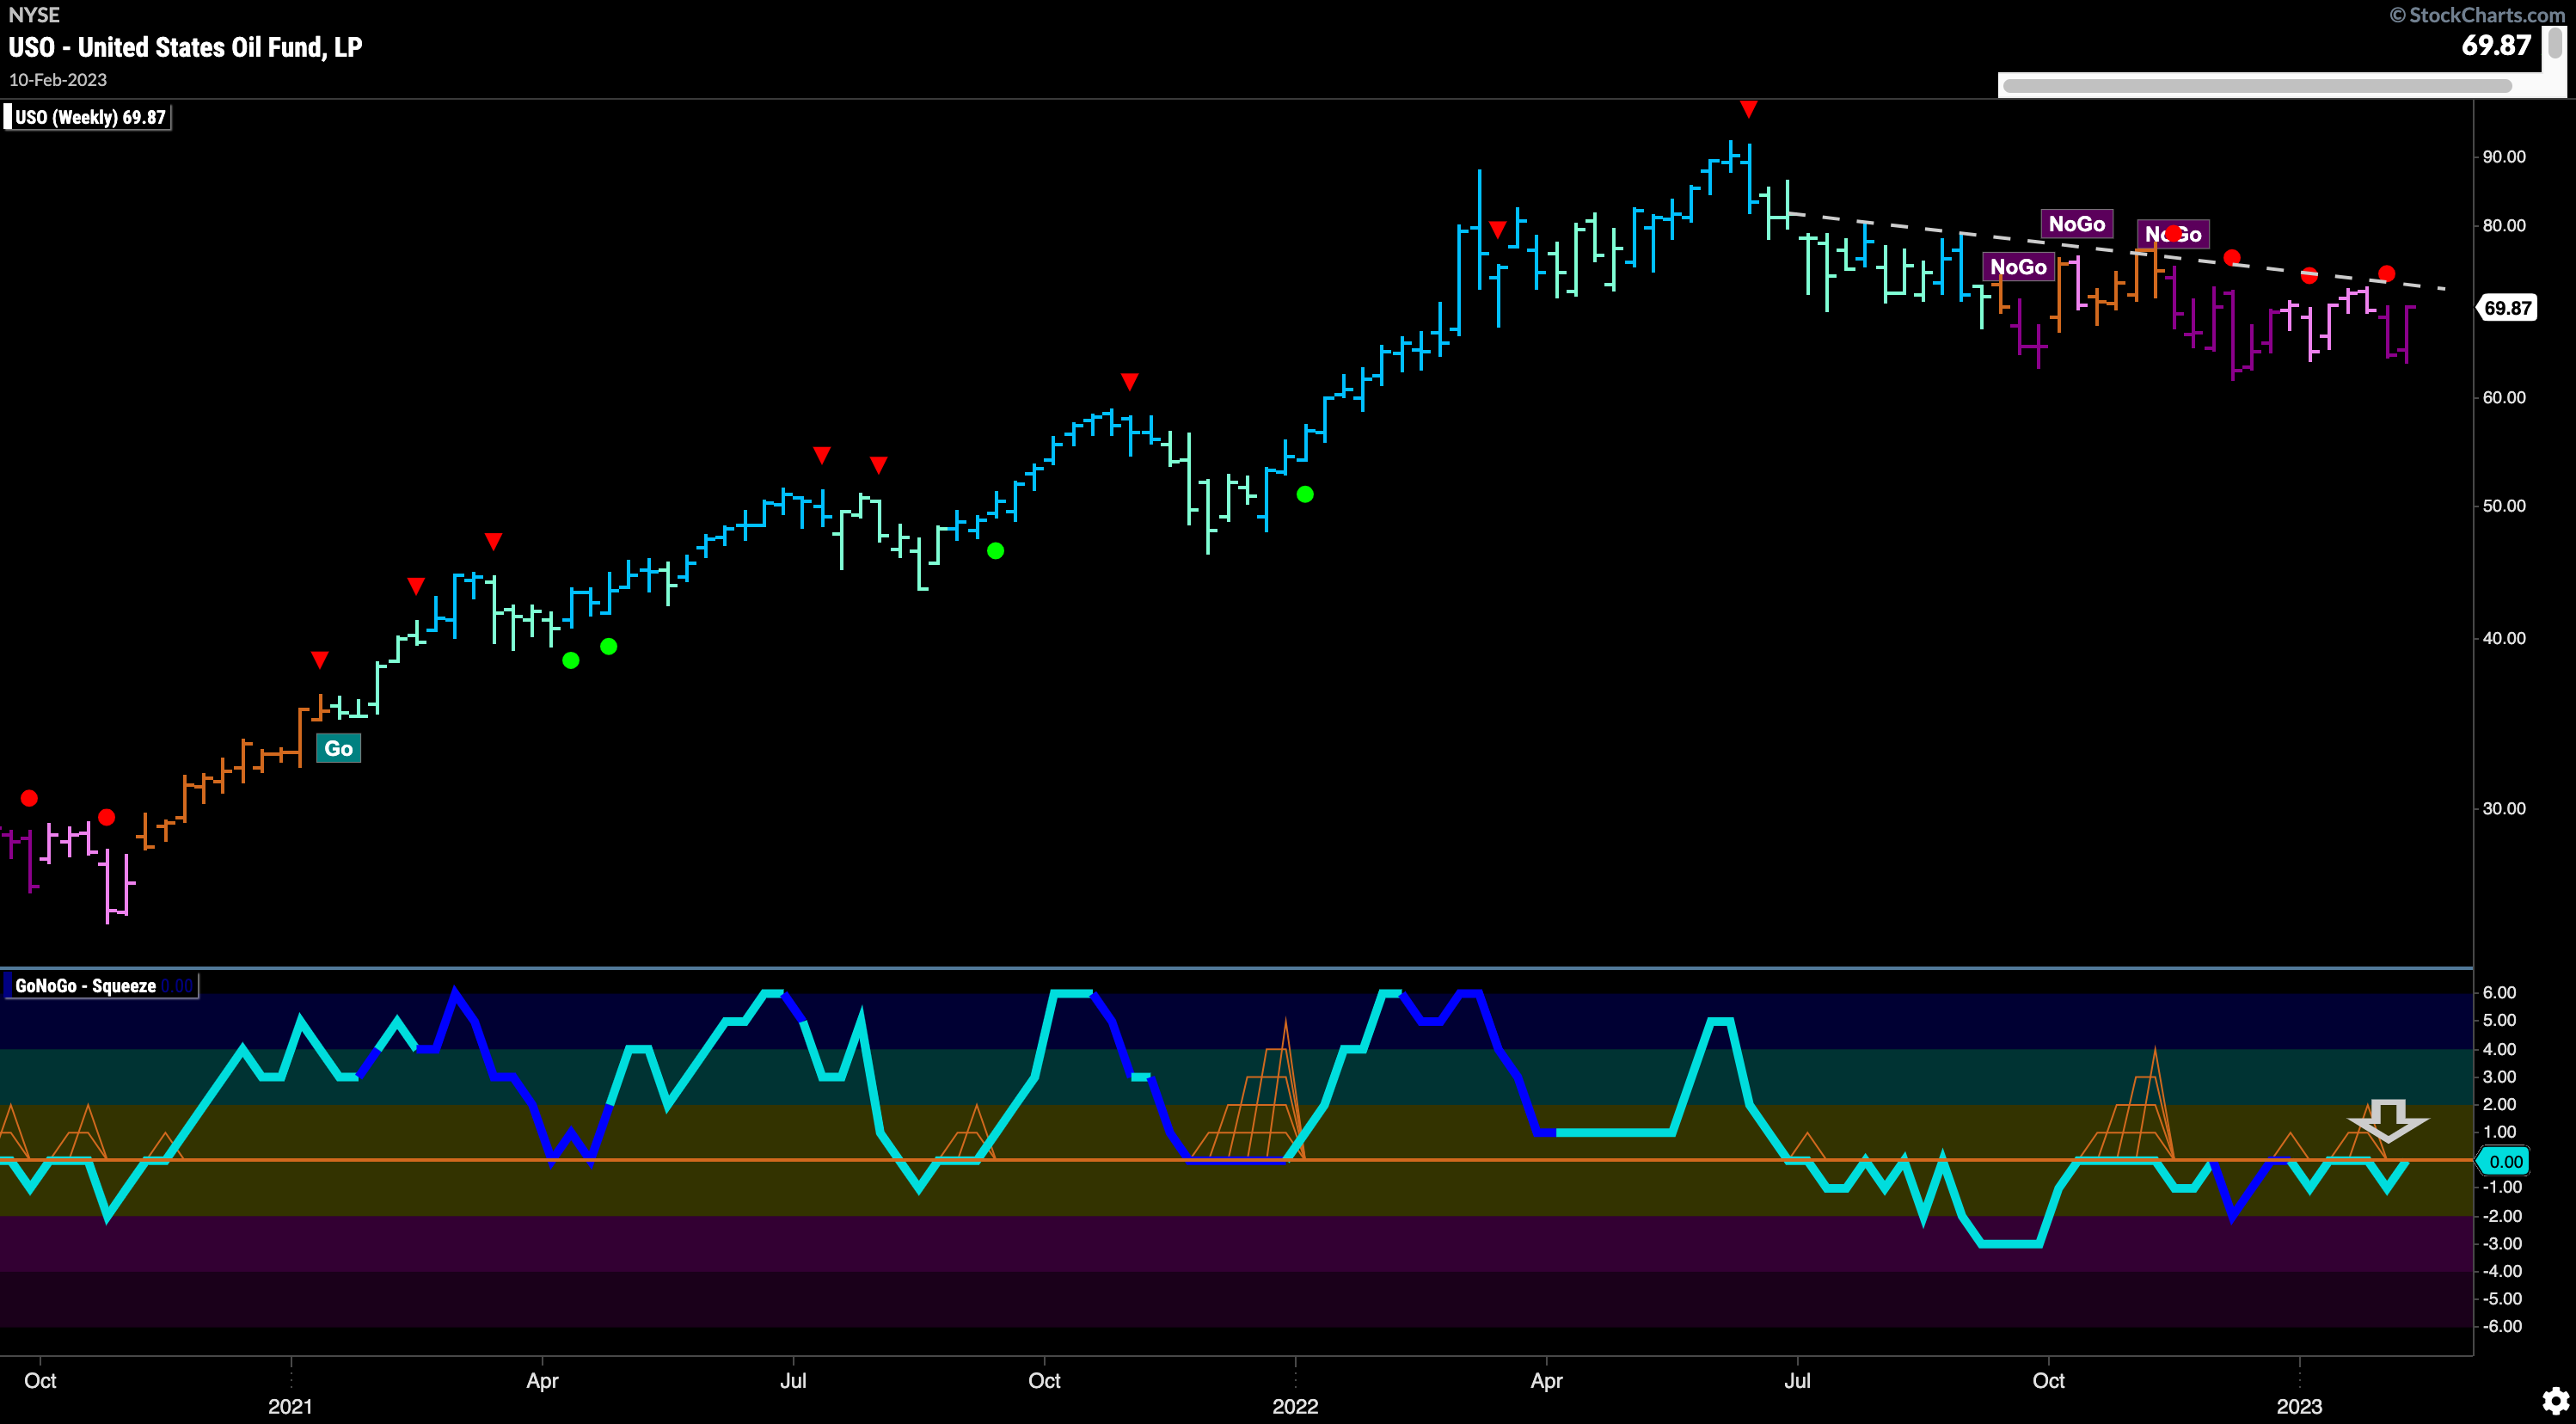
$USO on a weekly chart shows that although the strong “NoGo” trend continues price has climbed close to downward sloping resistance again. With that, GoNoGo Oscillator has risen to test the zero line again where we will look to see if that level continues to hold as resistance. So far, the zero line has proven unbreakable, allowing the “NoGo” trend to continue each time it is tested.
 Sector RelMap
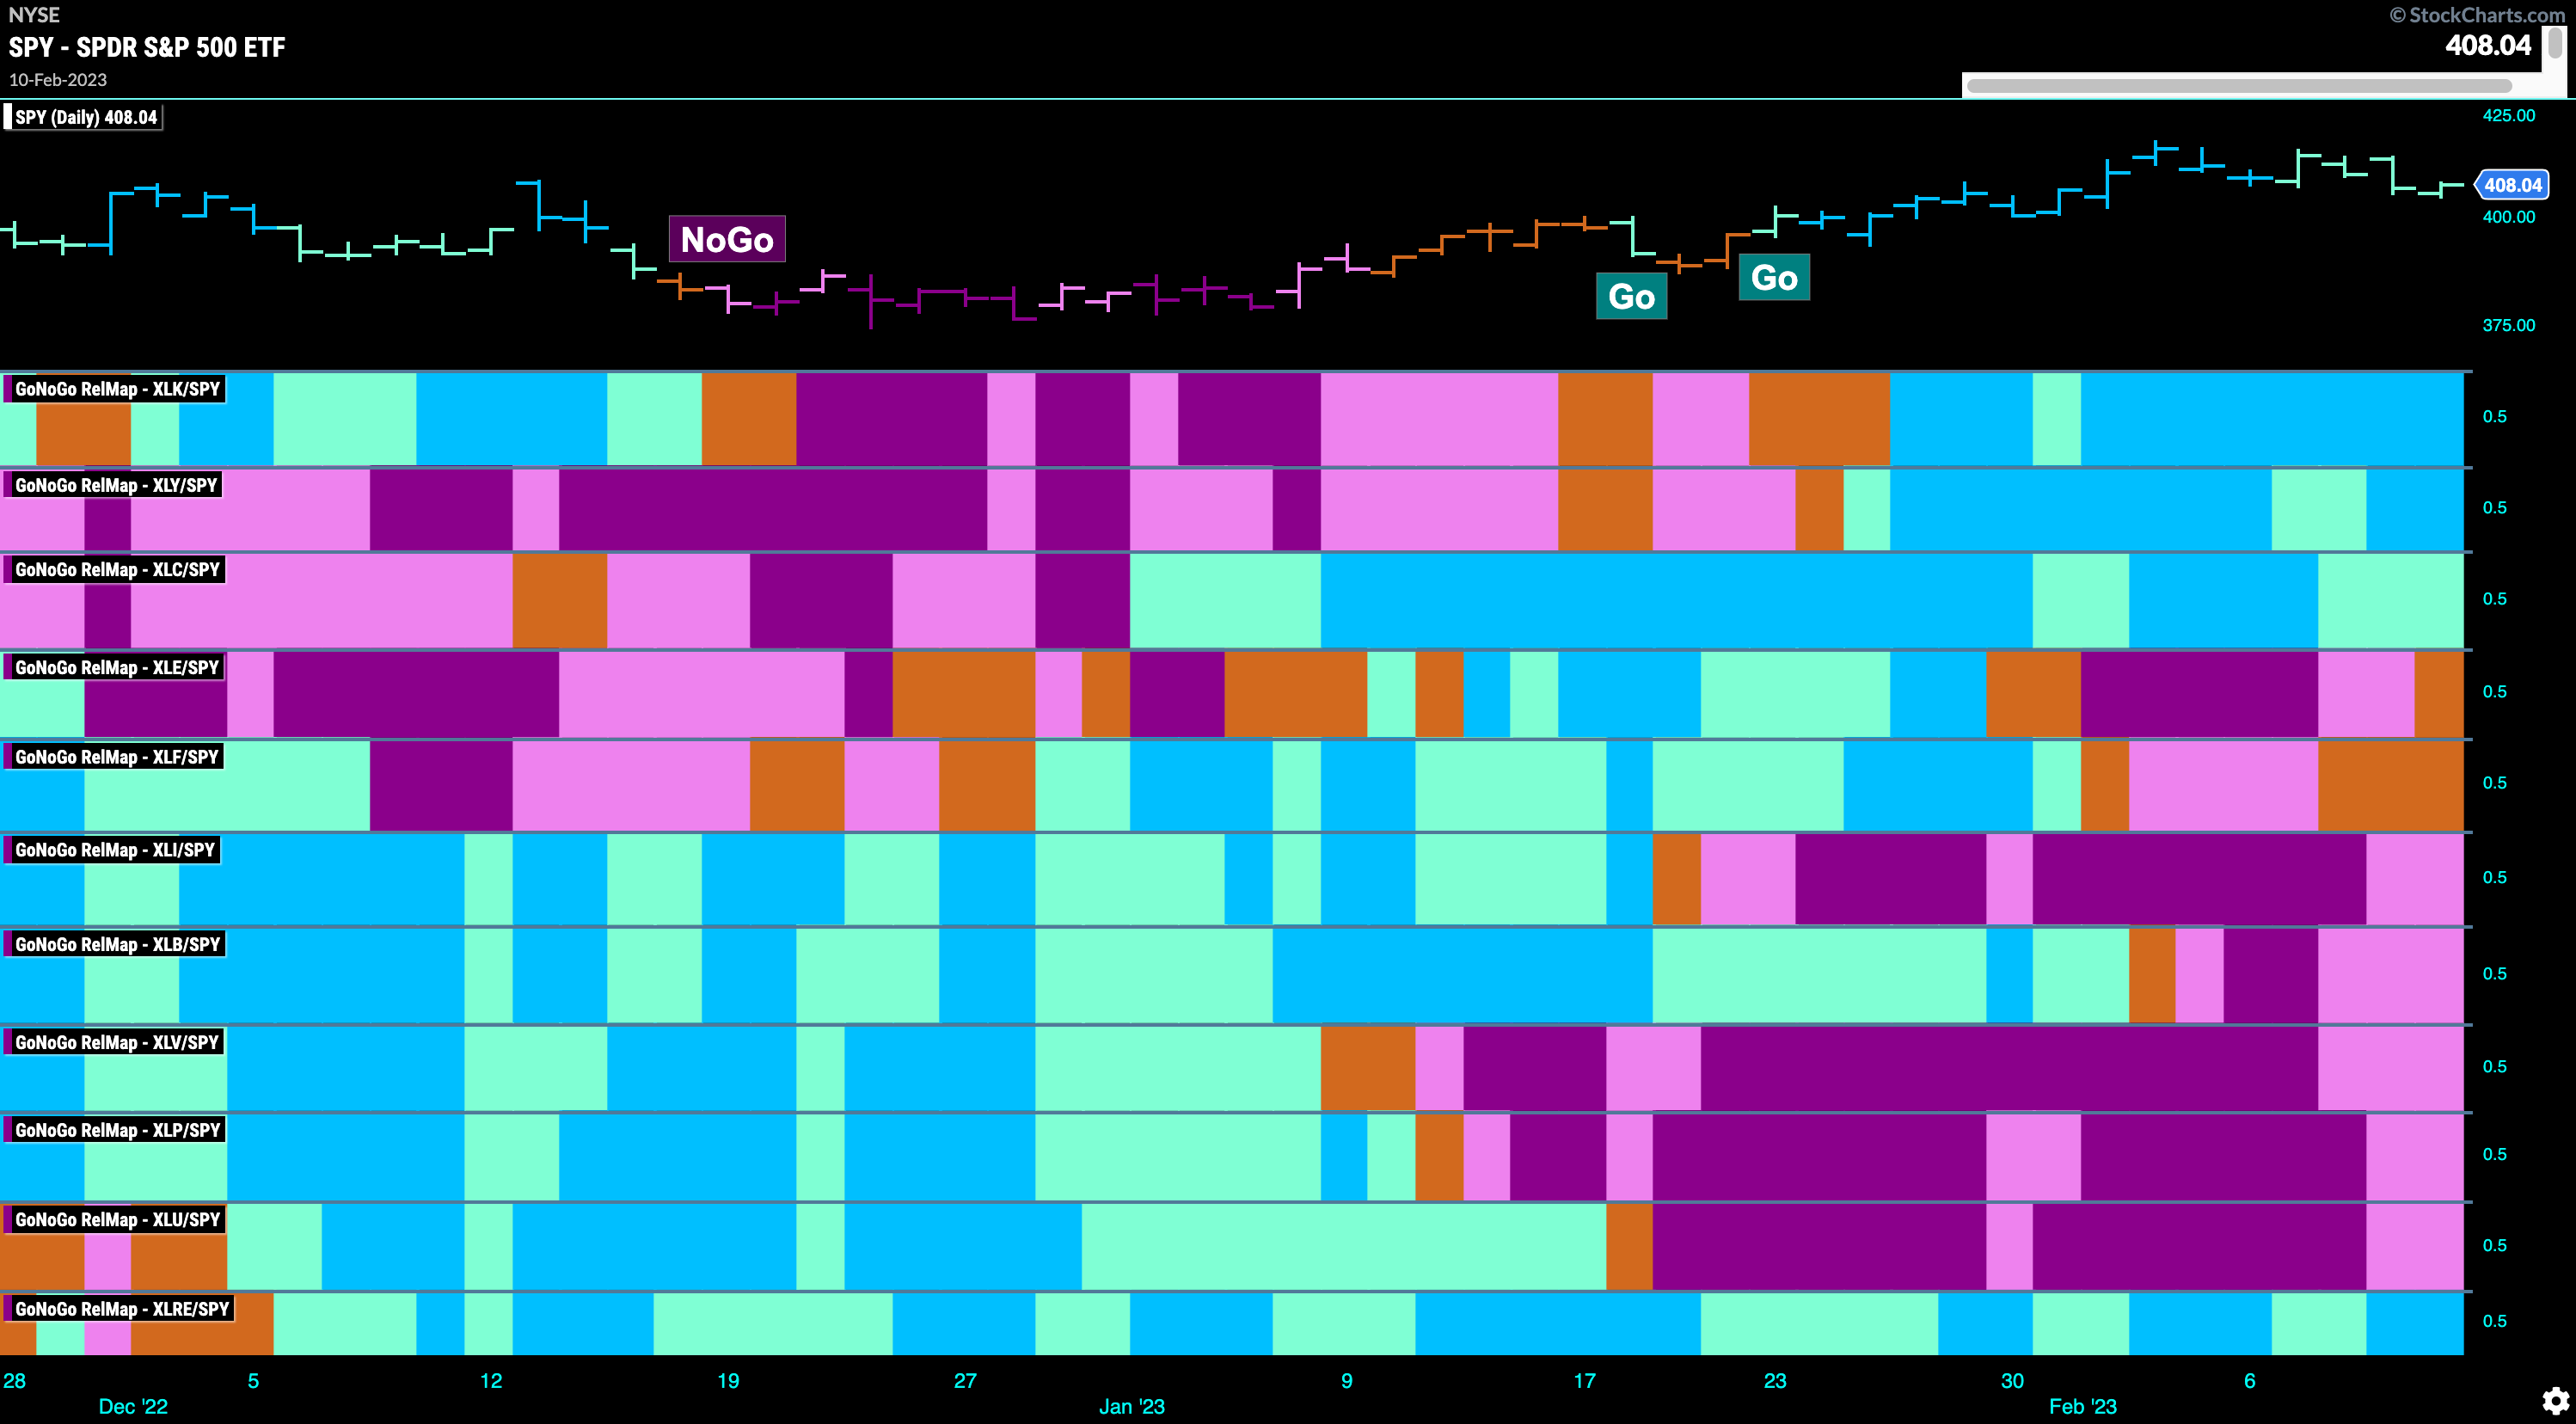
Below is the GoNoGo Sector RelMap. This GoNoGo RelMap applies the GoNoGo Trend to the relative strength ratios of the sectors to the base index. Looking at this map, we can quickly see where the relative outperformance is coming from as well as which sectors are lagging on a relative basis. 4 sectors are outperforming the base this week. $XLK, $XLY, $XLC, and $XLRE, are painting “Go” bars. There is no change in the profile of the map this week. Relative outperformance is still being driven by the growth sectors.
Technology in “Go” Trend and Looking for Support
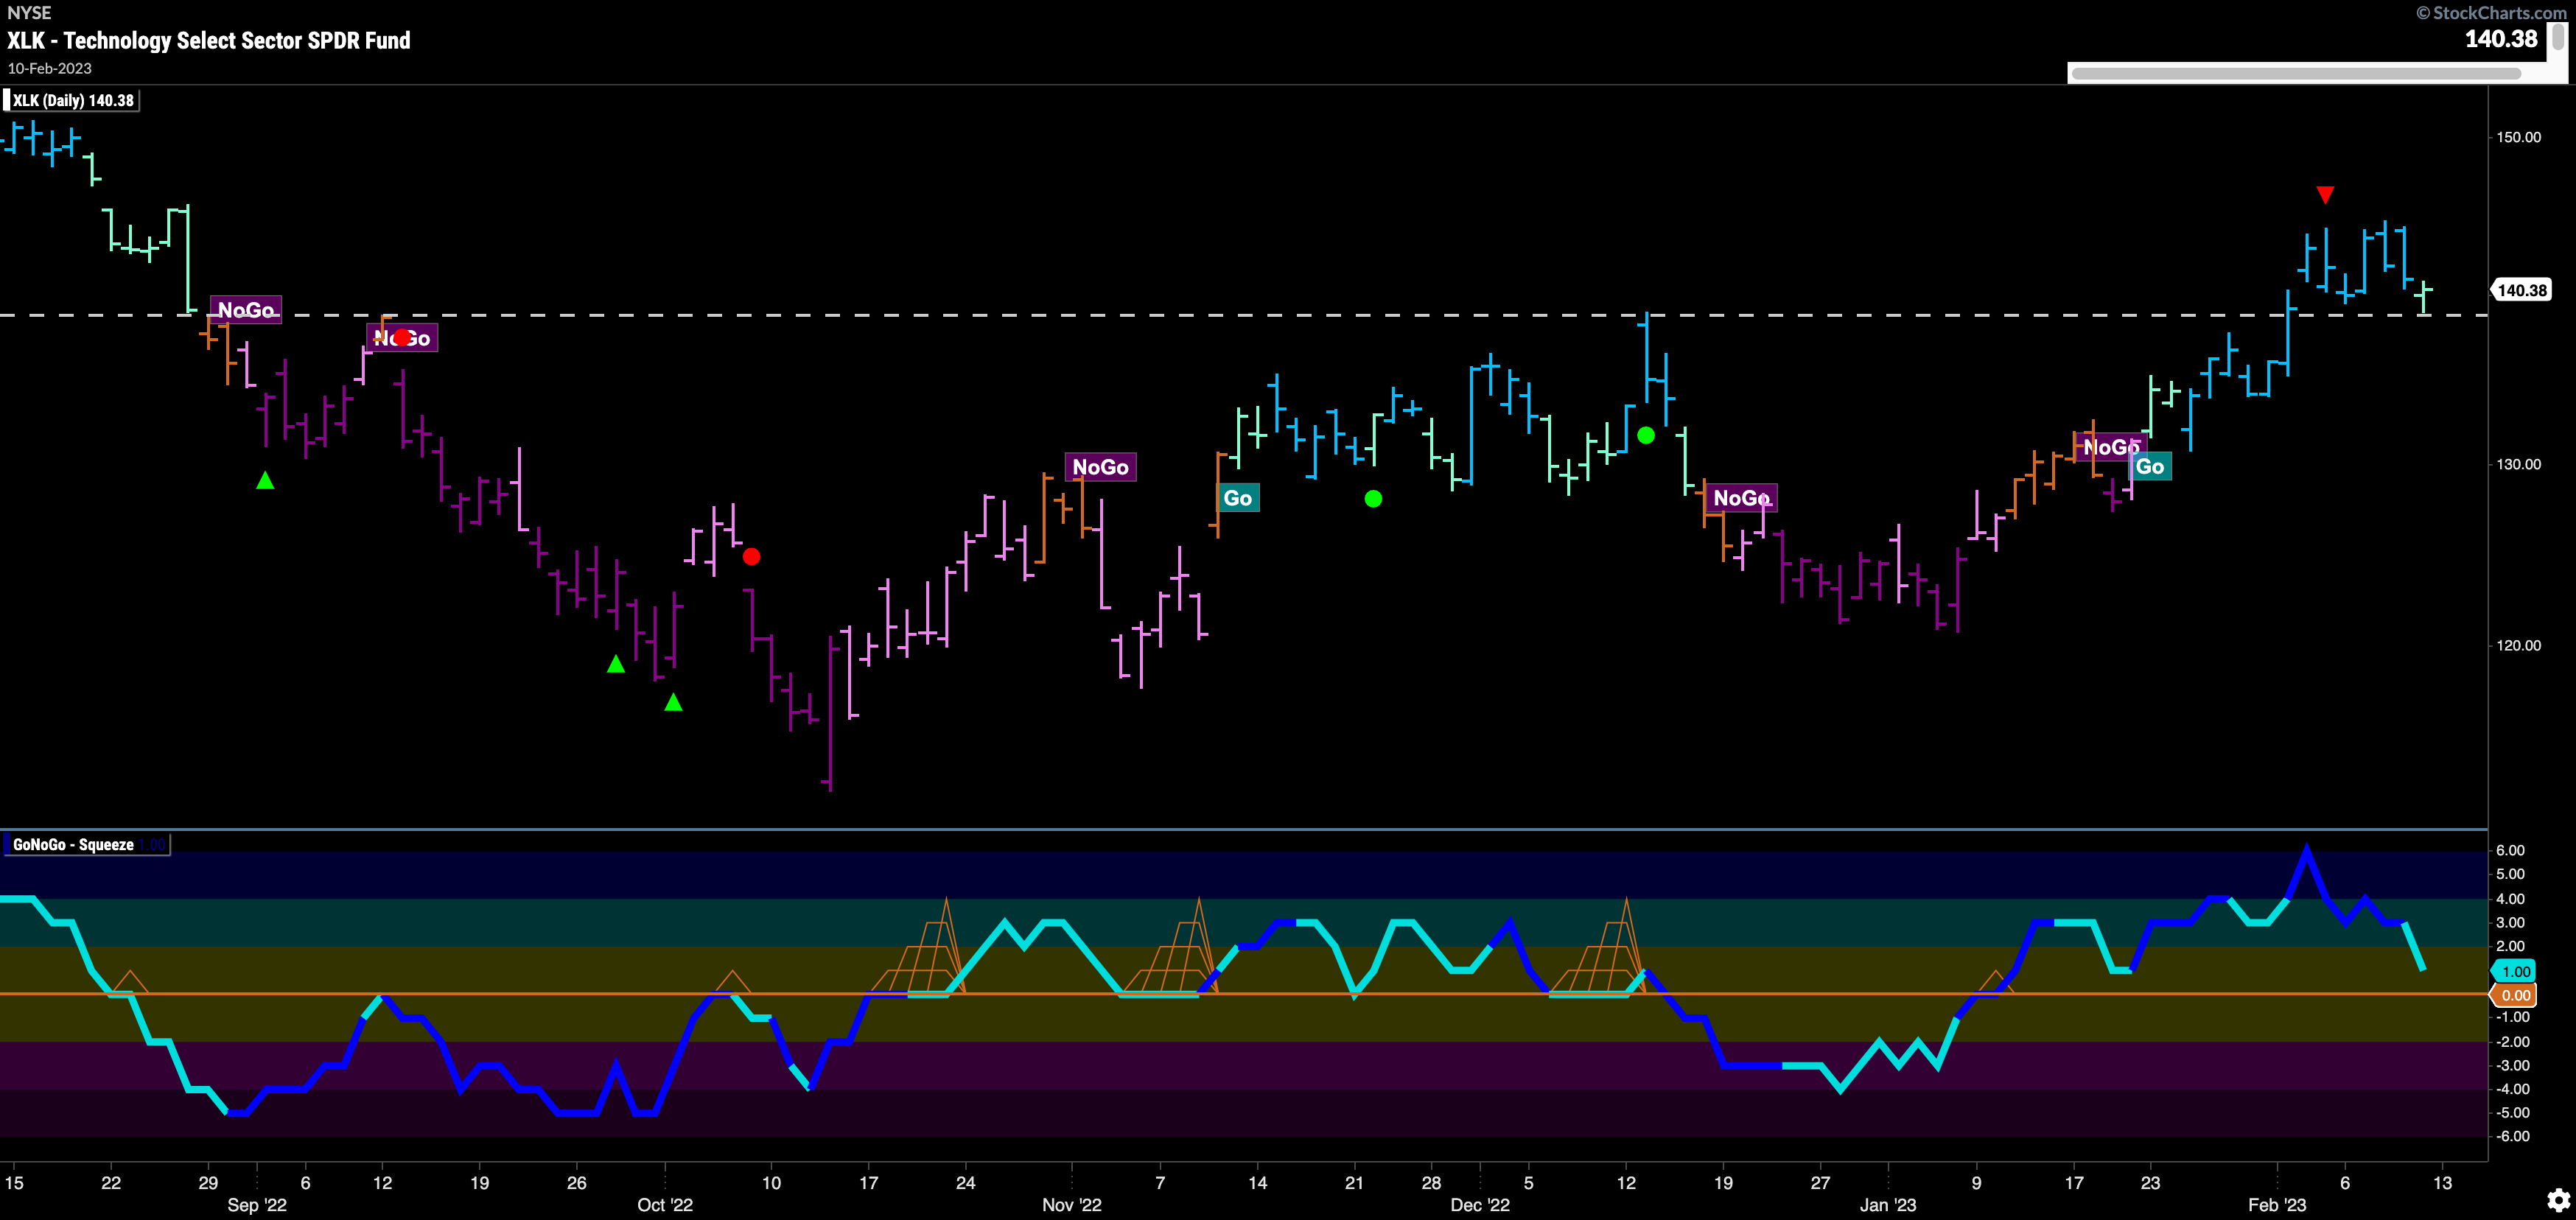
The chart below shows the “Go” trend in the technology sector is above the highs from the end of 2022. We will look to see if there is support now at this level. GoNoGo Trend shows a bar of weakness in an aqua color on the last day of the week. GoNoGo Oscillator is fast approaching the zero line which should also act as support if gets touched.
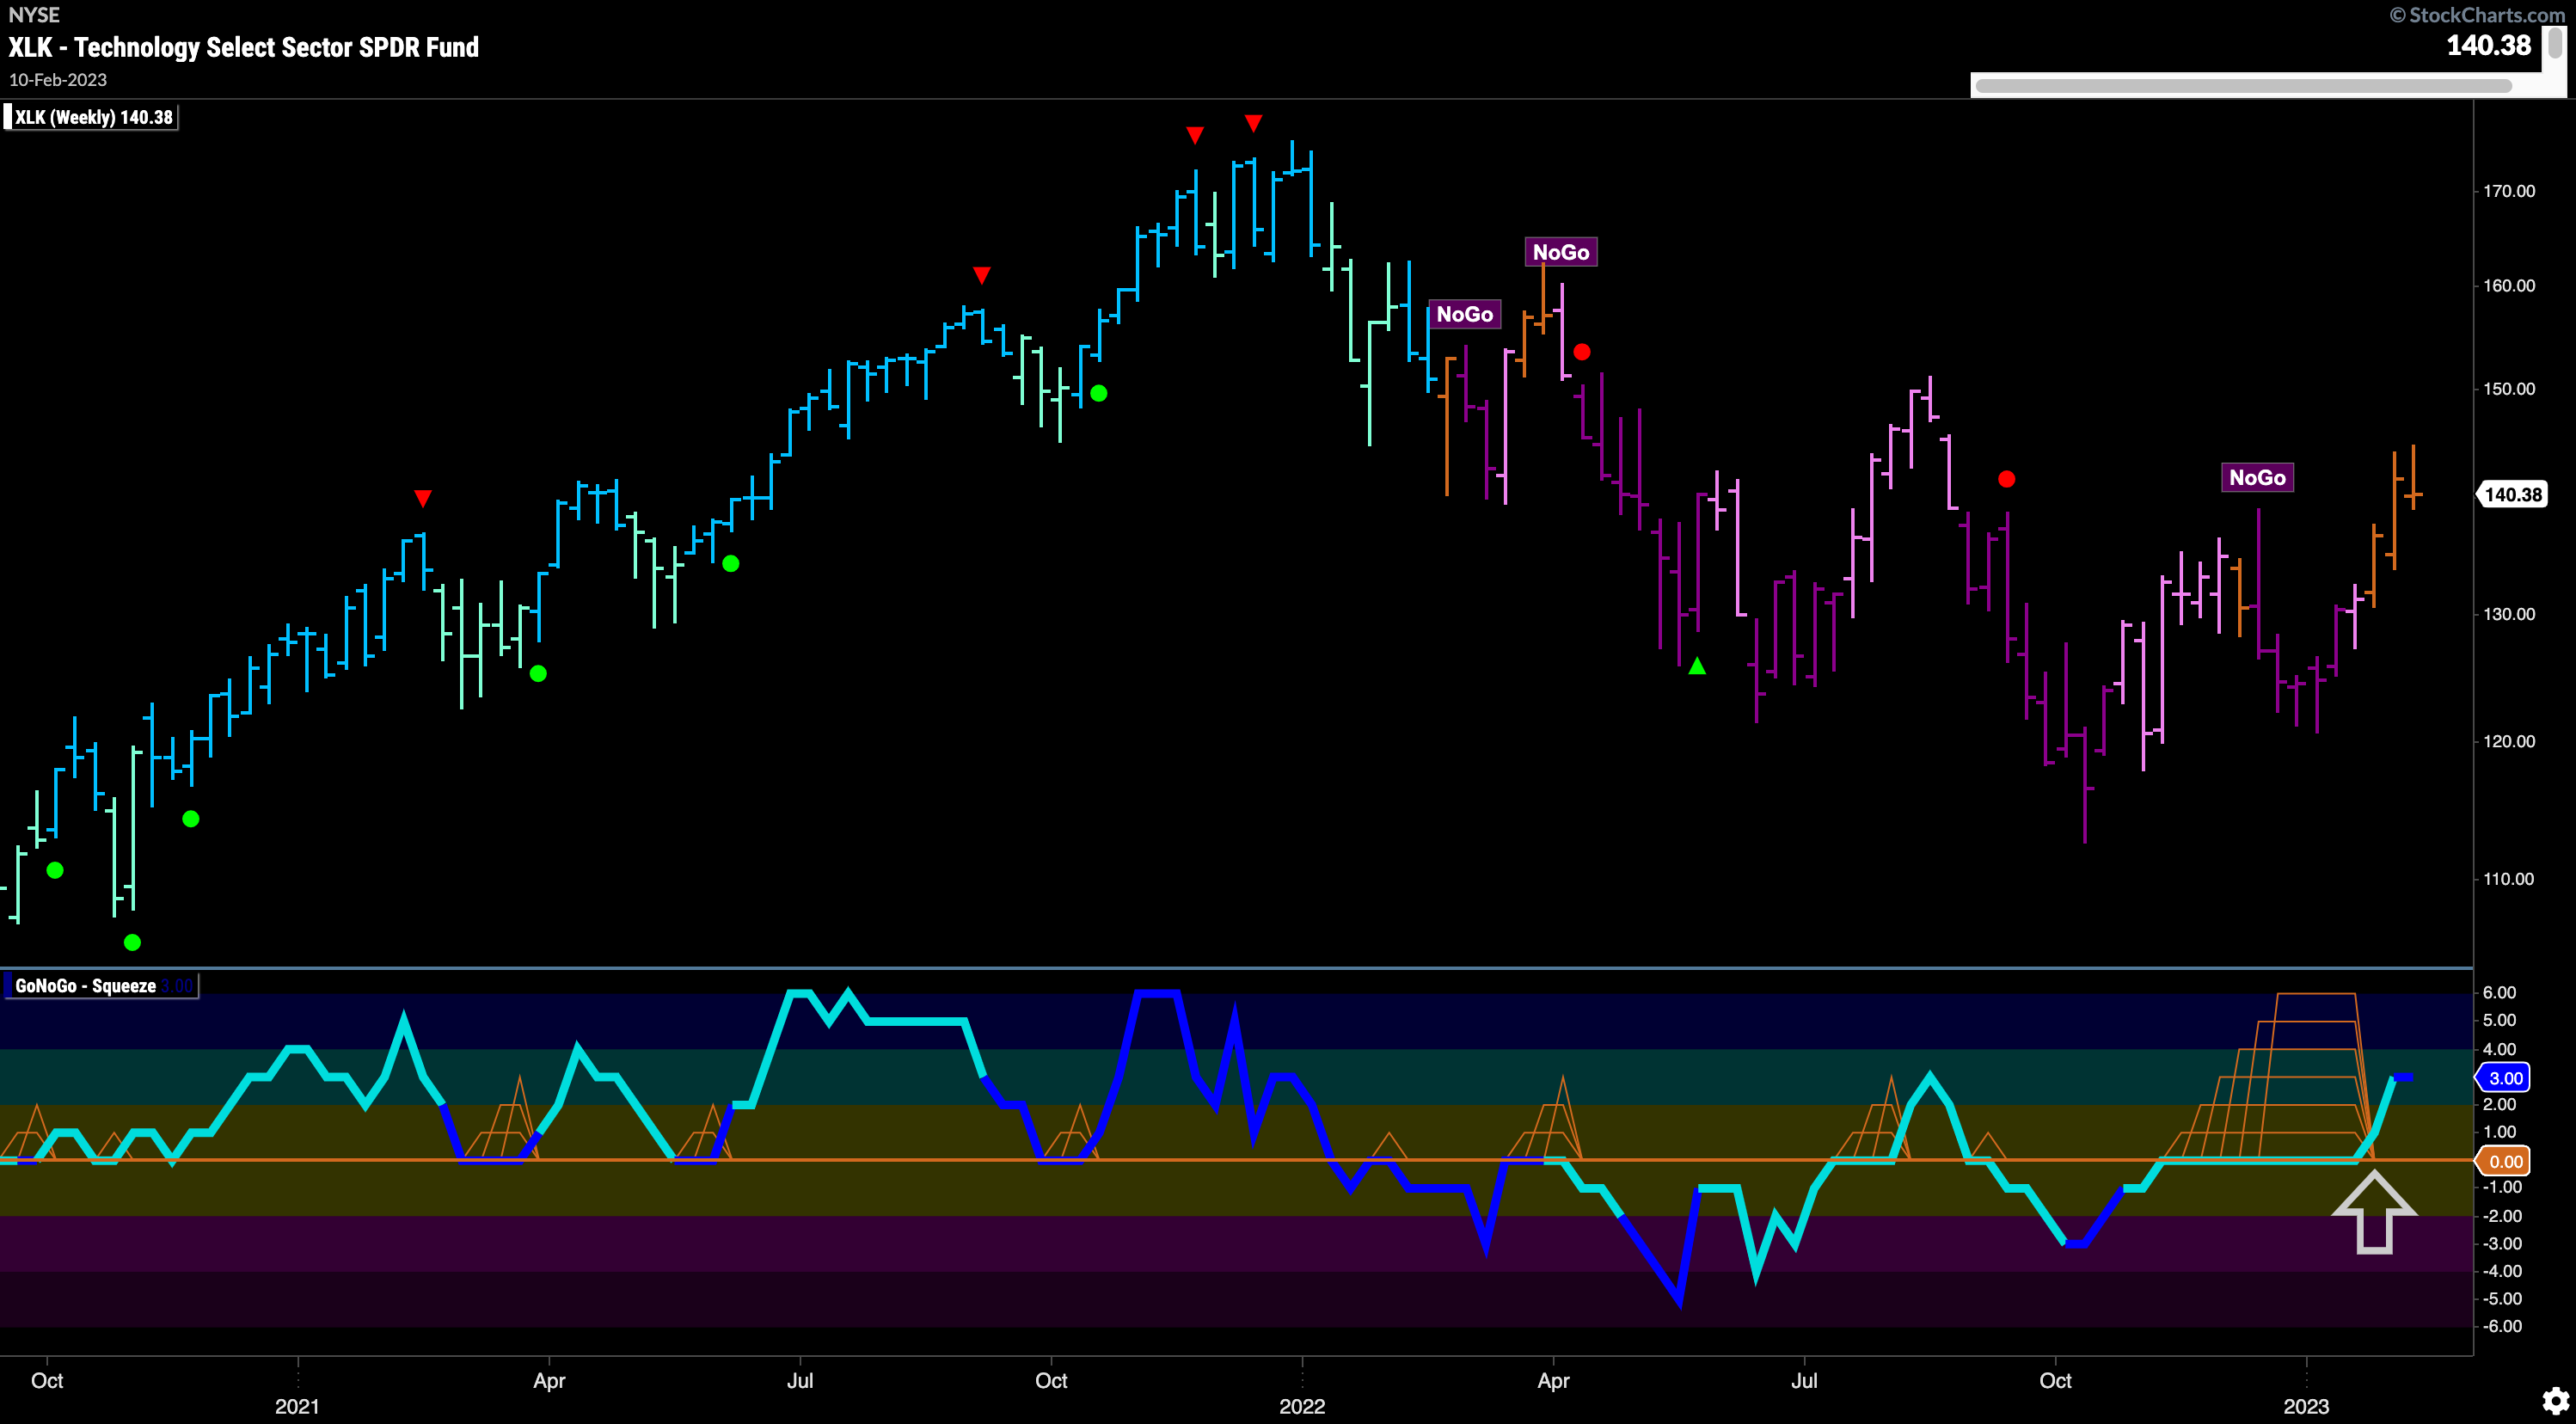
The long term chart of the technology sector shows a positive shift in momentum that may help the call for support on the daily chart. Price has risen to make a new intermediate high over the past few weeks and we see GoNoGo Trend painting a string of amber neutral “Go Fish” bars as it leaves the “NoGo” behind. GoNoGo Oscillator in a powerful move broke out of a max GoNoGo Squeeze and is now in positive territory on heavy volume.
Technology Sector Sub-groups
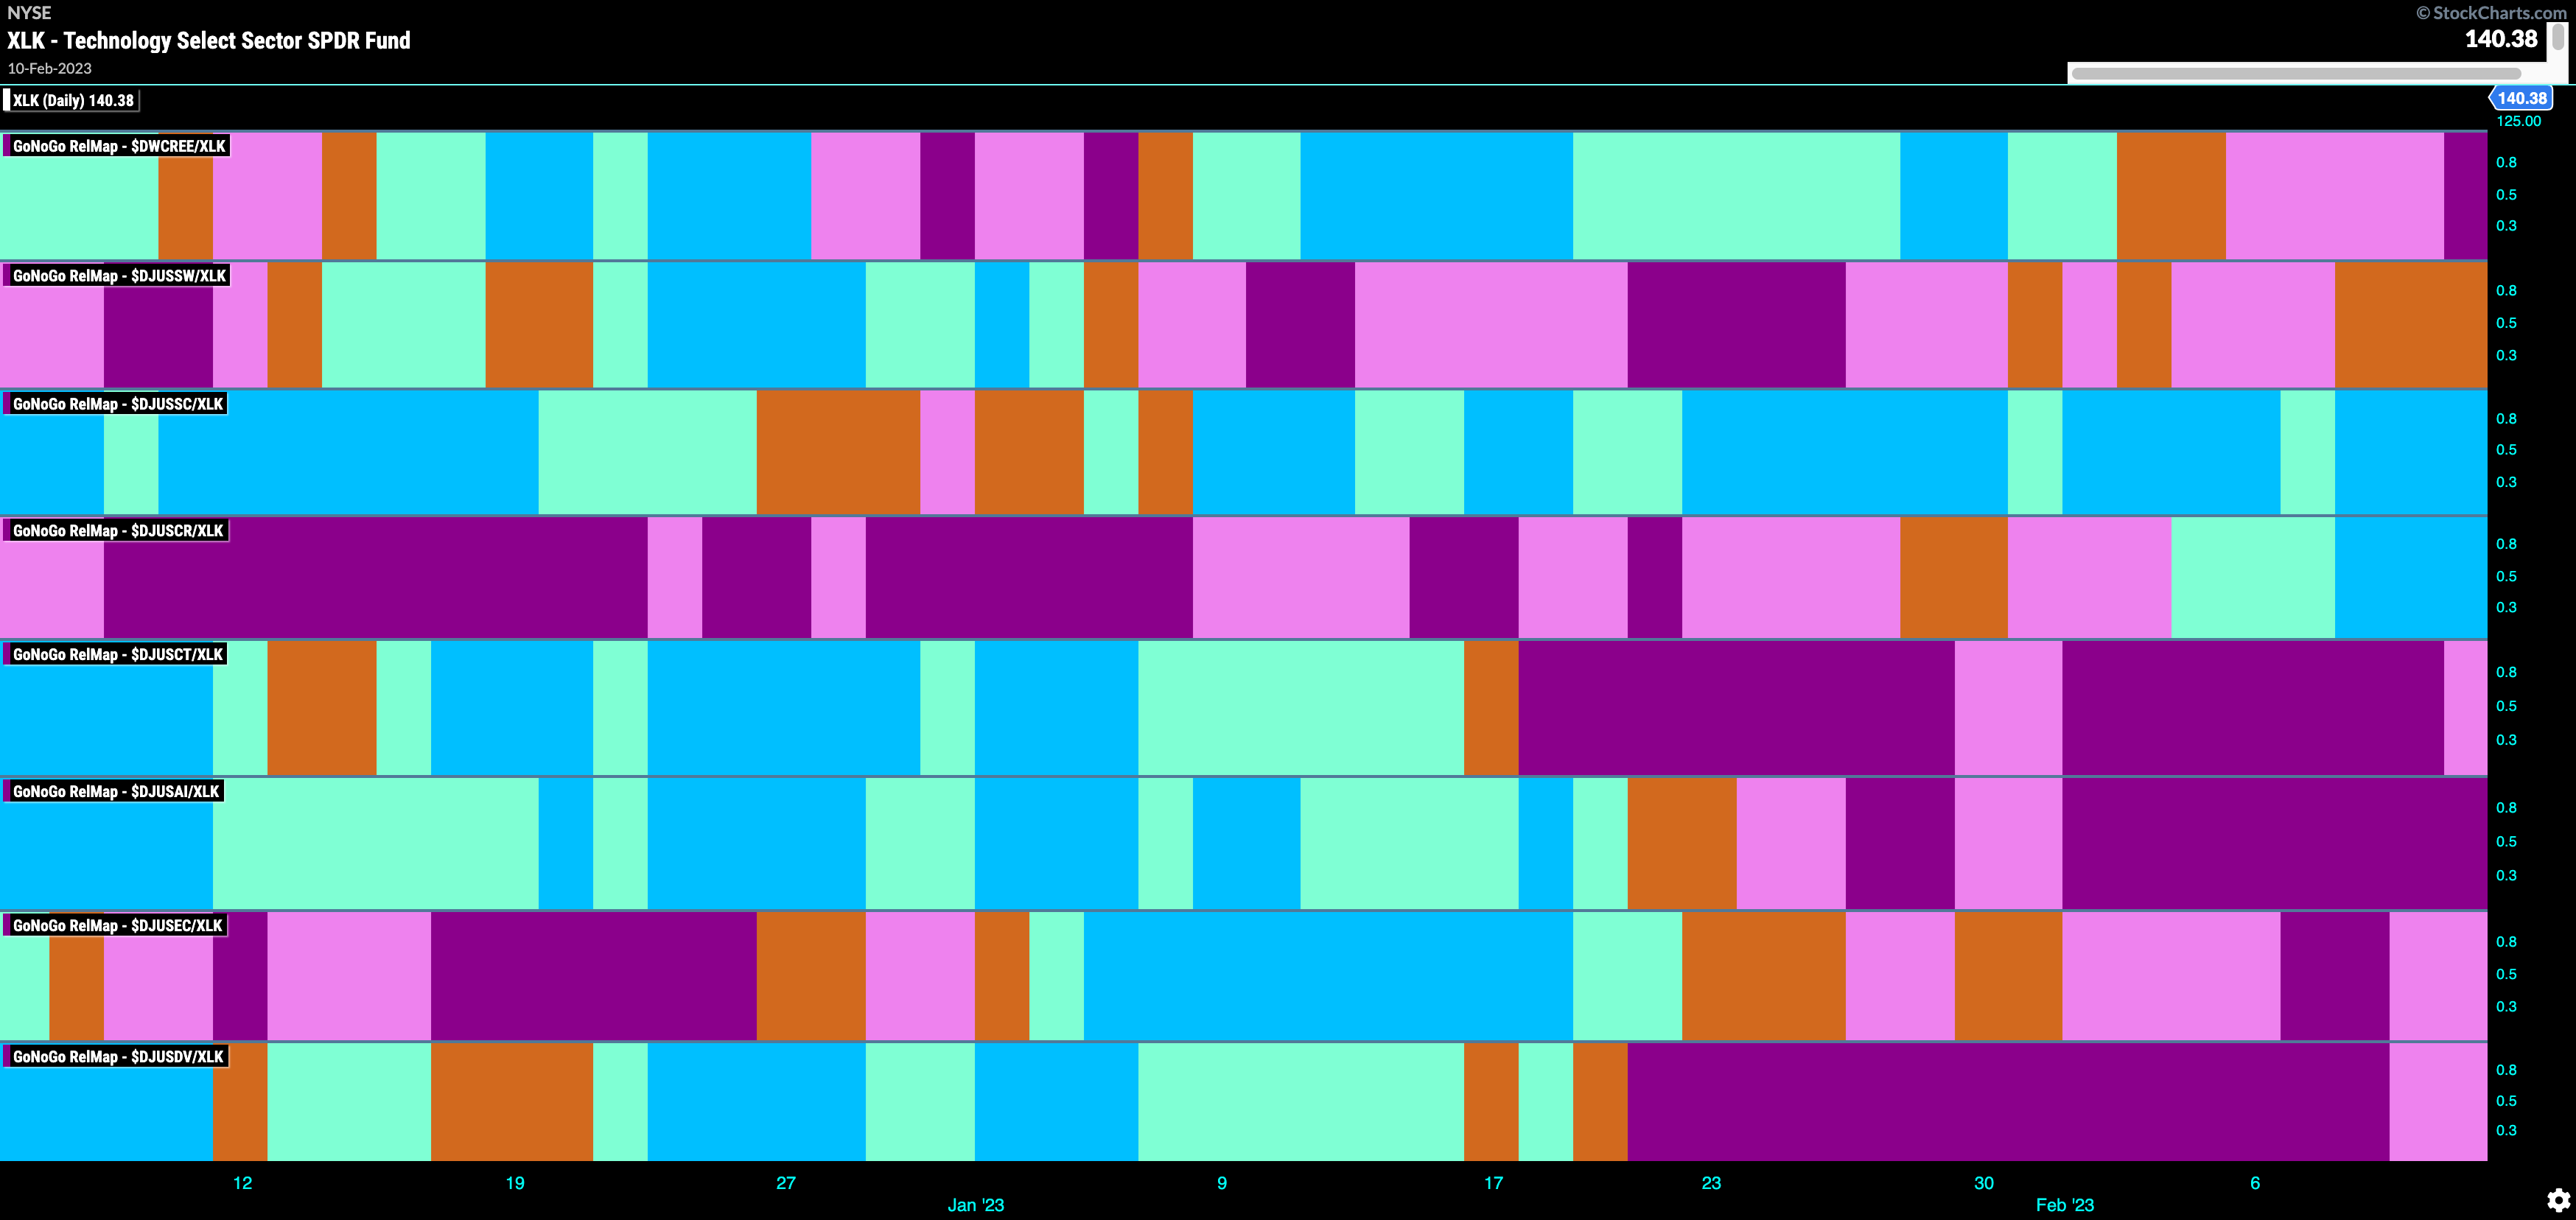
Below is the GoNoGo RelMap of all the industry groups within the technology sector. The GoNoGo Trend concept is applied to the ratio of each sub group to the technology sector. This allows us to really fish where the fish are. From studying the GoNoGo Sector RelMap above, we know that the technology sector is outperforming the S&P 500. We can look under the hood of the sector to find which industries are driving that sector outperformance. Looking at the map, we can see clear outperformance in the 3rd and 4th panel as they are painting strong blue “Go” bars. Most recently entering a strong “Go” trend is the Dow Jones Computer Hardware index, $DJUSCR.
Dow Jones US Computer Hardware Index
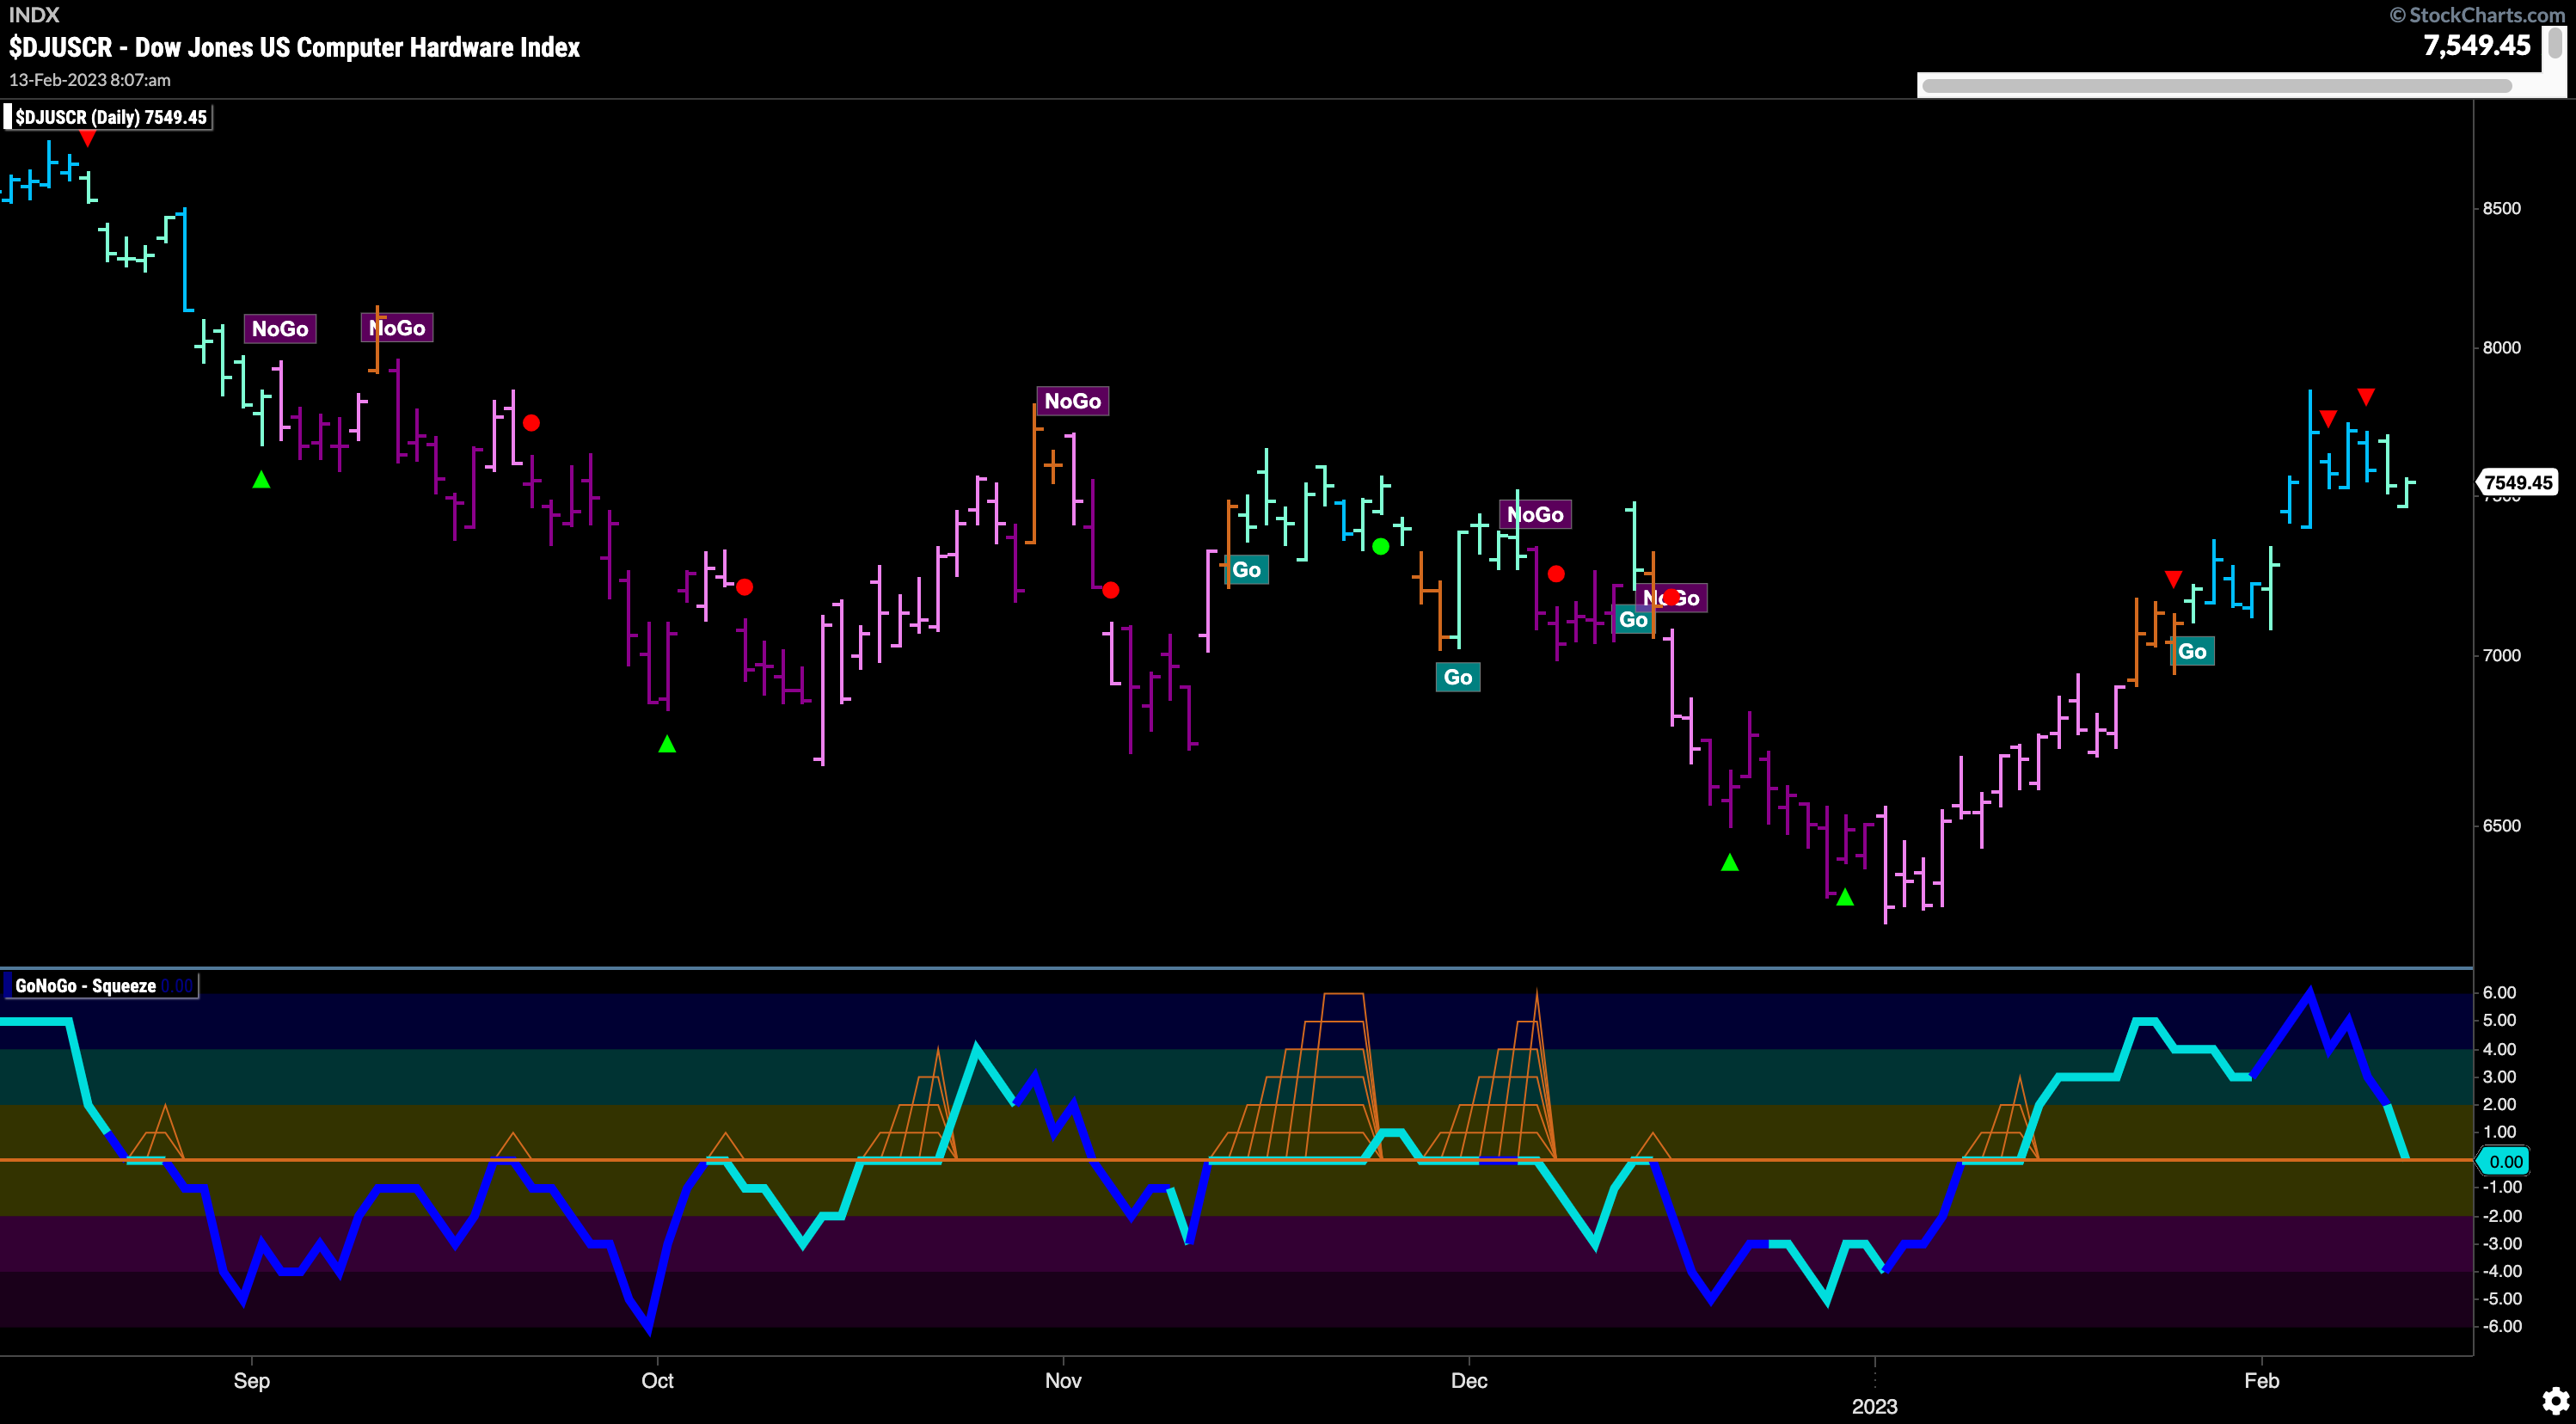
The chart below $DJUSCR with daily data. We can see that after entering a new “Go” trend at the end of last month it has moved quickly to a new high on mostly strong blue “Go” bars. The end of last week saw a small correction as price fell after Go Countertrend Correction Icons (red arrows) and painted weaker aqua “Go” bars. GoNoGo Oscillator has fallen to test the zero line from above. We will look for this level to provide support now, if the “Go” trend is to continue and attack new highs.
DELL Looks to Mount a Charge to Regain Highs
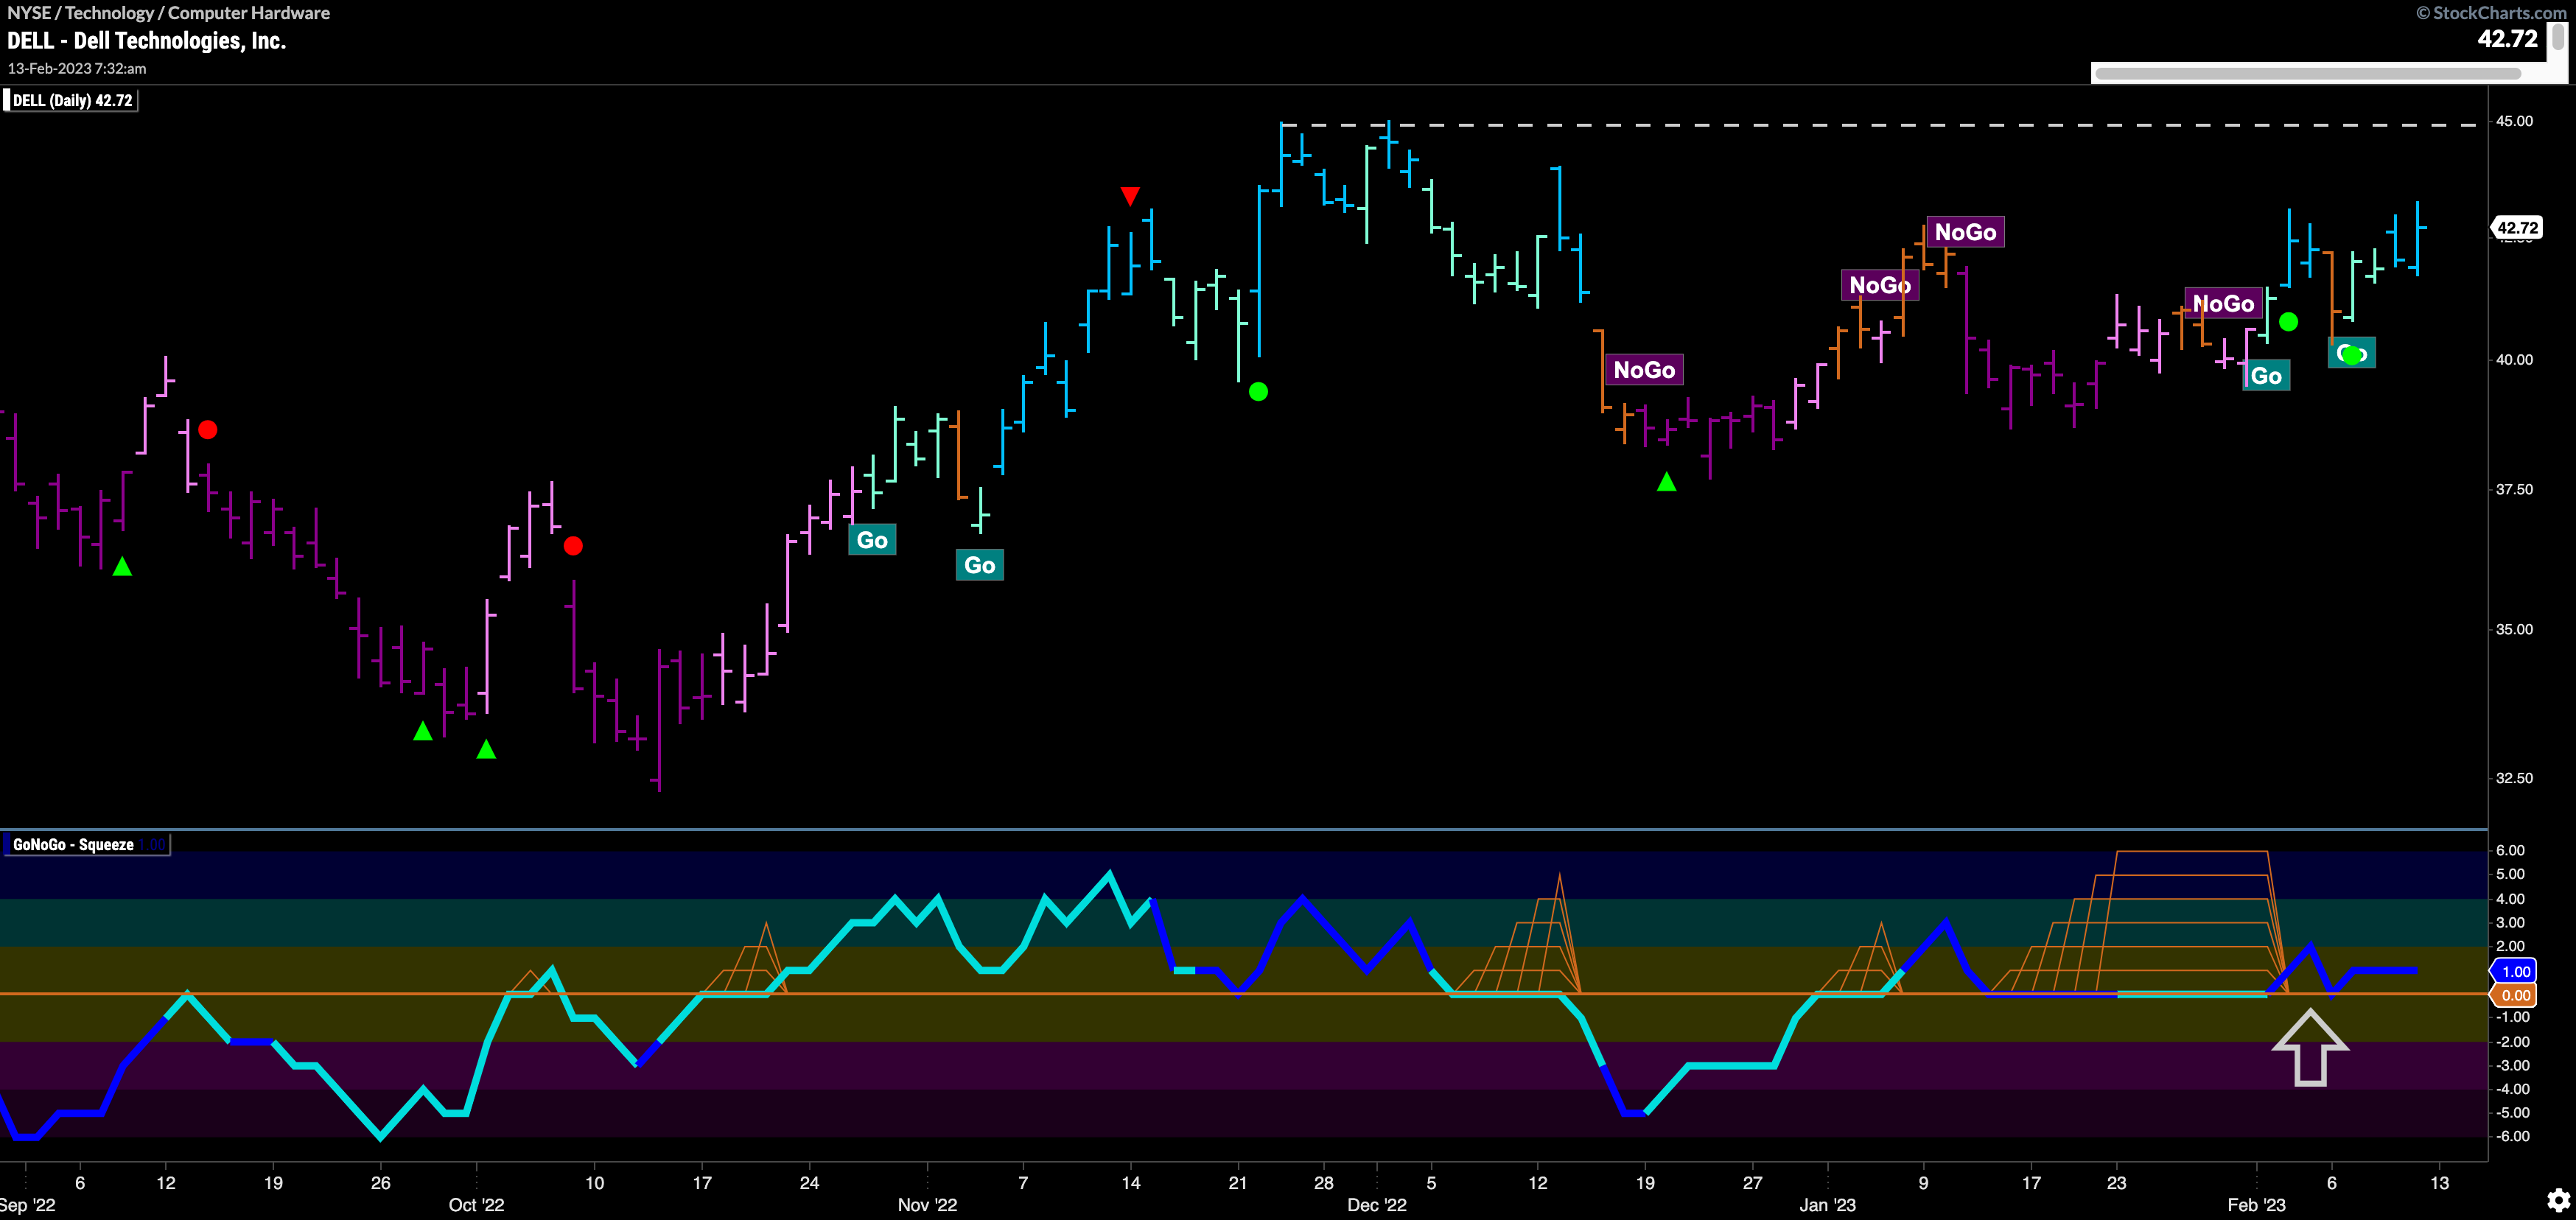
$DELL is a security within the outperforming sub industry group, computer hardware, within the outperforming sector, technology. The chart below shows that it has recently entered a “Go” trend and momentum is on the right side of the trend. GoNoGo Oscillator has been finding support and we can see that it has recently broken out of a very extended max GoNoGo Squeeze on heavy volume. Price is still lower than the highs from the end of 2022 so we will look to see if this newest “Go” trend can persist and whether we will see price move higher and take out those highs.
