Closing on a high note
The S&P 500 and the Dow both posted gains of around 1% and set intraday and closing record highs in the final week of 2021. The technology-heavy Nasdaq Composite lagged finishing flat for the week and nearly 3% below the record it set six weeks ago. Trading activity was exceptionally light, with S&P 500 volumes less than half of recent averages, suggesting seasonal factors and year-end rebalancing activity played influential roles. Welcome to the new year and your first edition of Flight Path from GoNoGo Research where we take a top-down perspective to market trends across asset classes and around the world.
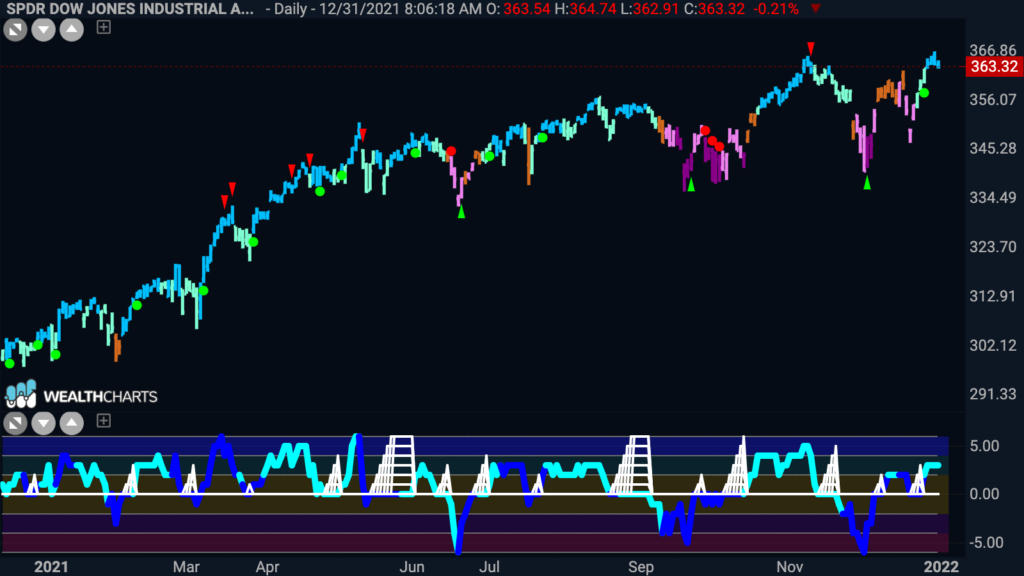
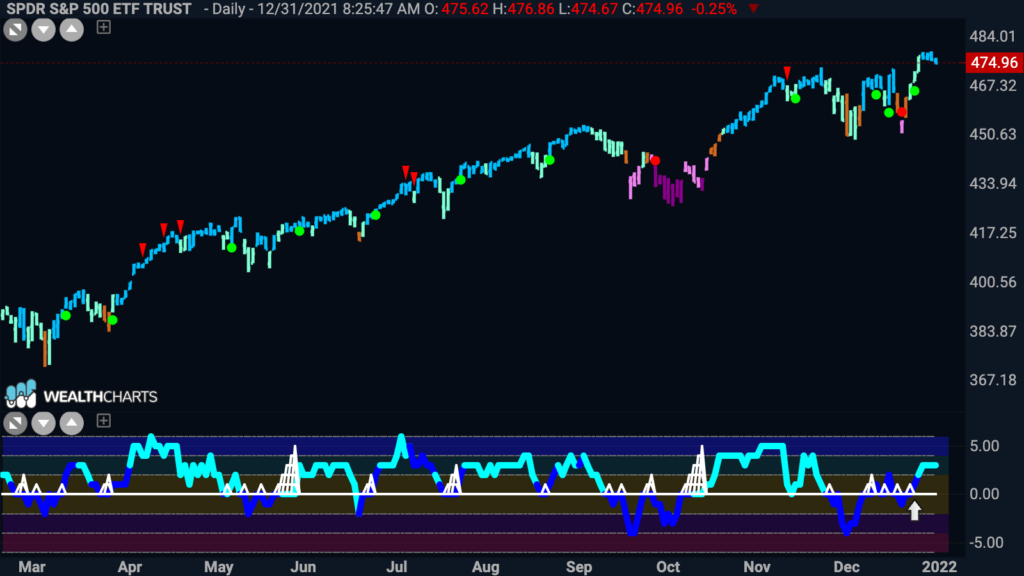
As we look back at what the markets delivered in 2021, many bullish trends are undeniable despite peaks in volatility and rangebound conditions in the second half. Importantly, the Dow Jones Industrial Average joined the club of equity indices finishing the year at all-time highs. Notably, the daily GoNoGo Chart below shows strong “Go” trend conditions and GoNoGo Oscillator is positive. This is bullish for equity investors and for the overall economy in the new year. Remember, markets are a leading economic indicator and prices reflect investors’ expectations for the future.
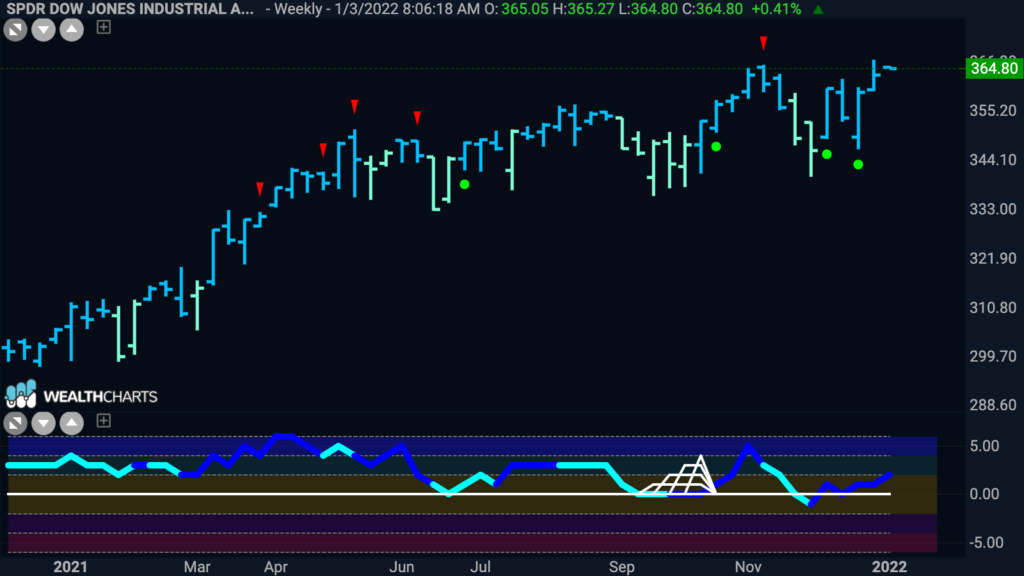
On a weekly basis, that trend was an uninterrupted “Go” through all of 2021:
A record-setting year for the Bulls
Despite the persistent waves of coronavirus infections threatening further lockdowns and rising inflation forcing the hand of central bankers monetary policy, US Equities were as unflappable as the 1995-96 Chicago Bulls. 2021 was the third consecutive year of double-digit percentage gains for the S&P 500 and the index posted 70 record closing highs in 2021. Adding in results from 2019 and 2020, it’s been the best three-year run for the major U.S. stock indexes since the three-year period that ended in 1999.
That record-setting run is pronounced: “ˈbo͝oliSH.” And this is what the daily GoNoGo trend looks like:
Leading and Lagging Sectors
However, what is visible at the index level does not tell the story of market trends at the sector level which revealed wide disparities in U.S. equity performance. Rotating leadership by style and sector made 2021 a very difficult year for active managers.
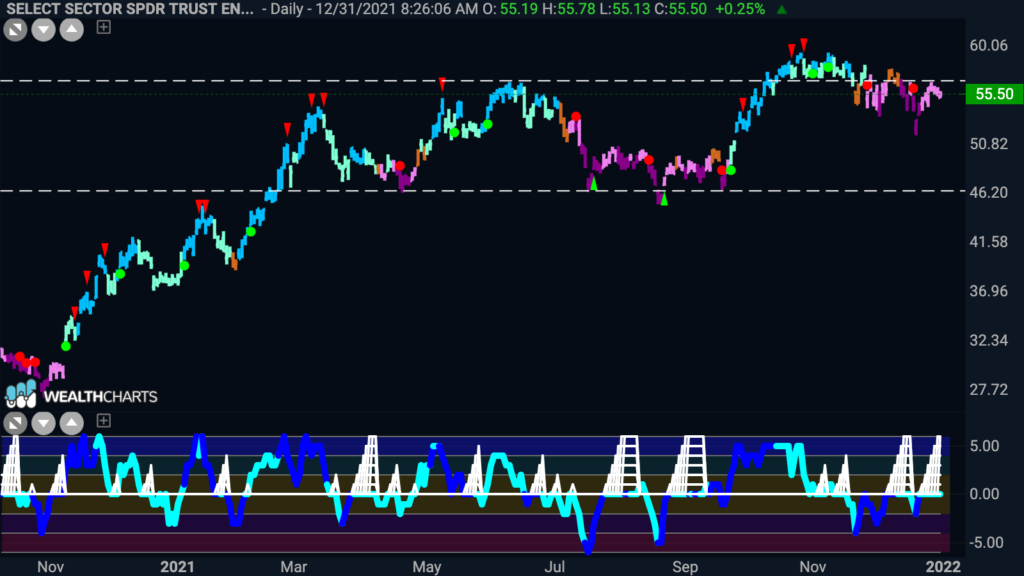
On a total return basis, Energy $XLE was the top-performing S&P 500 sector at nearly 55%, followed by real estate $XLRE (46%) and information technology $XLK (35%). Unfortunately, all the gains for the energy sector were captured in the first half of the year and $XLE has been trapped in a range since the June highs. As if that wasn’t frustrating enough to investors, the energy sector managed a false breakdown in August and a failed breakout in late October:
Utilities generated the weakest result with a nearly 18% gain, followed by consumer staples (19%) and industrials (21%).
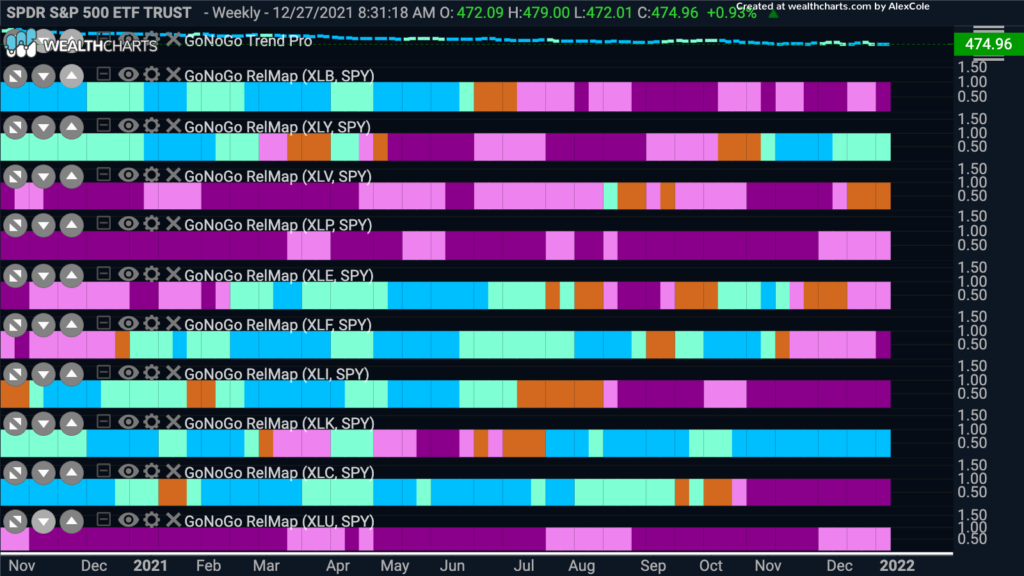
From a relative perspective, the GoNoGo RelMap below shows how the sector’s performance relative to the index trended through the year on a weekly basis:
Growth over Value? …Depends on Market Cap
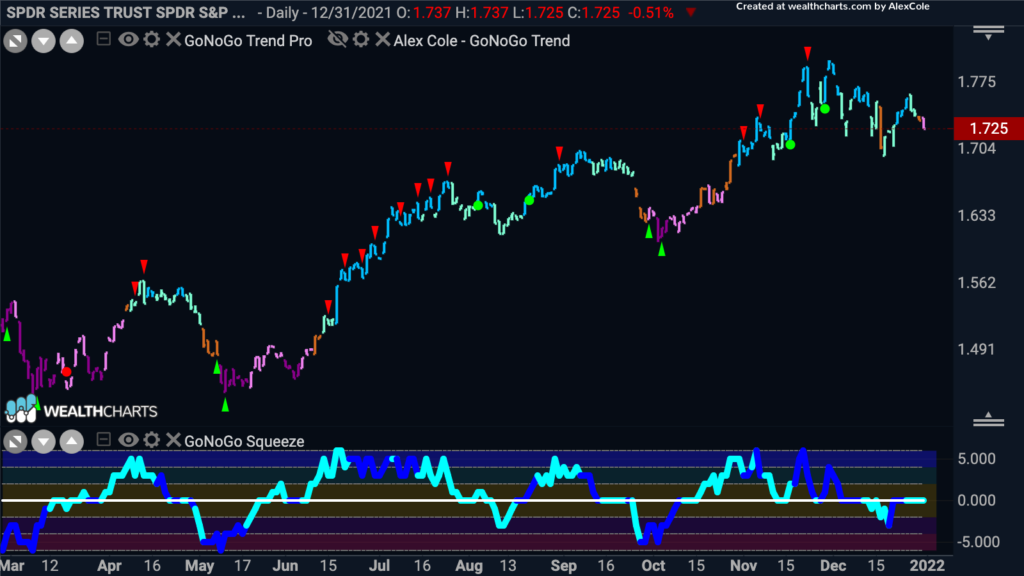
Rotation from growth equities to cyclicals in Feb/Mar and Again in Sep/Oct put many active managers in turmoil. But as we can see in the daily GoNoGo ratio chart below of $SPYG/SPYV, growth ultimately outperformed value in the large-cap category generating a 20% margin off the March lows (+7.32% annual):
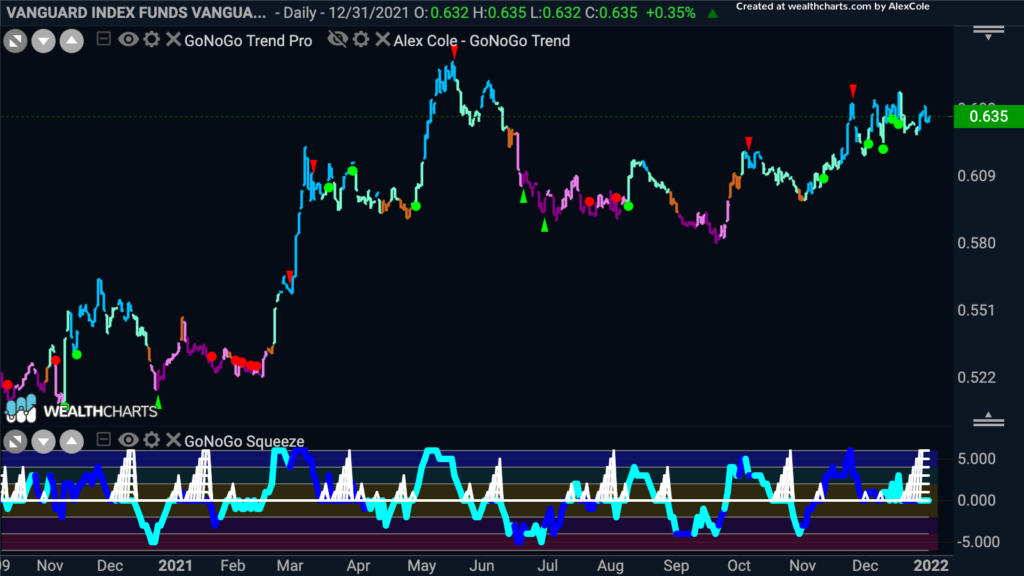
Although growth stocks outperformed their value counterparts in 2021 at the large-cap level, it was the opposite for small caps, where the margin of outperformance for value stocks was huge. See the chart below of Vanguards Small Cap Value ETF relative to the Small Cap Growth ETF $VBR/VBK. Value outperforming by nearly 20% this year and ending with a setup that suggests a high probability for continued outperformance ahead. The daily trend of this Value over Growth ratio is a strong “Go” and GoNoGo Oscillator is riding the zero-line creating a Max Squeeze condition. Investors will need to see momentum breakout to the upside for this Go trend to continue.
Potential challenges to the “Go” Trends in 2022
Will it be a Coronavirus Groundhog Day in “twenty twenty too?”
Despite daily coronavirus cases rising to record highs this holiday season, fears about the omicron variant appear to be waning. Johnson & Johnson $JNJ said data demonstrated its booster shot was 85% effective against hospitalization in South Africa when the Omicron variant was dominant. Hospitalization rates remained contained in the US, and, on Wednesday, the CDC reduced the recommended quarantine period for asymptomatic people who have tested positive from ten days to five days. The FDA, meanwhile, is expected to expand eligibility for Pfizer’s $PFE booster shot to 12- to 15-year-olds this week.
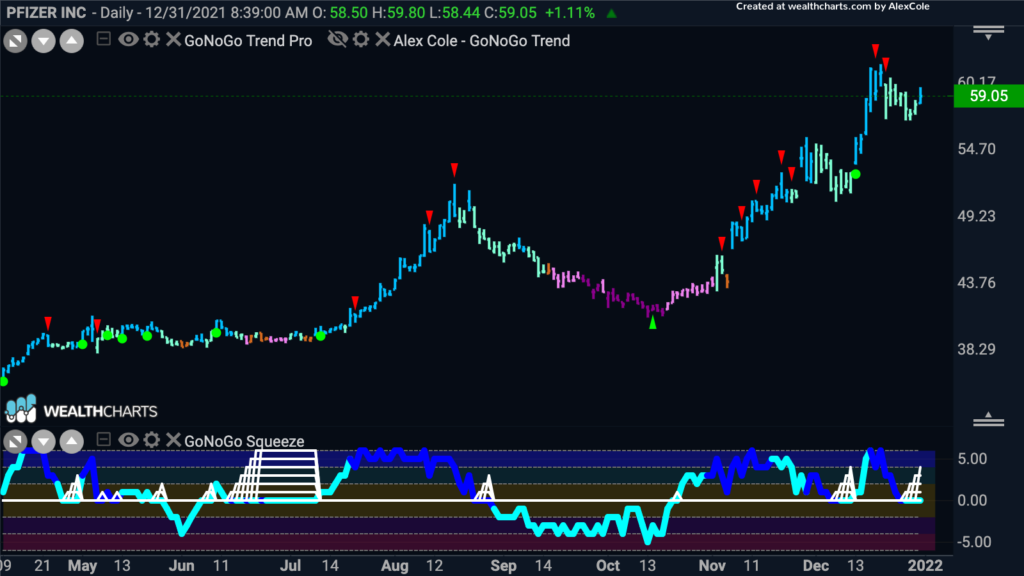
The healthcare sector has had strong performance into year-end and the daily GoNoGo Chart below of Pfizer, Inc. shows a very strong “Go” trend and the beginning of a volatility squeeze as we enter 2022”
Supply Chain Pressures Persist
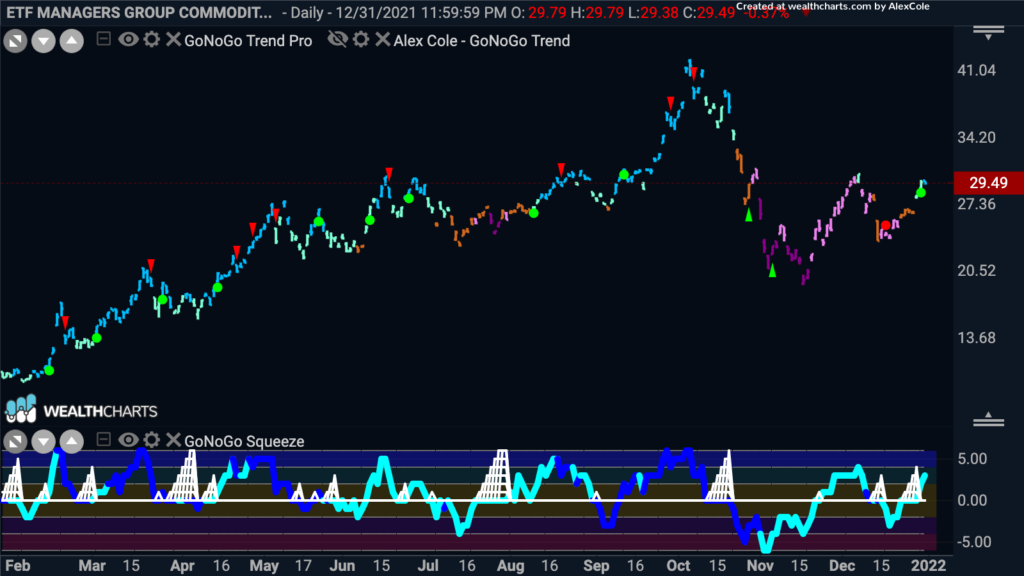
While much of the world was rebounding from the COVID-19 crisis’ economic downturn, global supply chains continued to face pressures from pandemic-prompted changes in consumption patterns, surging demand for goods, shortages of workers, and pre-existing political pressures—which led to high shipping volumes and freight costs. See the GoNoGo Trend of Breakwave Dry Bulk Shipping ETF $BDRY below which was up over 280% in 2021:
After consumer spending surged in September and holiday shopping began as early as October, many market participants foresee the merchandise supply-and-demand imbalance enduring into 2022.
Airlines in Nosedive
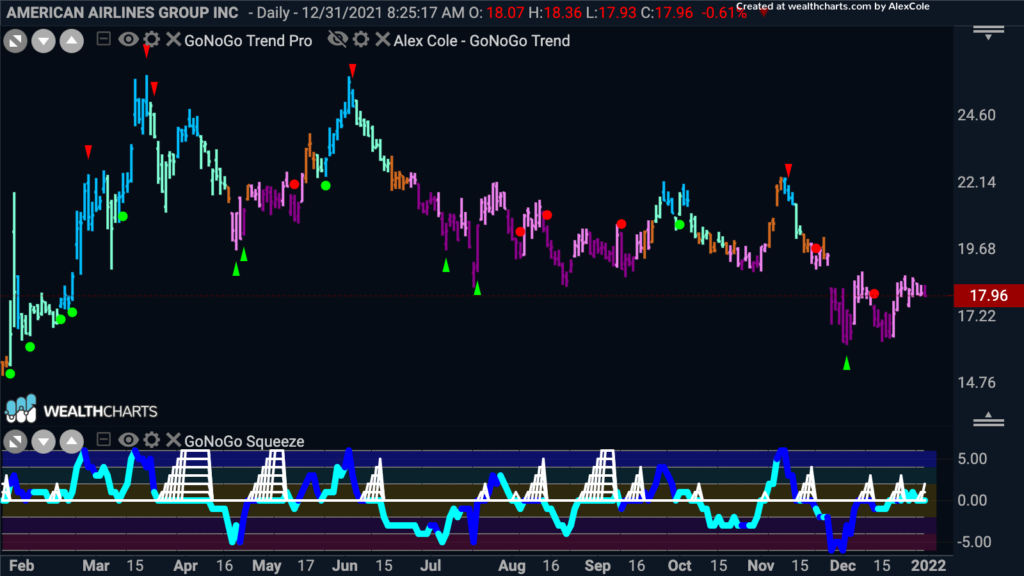
While tight supply can drive prices up in shipping and input materials costs, labor shocks from coronavirus can wreak havoc on various service industries. Crew shortages caused by the virus led to flight cancellations and sharp declines in airline stocks through the holiday season. See the daily GoNoGo Chart of $AAL, American Airlines as a representation– below:
Word of the day: Inflation
While the global hard stop triggered by coronavirus and its associated public health policies proved a difficult operating environment, the global restart through 2021 has generated different challenges.
Clearly, the macroeconomic recovery has been positive. Vaccines are easing health risks for workers and leisure activities that drive the service economy. Aggressive fiscal and monetary policies are helping companies avoid drastic labor cuts, providing supportive financing conditions, and boosting revenues.
Nonetheless, the sheer scale of pandemic-related disruption and altered consumption patterns, along with existing political pressures on supply chains, have created considerable difficulties. Input and freight costs have risen dramatically as shown above. Forgetting about the 1300’ Evergreen vessel blocking up the Suez Canal in March, shipping volumes have surged and created other bottlenecks around the world such as the gridlock at the port of Los Angeles this Fall. And finally, signs of upward pay pressure are particularly apparent in North America amid strong growth and rising costs. All of these factors contribute to the consensus view that inflation is not transitory, but will be a persistent issue to be addressed by central bankers’ monetary policies in 2022.
Hedging Against Inflation
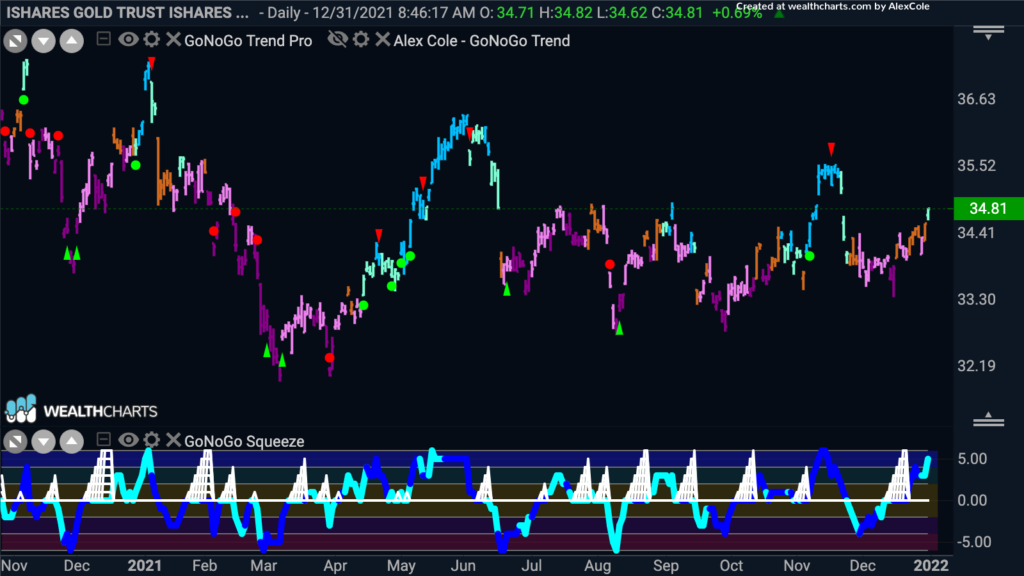
Gold is the first asset investors have turned to as a store of value during past inflationary regimes. Unfortunately, the yellow rocks have provided no help to portfolios this past year. Instead, $IAU traded through a rangebound mess ending the year with its steepest price decline since 2015 ending 2021 trading at nearly $1,830 per ounce, or more than 3% below its year-end 2020 price.
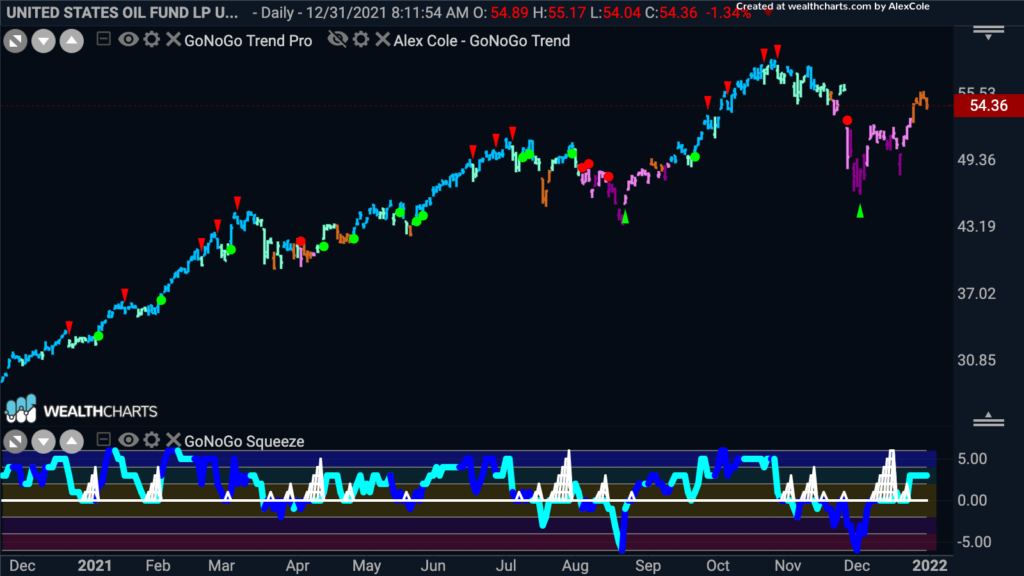
We’ve written extensively about the energy space in 2021. Oil ($USO) provided persistent “Go” trends through July but sent investors through wild swings in the second half of the year, ending near the highs. Commodities tend to be inflation resistant but due to the sensitivity of demand and the frequent uncertainty about government shutdowns, oil has been a challenging market.
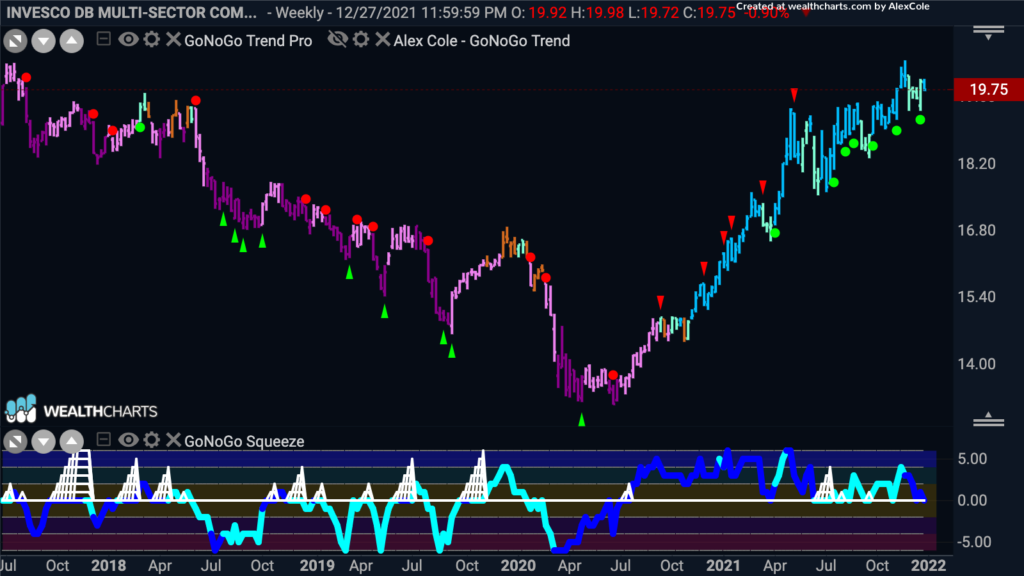
The most stable “Go” trend providing an inflation hedge is a diversified basket of agricultural commodities, such as $DBA. The weekly chart below shows a multiyear trend reversal with upside room to prior highs, but without the lack of utility (gold) or the volatility of demand (oil).
Forecasters of 2022 Should Look to the Credit Markets
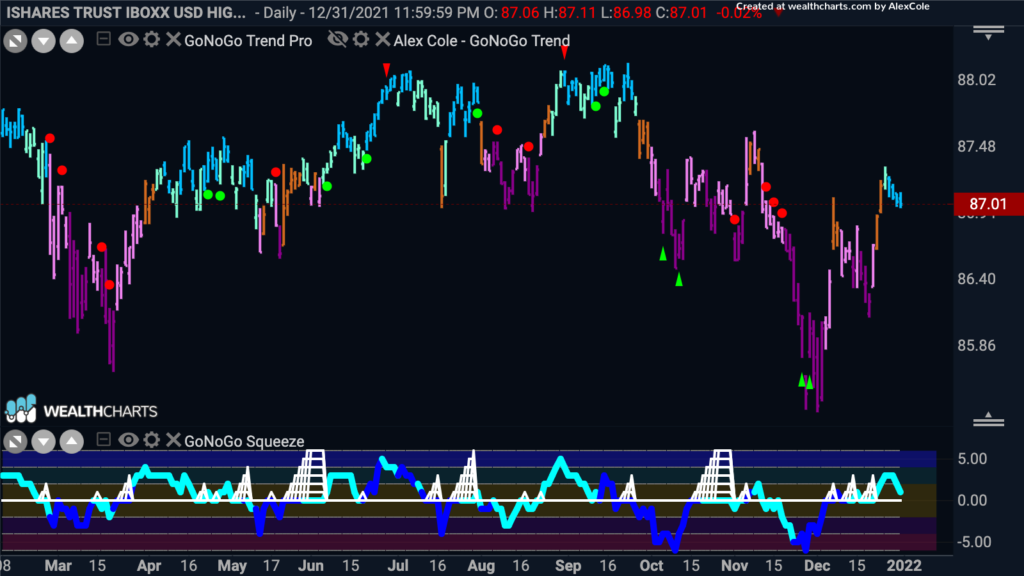
Historically, credit markets have been a leading indicator of equity performance. We can look to the high-yield market which shares more characteristics with equities for a signpost of what trends may look like for major US indices in the first half of 2022. The daily GoNoGo Chart below of $HYG finishing 2021 on strong blue “Go” bars adds weight to the evidence of positive equity trends ahead.
Structural Changes
Retail trading has surged in the U.S. since November 2019, when Charles Schwab and other brokerages slashed commissions on U.S-listed stocks and equity options to zero. With millions of individuals confined at home, federal stimulus checks in hand, and unprecedented ease of access to electronic trading platforms, the pandemic amplified this trend in 2020 and through 2021. The influence of retail traders on the market is often overlooked as their individual accounts make little impact. But collectively, 100 million amateur traders that are narrowly focused on a few mega-cap growth companies can have a huge impact on market leadership.
The most visible effect of the changing demographics of market participants appeared in 2021s “meme-stock mania”, when thousands of individual investors banded together through social media to counter hedge funds, causing elevating volatility and leading to some significant losses for players that had shorted certain stocks or silver futures.
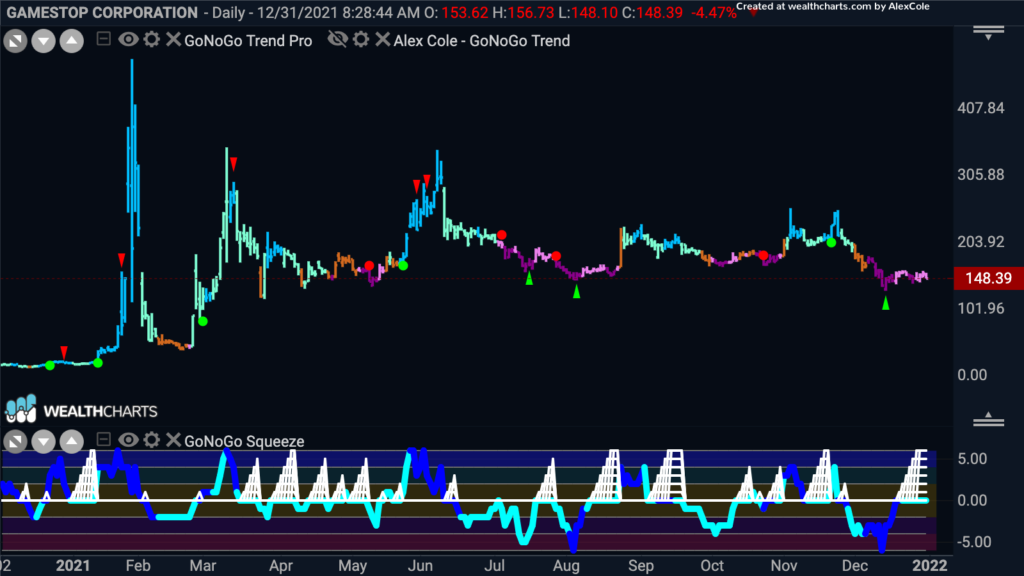
Recent headlines have reflected the extraordinary behavior of GameStop Corp. The company’s stock rose from $18.84 at year-end 2020 to $325 at the close on Jan. 29, 2021, then declined to $90 in the first two trading days of February. Despite its 1,625% total return in January, GameStop remained a relatively small company. Its total market capitalization at January’s close was only $21.2 billion. At year-end, GameStop is still trading more than 750% above its stock price at the start of 2021!
Digital Assets
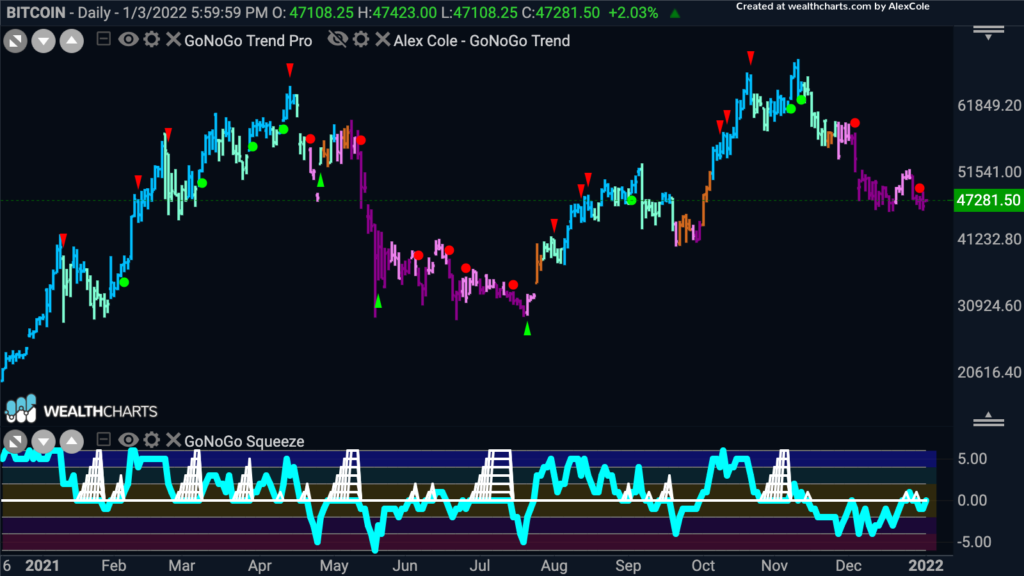
Cannot ignore the attention crypto assets drew through 2021. According to Coinbase, between 2012 and November 2021, Bitcoin has gained 311,914%! Perhaps more importantly, the total cryptocurrency market cap is $2.79 trillion, or equivalent to the 8th largest economy globally. 1.2 trillion of that is represented in Bitcoin.
It is also worth noting how liquid the crypto markets have become. The average daily cryptocurrency trade volume has risen dramatically to $130 billion per day.
The headlines are endless. We hear every week about new regulations by the securities exchange commission, Gary Gensler’s crackdown, and even China’s declaration that all Cryptocurrency transactions are illegal this September.
Regardless of cybercriminals activity, schemes like Dogecoin, uncertainty around taxation, the launch of a Bitcoin ETF on the NYSE, or constant speculation over the adoption of cryptos as form of payment at retailers or by institutional asset managers as a store of value – digital assets are not going away.
Bitcoin’s volatility is even more reason for investors to capture large trends, but not blindly “HODL.” See the daily GoNoGo Chart below of $BTCUSD which is up over 60% this year, but -30% off its November highs:
