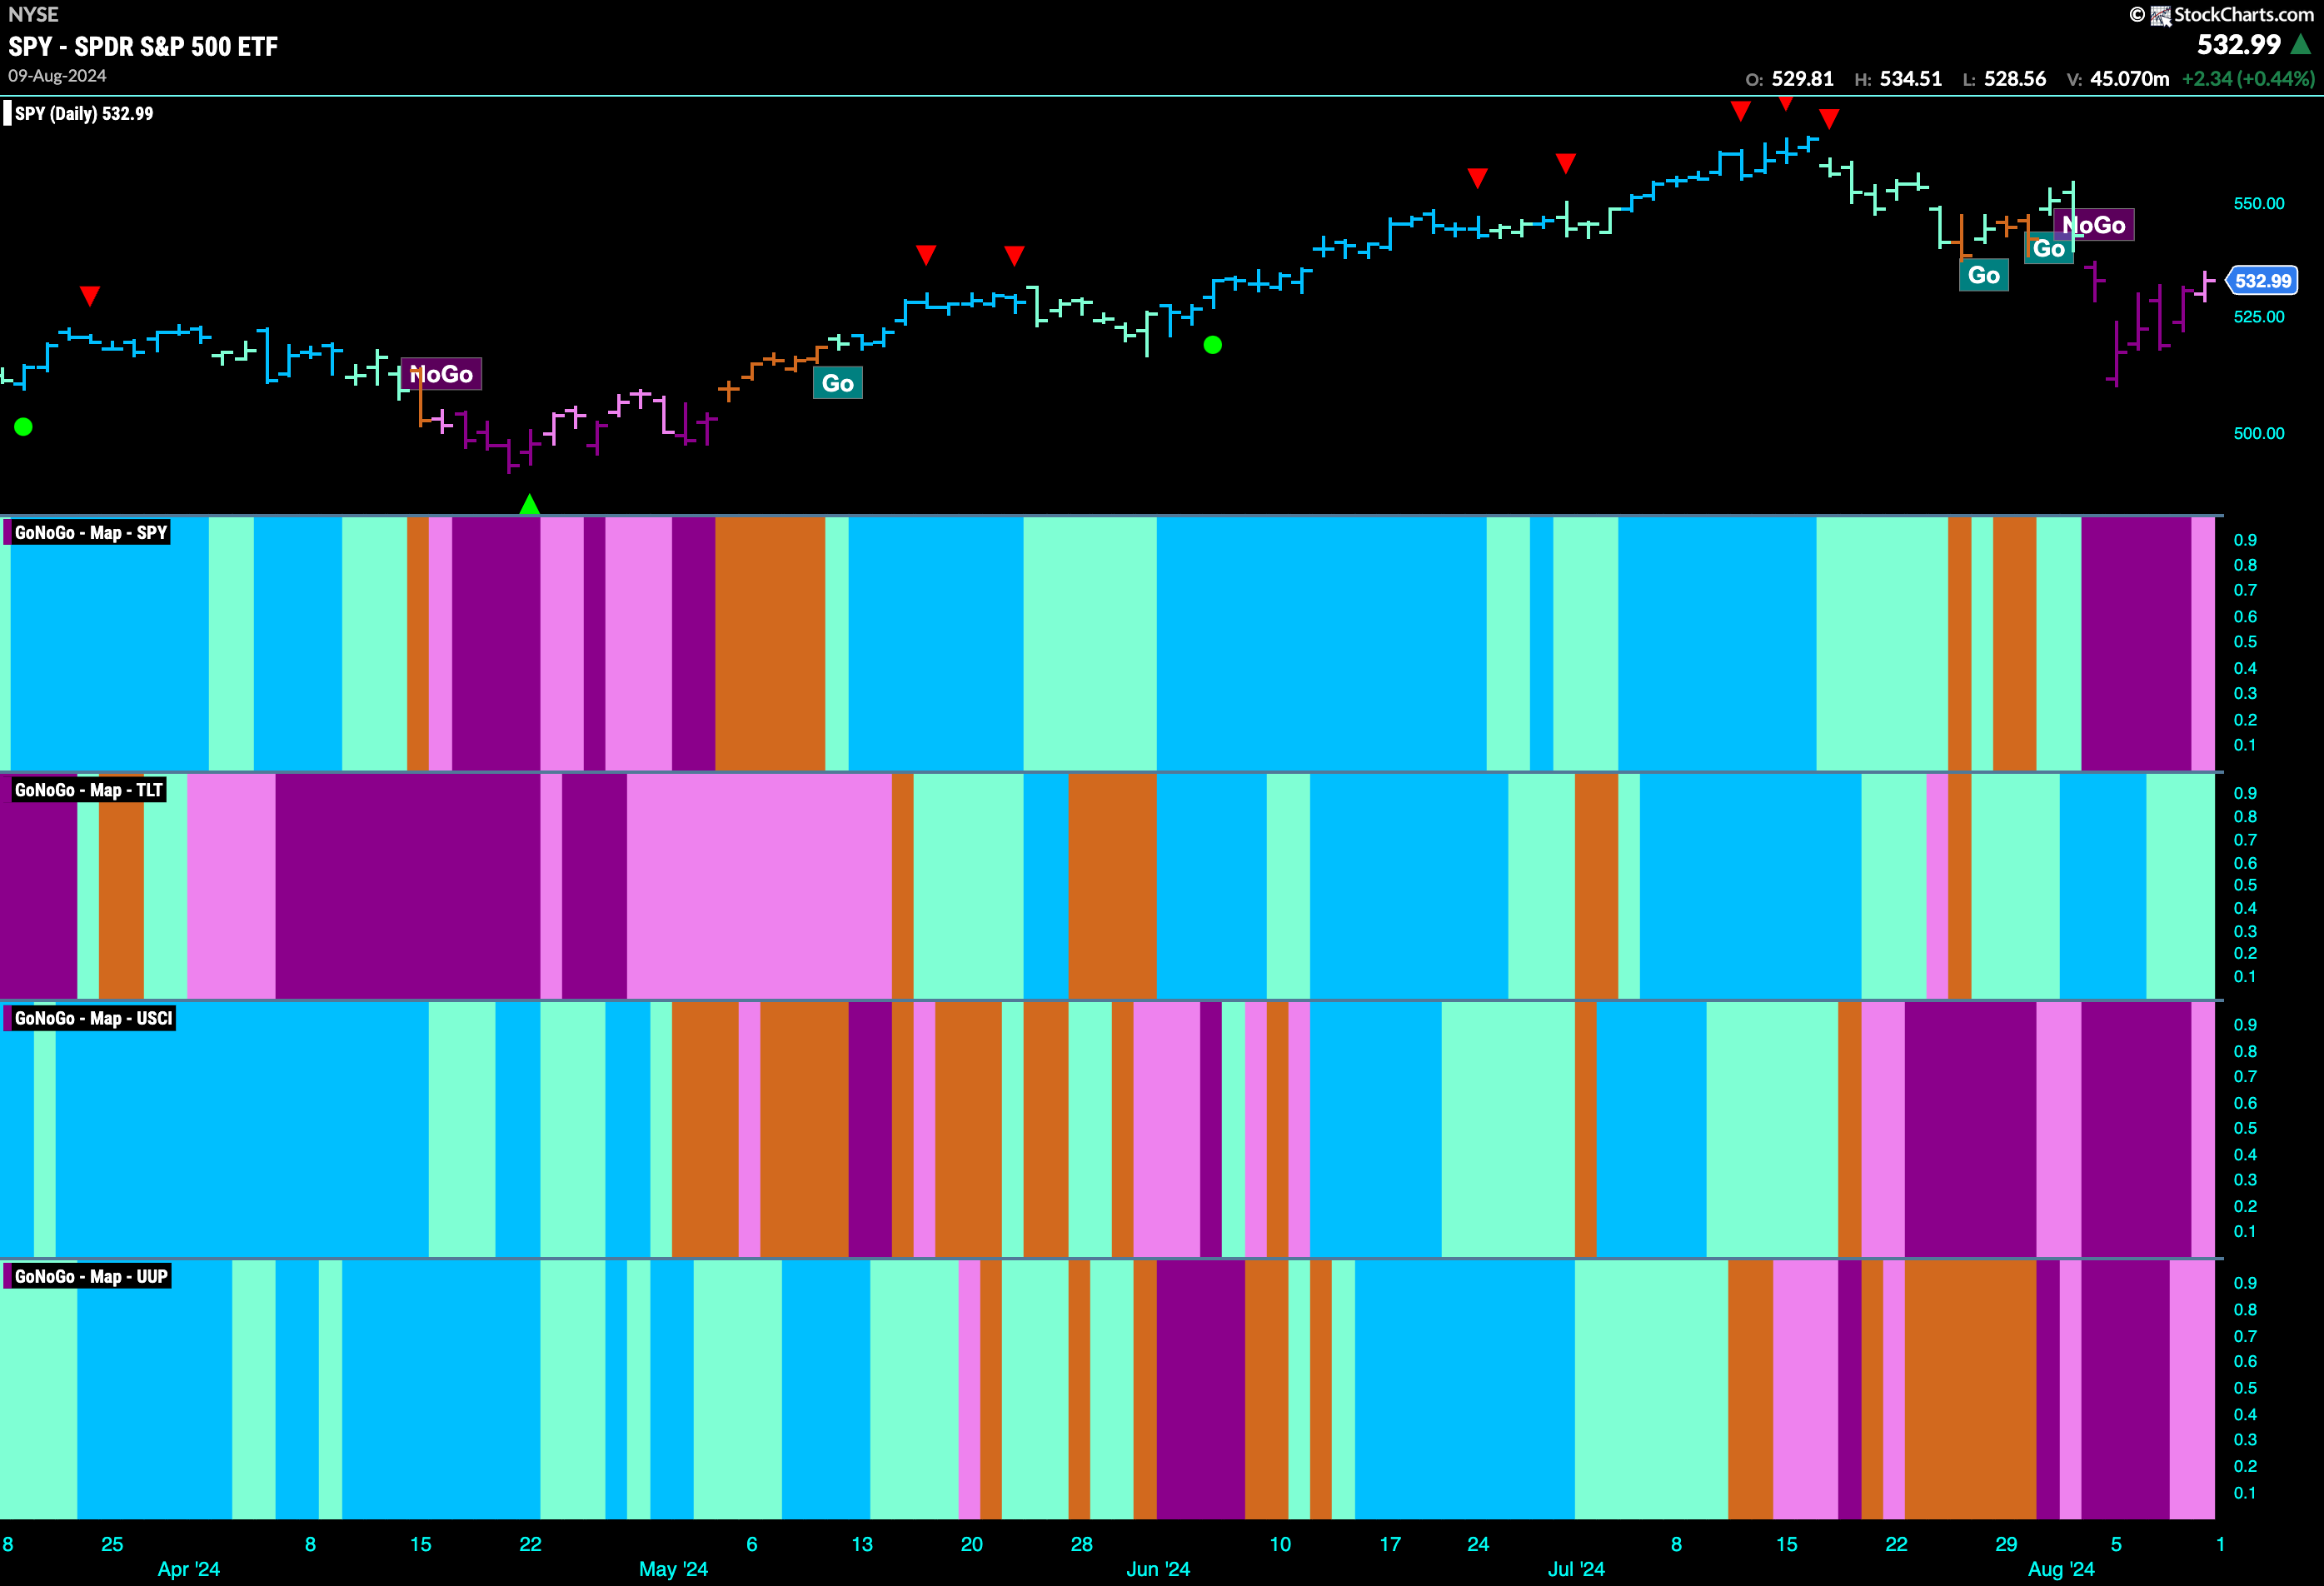
Good morning and welcome to this week’s Flight Path. Equities remained in a “NoGo” trend this past week however after gapping lower on Monday, prices rallied until on Friday GoNoGo Trend painted a weaker pink bar. Treasury bond prices painted weaker aqua “Go” bars as the trend remained in place. U.S. commodity index hung on to its “NoGo” trend with a pink bar at the end of the week. The dollar also remained in a “NoGo” trend painting weaker pink bars.
$SPY Rallies but Not Yet Out of “NoGo”
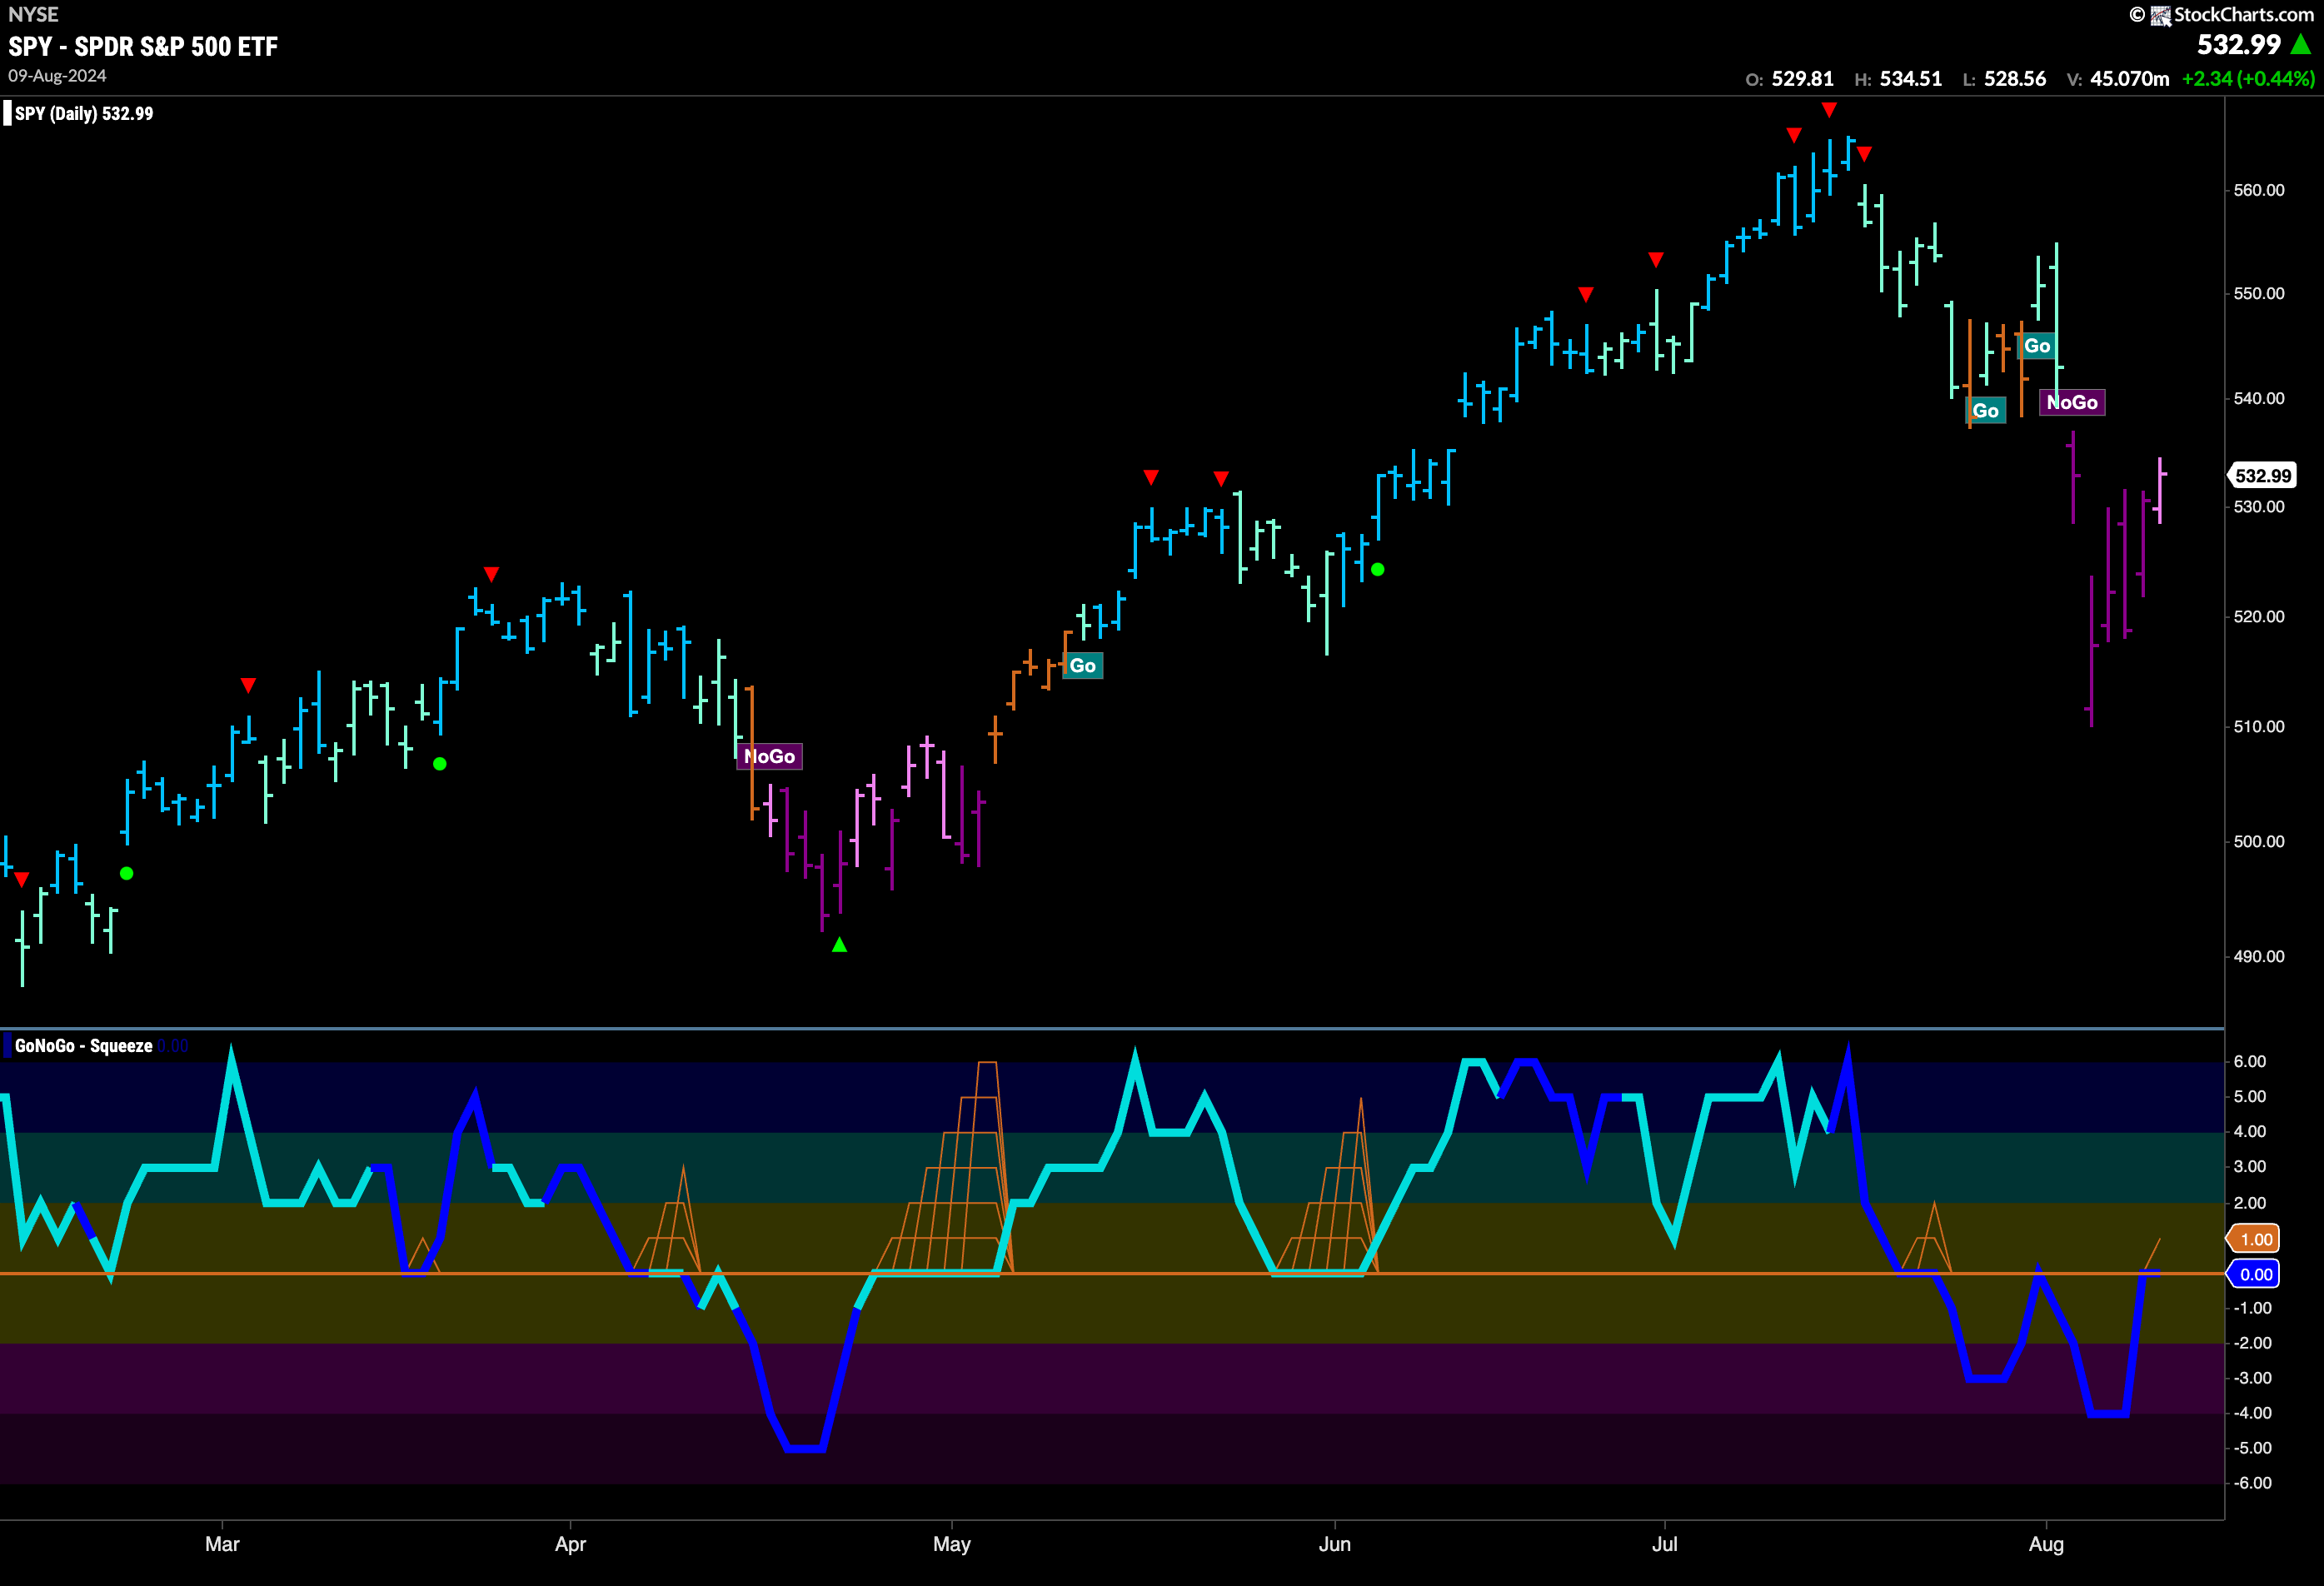
Price gapped lower again on Monday, but then steadily climbed all week. The weight of the evidence tells us that the trend is still a “NoGo” however the indicator is painting a weaker pink bar. GoNoGo Oscillator is testing the zero level from below and volume is heavy. We will watch to see if the oscillator gets turned away, back into negative territory. If it does, the “NoGo” trend is likely to continue.
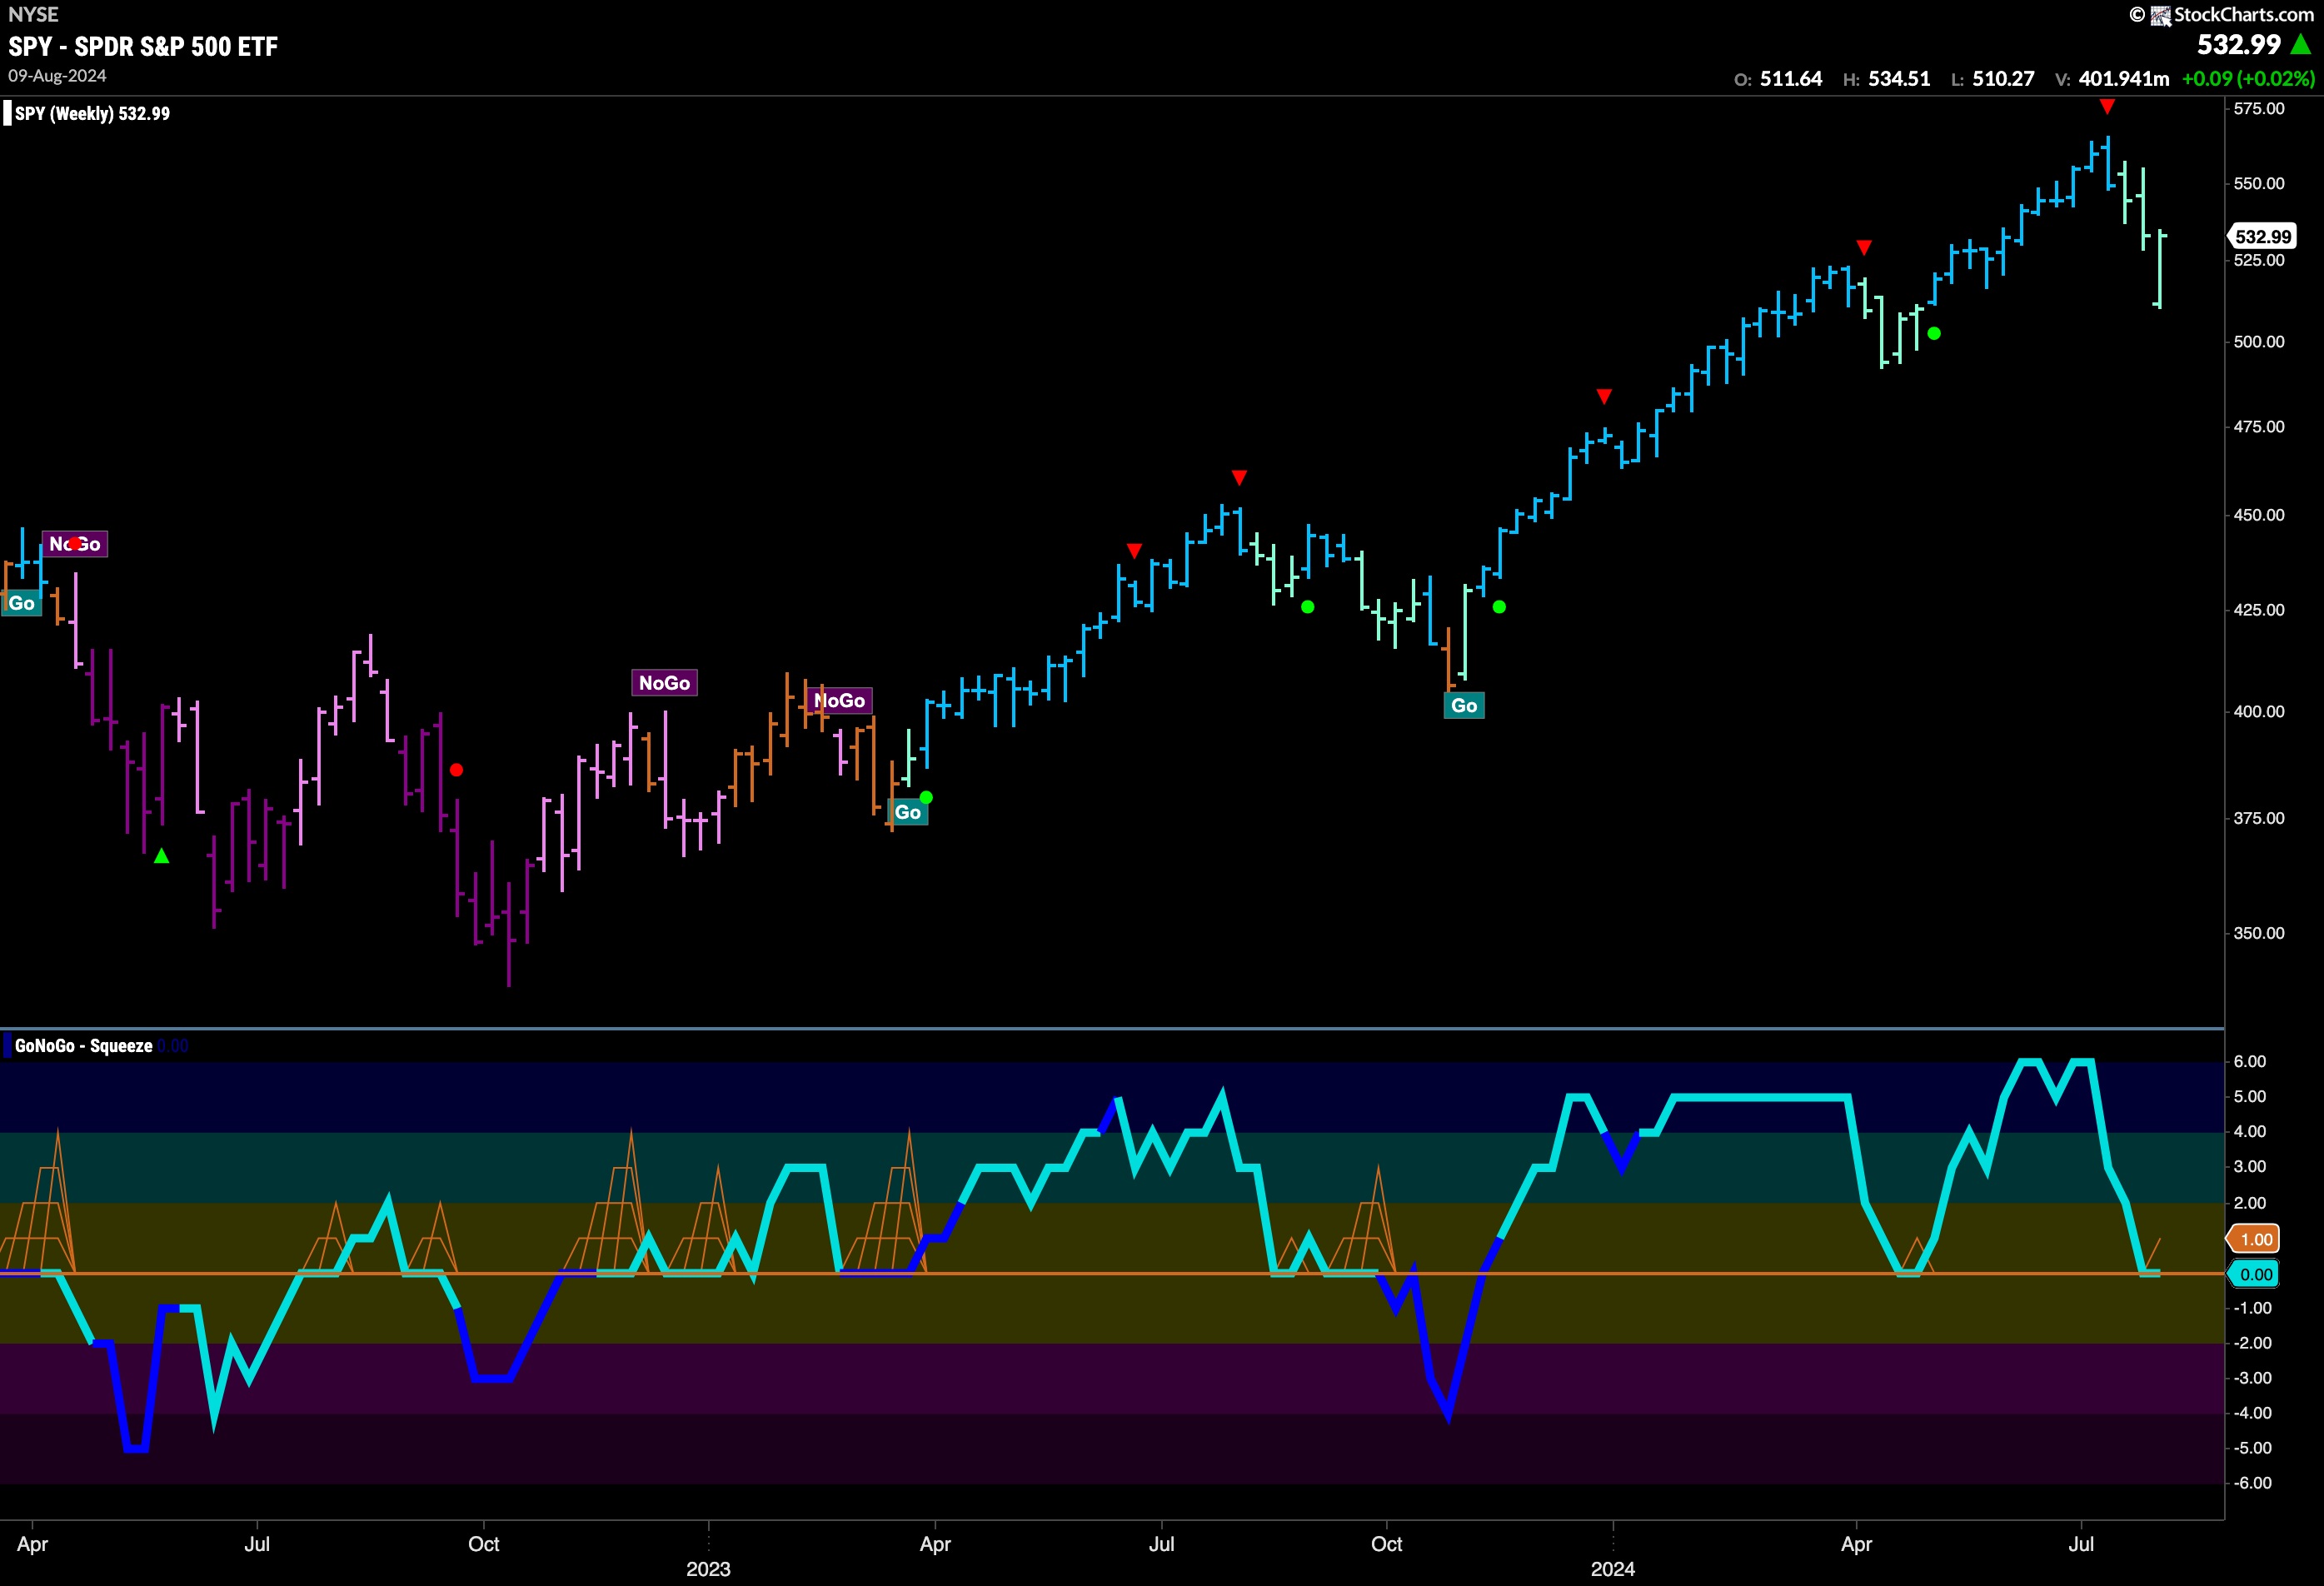
The strong rally this week put the weekly close very close to the previous close. A third aqua “Go” bar tells us that the trend remains week on this longer term chart, however, the “Go” survives again this week. We will continue to monitor the GoNoGo Oscillator as it rests at zero. If it can find support here, then we may see the “Go” trend remain in place. Multi time frame analysis tells us to keep this chart in mind when we look at the lower timeframes.
Treasury Rates Rally off Lows
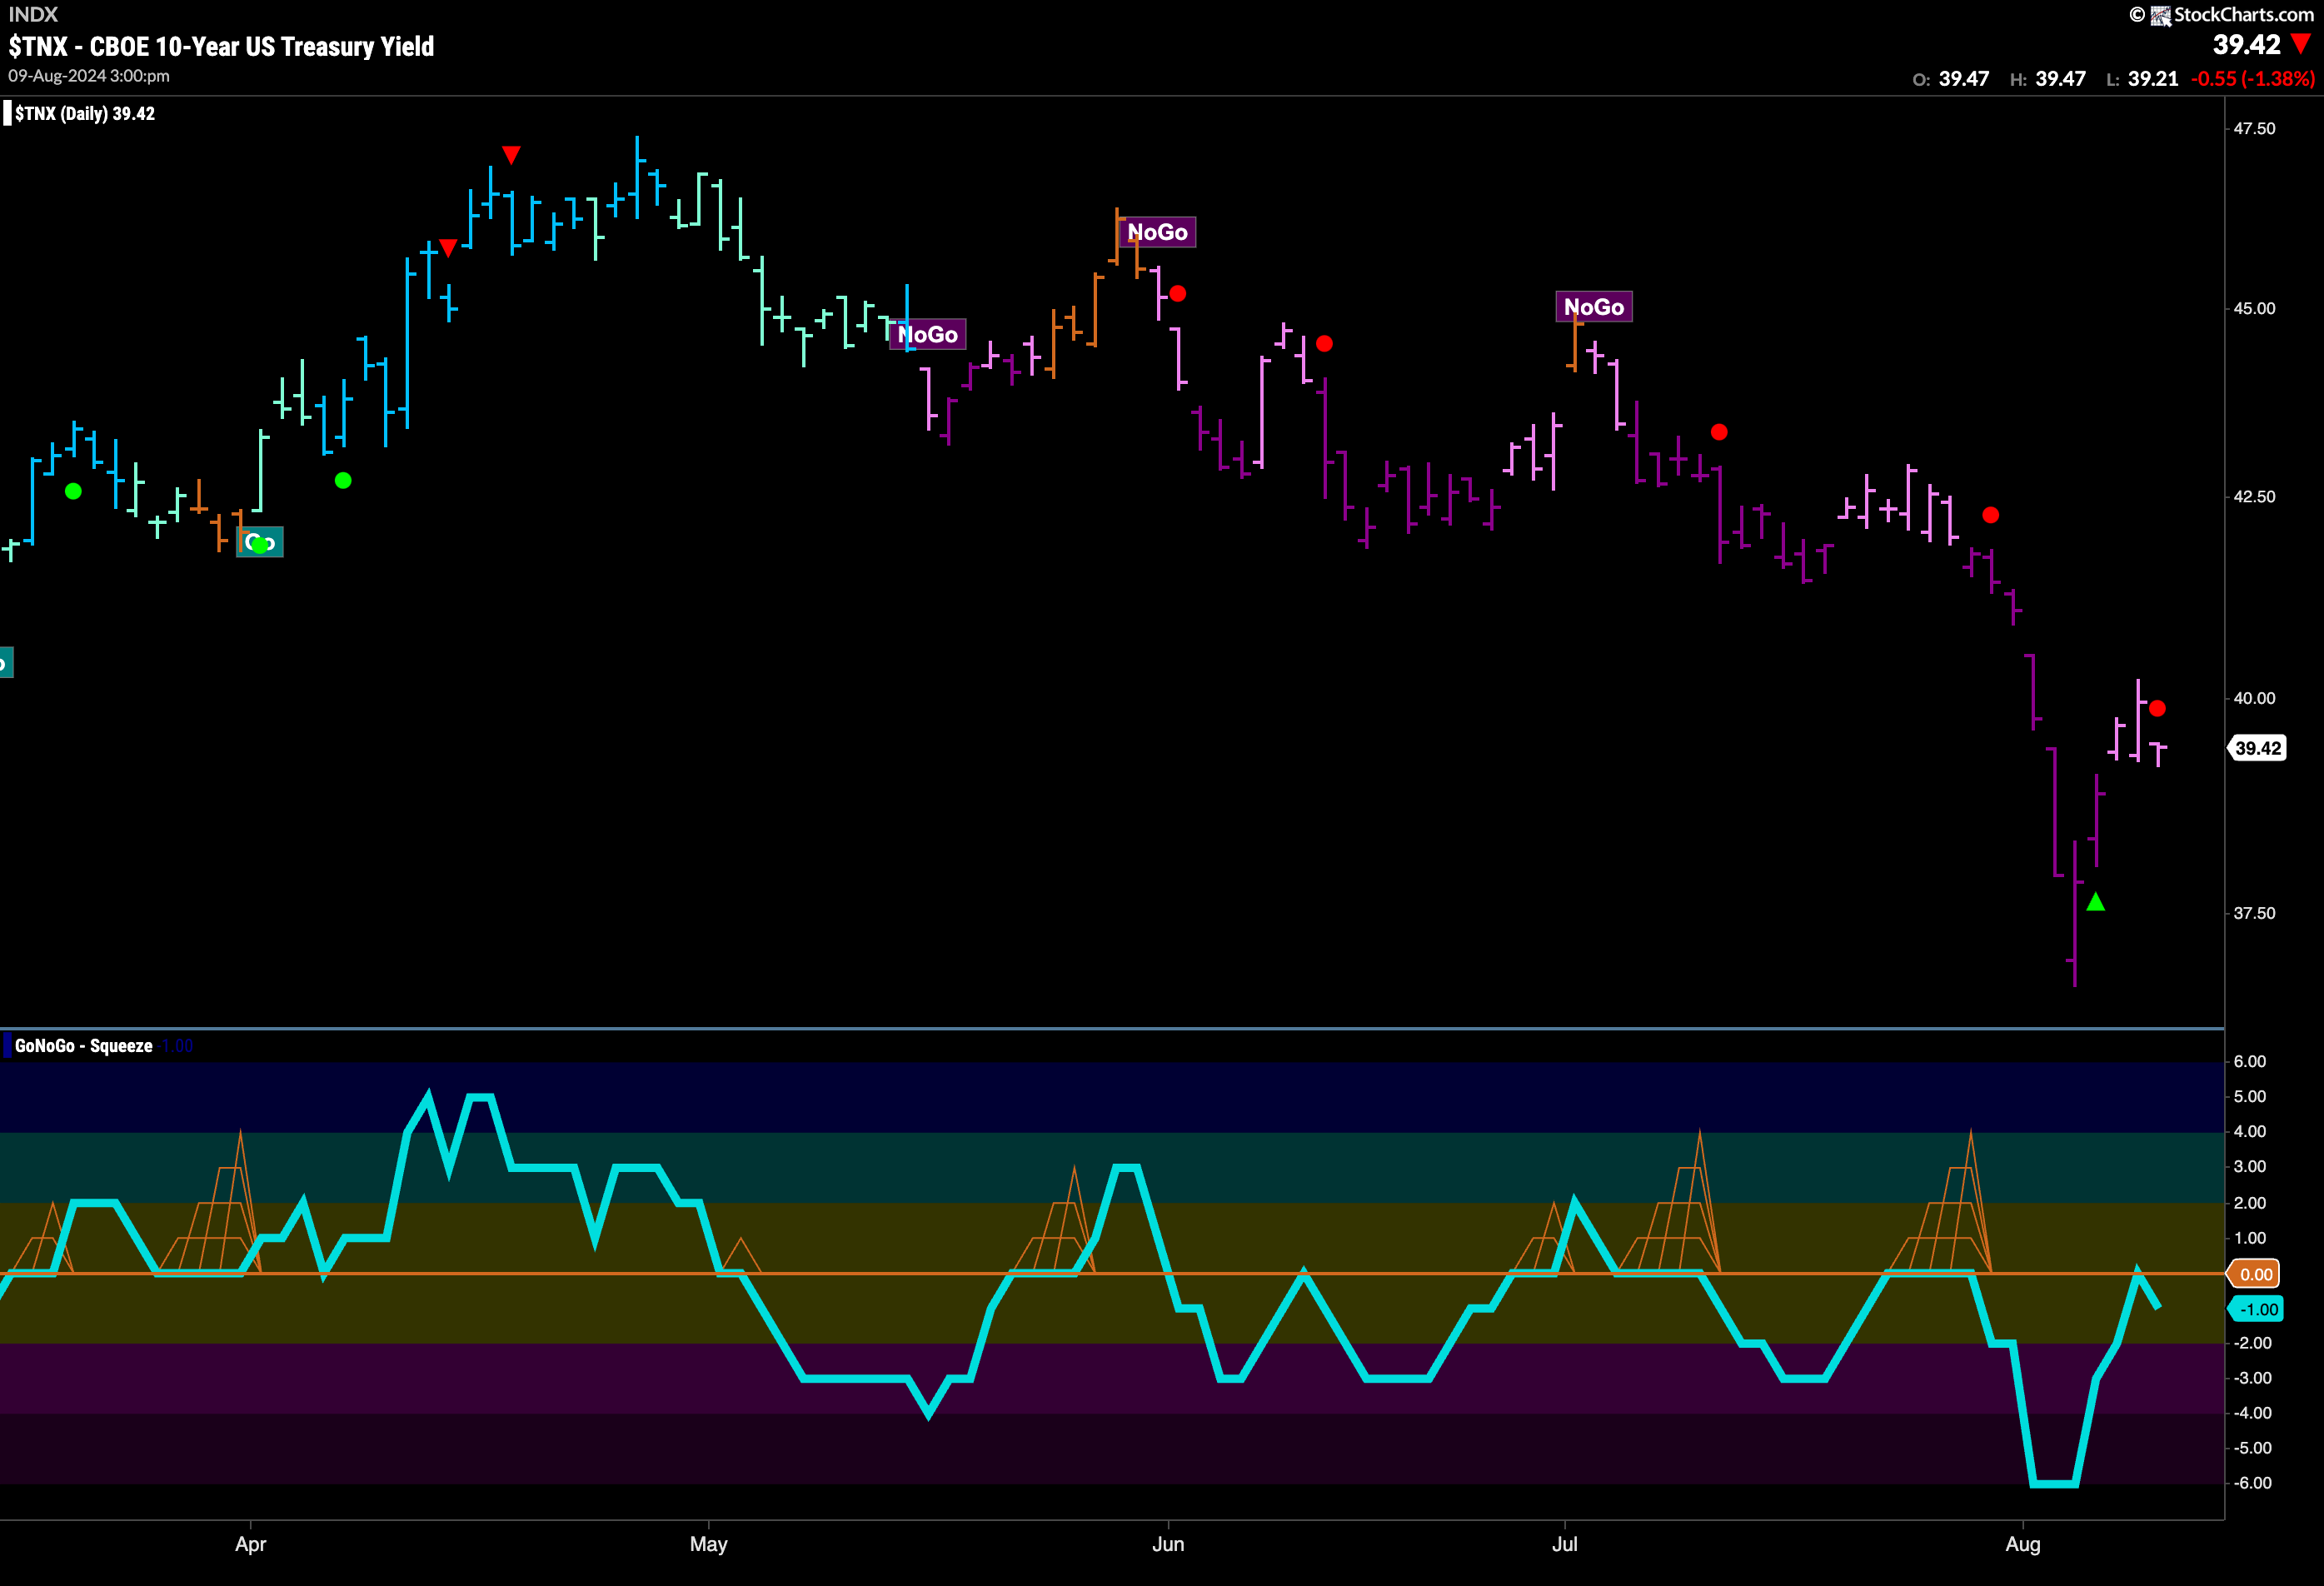
This week we saw another low for treasury rates. Then, price rallied strongly all week. GoNoGo Trend begin to paint weaker pink “NoGo” bars mid week as prices climbed. GoNoGo Oscillator rallied to test the zero level from below and was quickly rejected. This tells us that momentum is resurgent in the direction of the “NoGo” trend. We will look to see if price moves back lower this week.
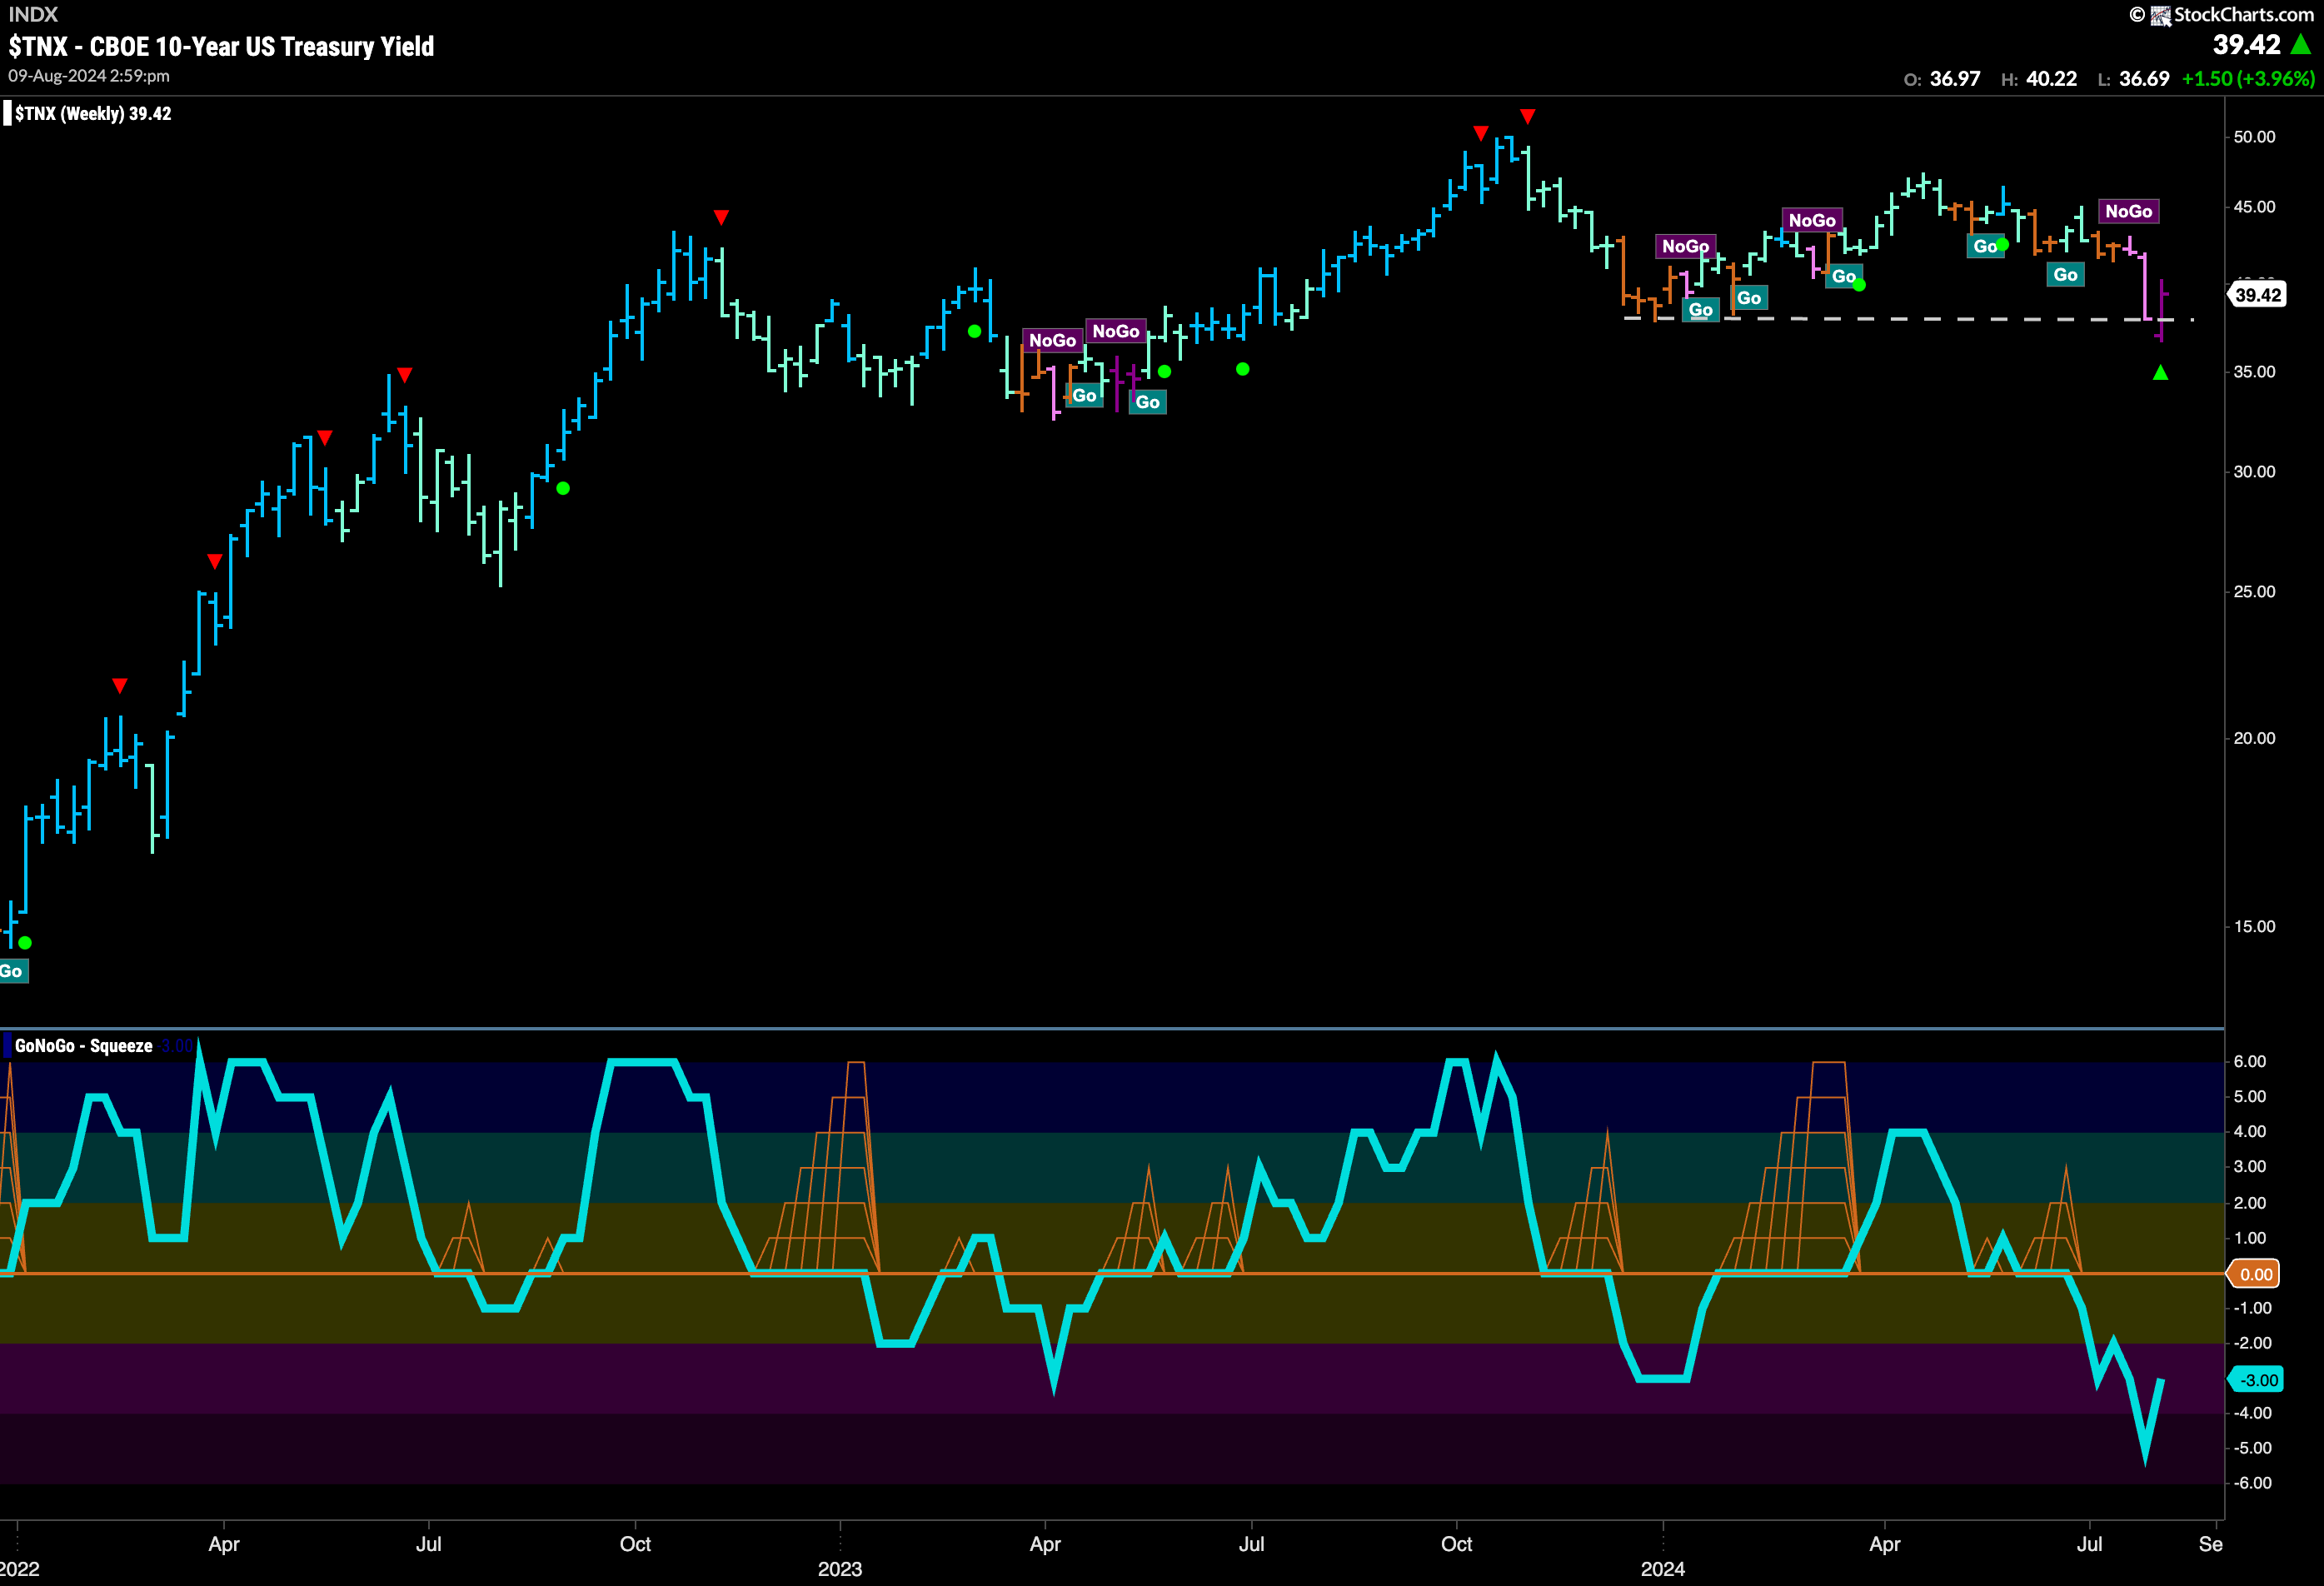
The weekly chart below shows that the support we saw on the chart last week held. Price dipped below the horizontal level but the weekly close was back above it. GoNoGo Oscillator has also rallied out of oversold territory but is still negative.
The Dollar’s “NoGo” Trend Remains
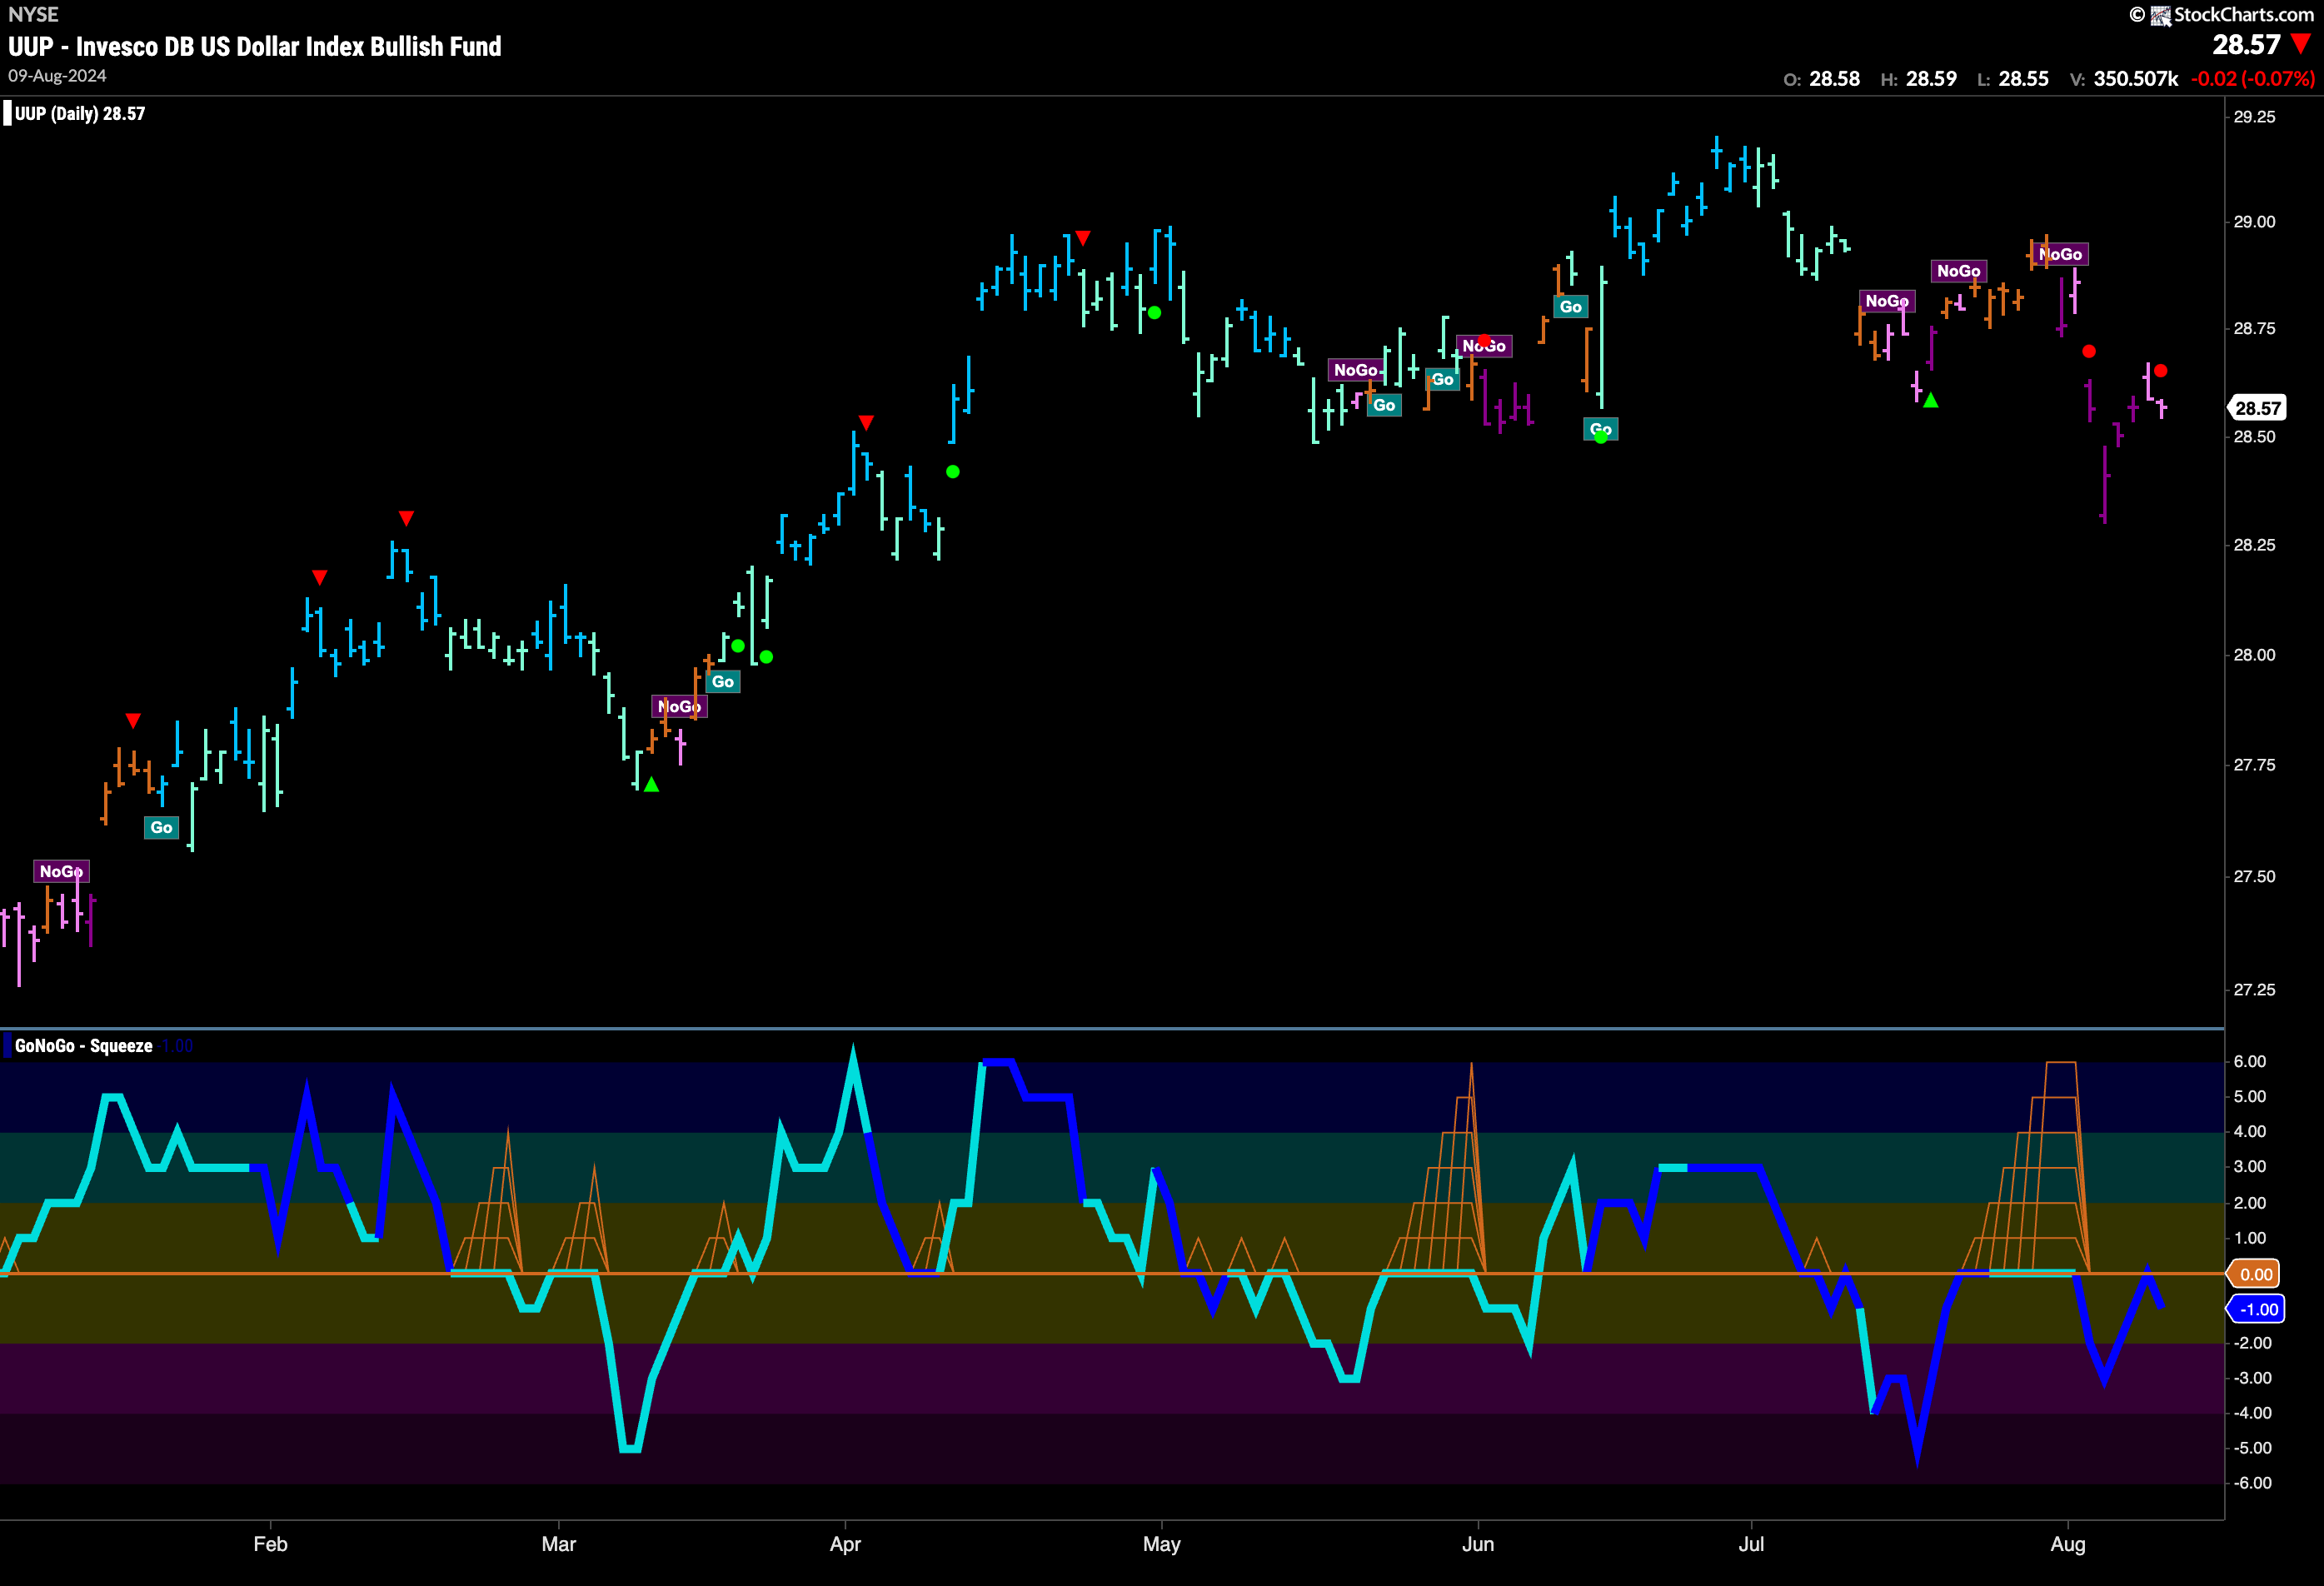
Price moved sharply lower a week ago. We then saw prices climb from those lows as the week progressed. However, GoNoGo Trend shows that the “NoGo” survived the week on weaker pink bars as the rally stalled. GoNoGo Oscillator rallied quickly to test the zero line from below but was rejected on heavy volume. This tells us that momentum is resurgent in the direction of the “NoGo” trend and so we will look for price to fall this week.
USO Rallies but Remains in “NoGo”
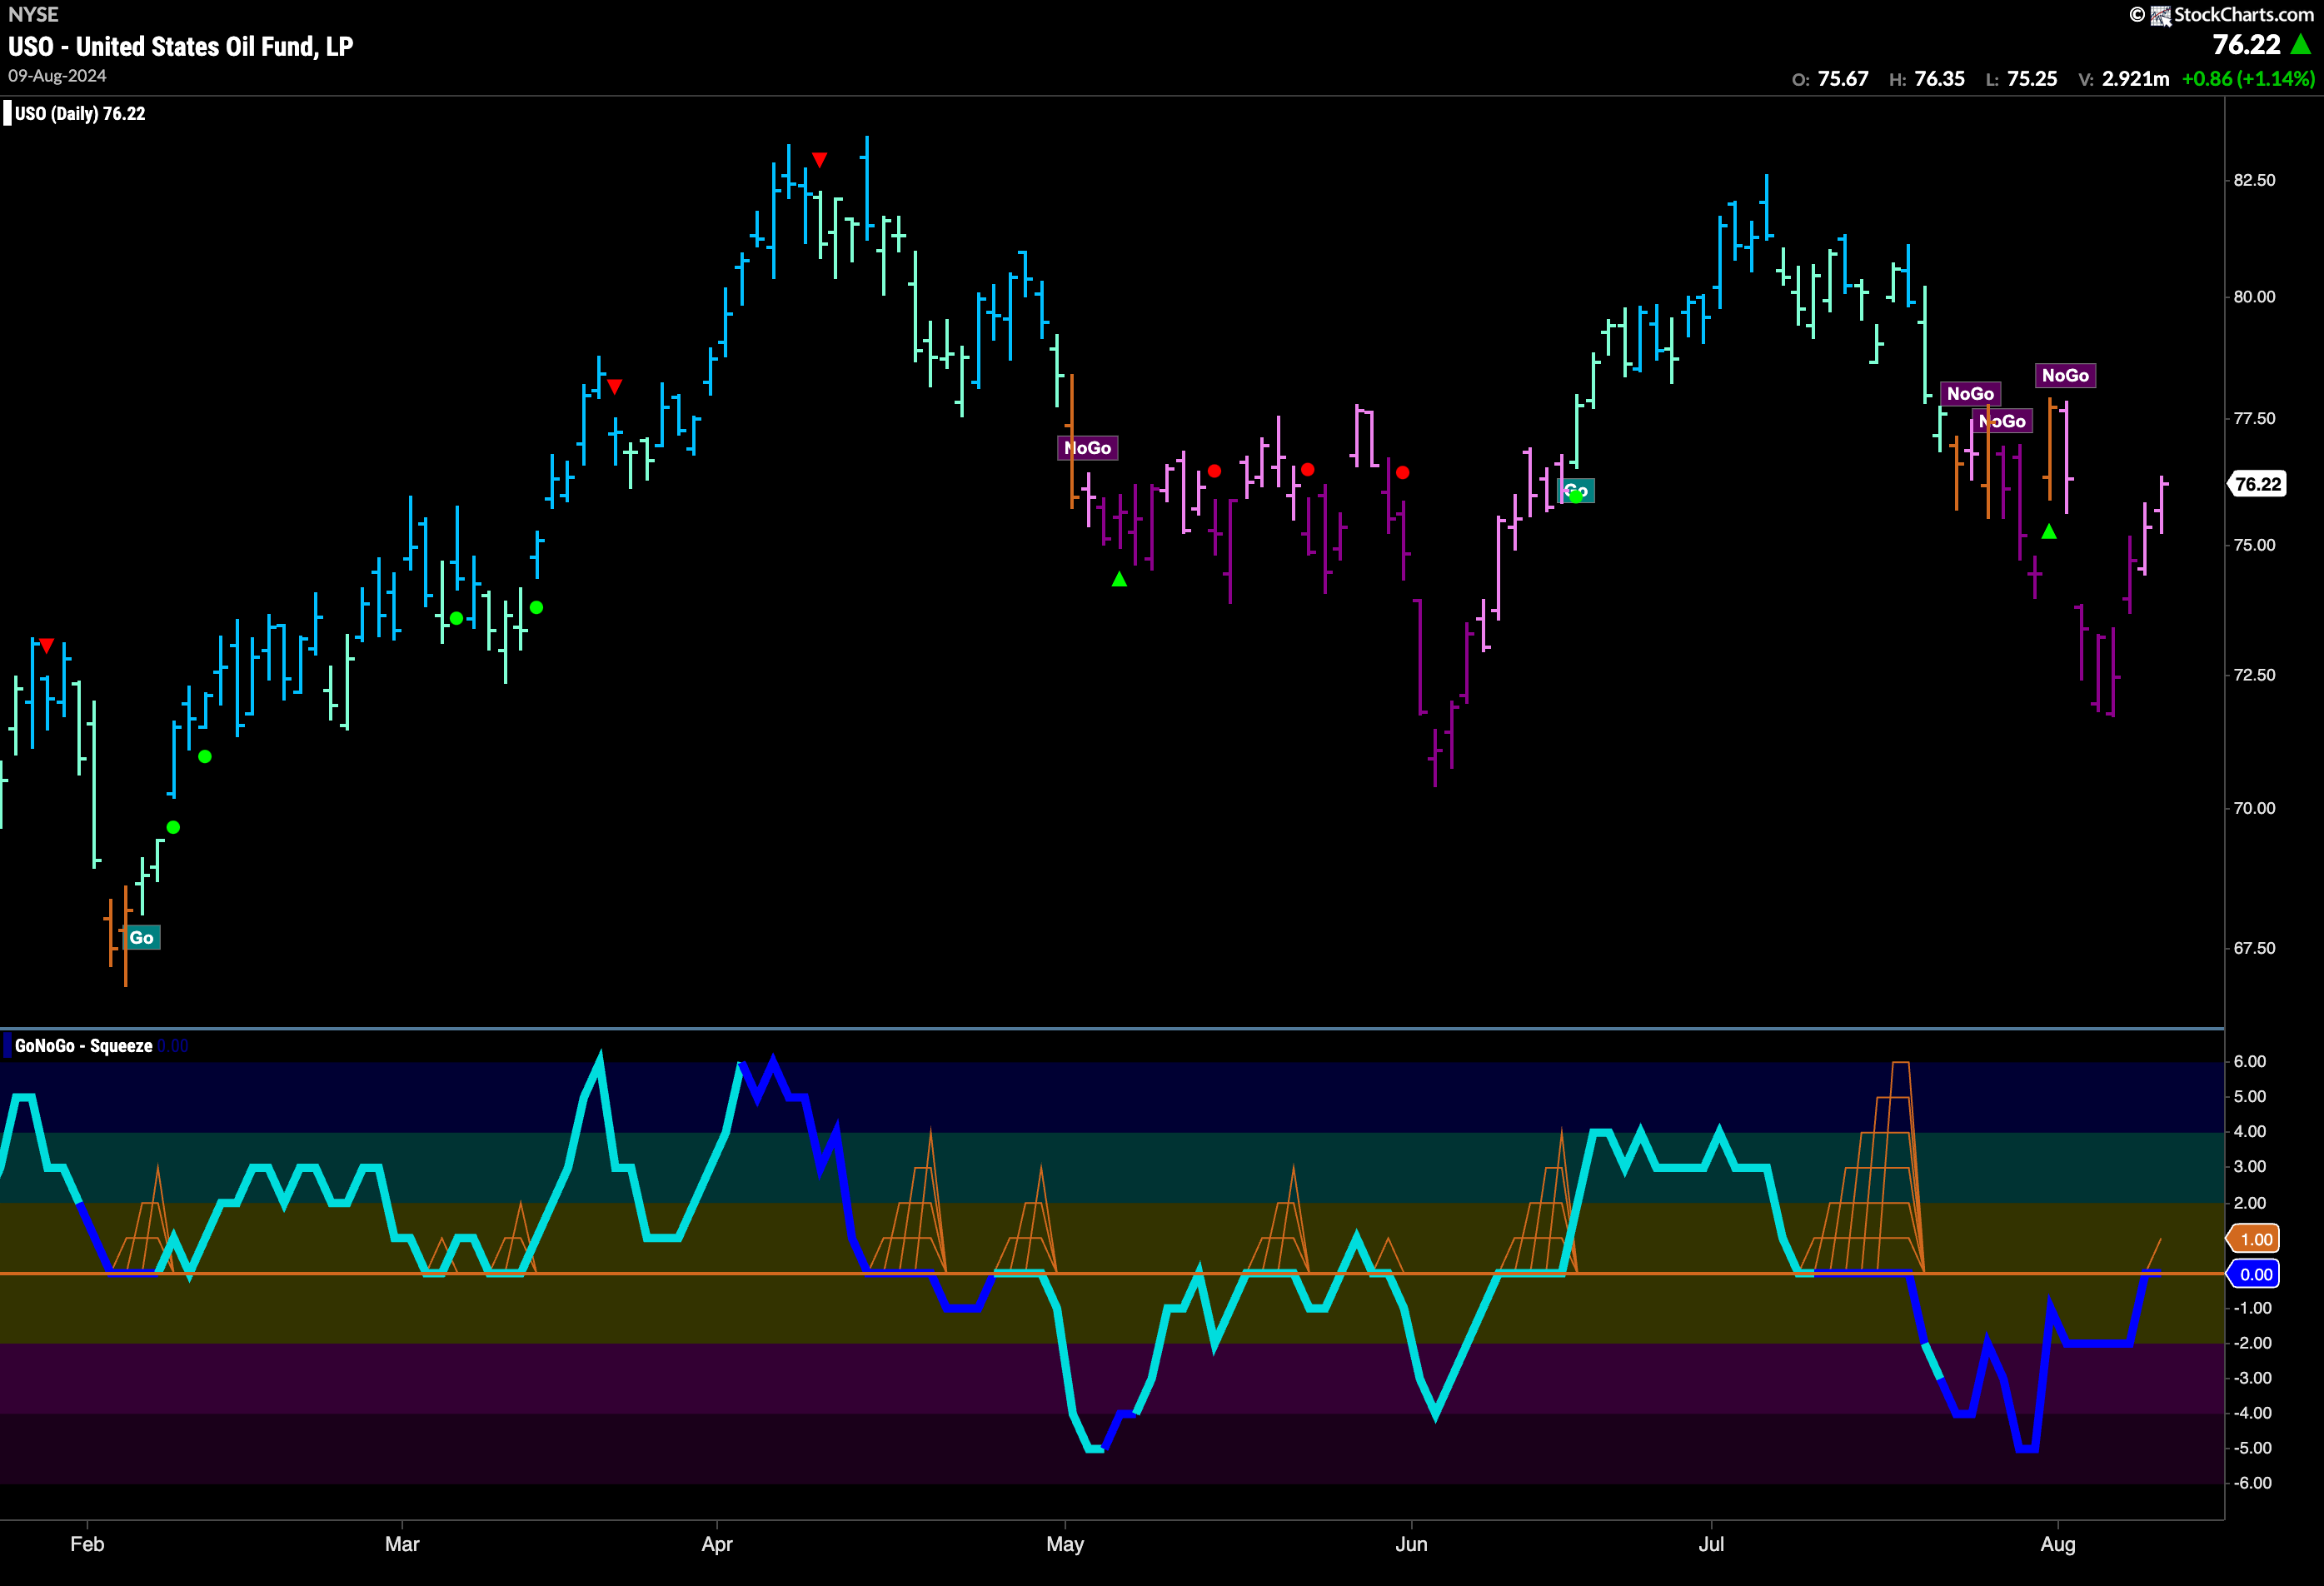
Price rallied after dropping into a strong “NoGo” trend to start the week. As GoNoGo Trend painted weaker pink “NoGo” bars on Thursday and Friday, GoNoGo Oscillator rose to test the zero line from below on heavy volume. We will watch to see if it finds resistance at this level. If it does, then we would expect the “NoGo” trend to continue.
Gold Sees the “Go” Trend Hold Firm
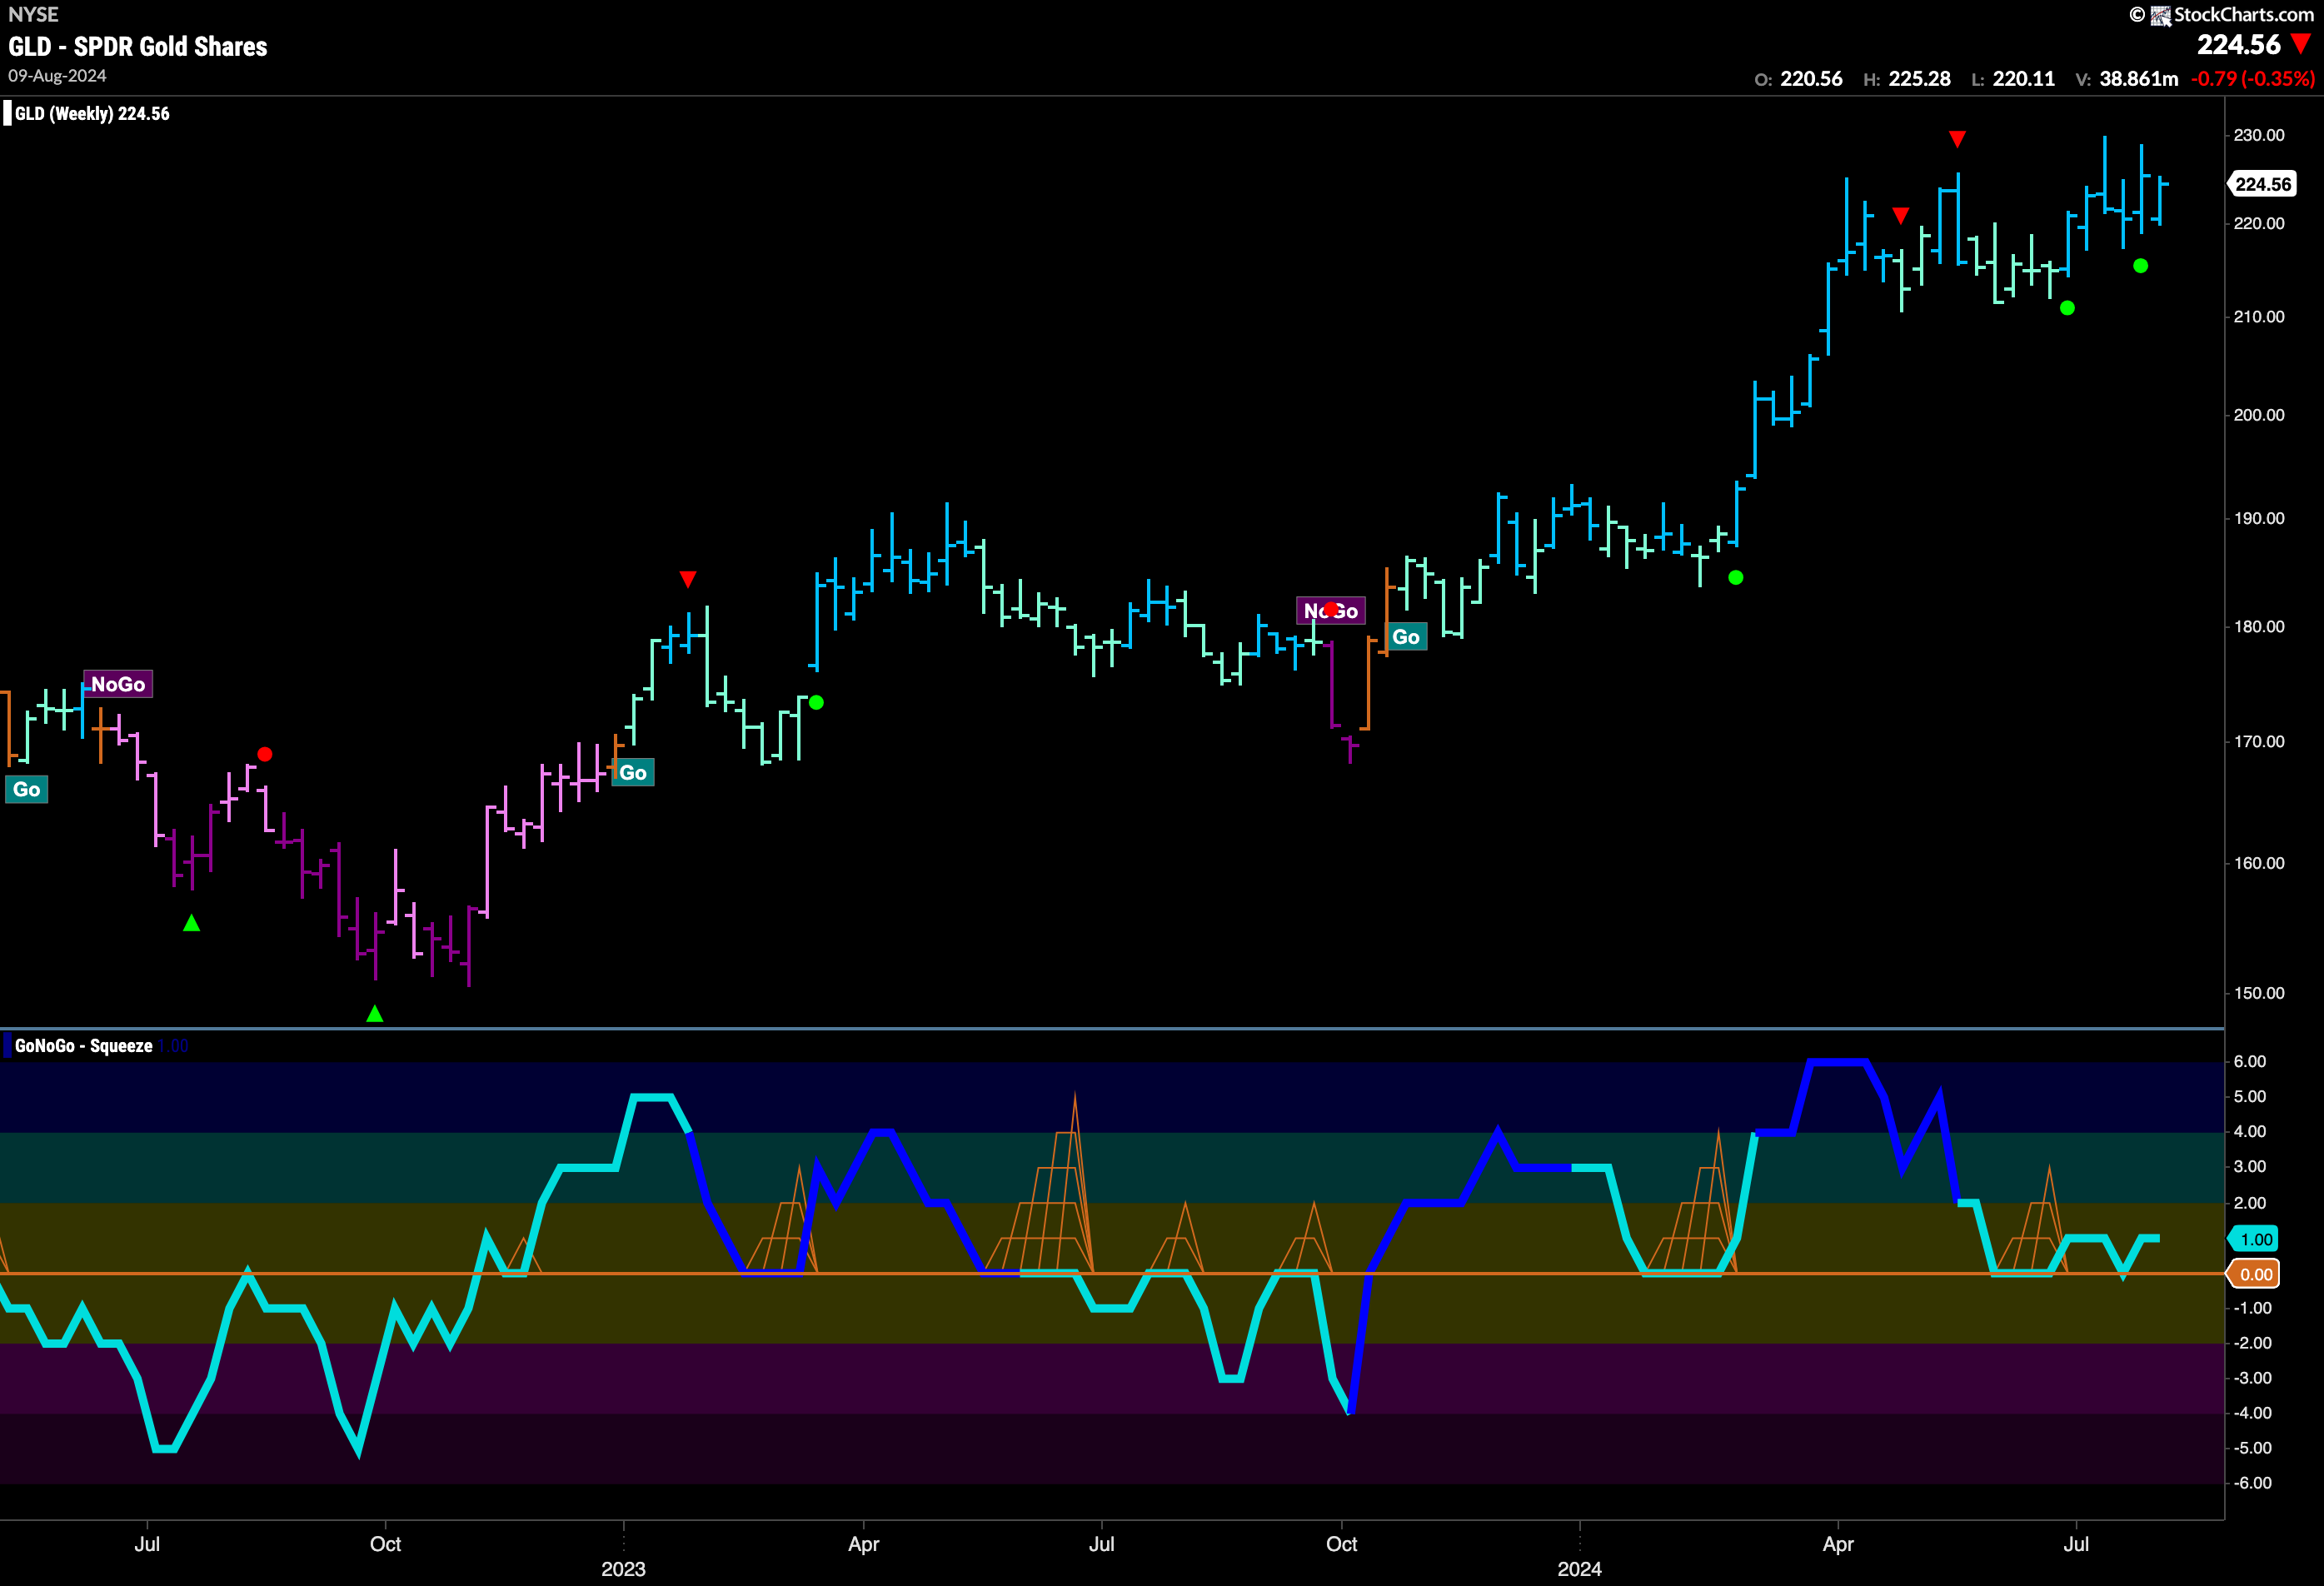
The weekly chart of Gold shows us that for another week, the trend remains strong for Gold. With price remaining elevated, pushing up against recent highs, GoNoGo Trend tells us that the trend is strong with bright blue bars. GoNoGo Oscillator has once again found support at the zero level and so we know that momentum remains in the direction of the “Go” trend. We will watch to see if this gives price the push it needs to make a decisive push higher.
Sector RelMap
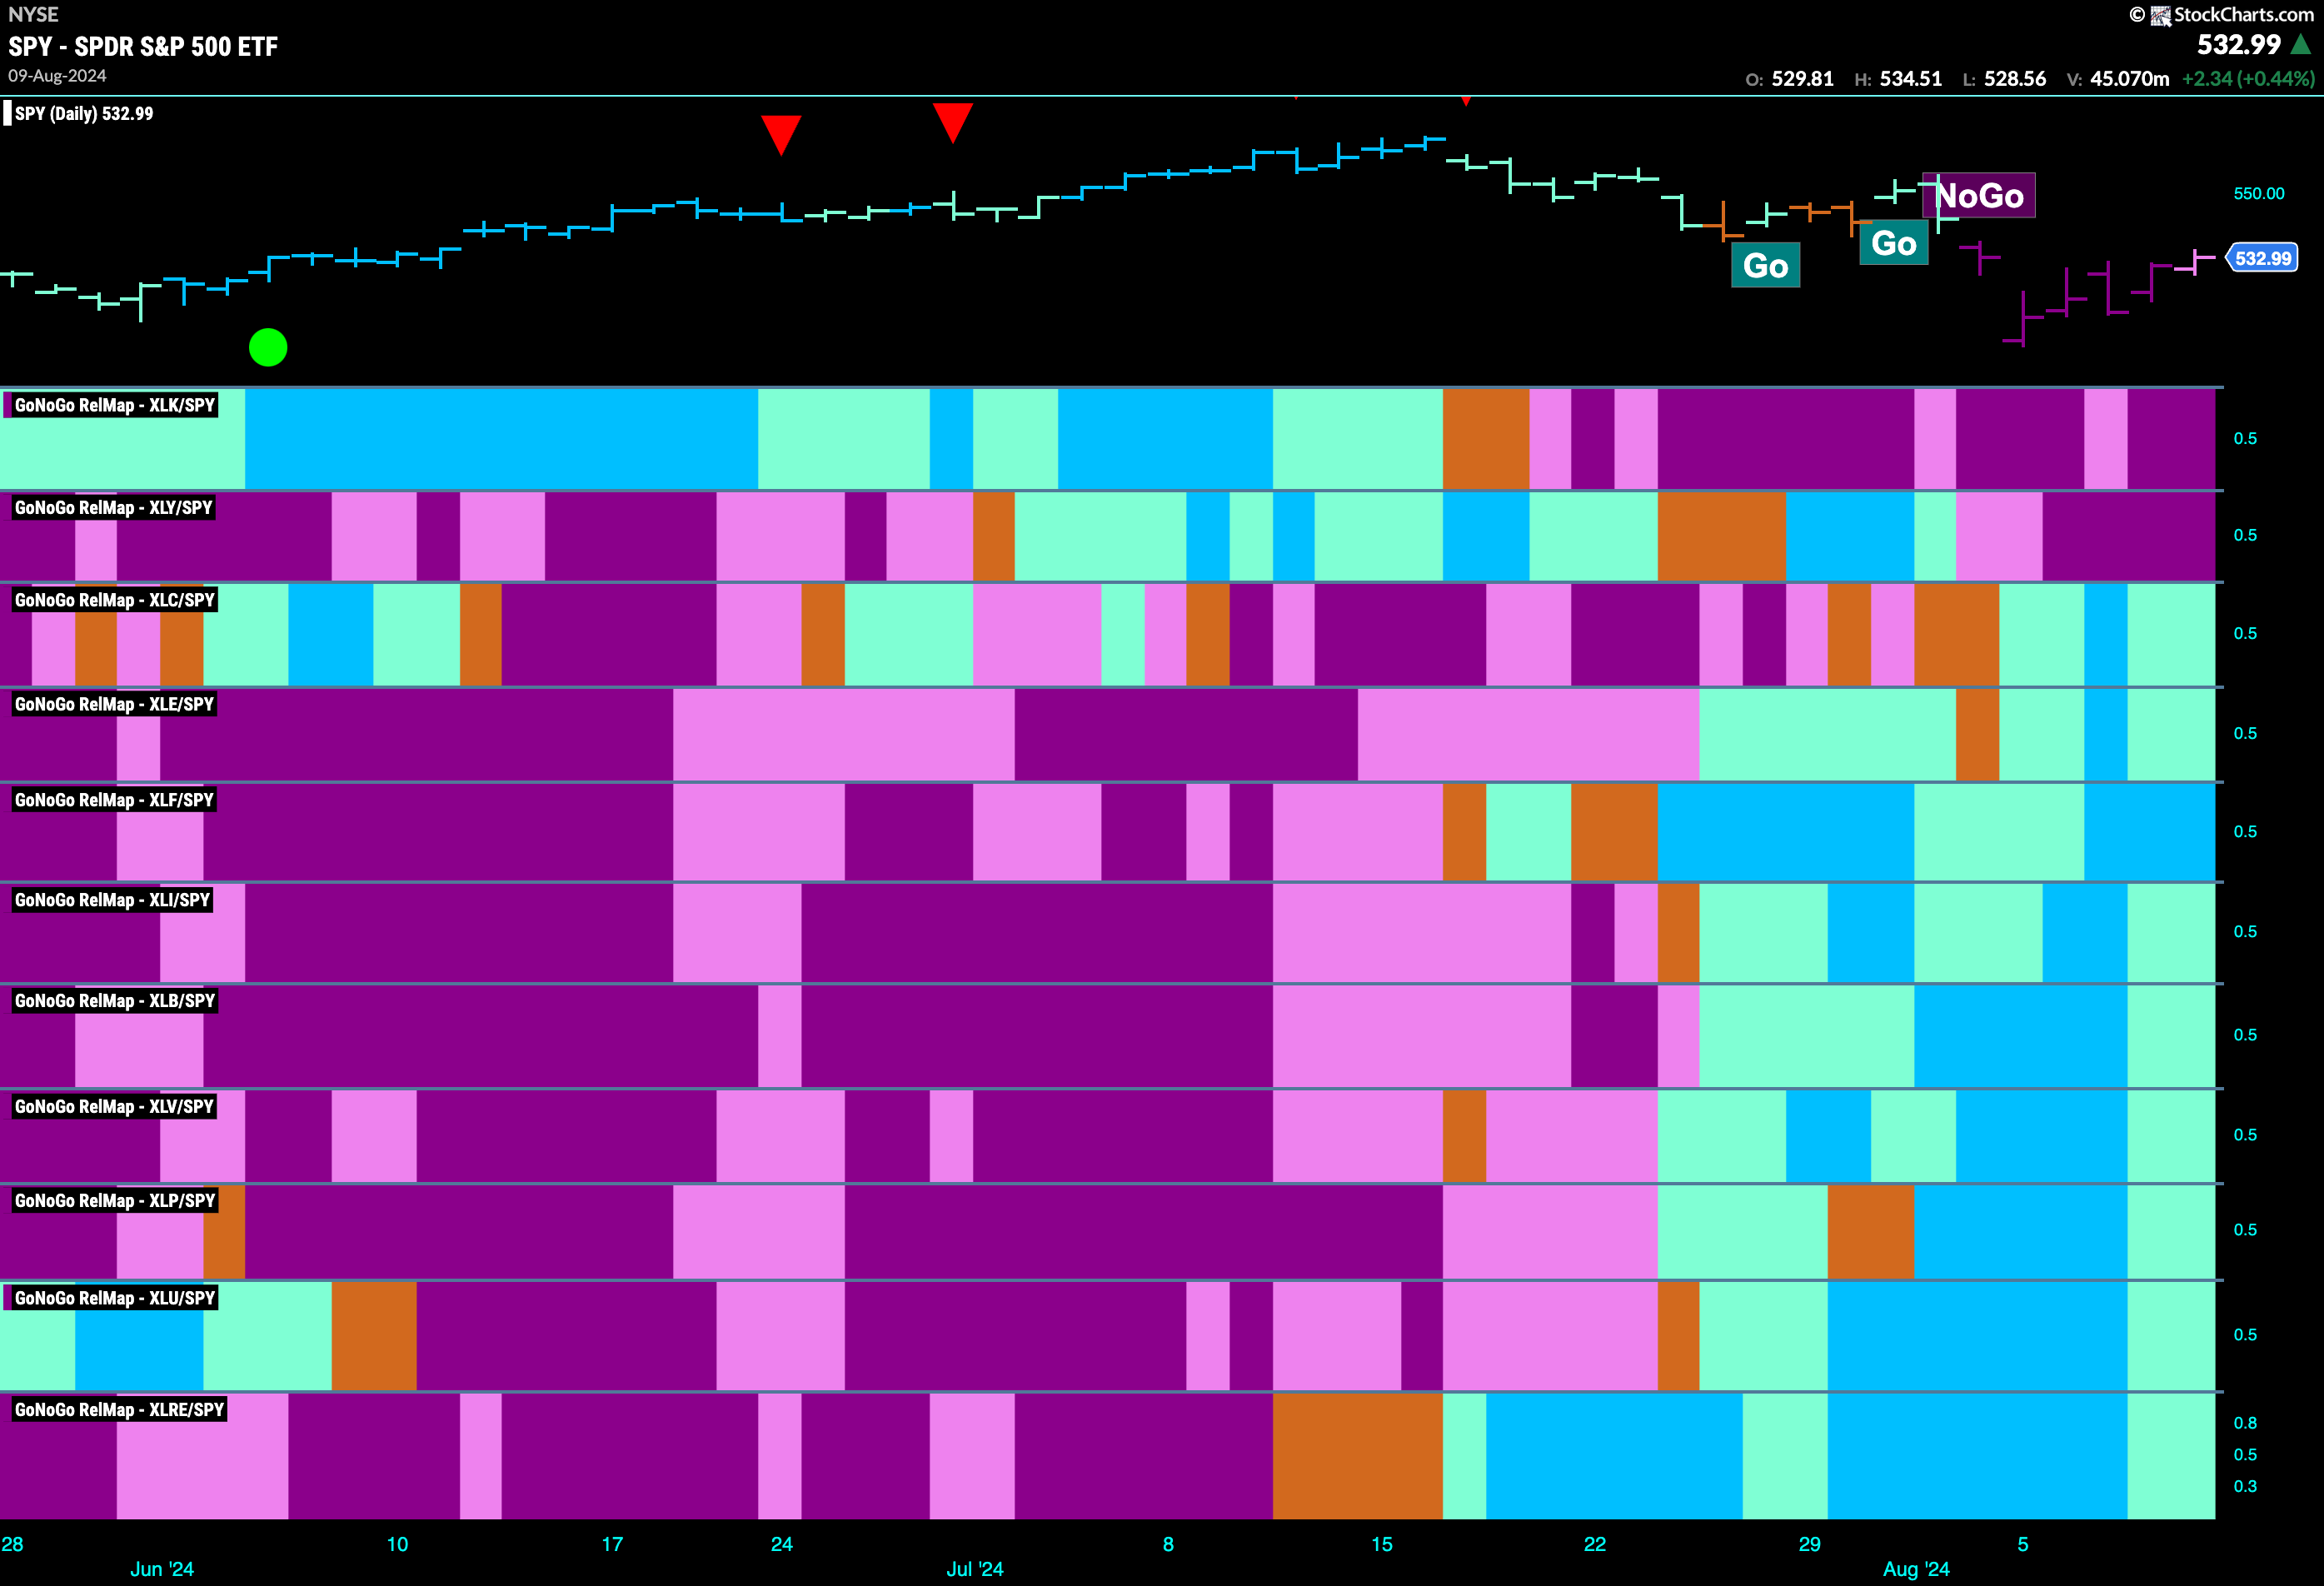
Below is the GoNoGo Sector RelMap. This GoNoGo RelMap applies the GoNoGo Trend to the relative strength ratios of the sectors to the base index. Looking at the map, we can see that 9 sectors are outperforming the base index this week. $XLC, $XLE, $XLF, $XLI, $XLB, $XLV, $XLP, $XLU and $XLRE are painting relative “Go” bars.
$XLF Relative to $SPY
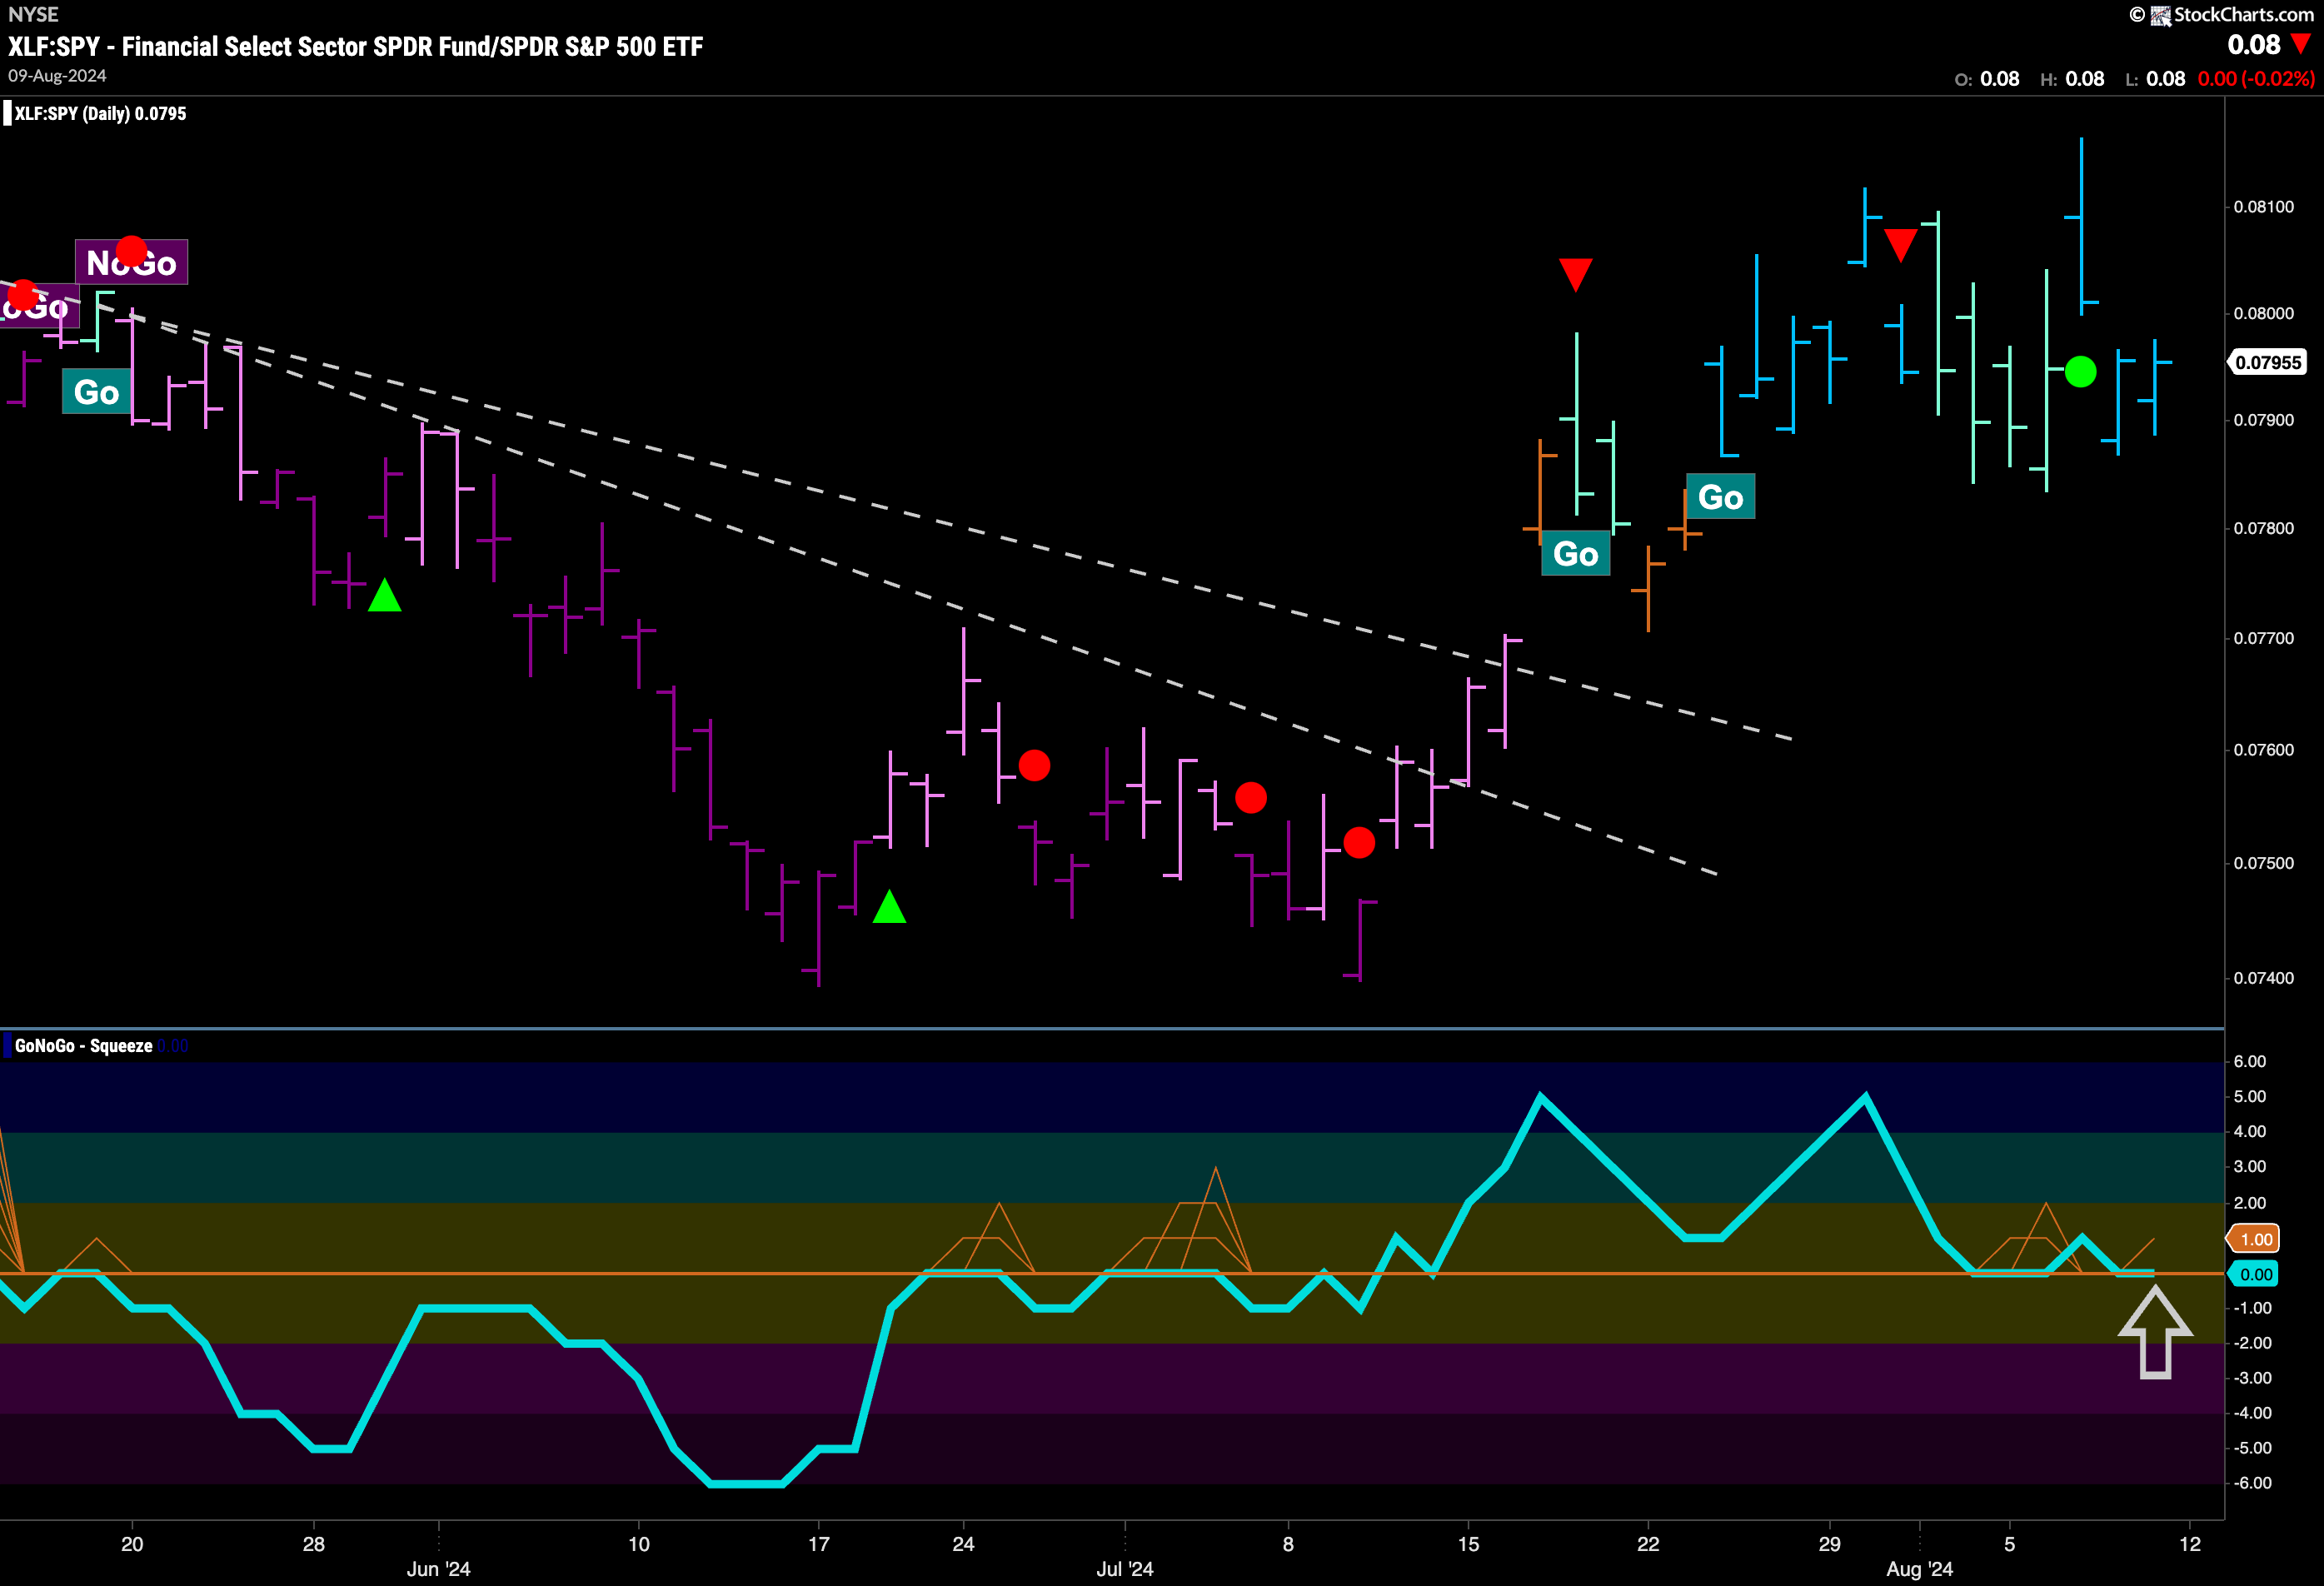
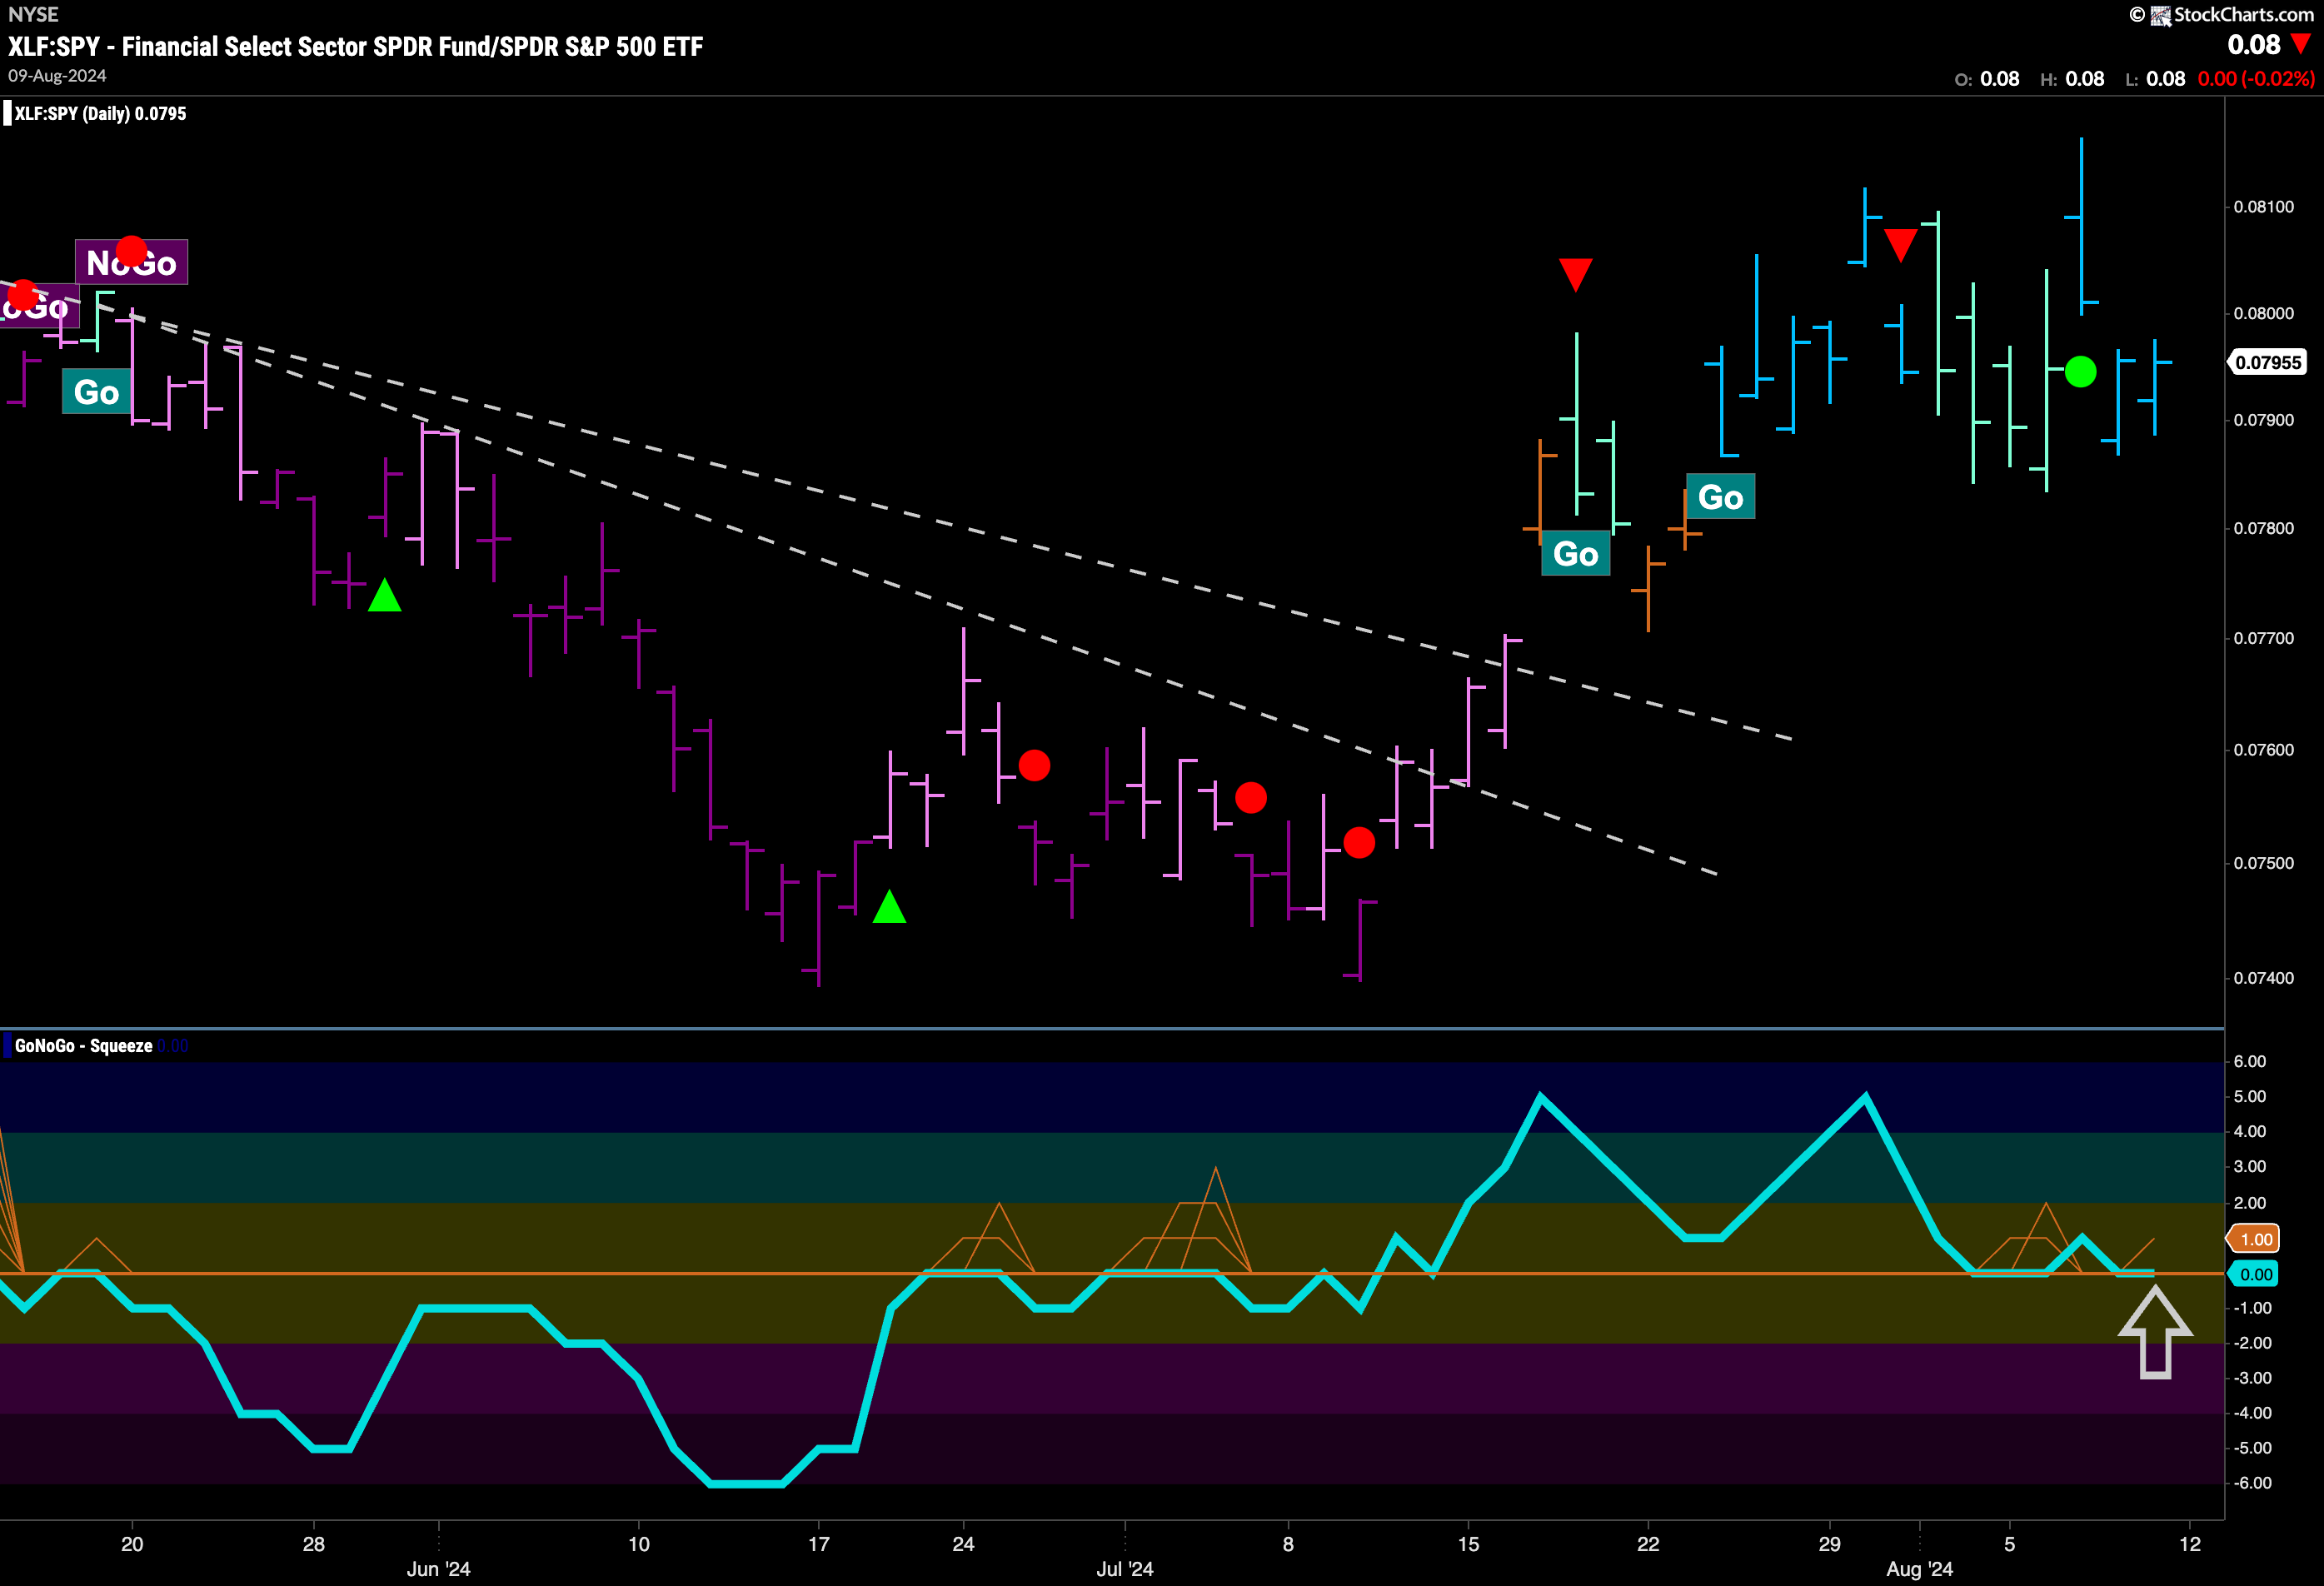
On a relative basis, we saw in the above GoNoGo Sector RelMap that financials are painting strong blue “Go” bars. Below is the GoNoGo Chart of that ratio. We can see that the “Go” trend emerged about a month ago and has managed to hold since. Now, with GoNoGo Trend painting strong blue bars we look to see if GoNoGo Oscillator can continue to find support at the zero line. If it does, then we will expect this relative “Go” trend to continue for financials.
$JEF in “Go” Trend and Looking for Support
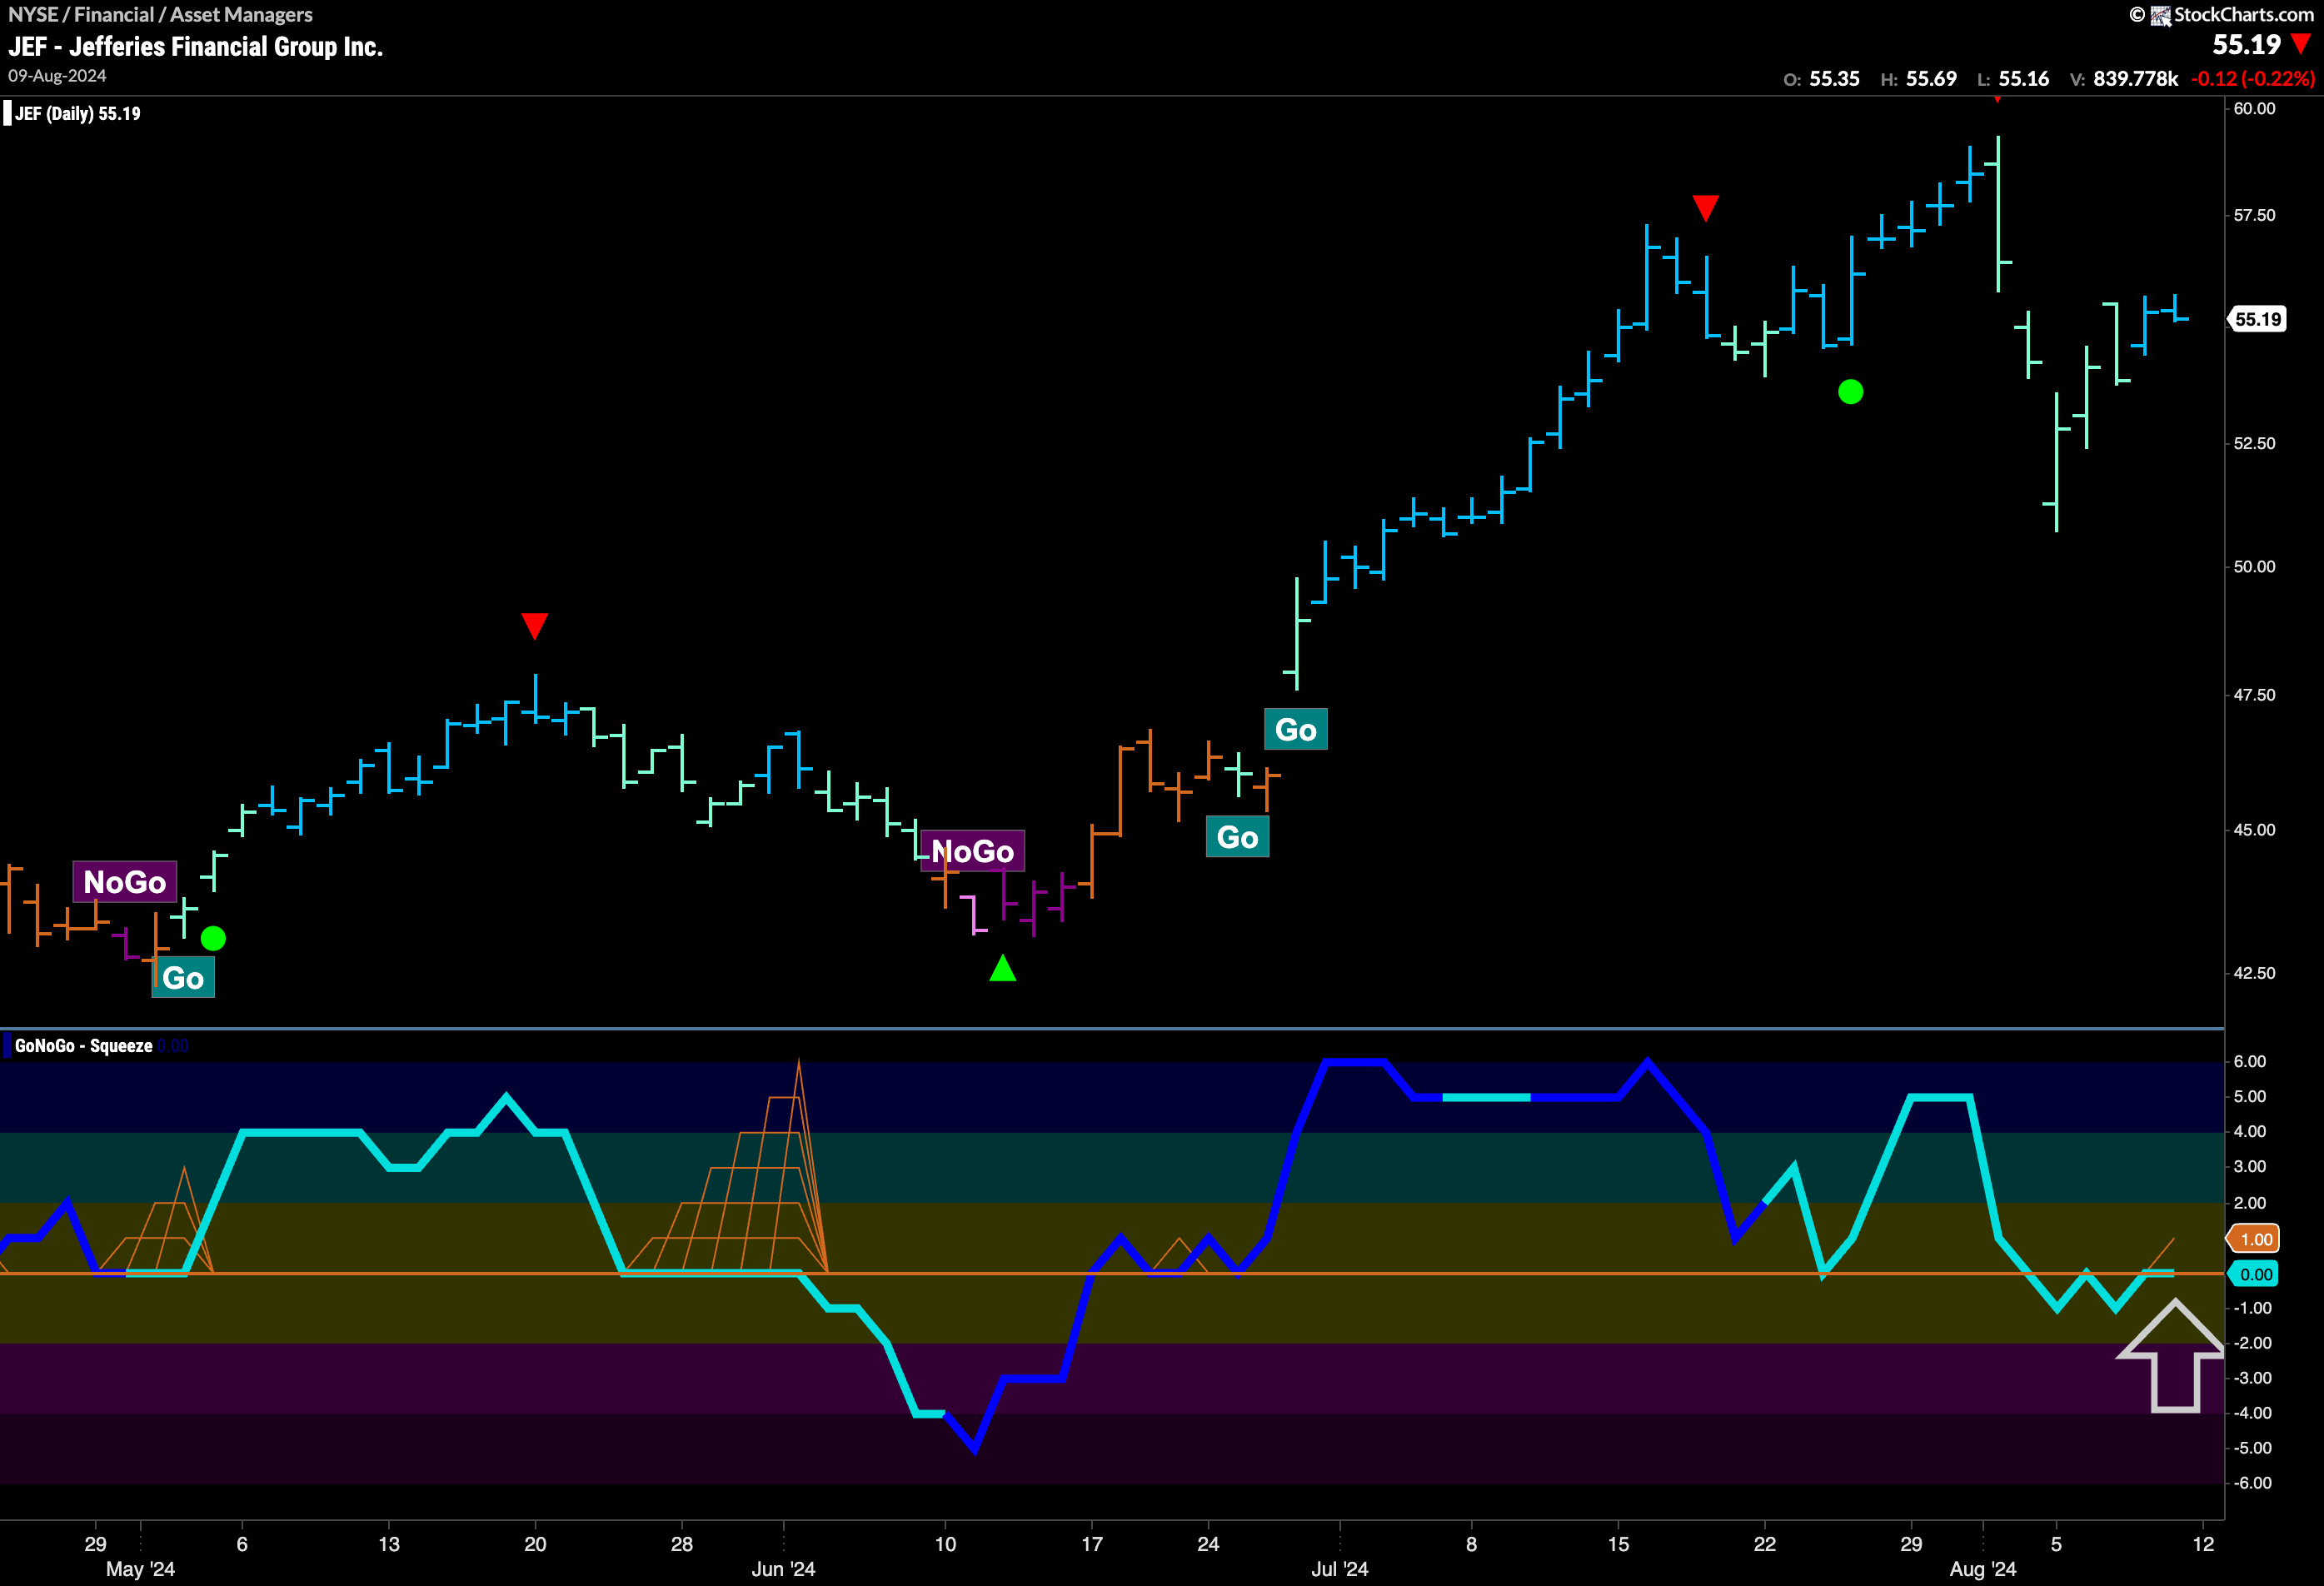
$JEF has been in a “Go” trend since late June. We saw higher highs and higher lows until early this month. As the market suffered a sharp drop so too did $JEF, however GoNoGo Trend was able to continue painting “Go” bars the entire time. Now, the indicator is painting stronger blue bars, and GoNoGo Oscillator is back at the zero level. We will look for the oscillator to recapture positive territory and if it does we can expect price to rally further.
$GS Seeing Strength After Uncertainty
$GS has also recovered after the sharp drop last week. GoNoGo Trend painted a single amber “Go Fish” bar of uncertainty but quickly returned to “Go” bars. GoNoGo Oscillator dropped into negative territory but is now back testing the zero line where we will watch to see if it gets rejected or if it can regain positive territory. With GoNoGo Trend painting strong blue bars, we will look to see if any boost in momentum will send price back to test prior highs.


