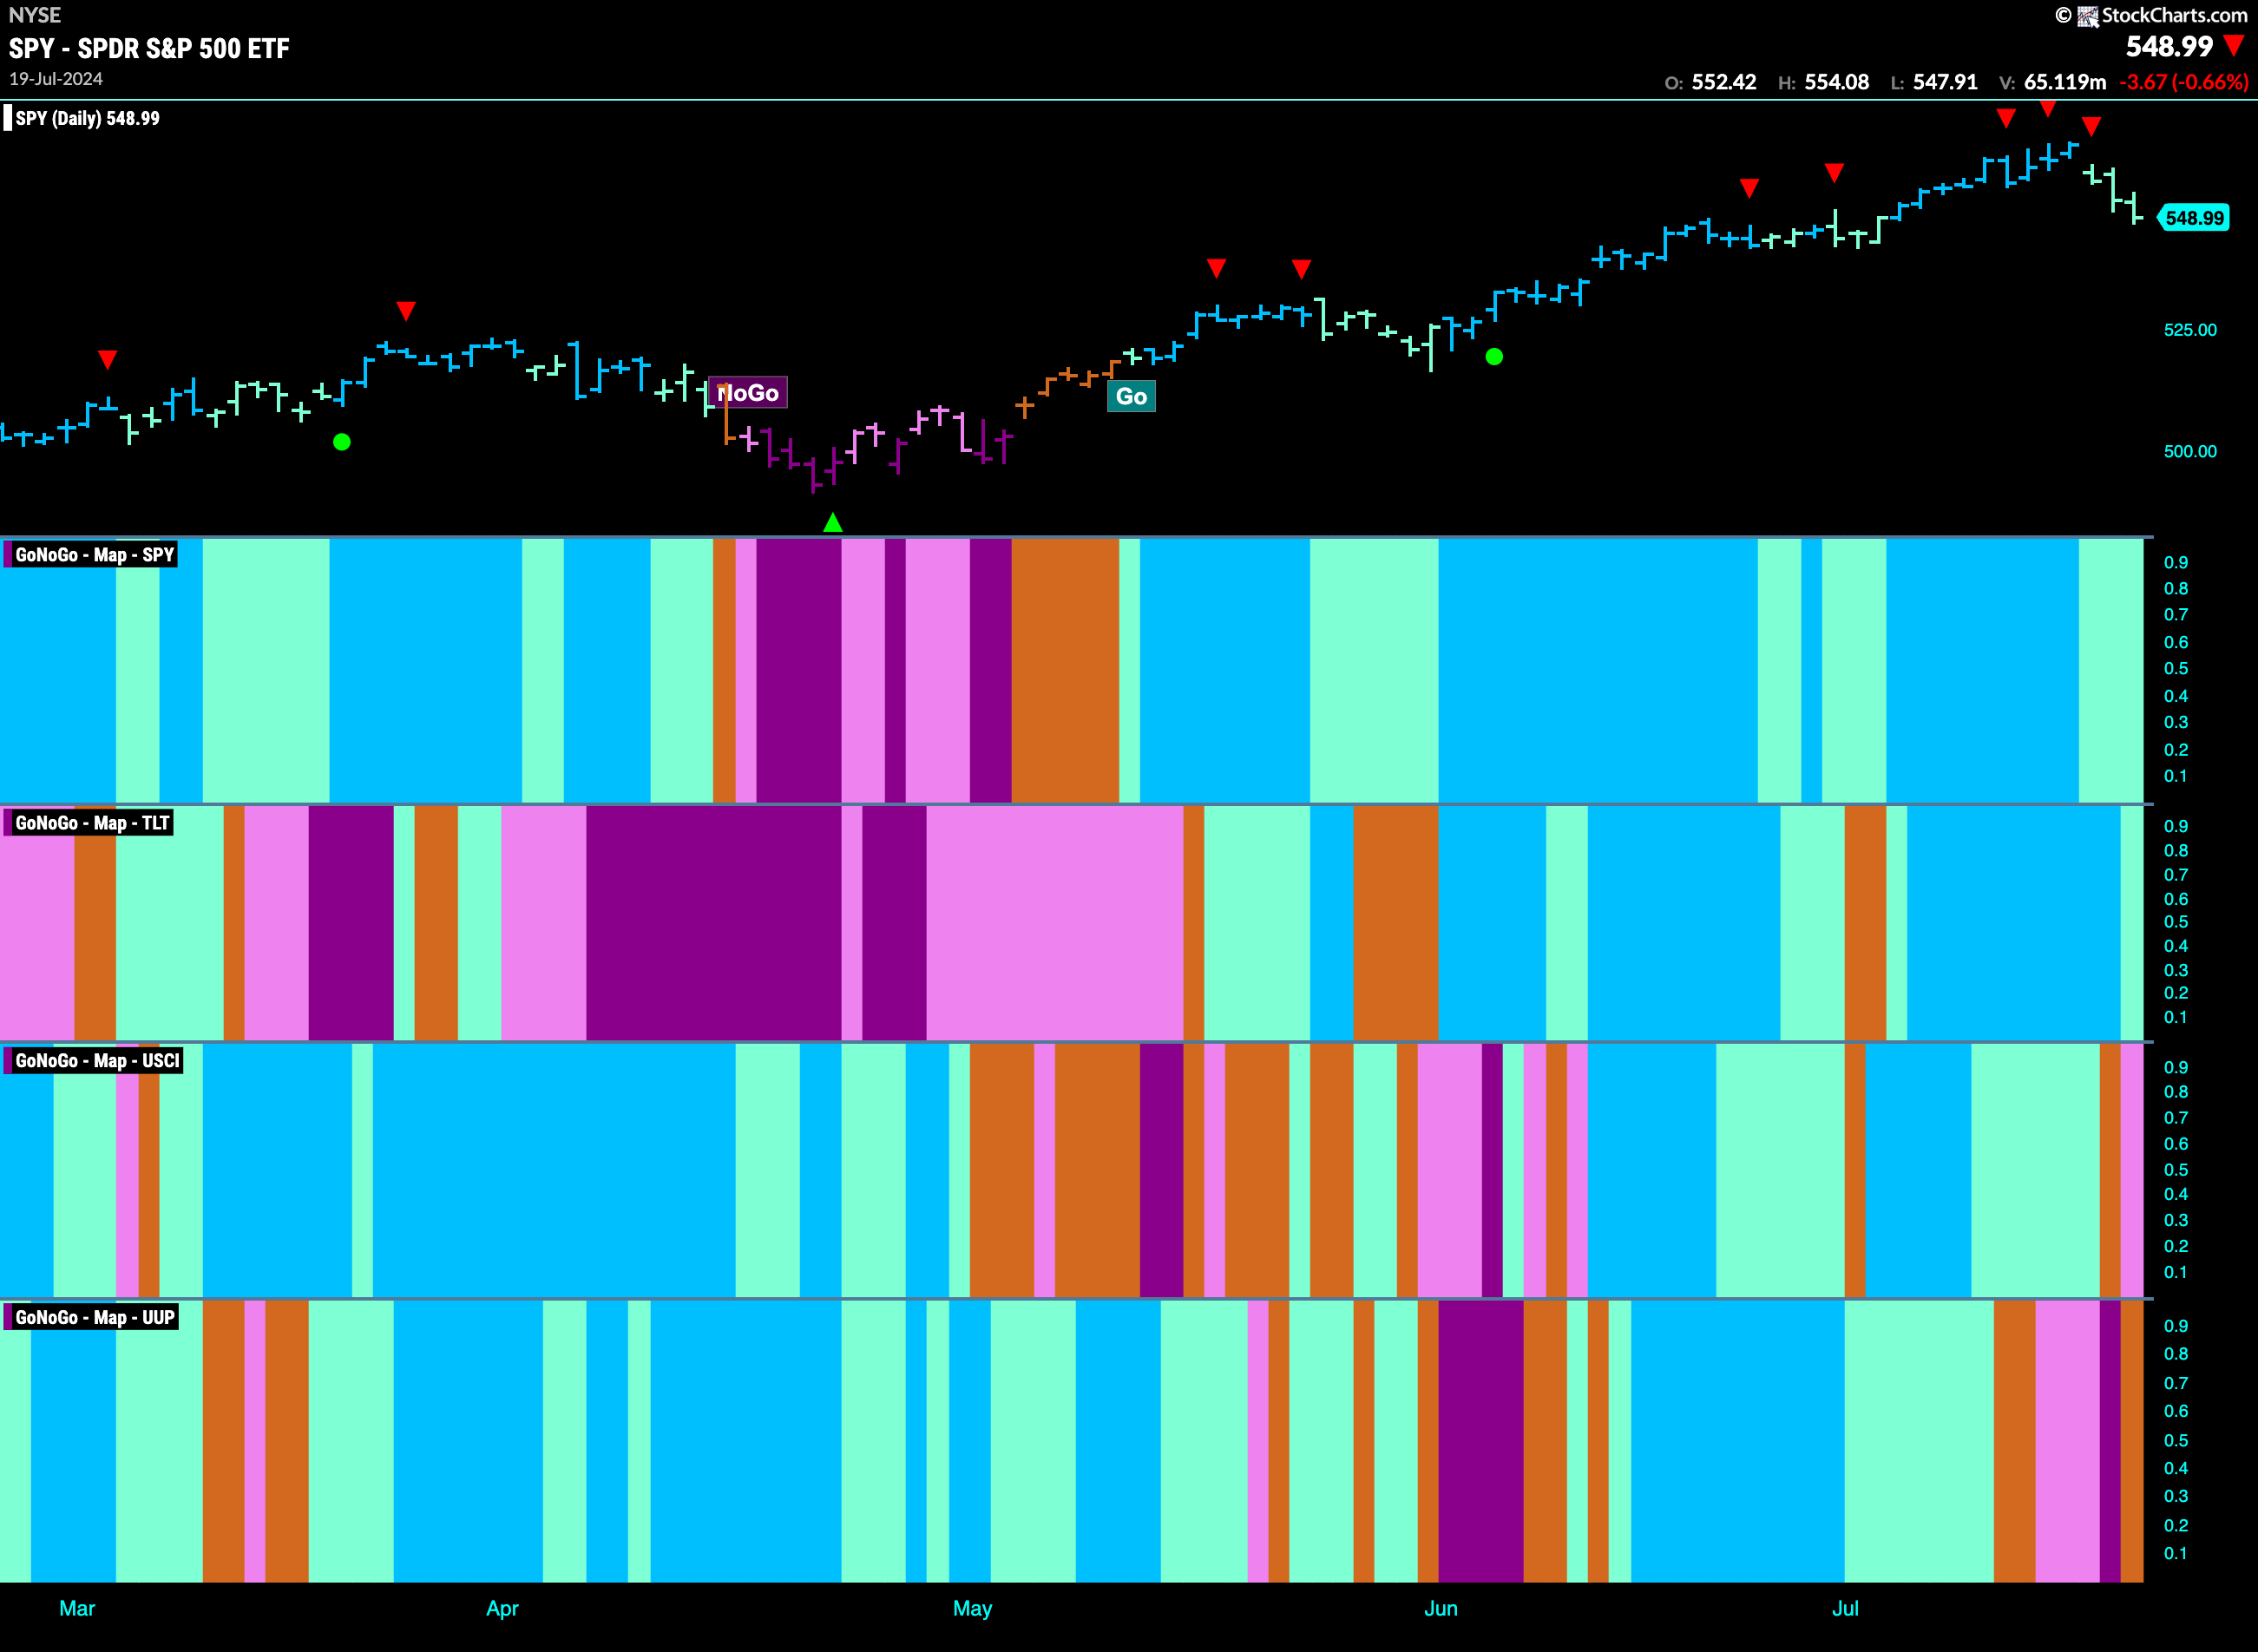
Good morning and welcome to this week’s Flight Path. We saw a lot of weakness this week but so far the “Go” trend has held in U.S. equities. GoNoGo Trend has reflected the weakness with a couple of aqua “Go” bars late in the week. Treasury bond prices showed a weaker aqua “Go” bar as well but remained in trend. The U.S. commodities index saw the “Go” trend crack and an amber “Go Fish” bar was followed by a pink “NoGo” trend bar. The dollar, having flirted with a “NoGo” all week, saw GoNoGo Trend paint an amber “Go Fish” bar on Friday.
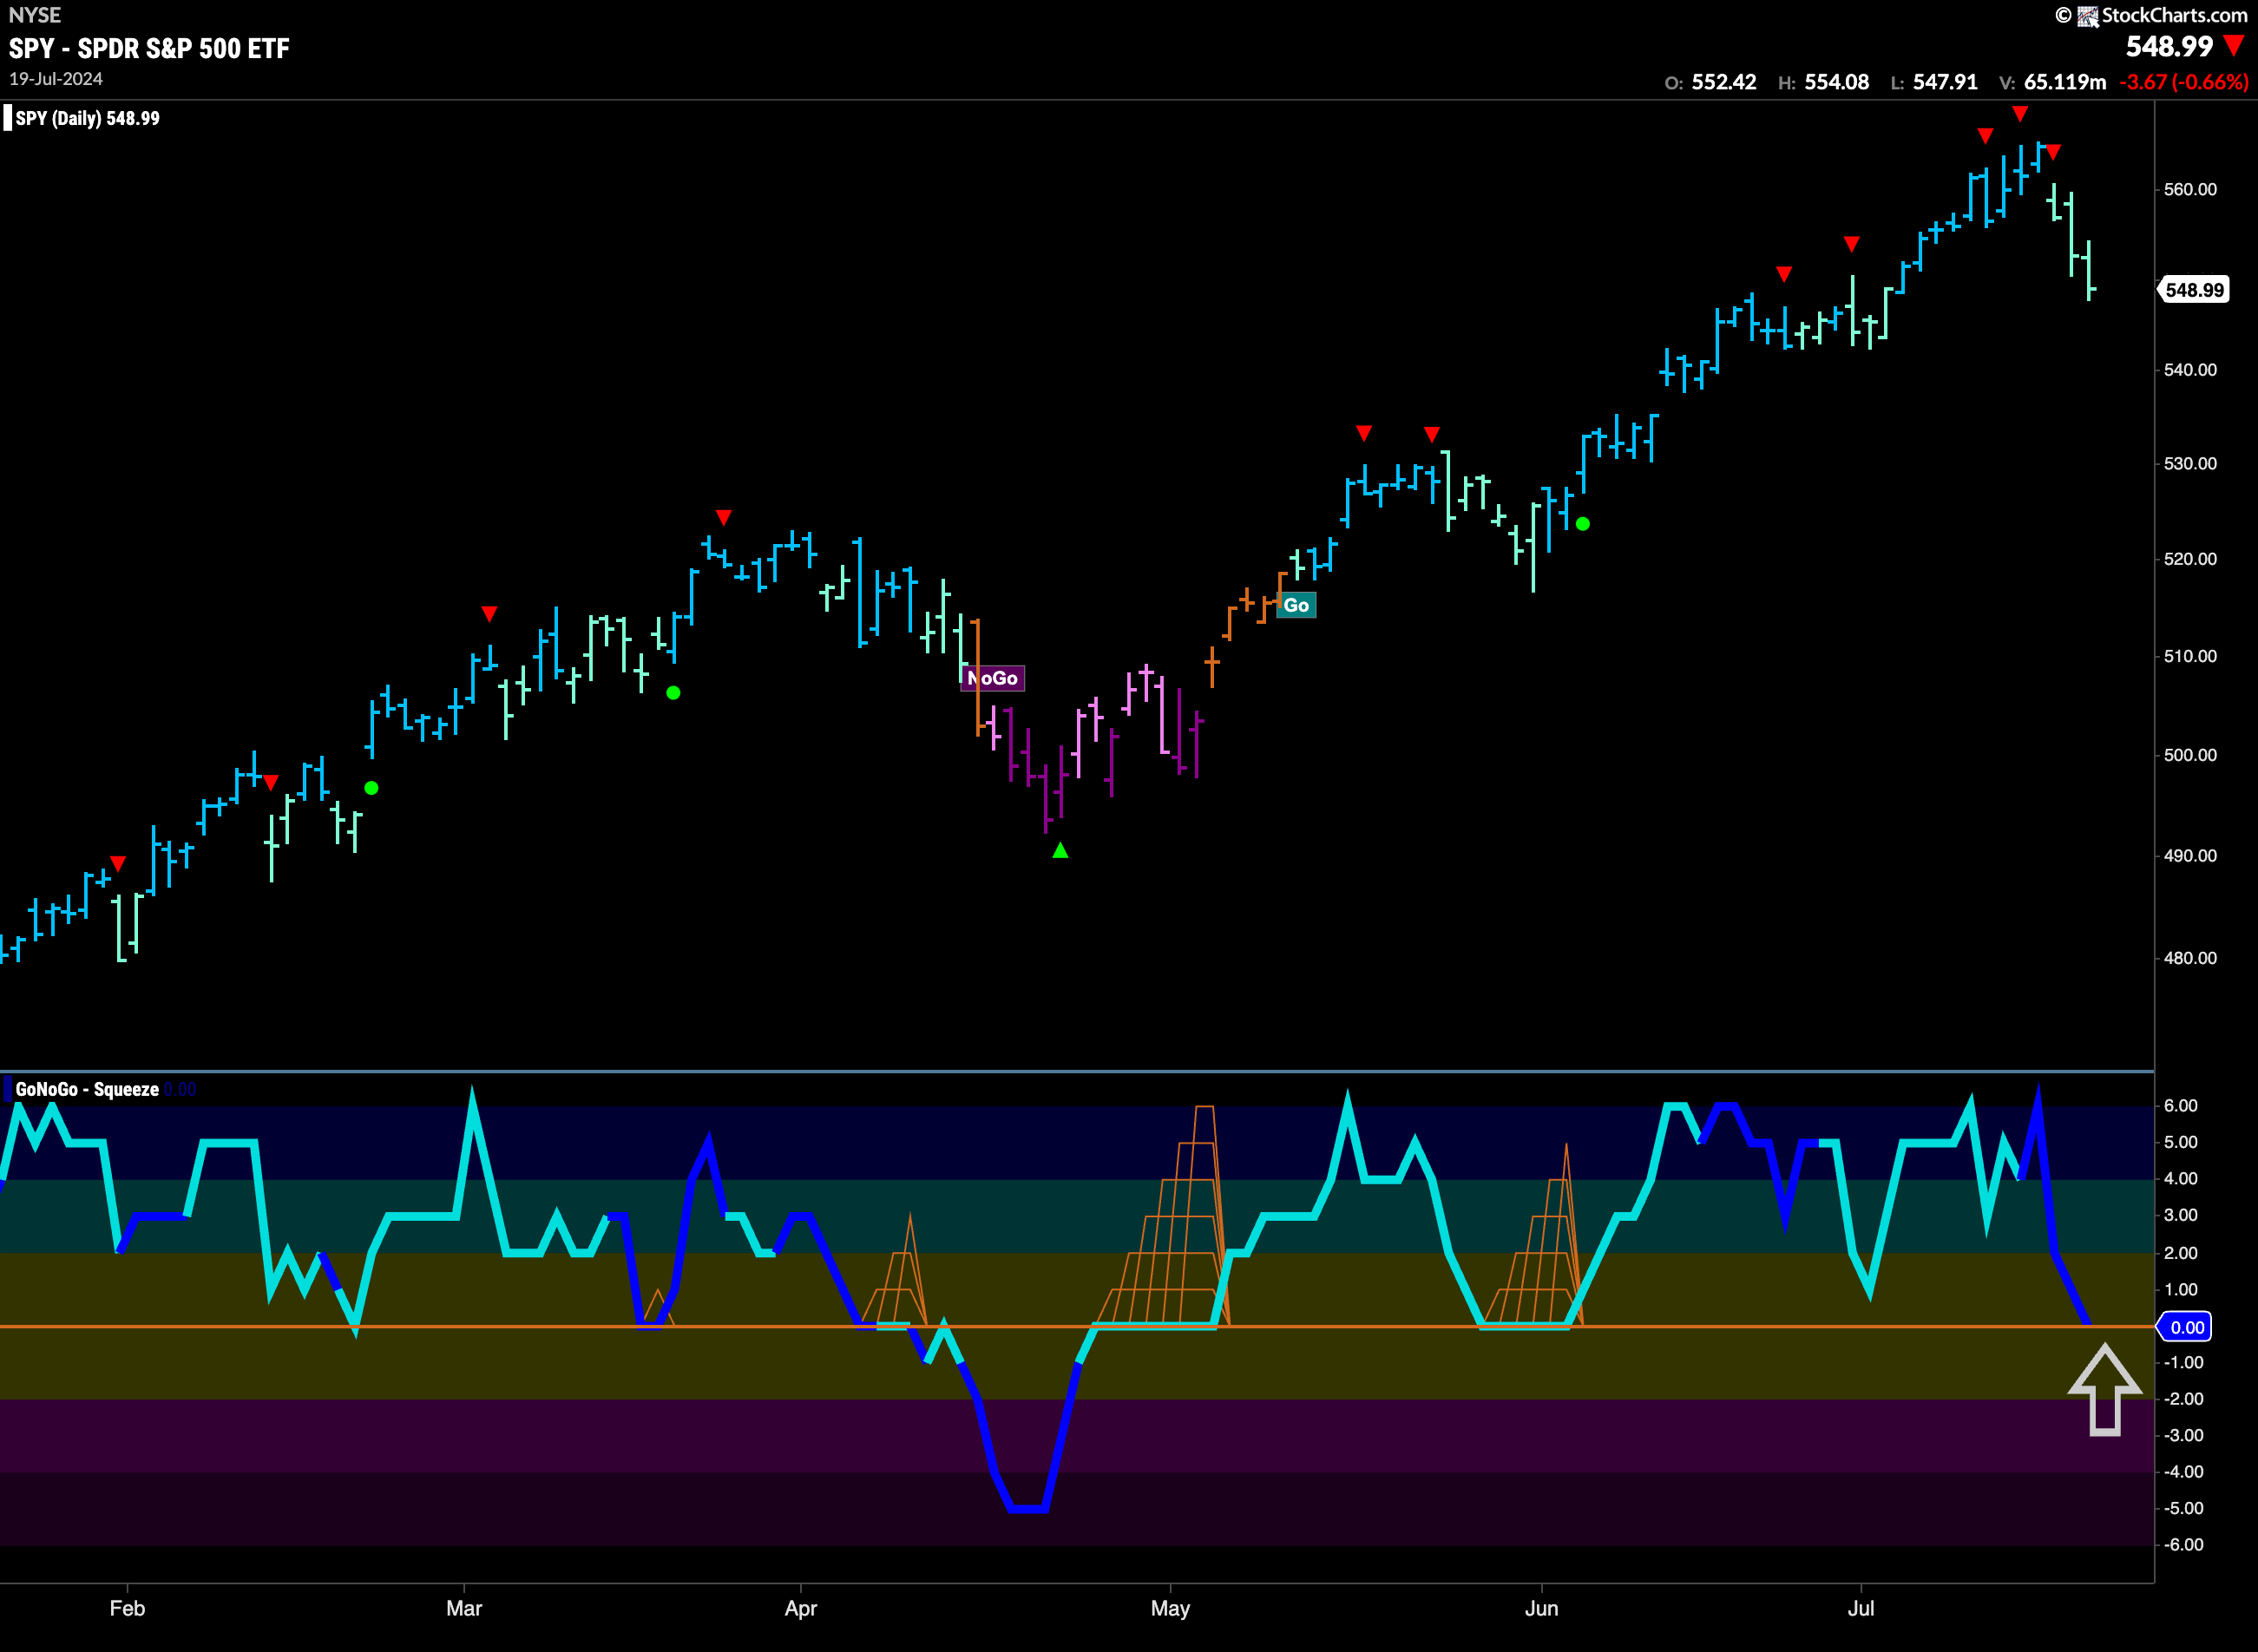
$SPY Sees Price Fall From Highs
Last week we noted the Go Countertrend Correction Icons (red arrows) indicating that price may struggle to go higher in the short term. Indeed, we saw another red arrow early in the week before price really fell away. GoNoGo Trend has painted 3 consecutive weaker aqua bars. GoNoGo Oscillator has fallen sharply to test the zero level from above on heavy volume. It will be important for the Oscillator to hold the zero line if we are to prevent a deeper price drop. We are at an area that could offer price support from recent congestion levels and so this will be an important week.
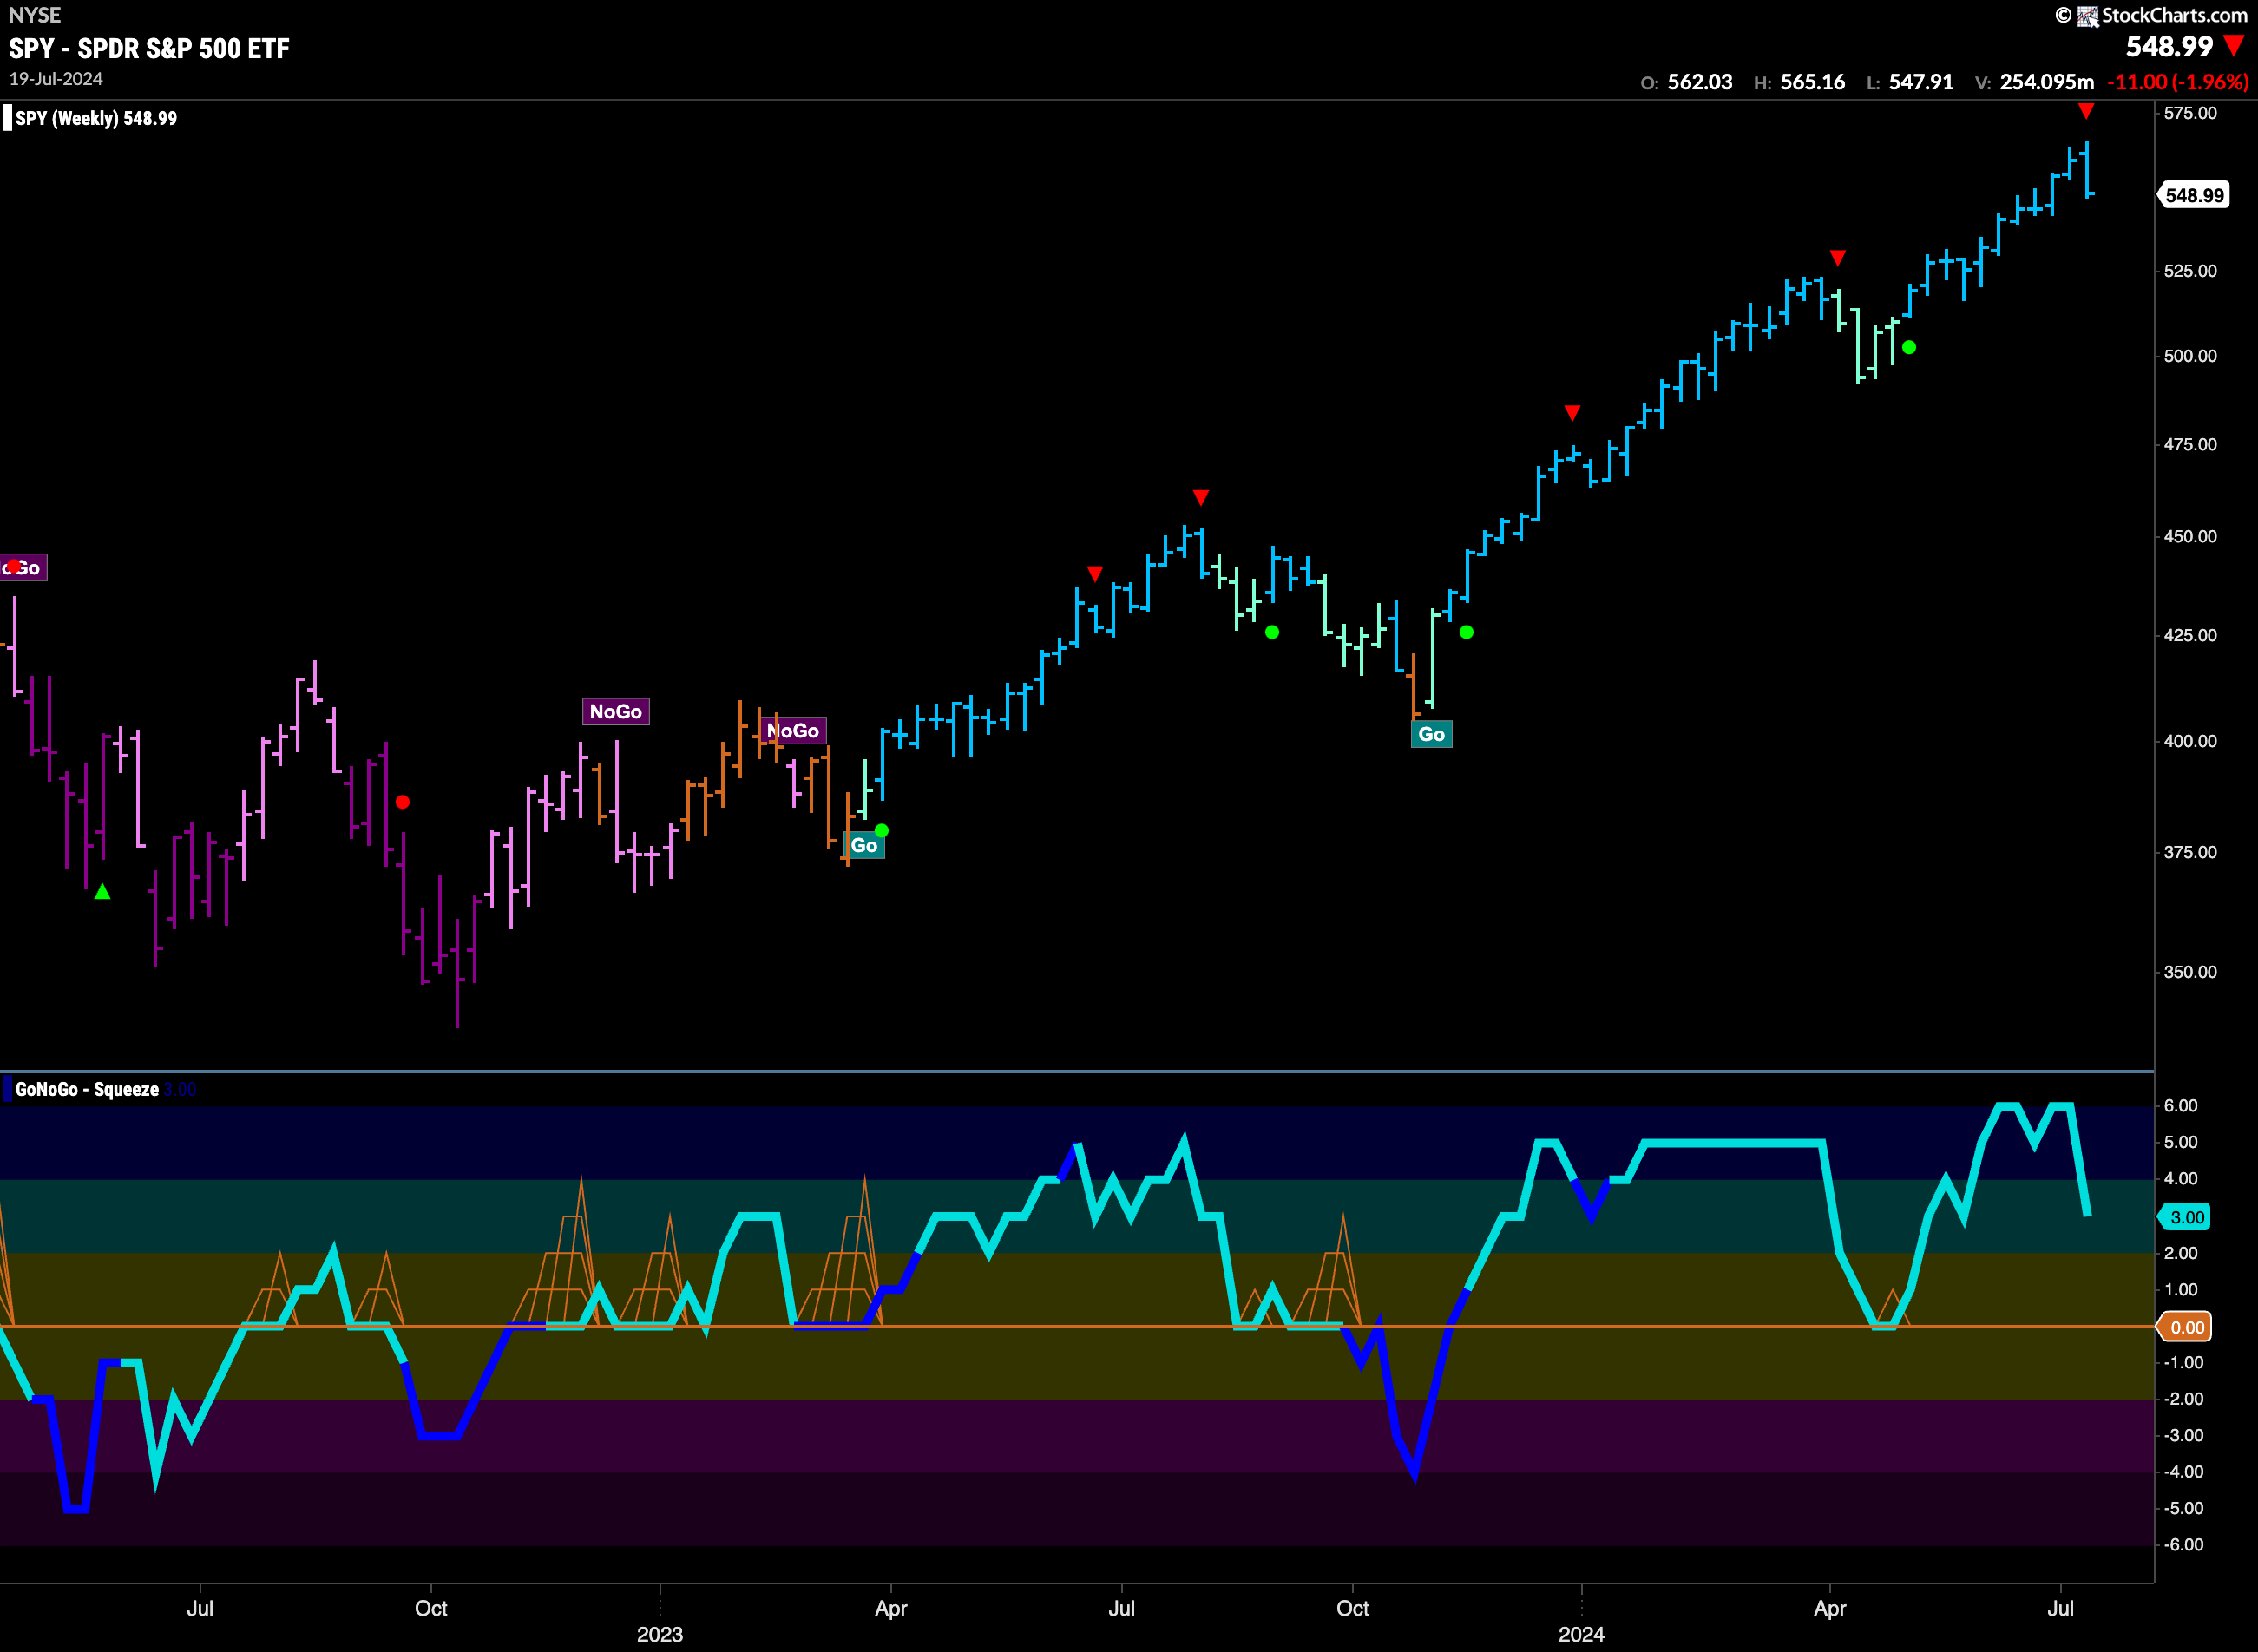
Although we still see a strong blue “Go” bar this week on the longer time frame chart, it is a lower weekly close. We also see a Go Countertrend Correction Icon (red arrow) telling us that in the short term price may struggle to go higher. GoNoGo Oscillator shows that momentum has waned and it is in positive territory but no longer overbought.
Treasury Rates Remain in “NoGo” Trend
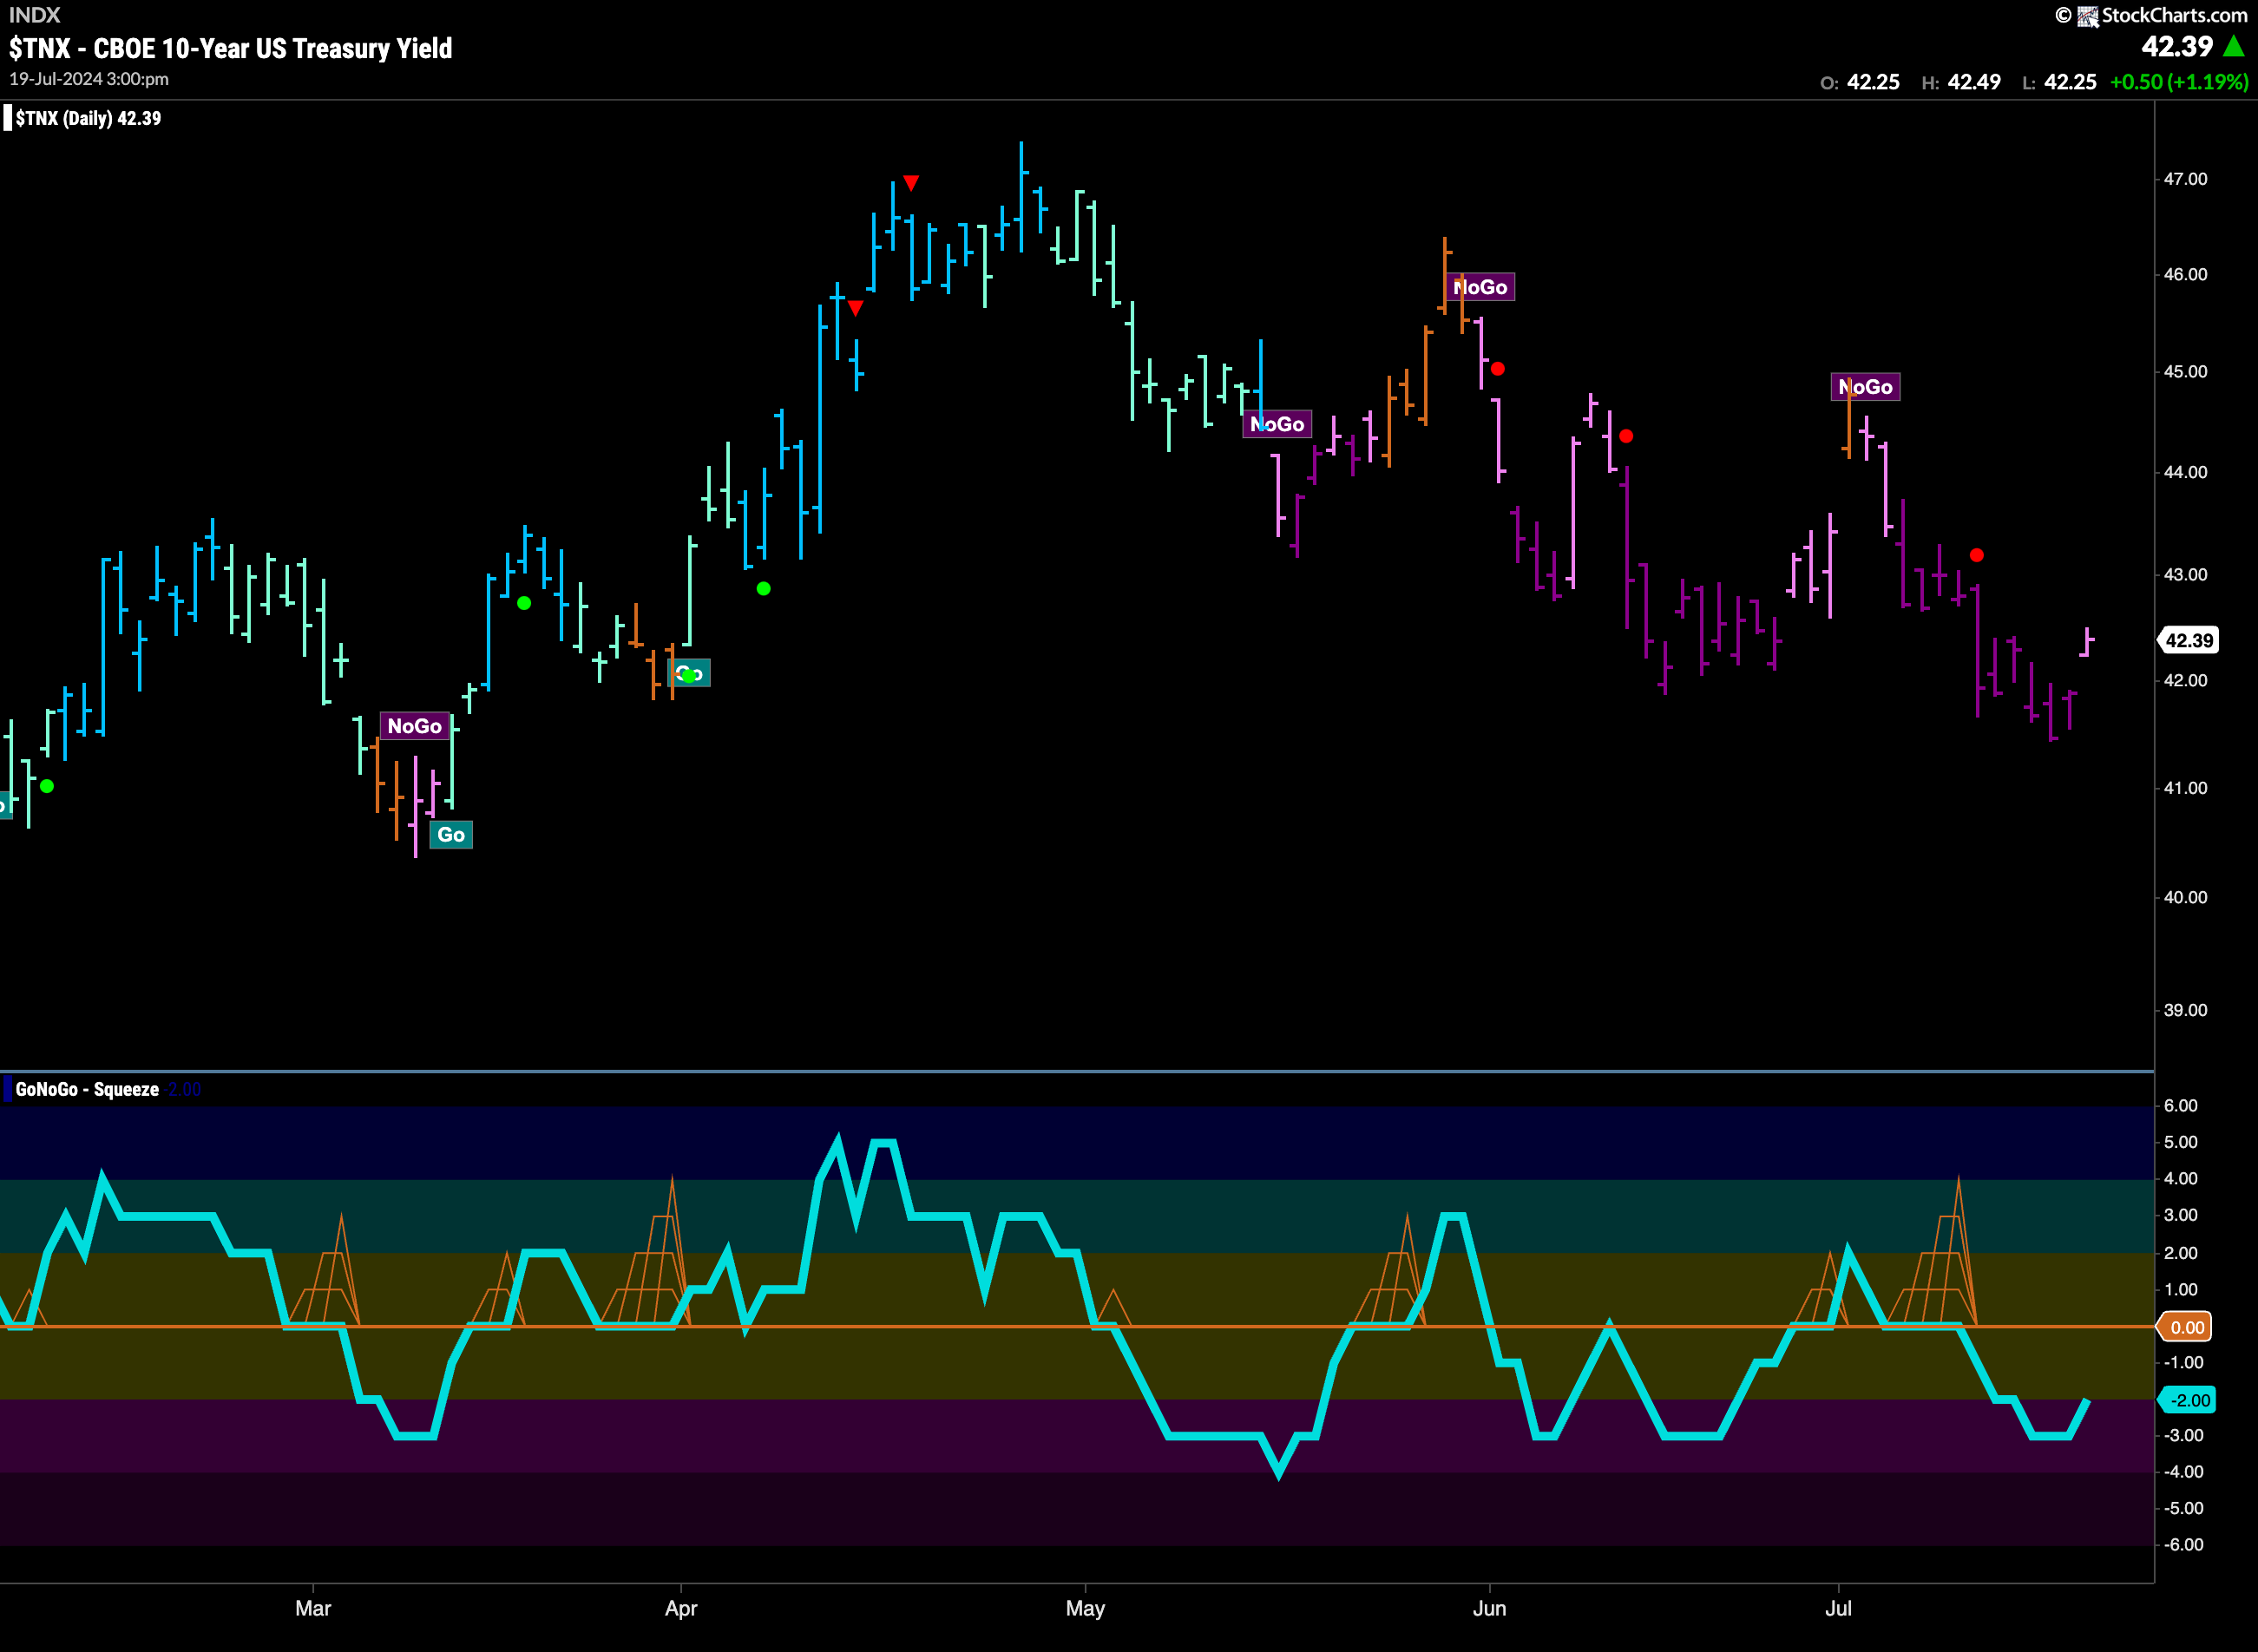
This week saw a new lower low for treasury bond rates on the daily chart. Strong purple “NoGo” bars dominated the chart until Friday when price gapped higher and GoNoGo Trend painted a weaker pink bar. GoNoGo Oscillator is in negative territory at a value of -2. We will look to see if a new lower high is set this week.
More Uncertainty for the Dollar
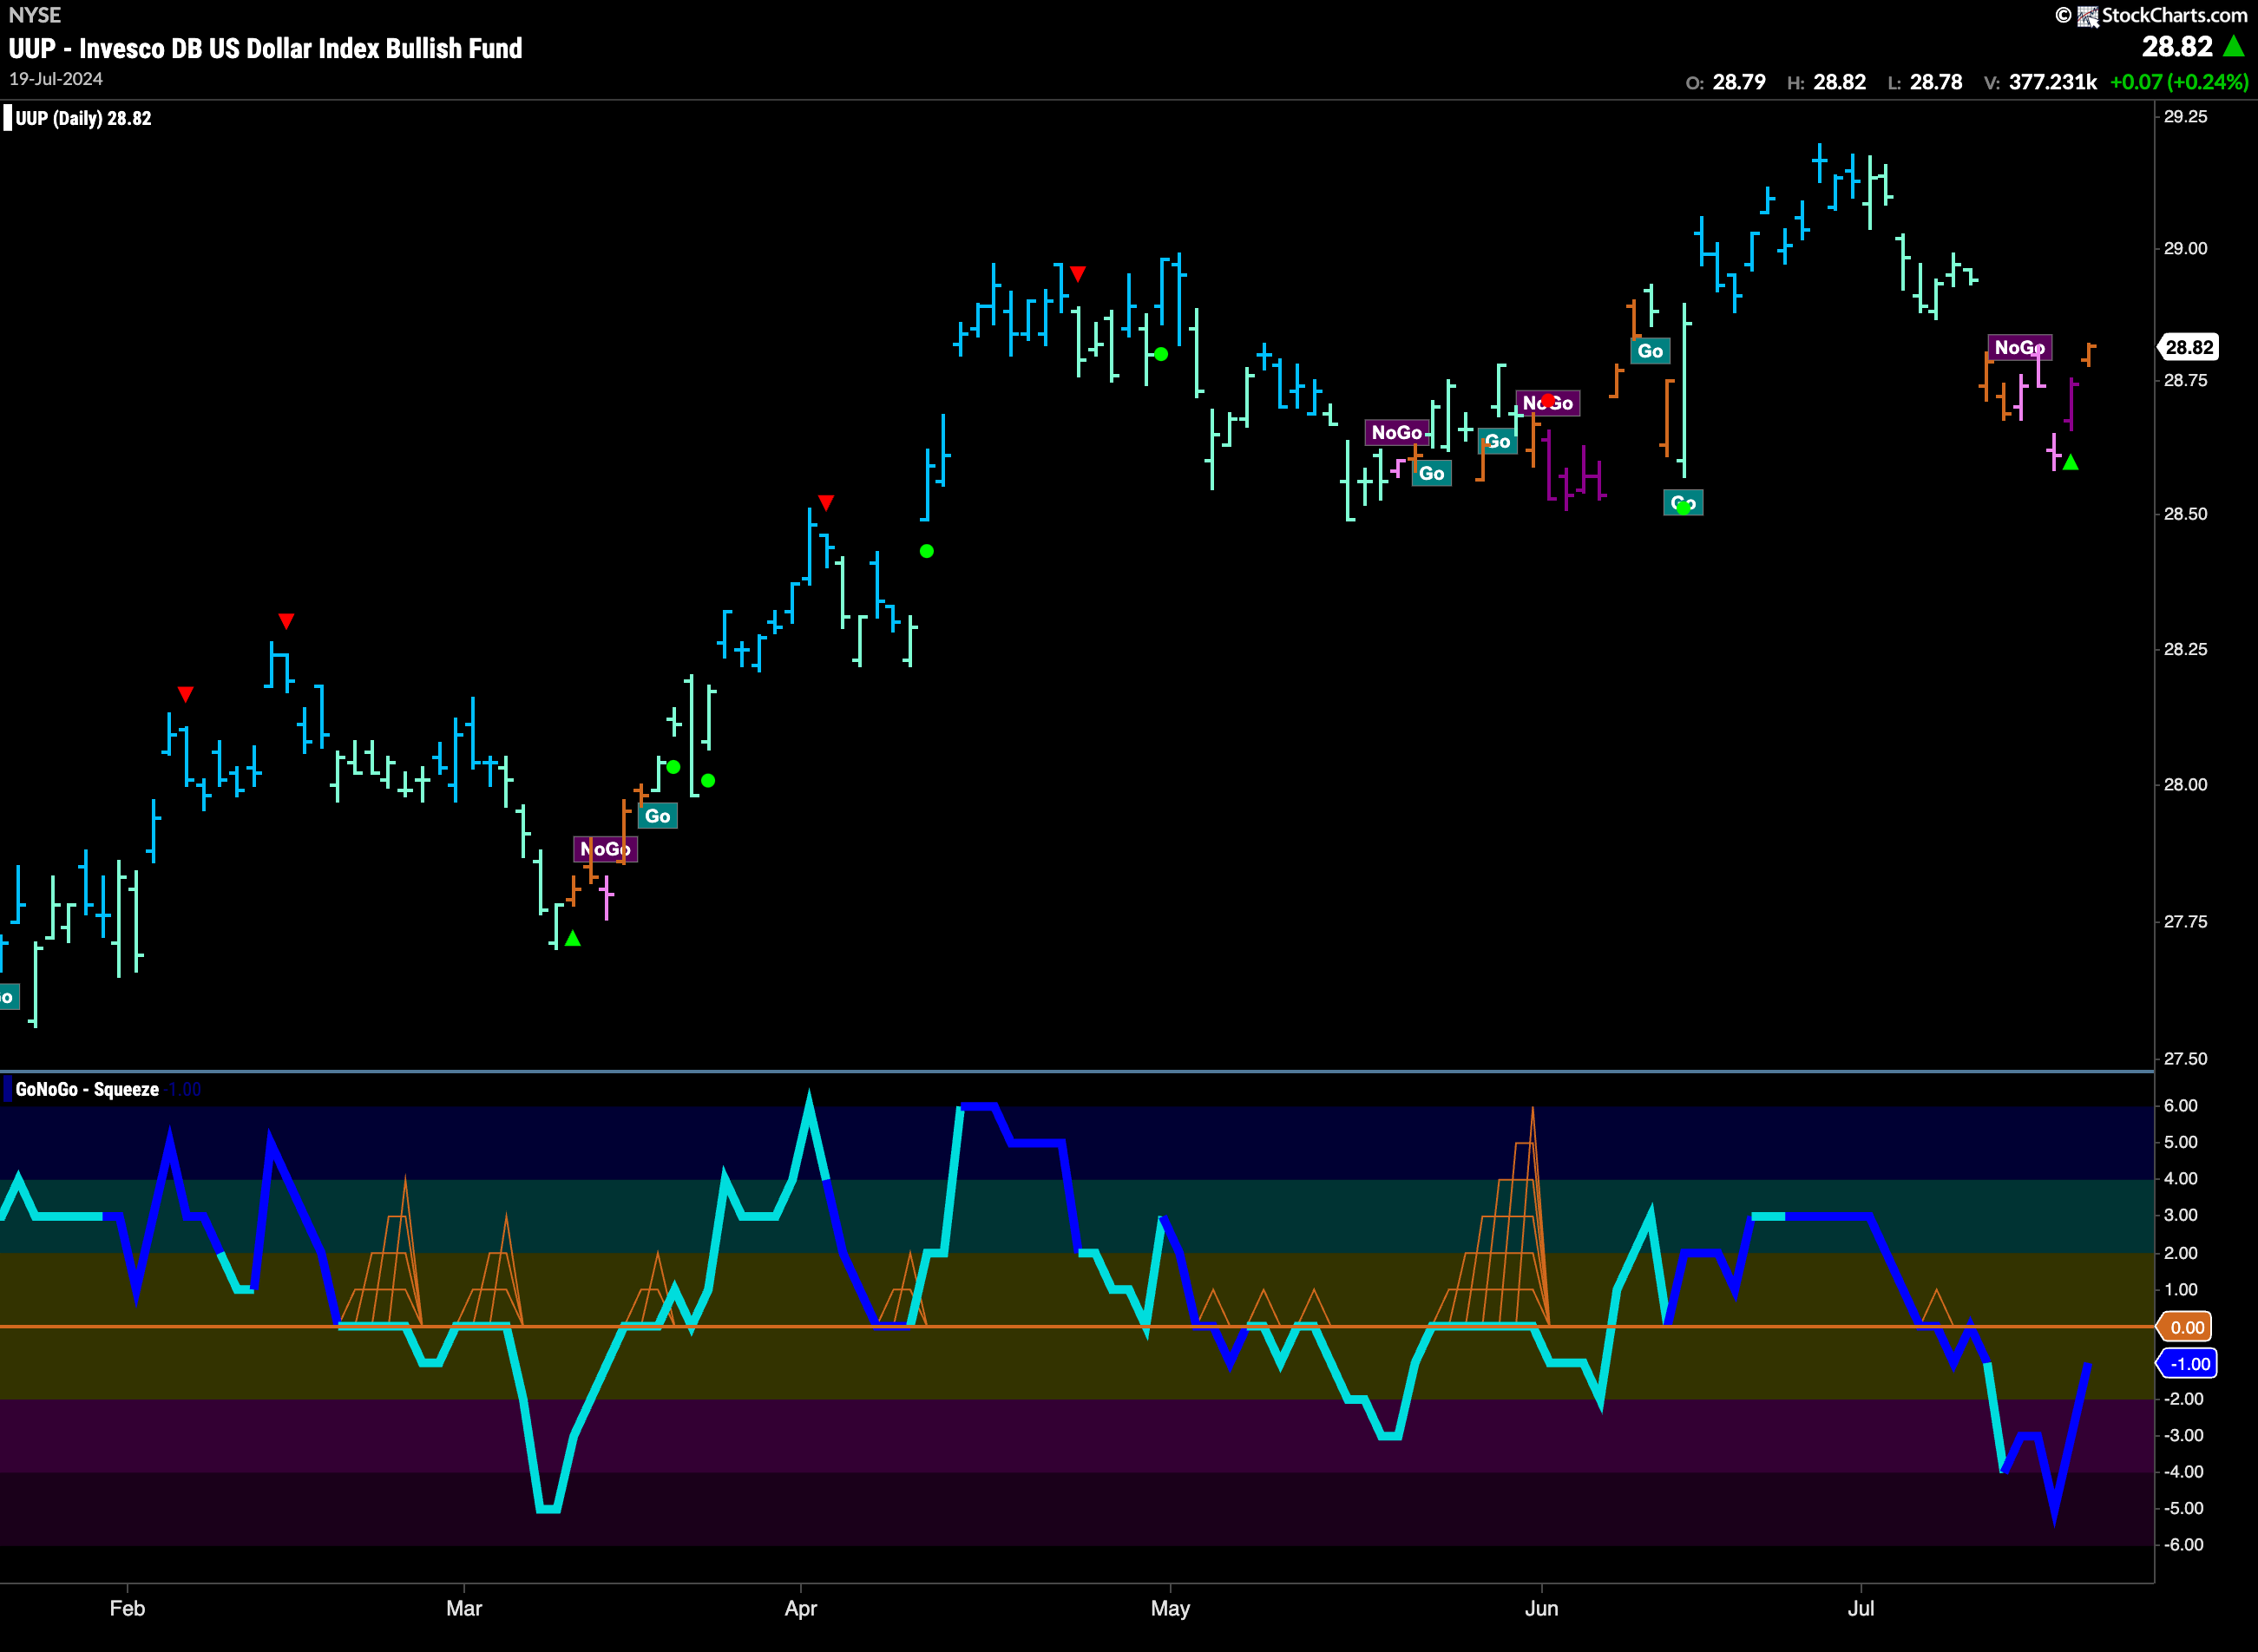
Last week we talked about the uncertainty in the dollar. This week we saw a week where GoNoGo Trend painted mostly “NoGo” bars. However, as the week came to a close, we saw an amber “Go Fish” bar. Uncertainty book ends the few “NoGo” bars we saw in between. GoNoGo Oscillator is rising toward the zero line on heavy volume. We will watch to see if it stays in negative territory or if it can attack the zero line.
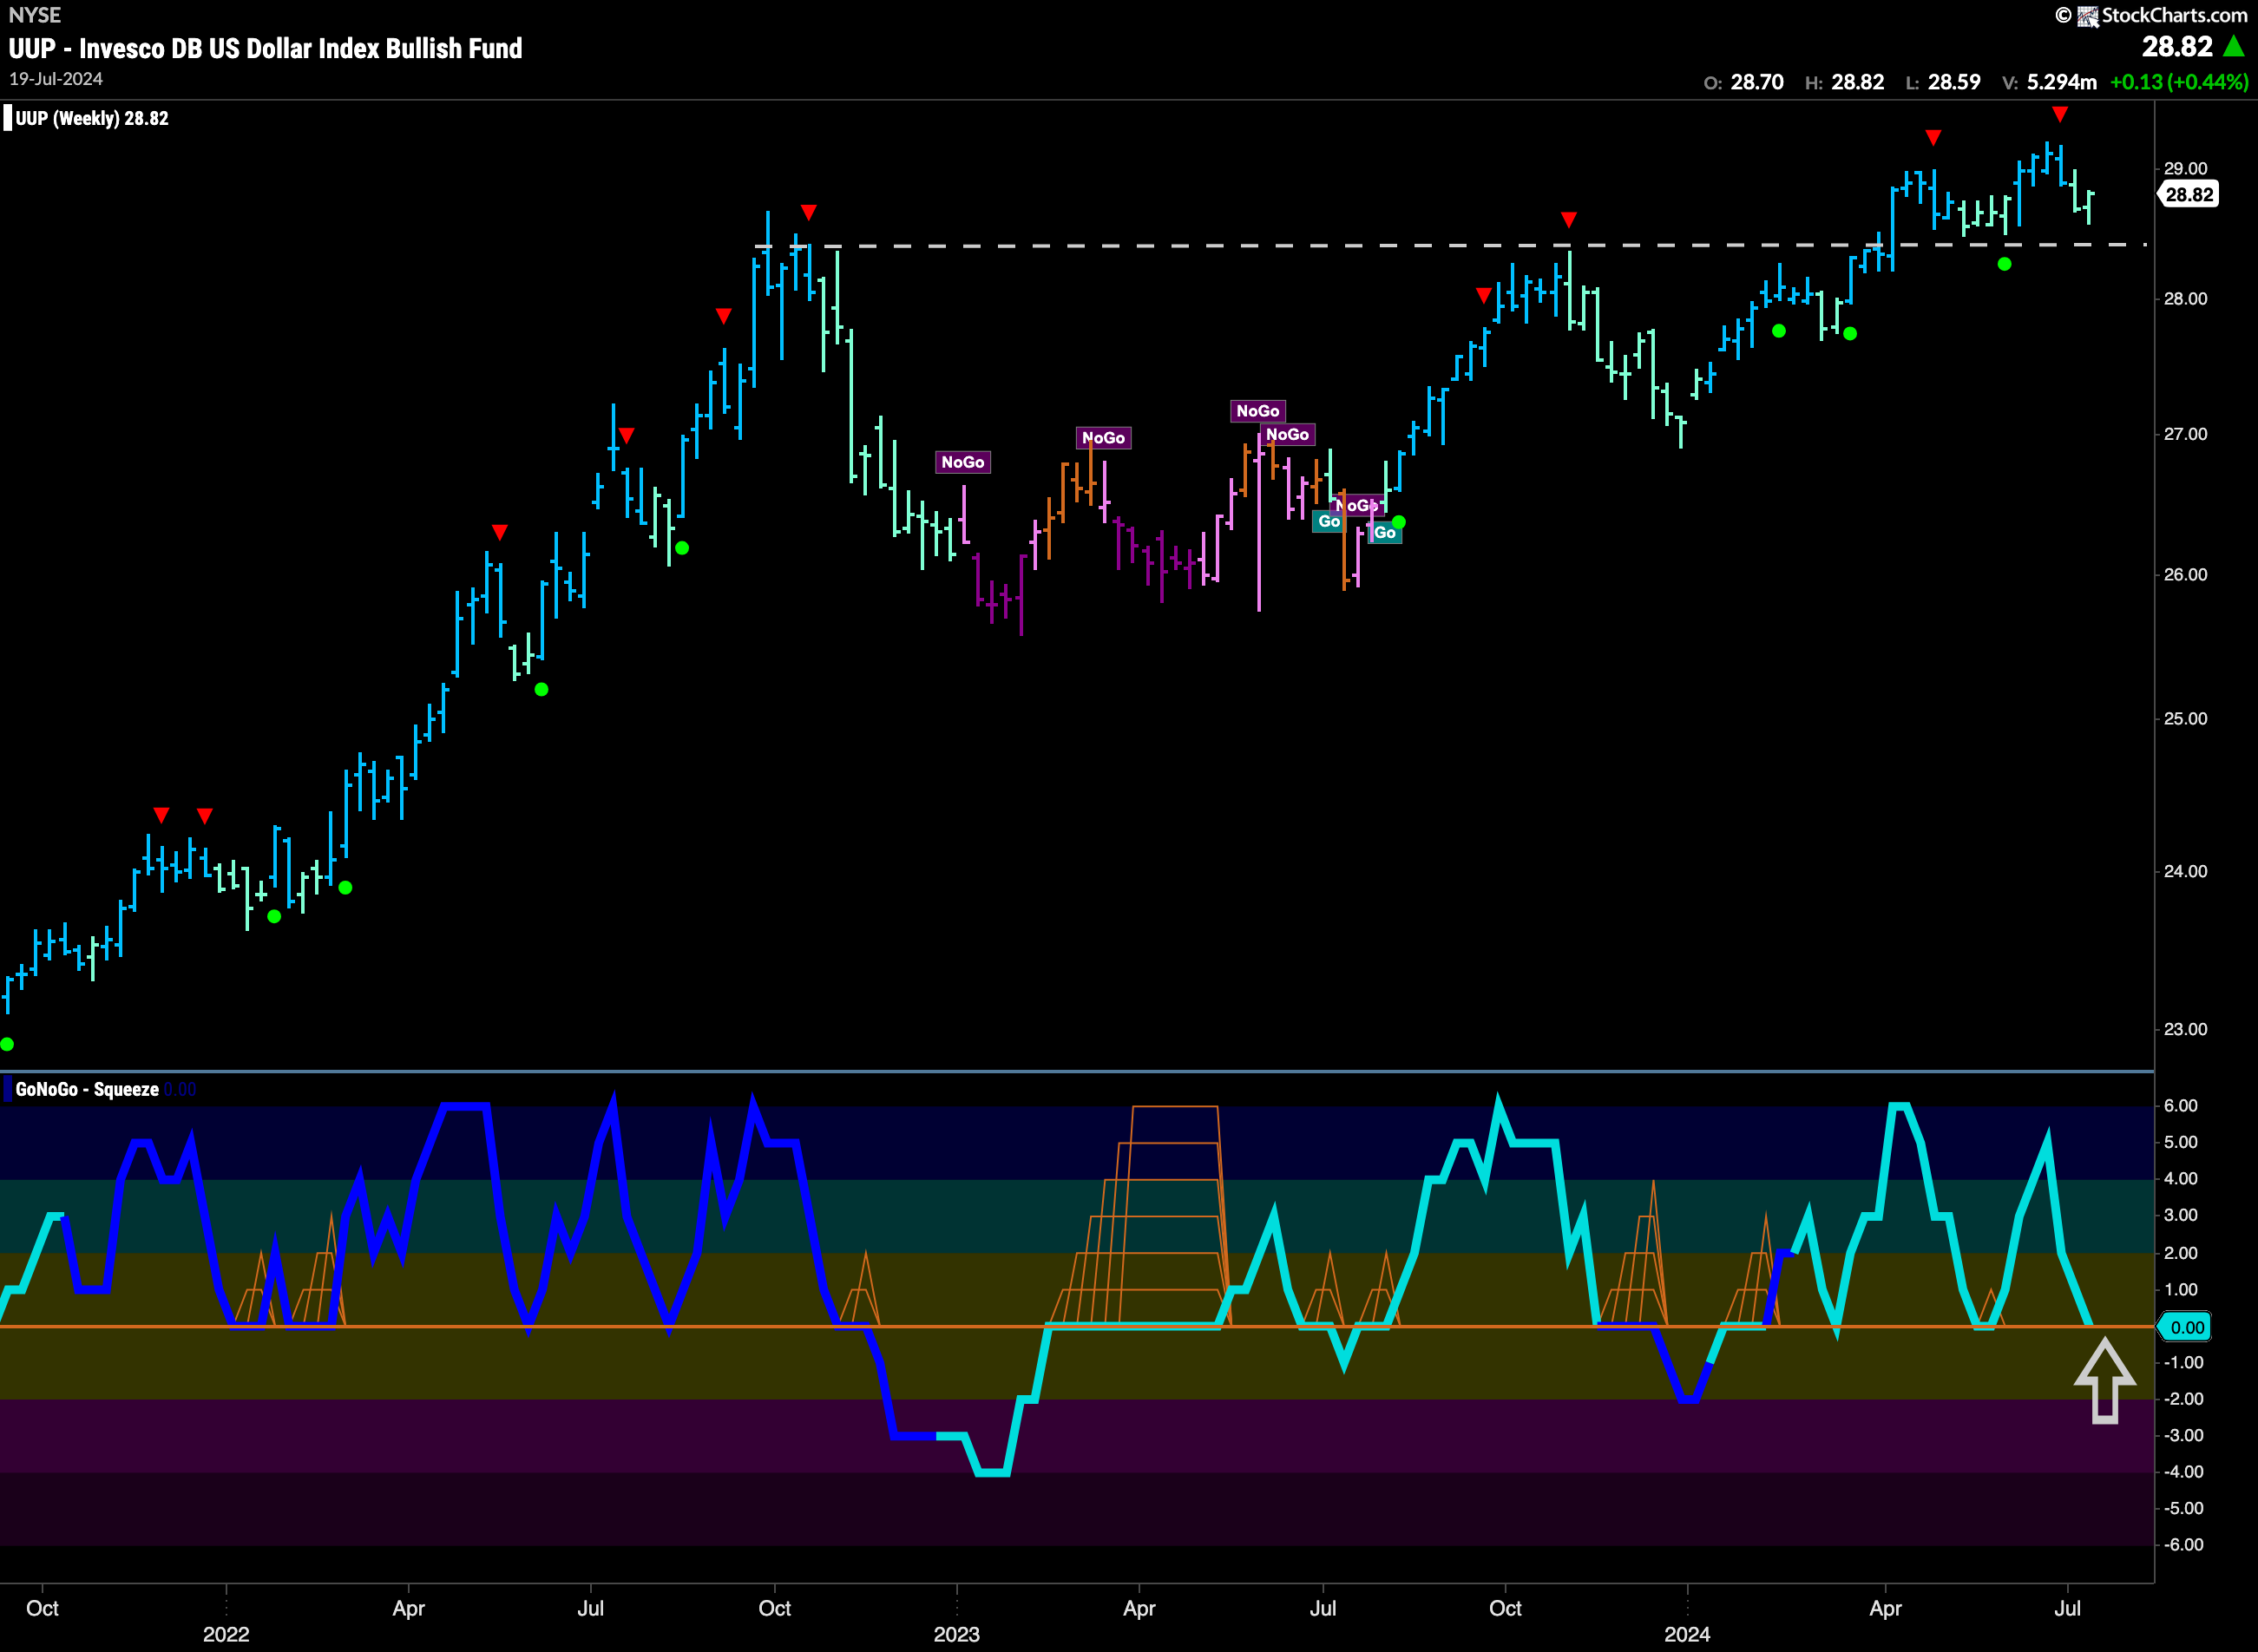
The weekly chart looks much the same as it did last week. The “Go” trend is hanging on and price is at levels that are above what should be strong support. GoNoGo Trend is painting weaker aqua “Go” bars after price fell from the last Go Countertrend Correction Icon. GoNoGo Oscillator is at zero, where we will watch to see if it finds support.
USO in Struggle to Hold “Go” Trend
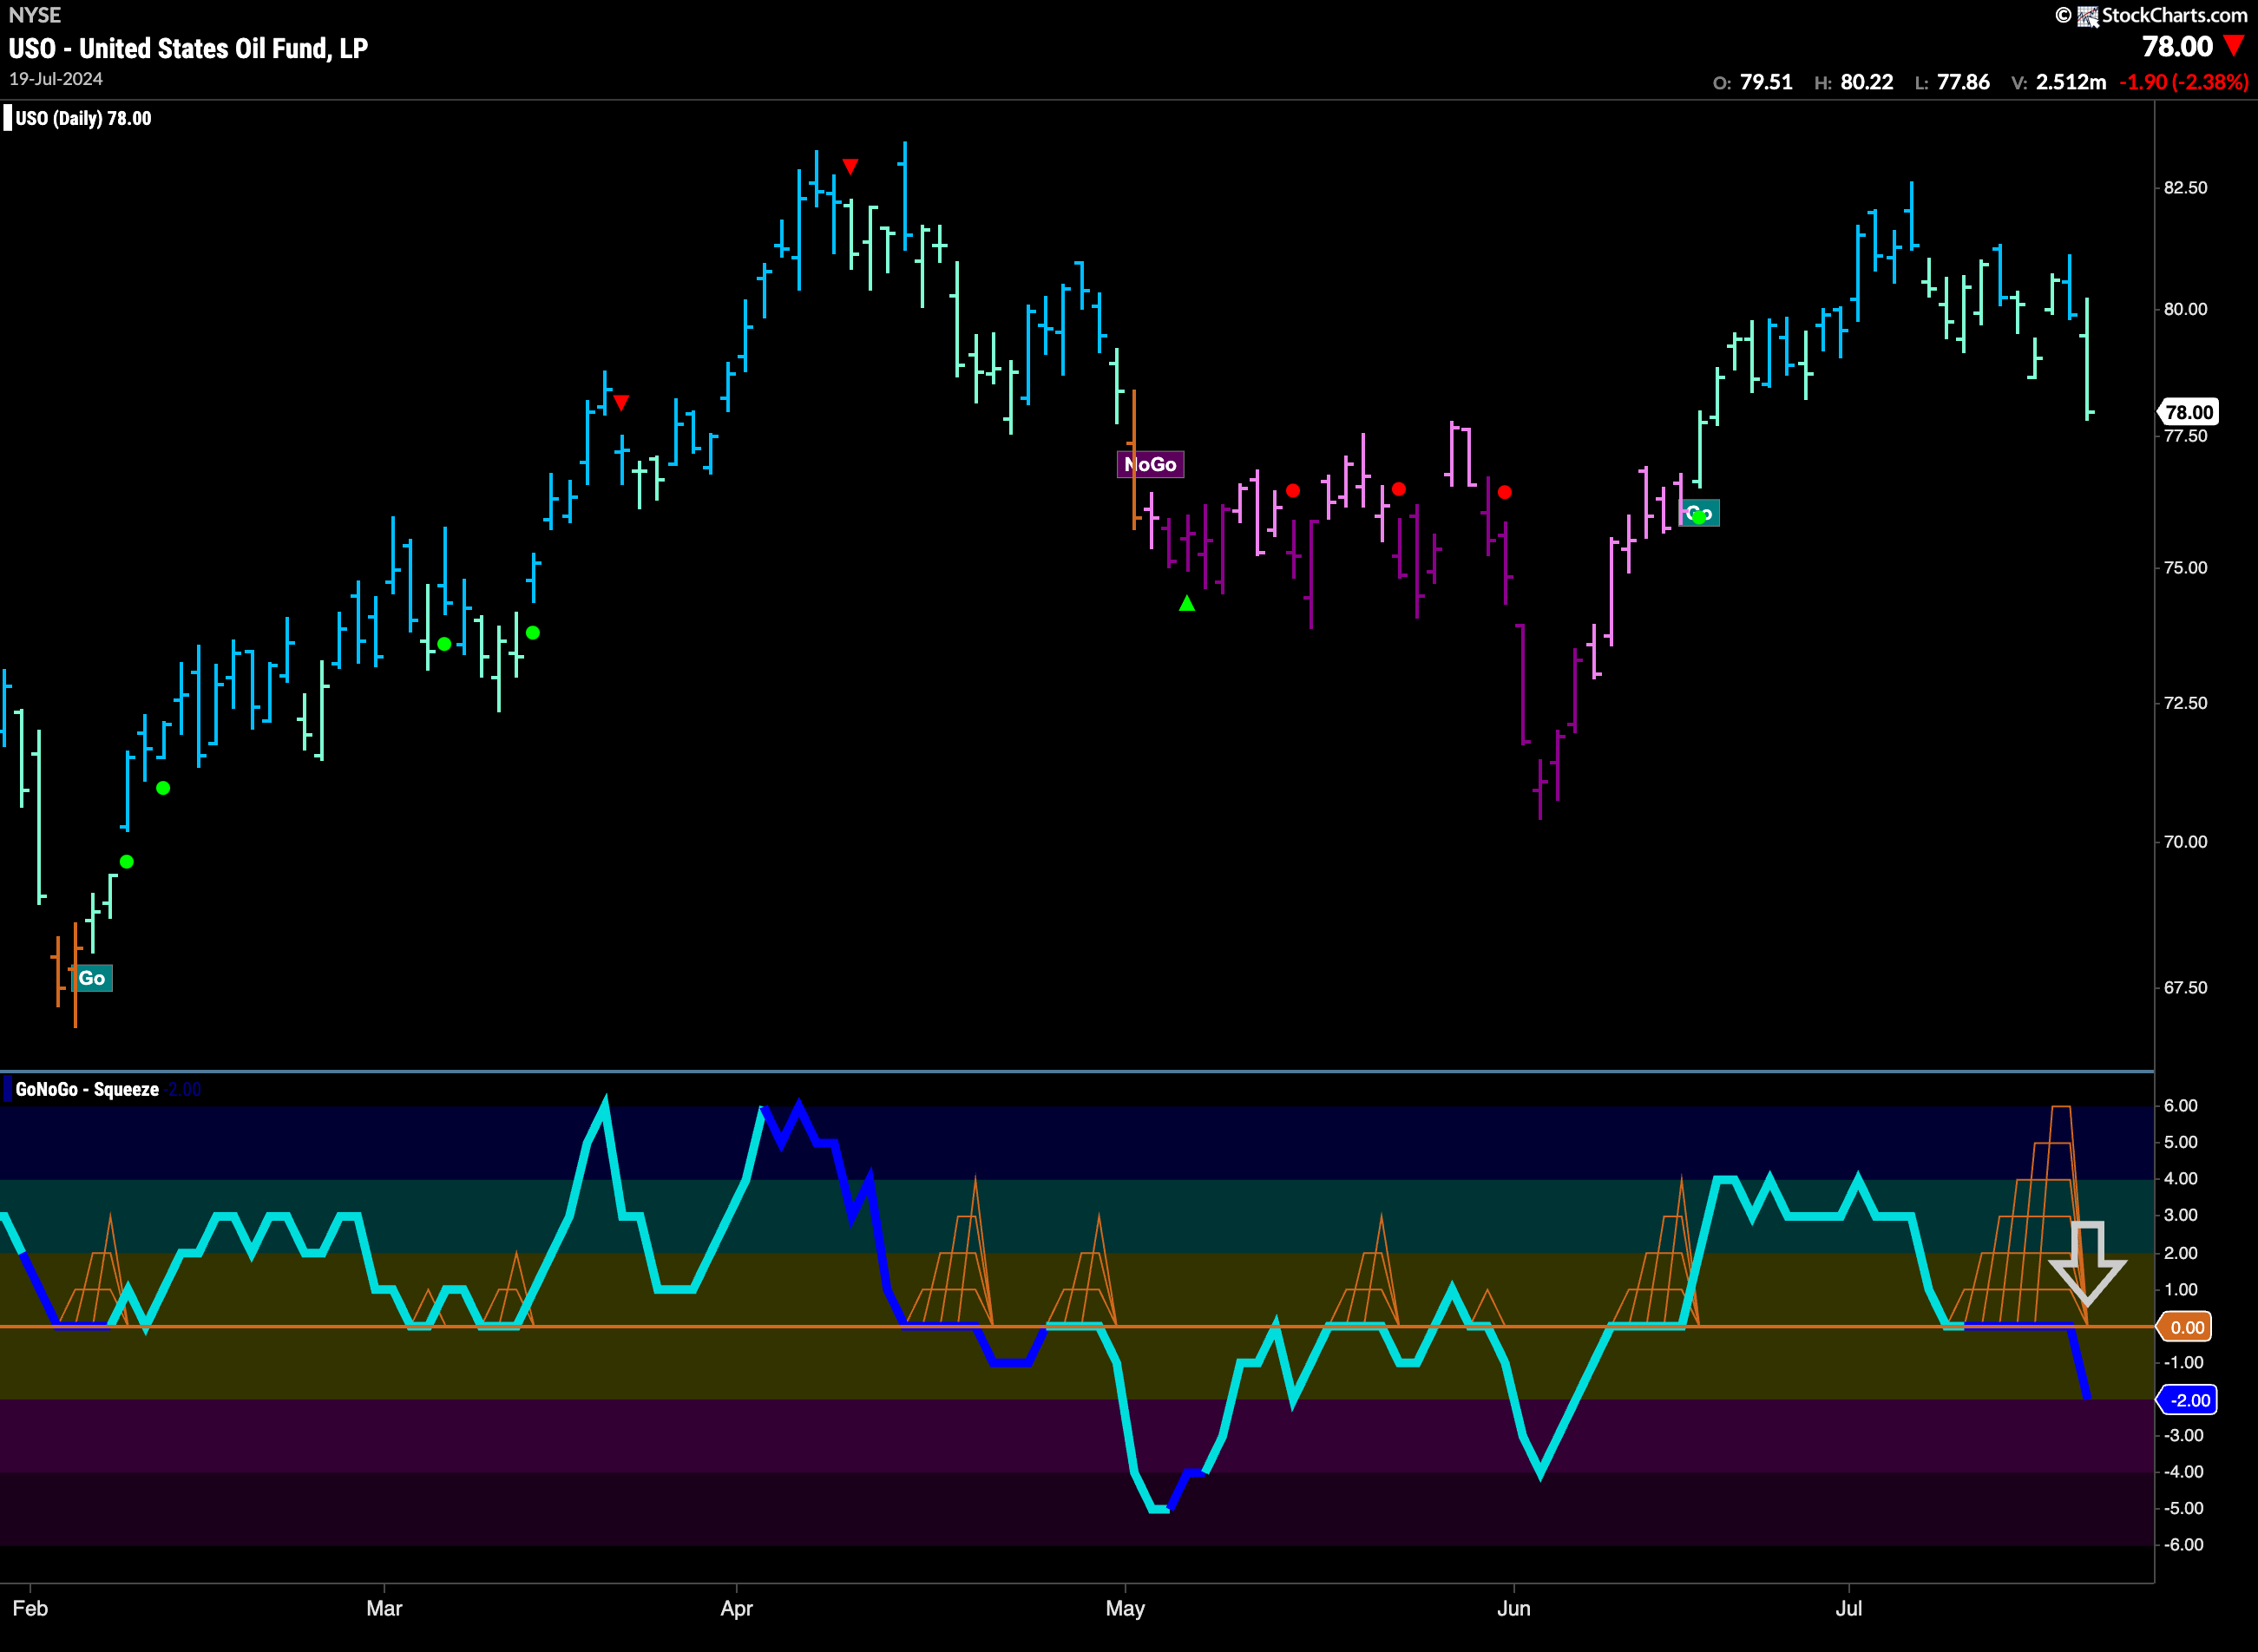
GoNoGo Trend saw price edge lower this week and a strong down bar on Friday put in a new lower low. Since failing to set a new higher high a few weeks ago, price has meandered lower with GoNoGo Trend painting mostly aqua “Go” bars. If we turn our attention to the GoNoGo Oscillator, we can see that it has broken out of a Max GoNoGo Squeeze into negative territory on heavy volume. This tells us that momentum is now out of step with the underlying “Go” trend.
Gold Tries to Break Higher
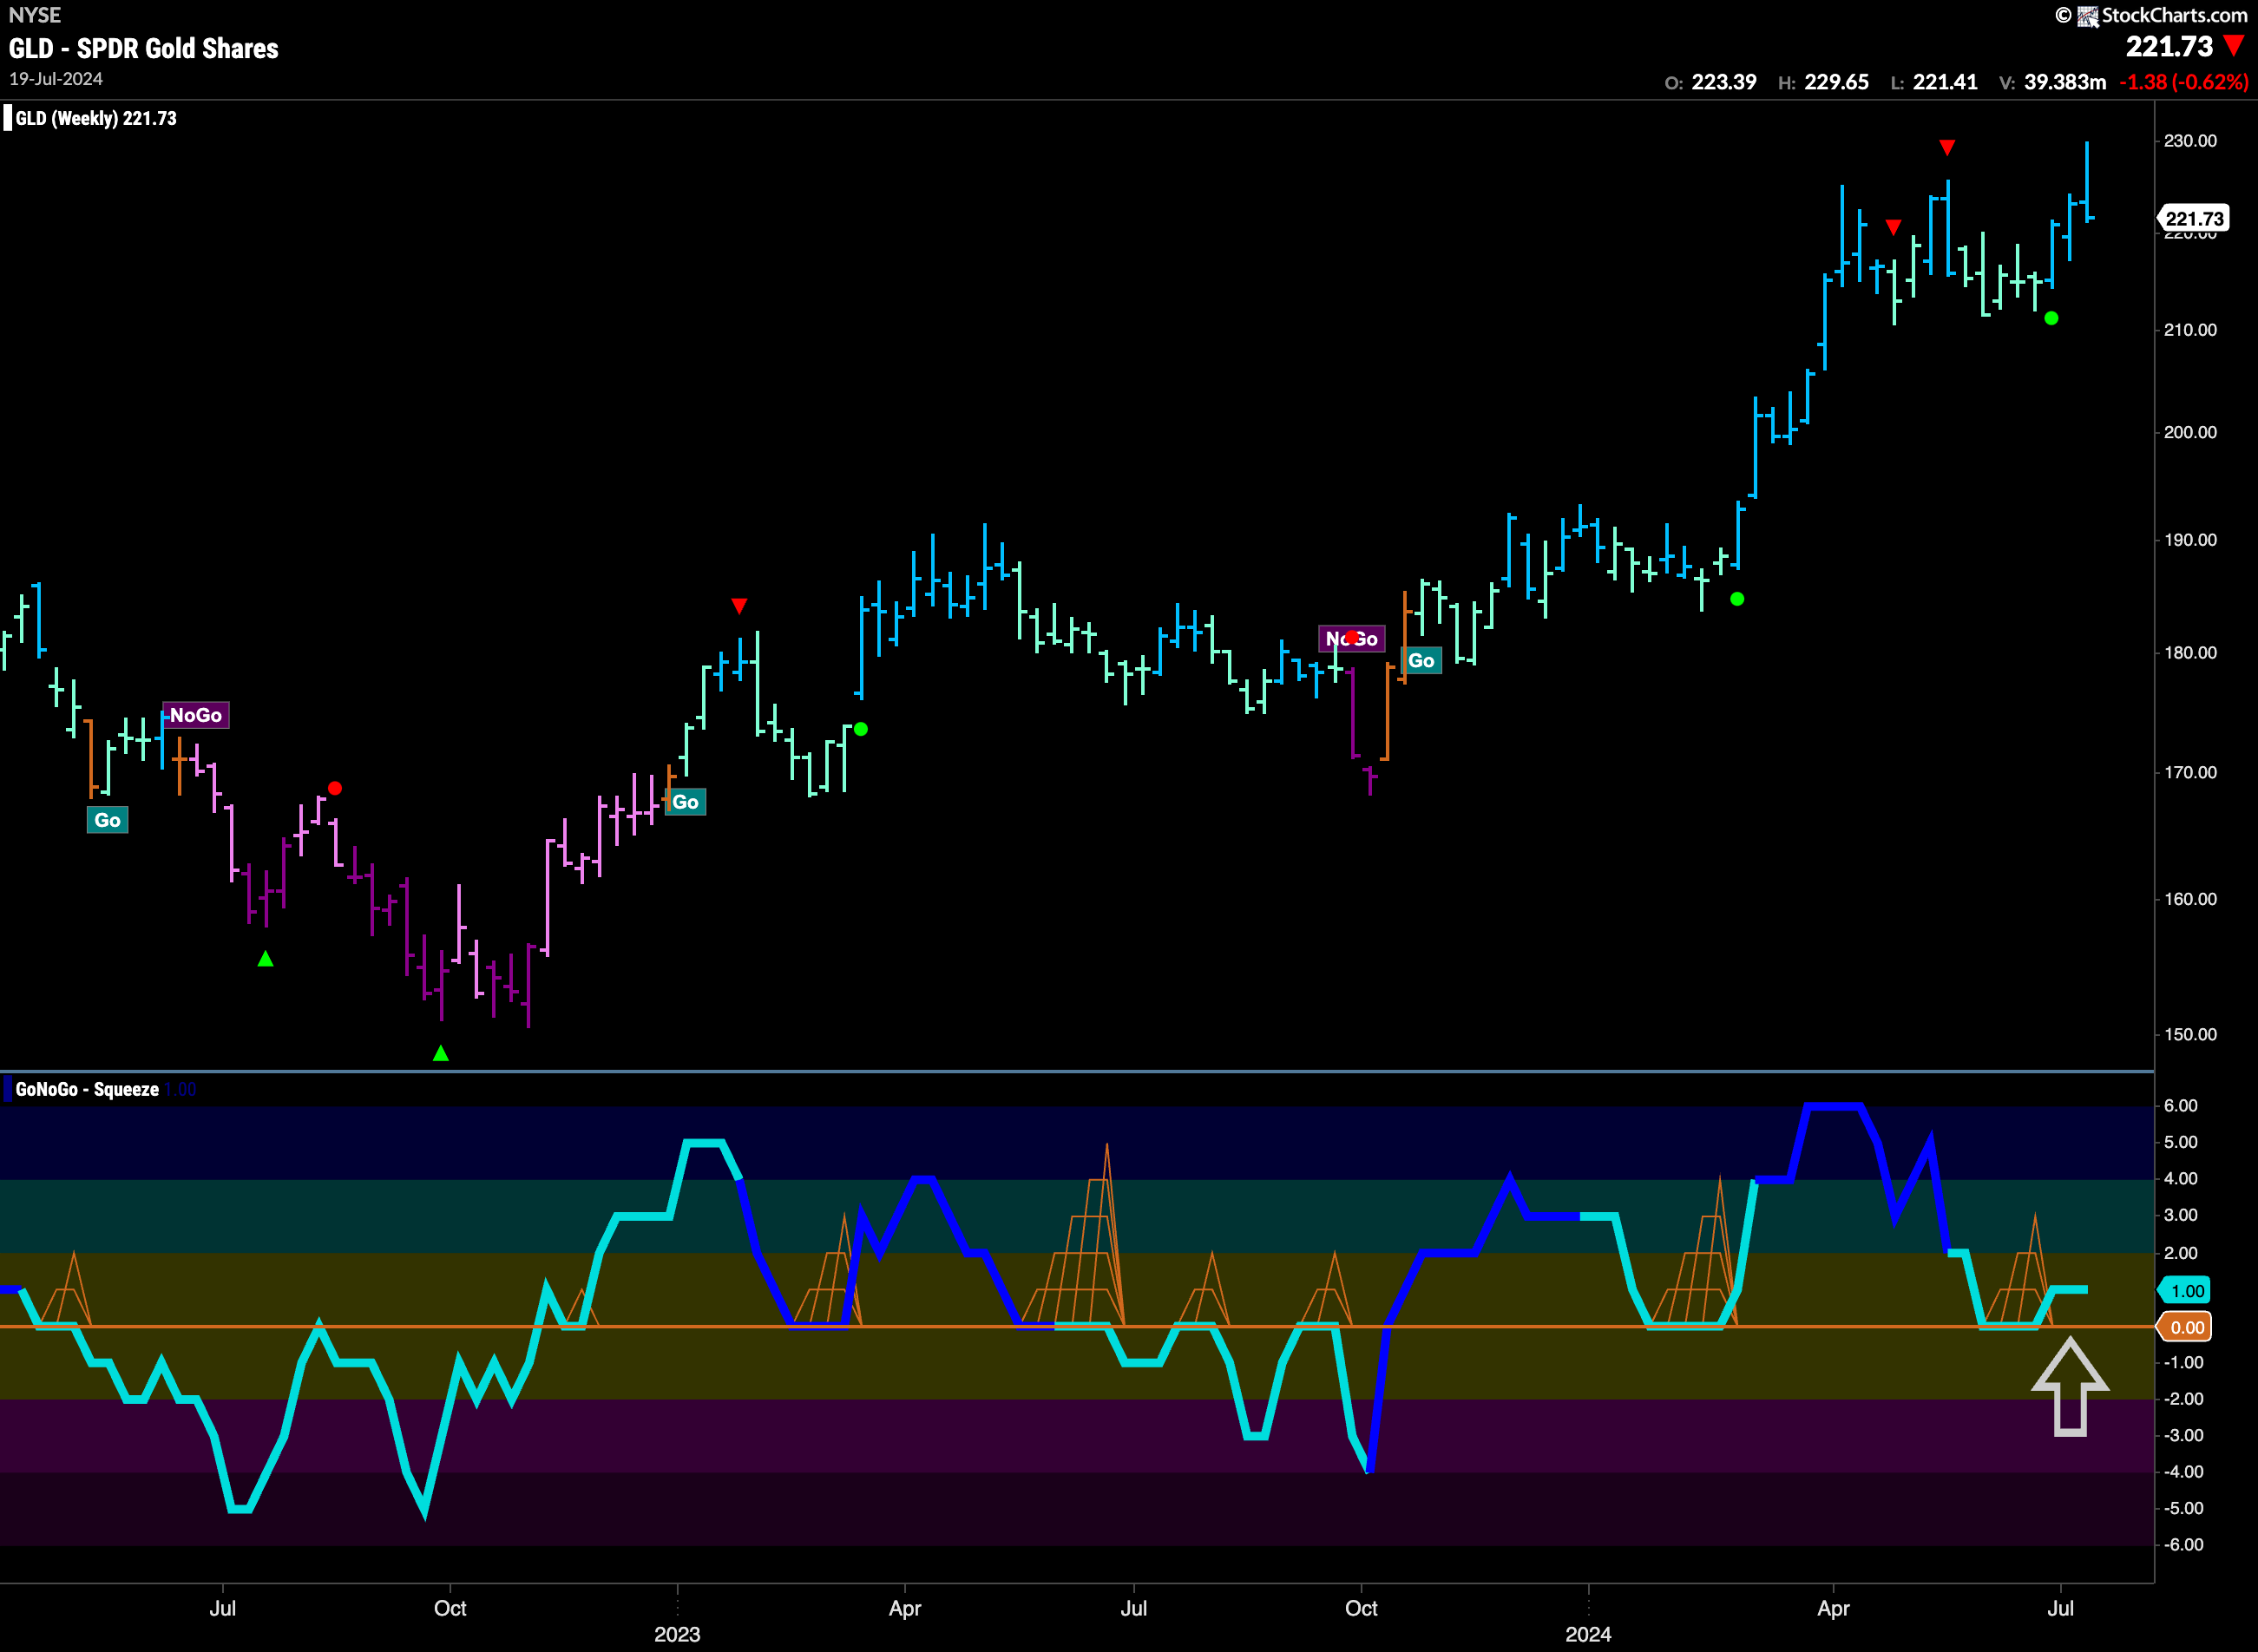
The weekly chart of Gold below shows that a strong attempt was made to set a higher weekly close. However, after some strength during the week price closed back at the top of the range we’d noted. On a closing basis, not a breakout. Positives can be taken from a look at the oscillator panel however, where GoNoGo Oscillator found support. Bouncing back into positive territory we know that momentum has remained on the side of the “Go” trend. We will look for price to make another attempt at a higher close this week.
Sector RelMap
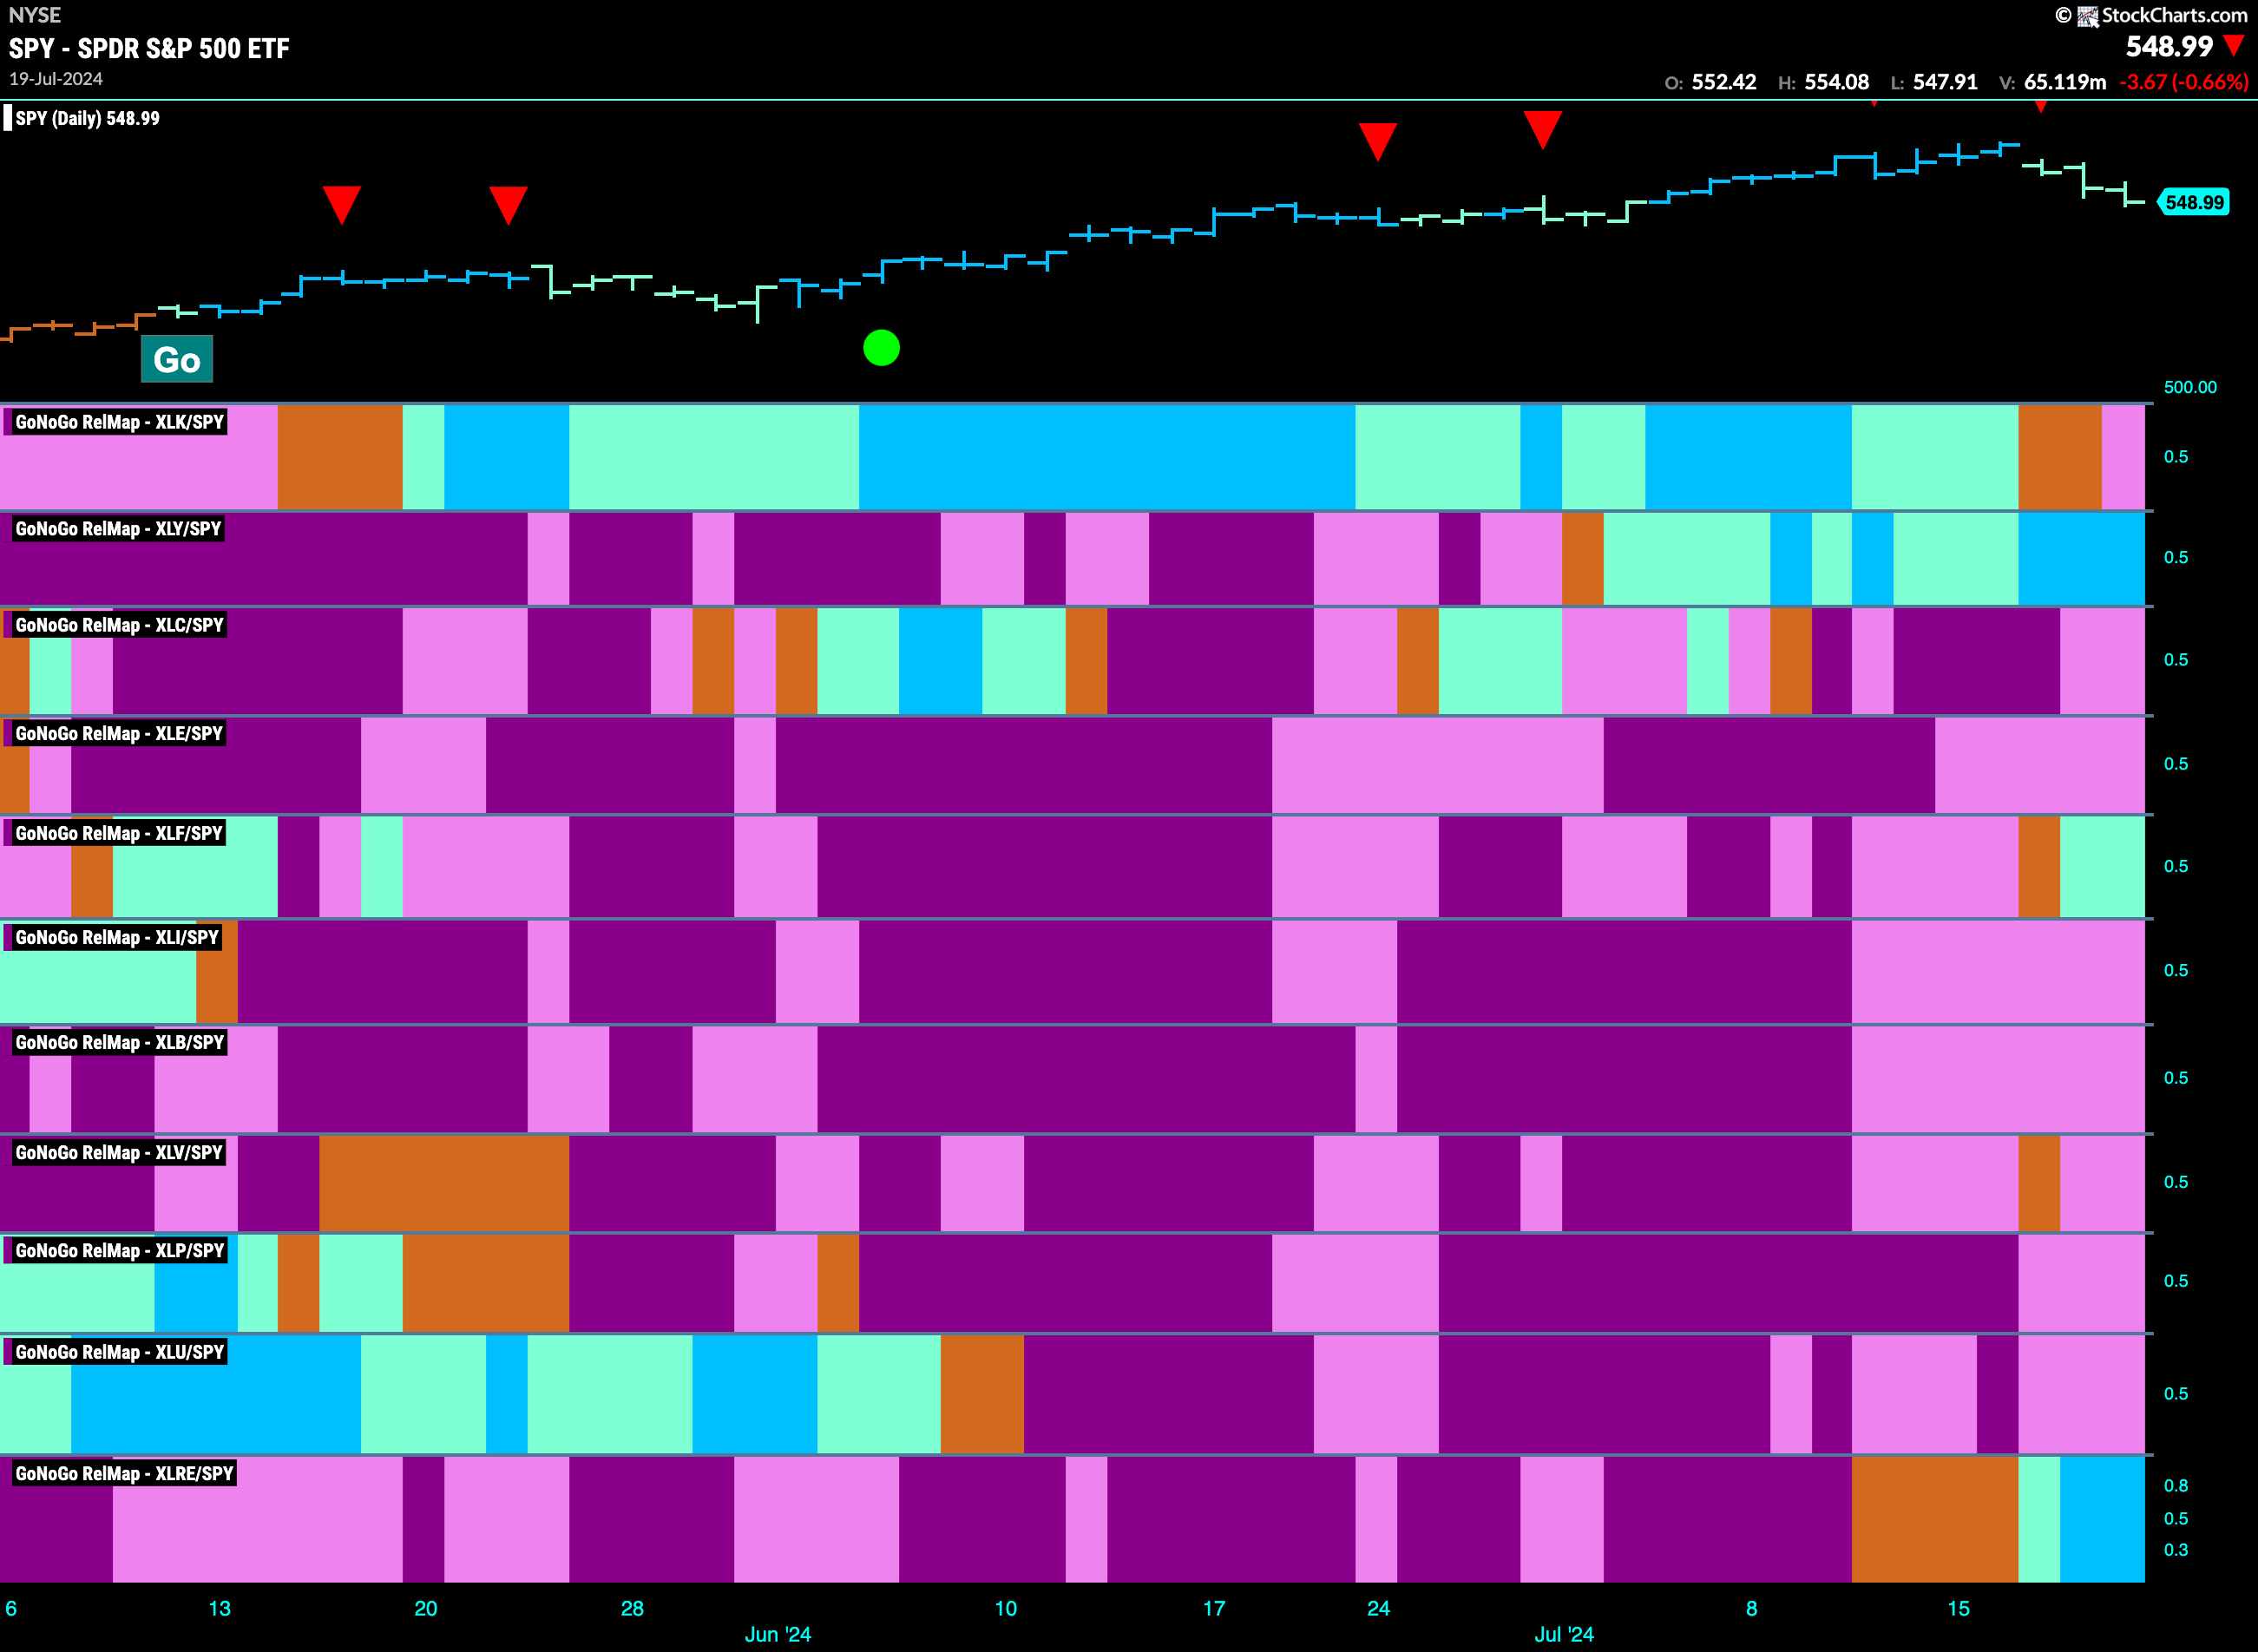
Below is the GoNoGo Sector RelMap. This GoNoGo RelMap applies the GoNoGo Trend to the relative strength ratios of the sectors to the base index. Looking at the map, we can see that 3 sectors are outperforming the base index this week. $XLY, $XLF, and $XLRE are painting relative “Go” bars.
The Financials Sector Makes New Highs
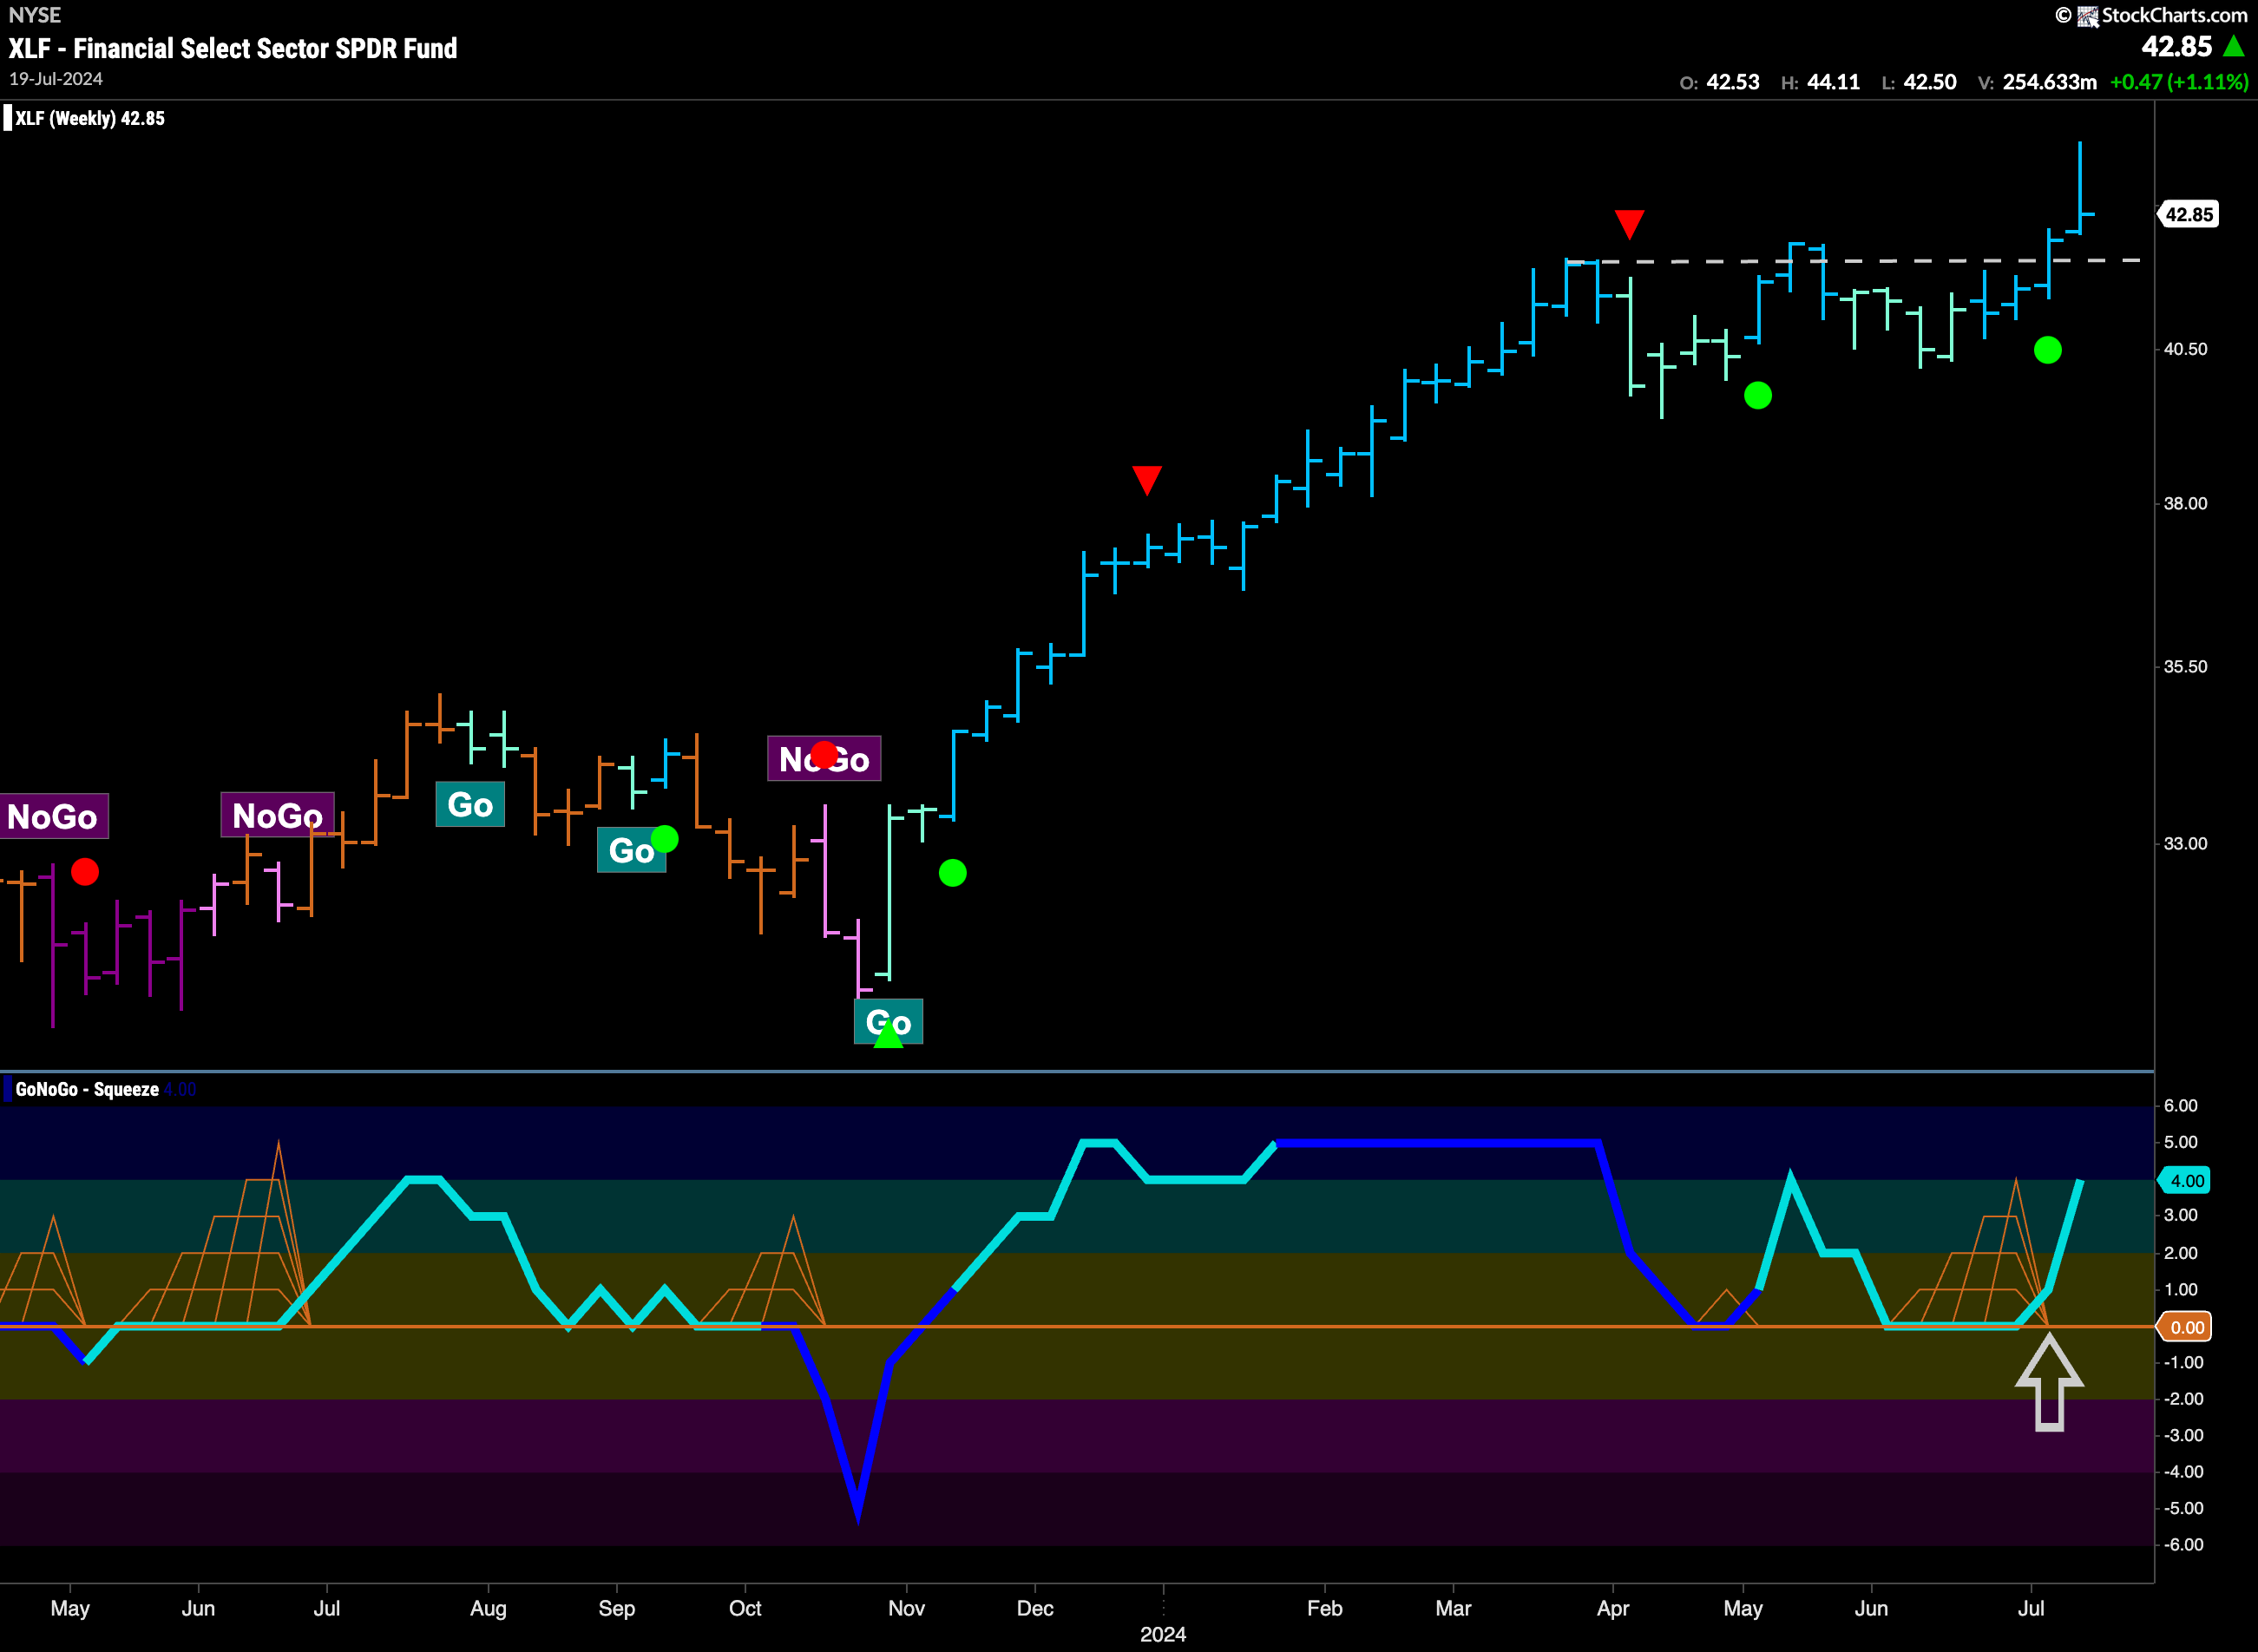
On a relative basis, we saw in the above GoNoGo Sector RelMap that the financials sector was helping prop up the equity market. On the weekly pure GoNoGo Chart below, we can see that the sector has been in a “Go” trend for several months but had been consolidating sideways since the Go Countertrend Correction Icon a few weeks ago. Importantly, GoNoGo Oscillator has continued to find support at the zero level and a few weeks ago we saw it break out of a small GoNoGo Squeeze back into positive territory. This resurgent momentum in the direction of the “Go” trend gave price the push it needed to make a new high. We will look for price to consolidate at these levels and find support going forward.
$JEF in Strong Weekly Trend
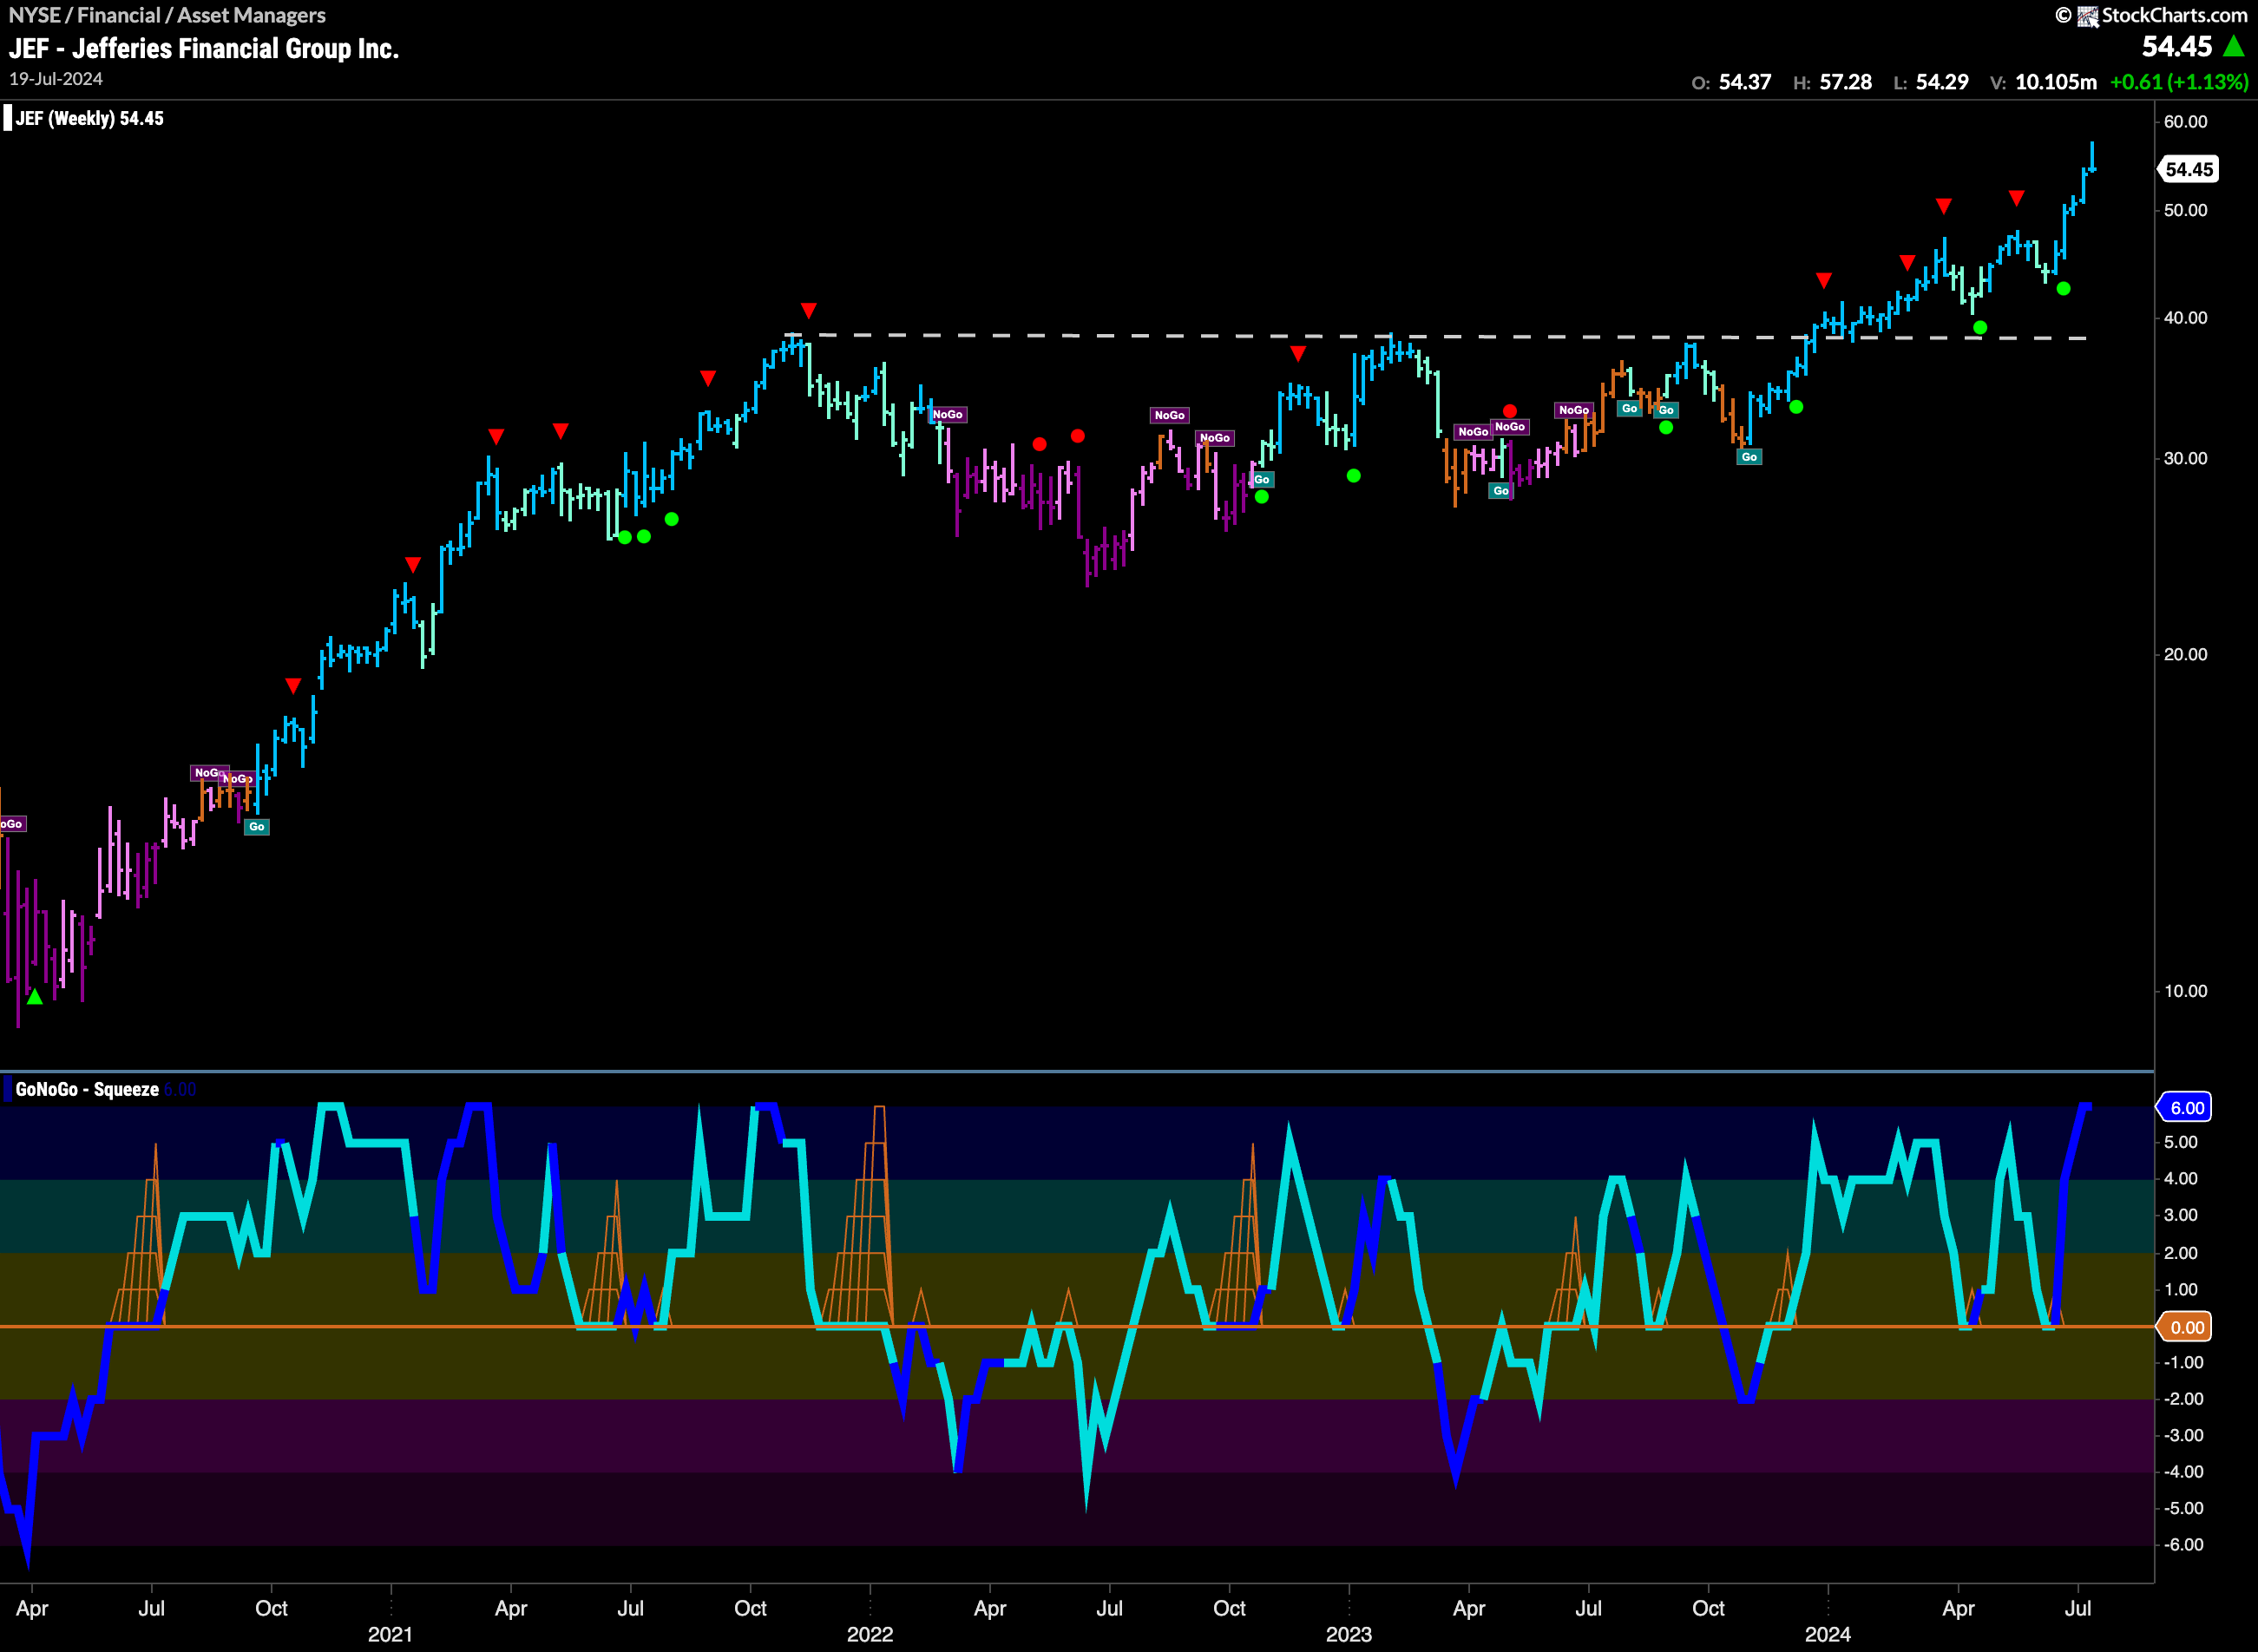
$JEF looks strong on the weekly chart below. We can see that it has been several months since it broke to new highs above the horizontal resistance we see on the chart. Most recently, price has made another higher high as GoNoGo Trend paints consecutive strong blue “Go” bars. GoNoGo Oscillator is at an overbought level and volume is heavy. We will watch to see if price can sustain these continued gains.
$JPM Looks to Consolidate at New Levels
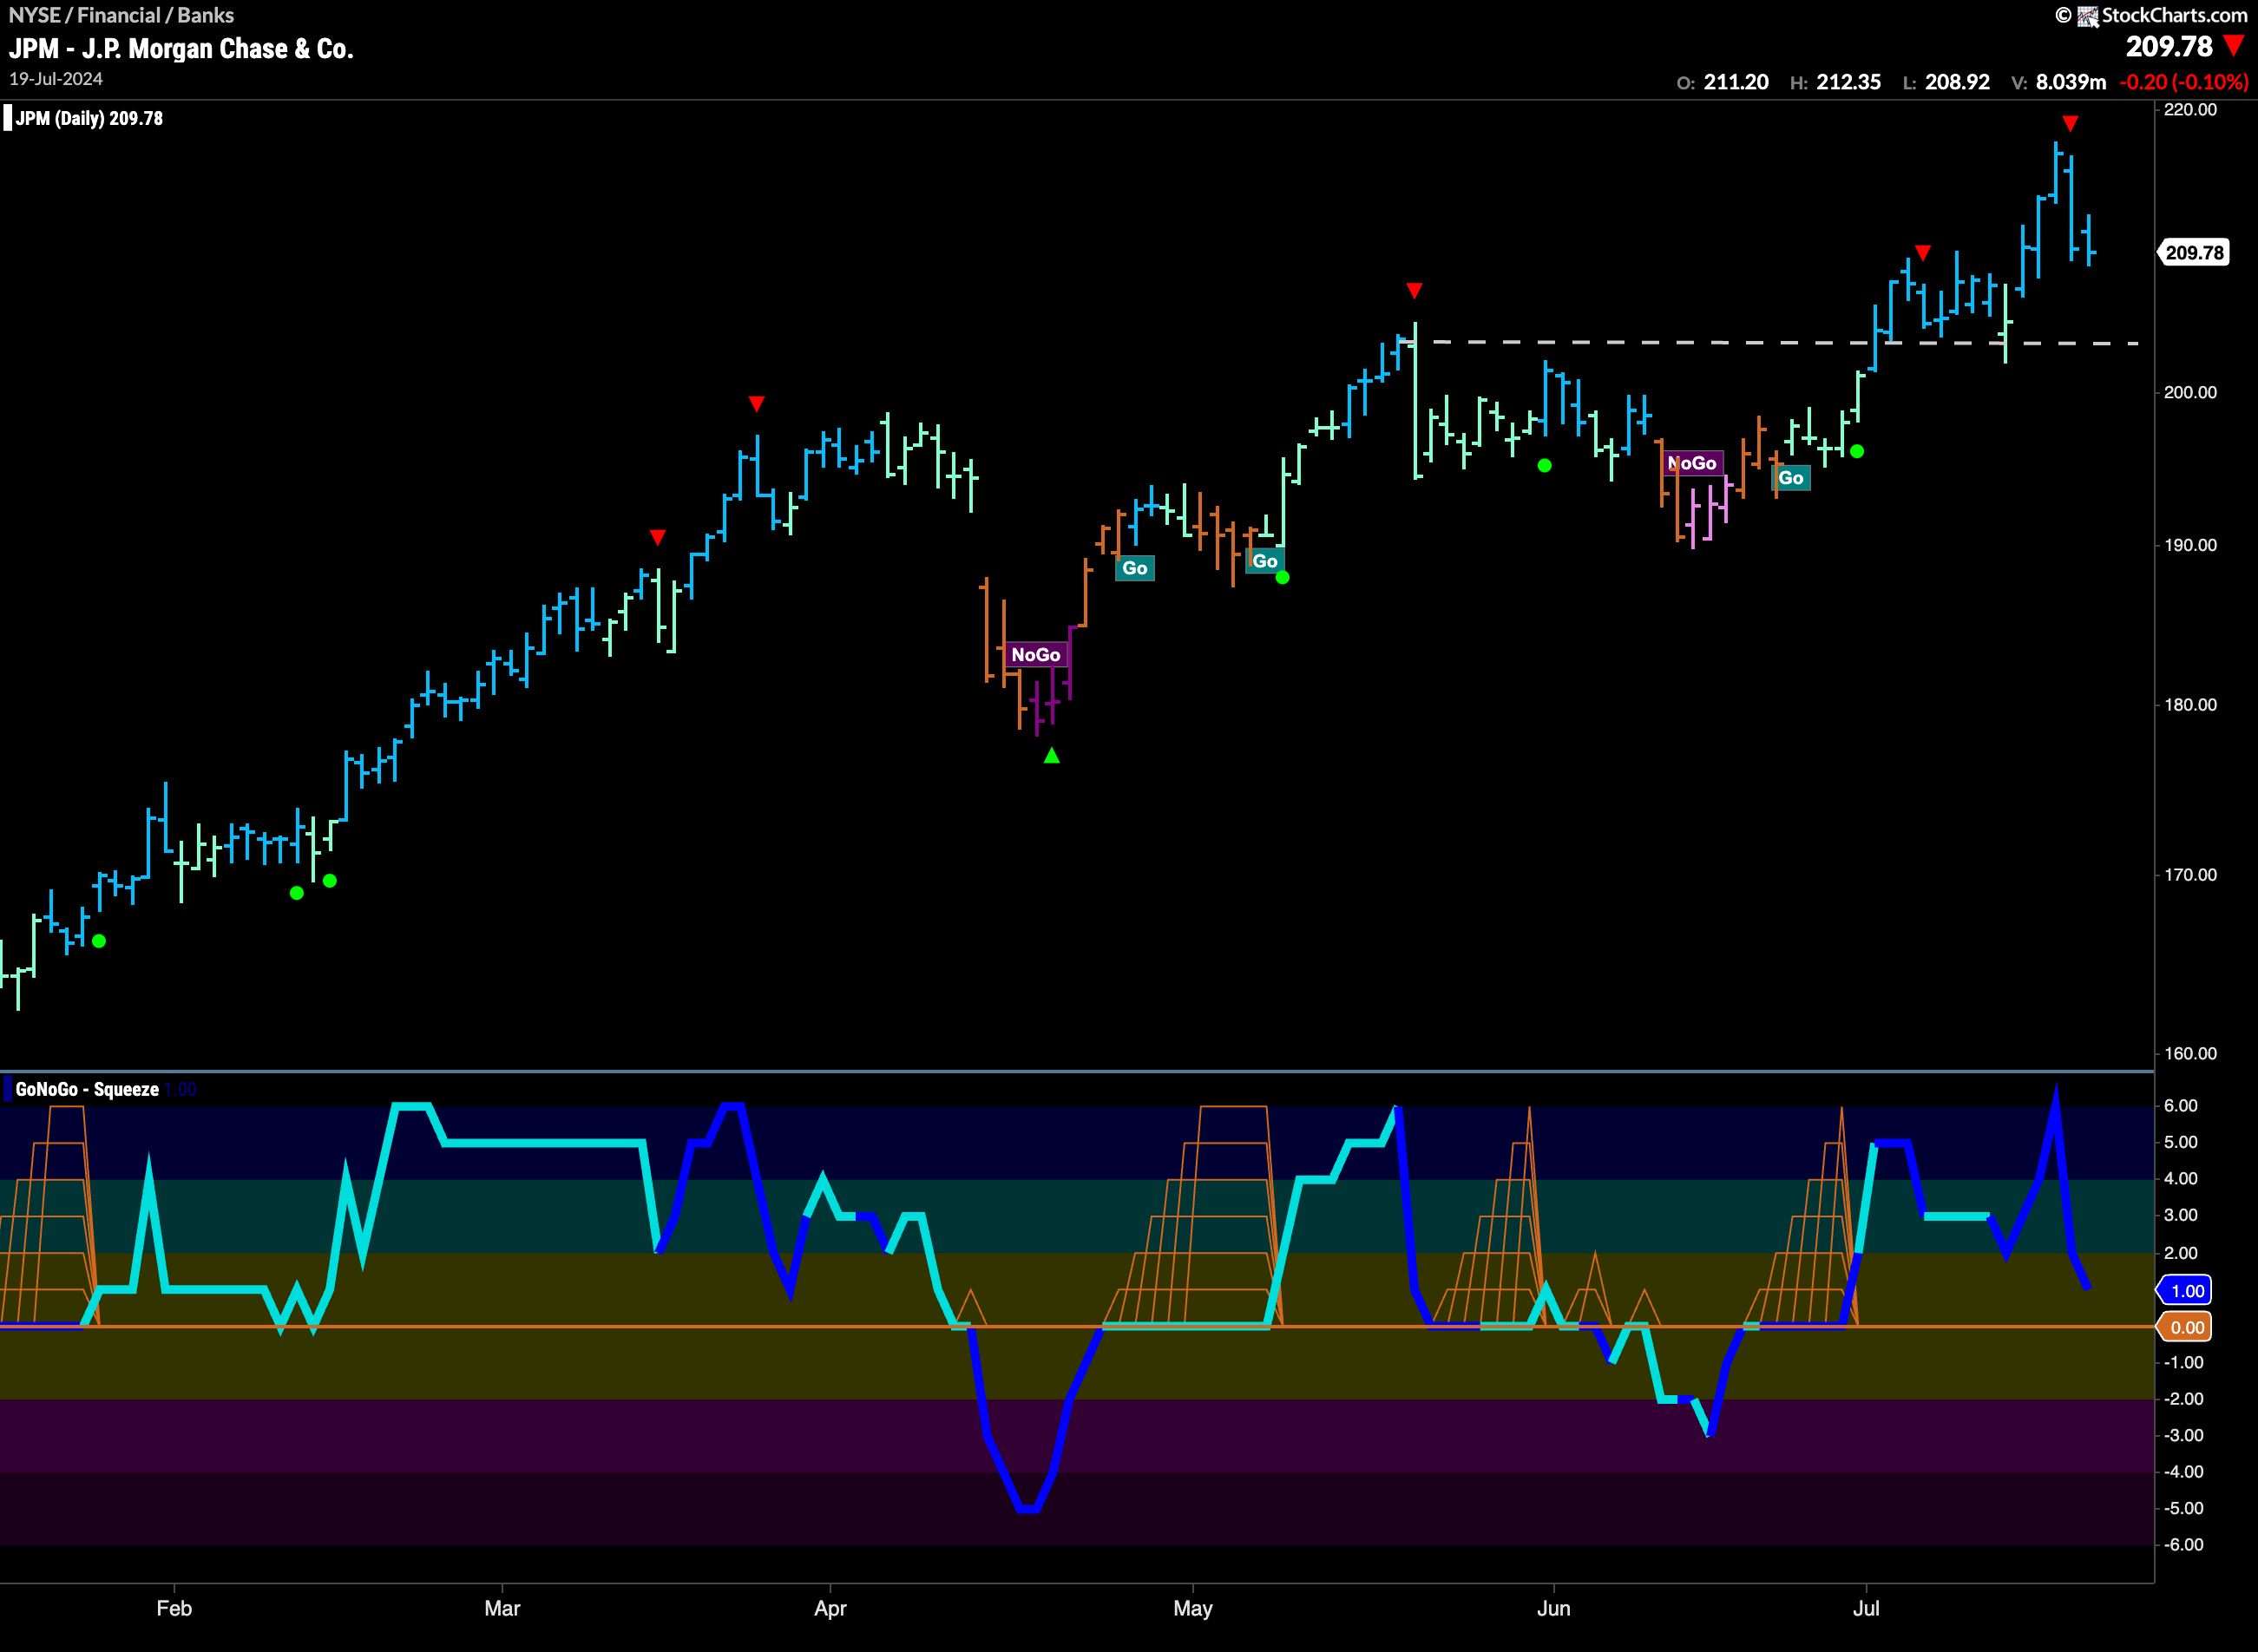
$JPM hit another higher high this week on uninterrupted strong blue “Go” bars. We saw a Go Countertrend Correction icon on Thursday which tells us that price may struggle to go higher in the short term and indeed, price fell away into the end of the week. We will look for price to consolidate and find support at these new elevated levels. GoNoGo Oscillator has fallen out of overbought levels on heavy volume and is fast approaching the zero line. We will watch to see if it can find support here which will be important for the longevity of the trend.
