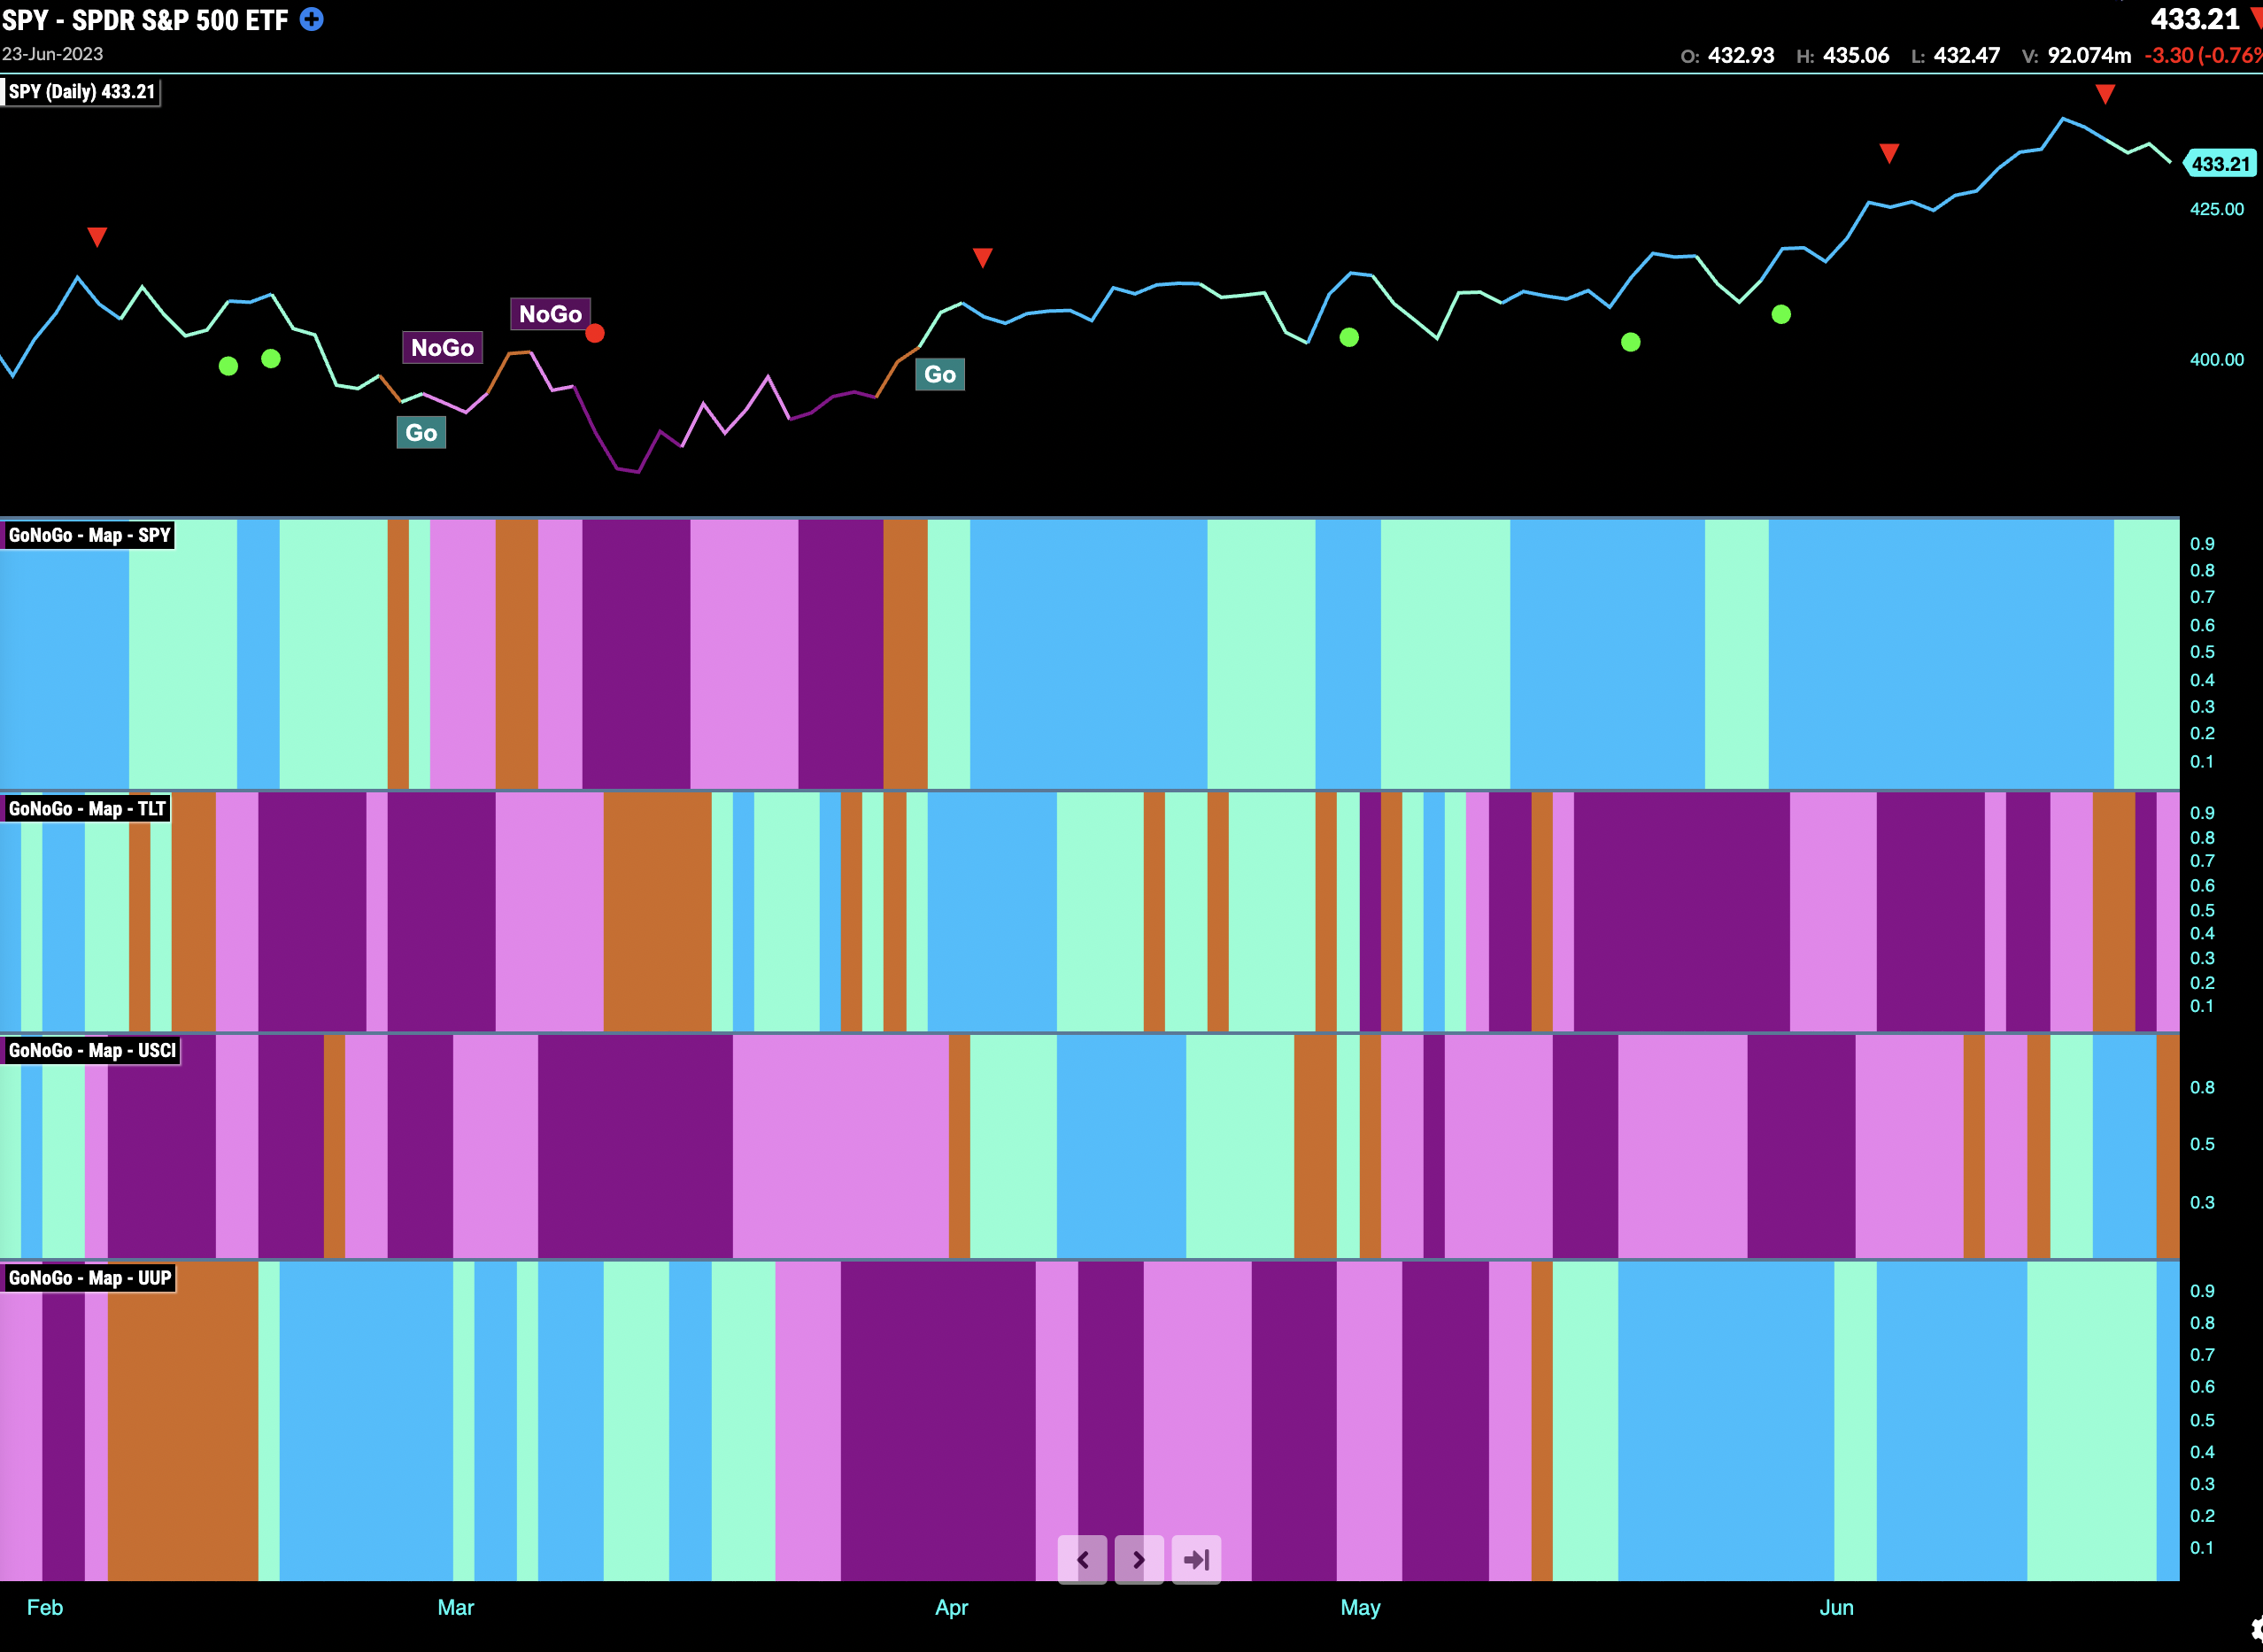
Good morning and welcome to this week’s Flight Path. The heat map below is showing a little change this week. U.S. equities see the “Go” trend weaken to paint paler aqua bars as price looks for some support after a pullback. Treasury bond prices painted an amber “Go Fish” bars mid week but reverted to the “NoGo” trend. Commodities paint another amber “Go Fish” bar as it looks as though the new “Go” trend is struggling already. The dollar found some strength to end the week after a period of weakness.
Equity Prices Look for Support after Pullback
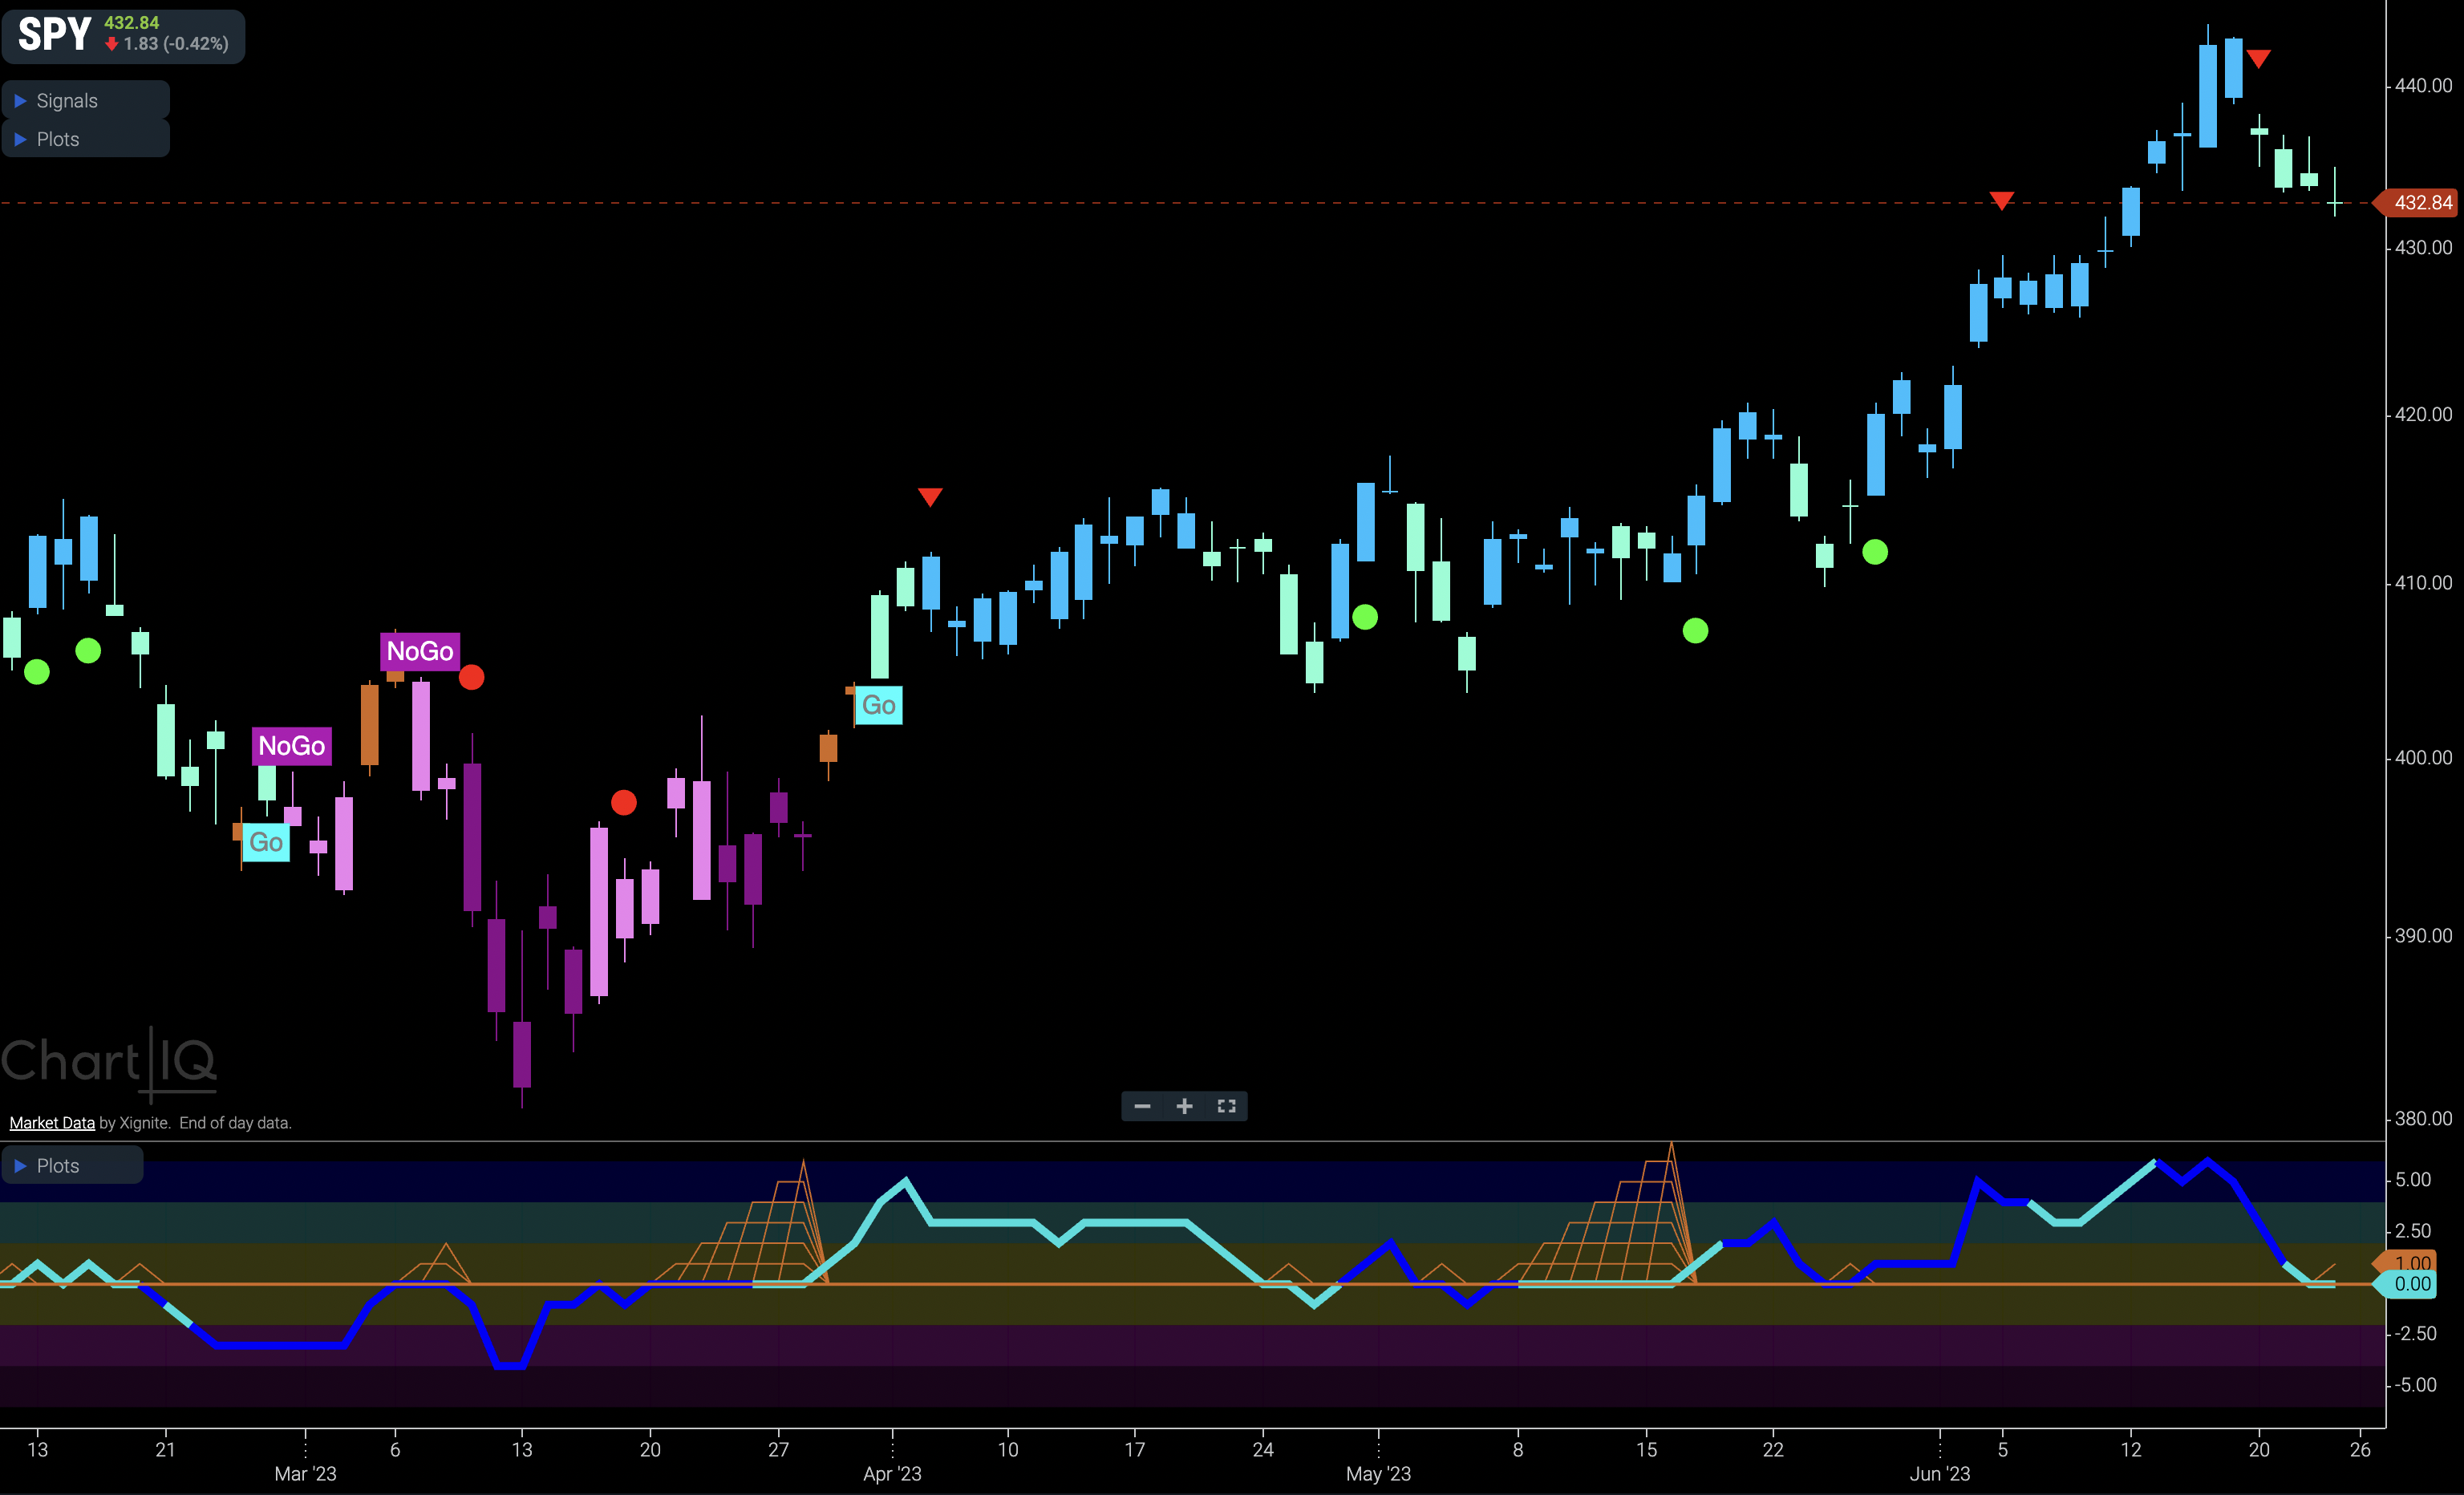
$SPY fell from its recent high this past week. We can see that GoNoGo Trend painted a string of aqua bars demonstrating this weakness. The final bar of the week was a doji, further representing uncertainty. GoNoGo Oscillator fell to test the zero line from above where we will look for support. This is a theme we are seeing throughout the markets. After a strong rally, we are watching the current leaders to see if they find support to sustain their “Go” trends.
The longer term weekly chart shows continued strength. The pull back we have seen on the daily chart is barely noticeable on the weekly. We will see if there is a longer pause or if price will continue to move higher with momentum positive but no longer overbought. 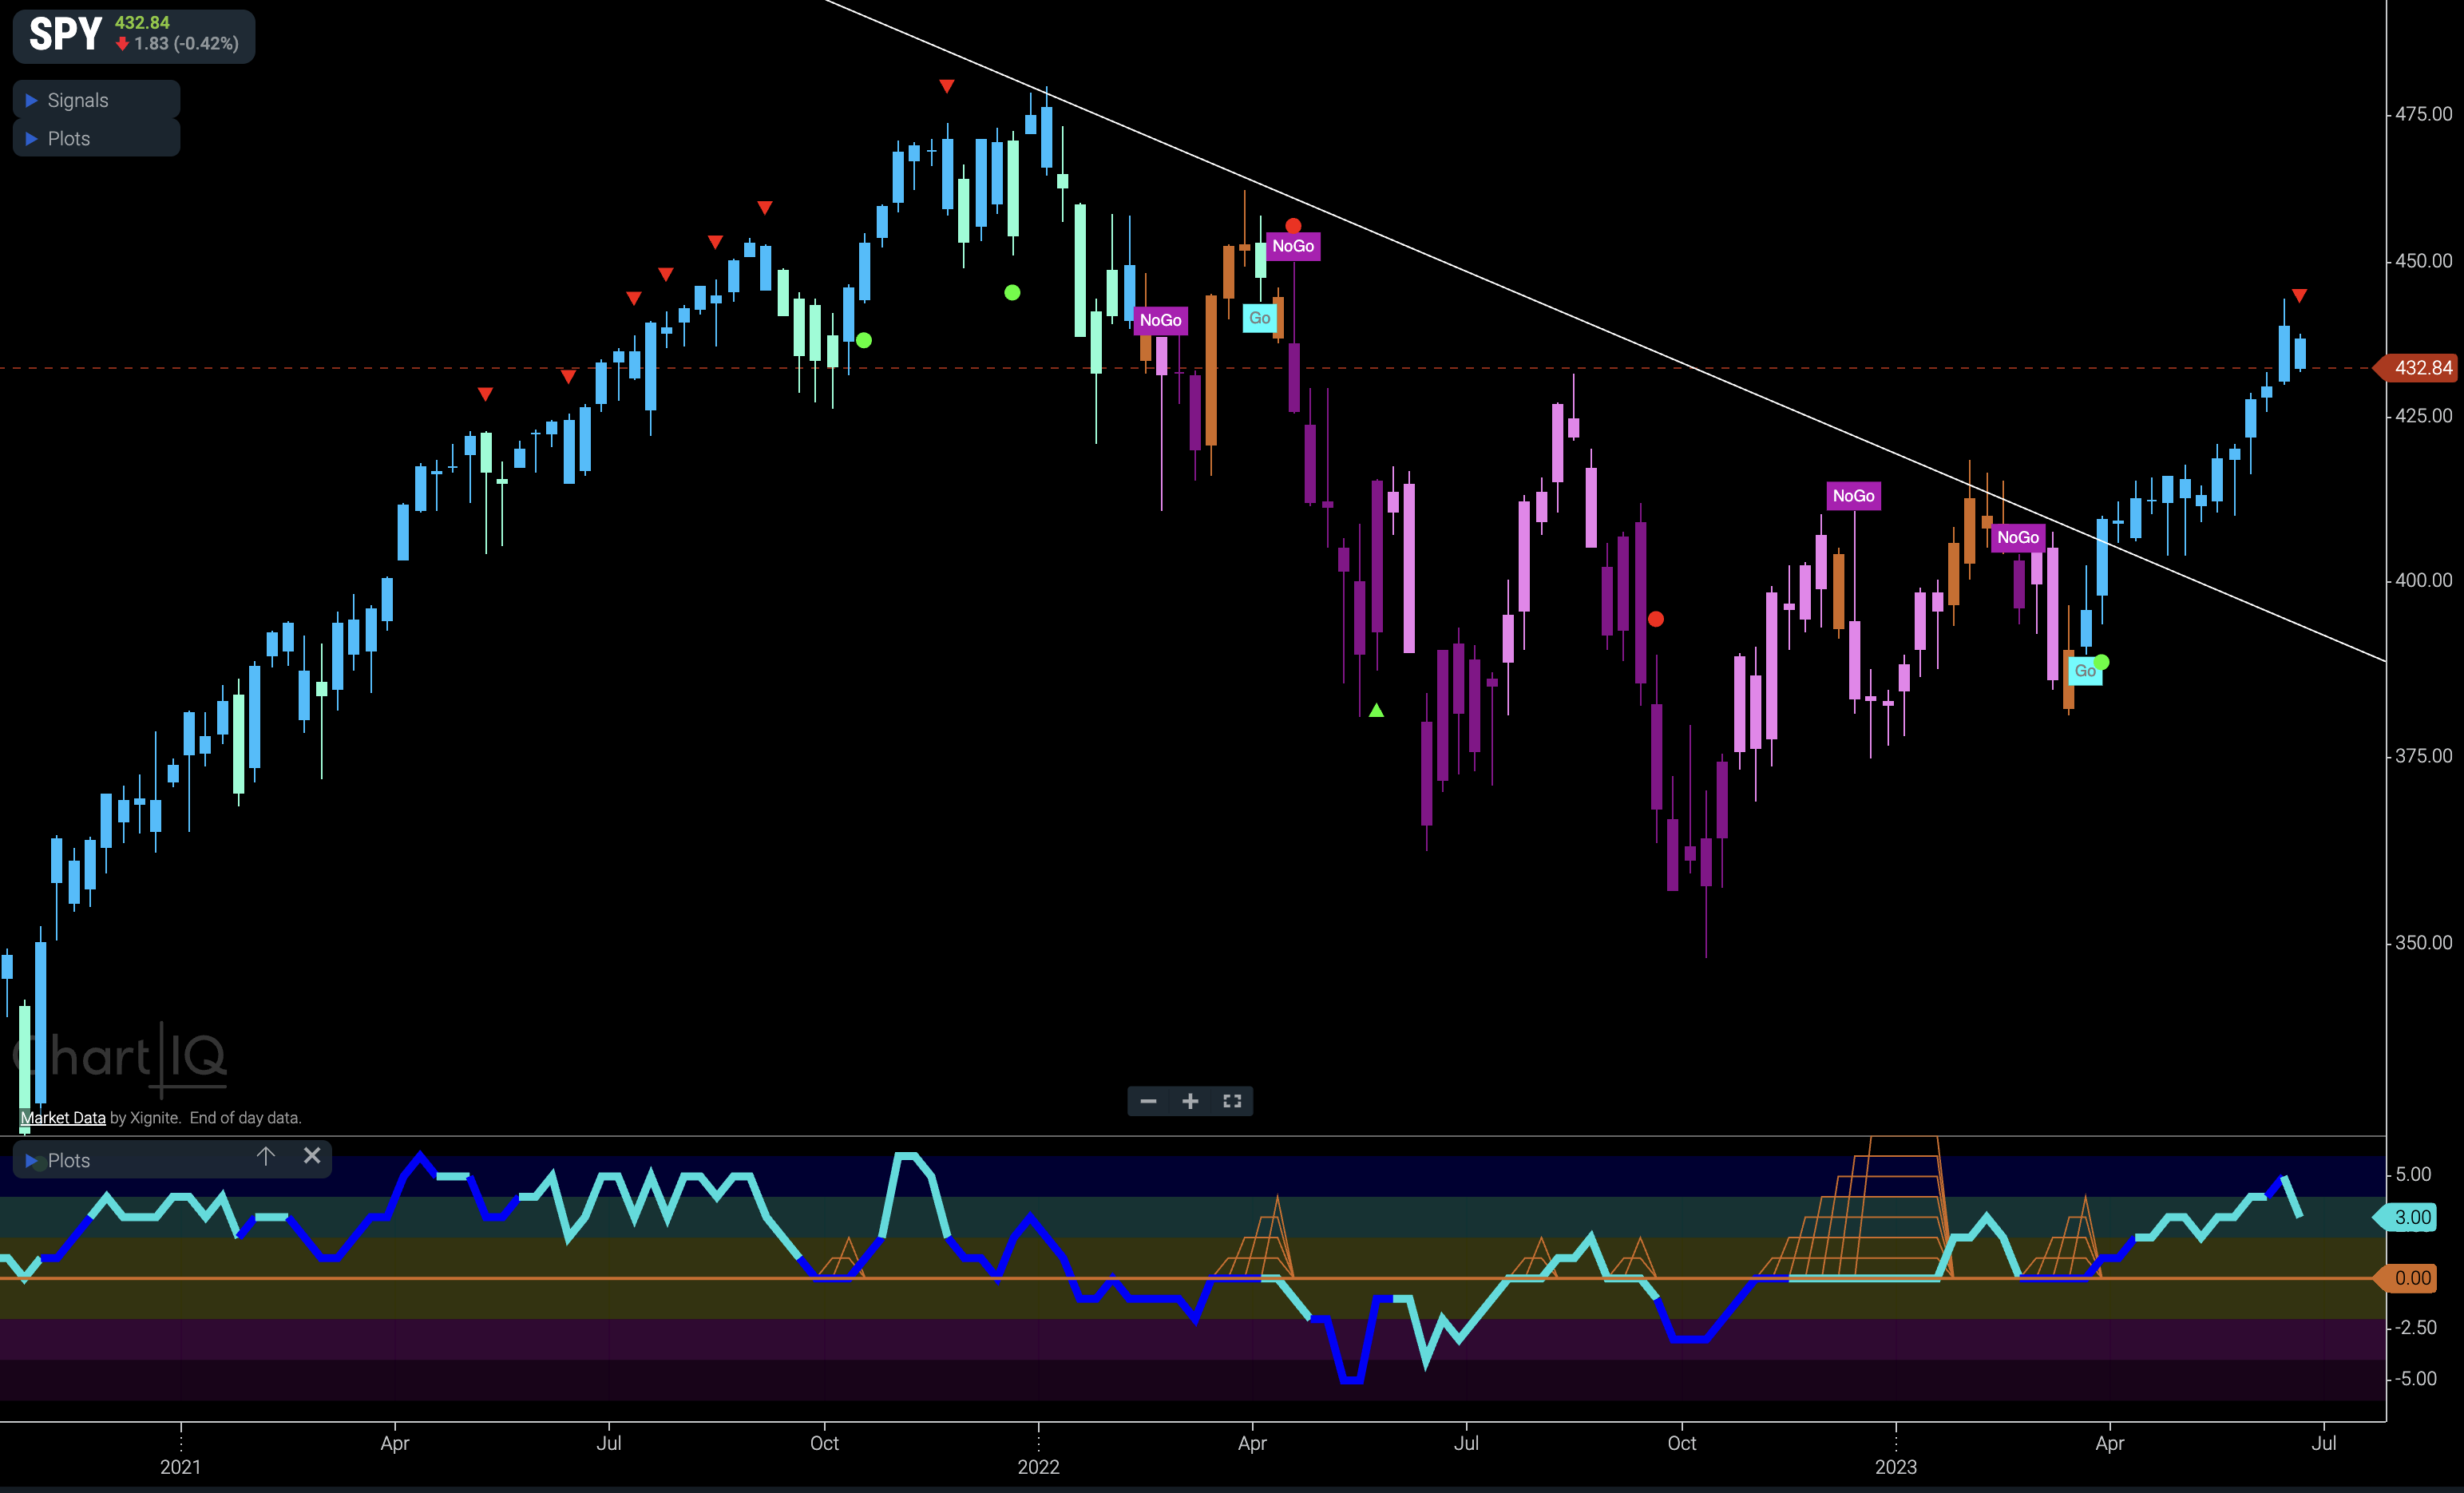
Treasury Bond Prices see Oscillator Battle with Zero line
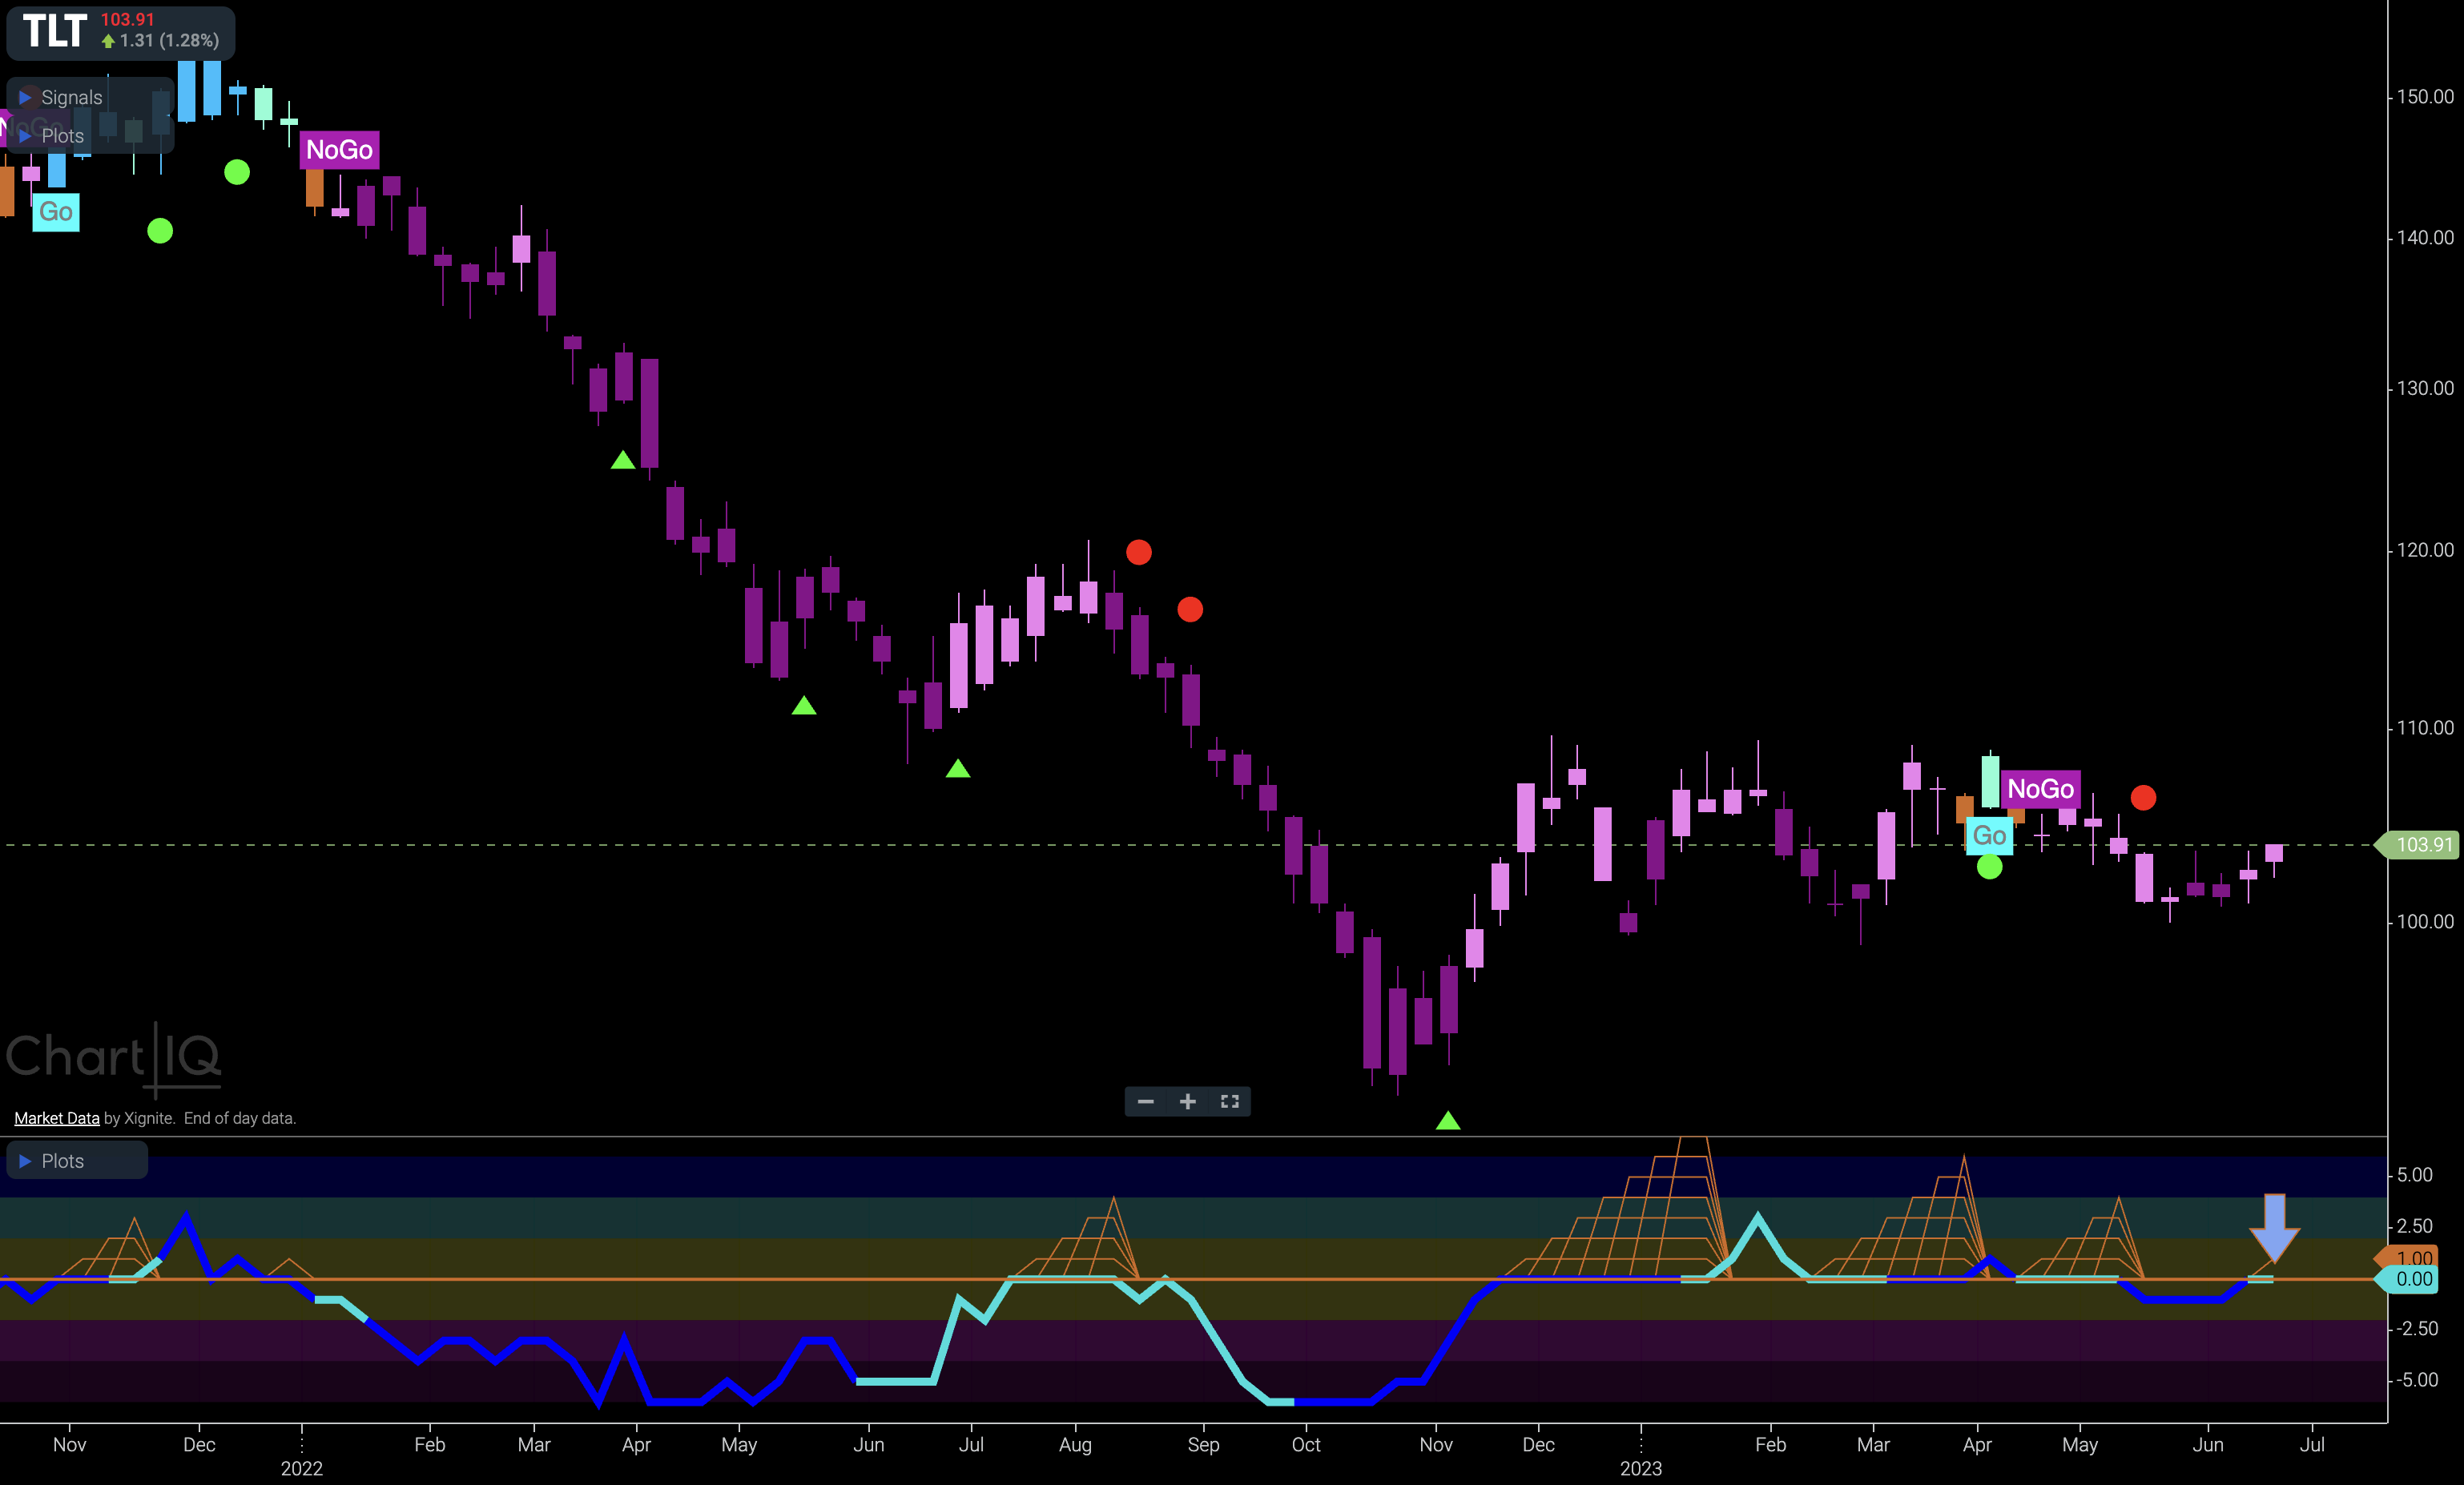
Treasury bond prices, not rates, remain depressed. The “NoGo” that has been largely in place the entire year so far is intact. However, we have not seen a new lower low for sometime and it could be argued that price is making a basing pattern. GoNoGo Oscillator has been stuck around the zero line as we have seen several GoNoGo Squeeze indications. As we write this, the oscillator is back at the zero line again, testing it from below. We will watch to see if this level provides resistance this time.
Dollar Showing Uncertainty on Weekly Chart
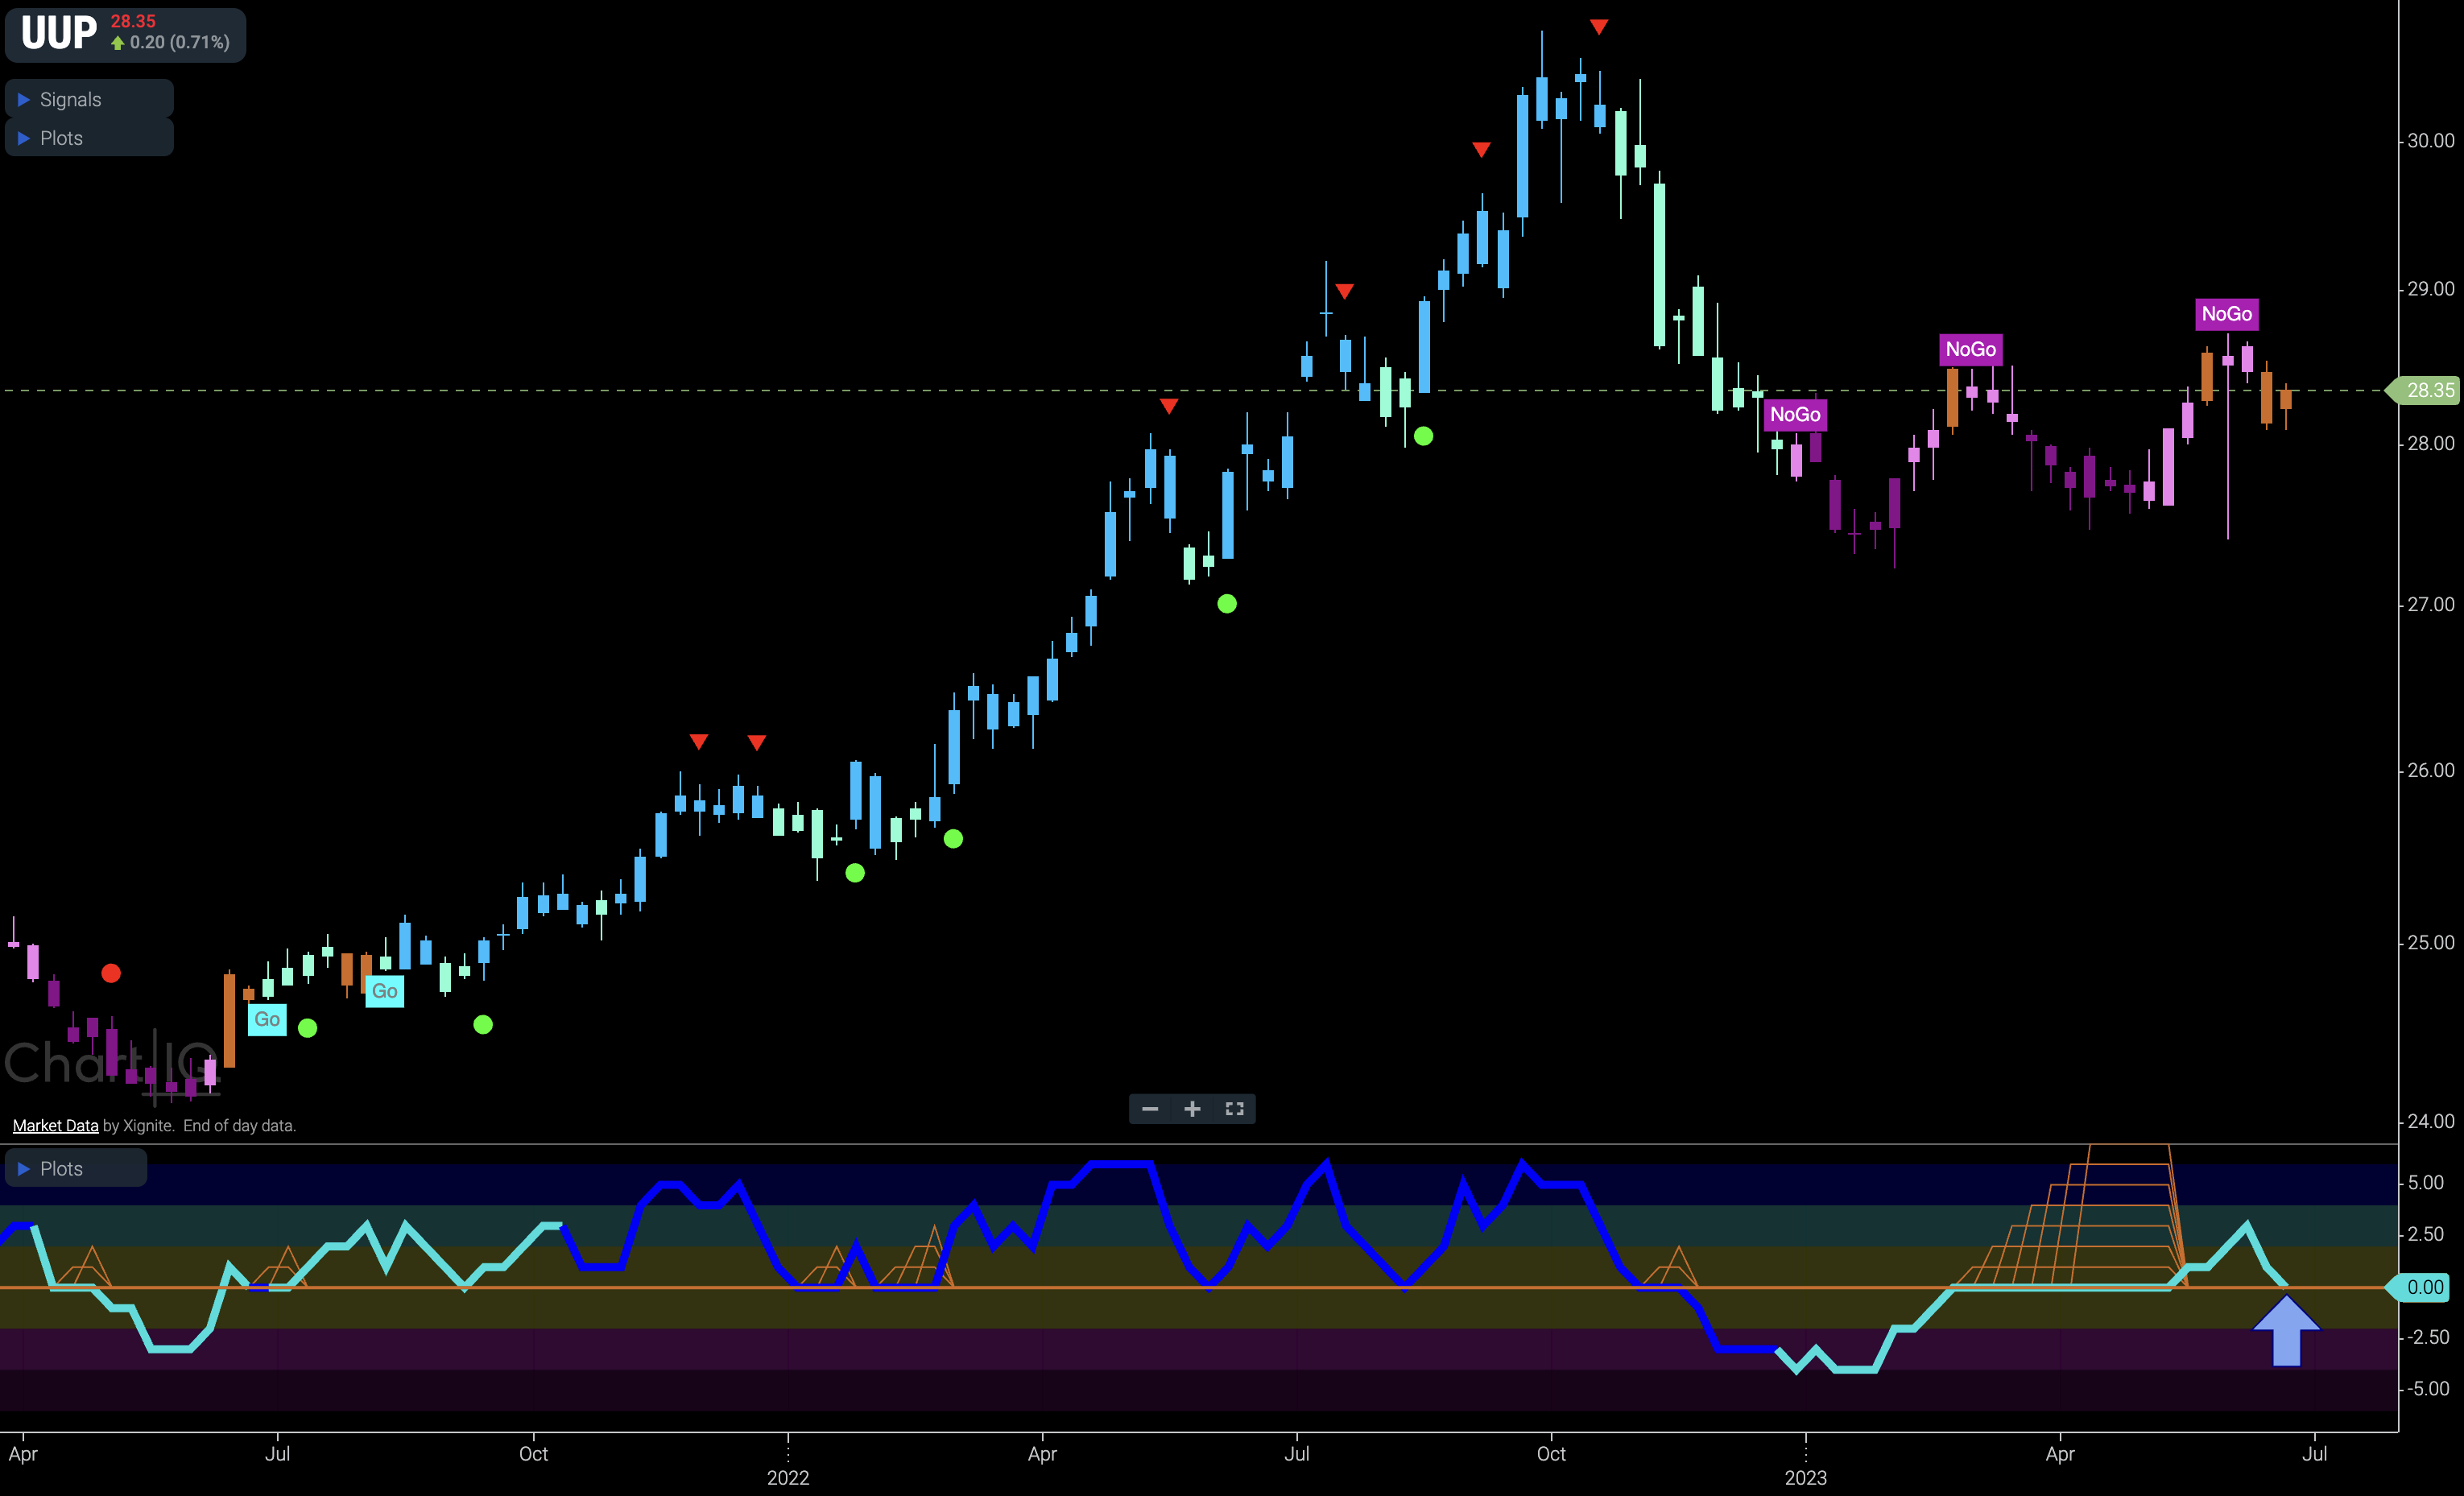
The longer term weekly chart below shows that while the dollar failed at prior high resistance the “NoGo” trend may be losing its hold a little. We see that 3 of the last 5 bars have been painted amber, telling us to “Go Fish”. GoNoGo Oscillator recently broke out of a Max GoNoGo Squeeze into positive territory and now is retesting that level. We will want to see the oscillator find support at the zero line if there is to be significant trend reversal in the above price panel.
Oil – Nothing to Report
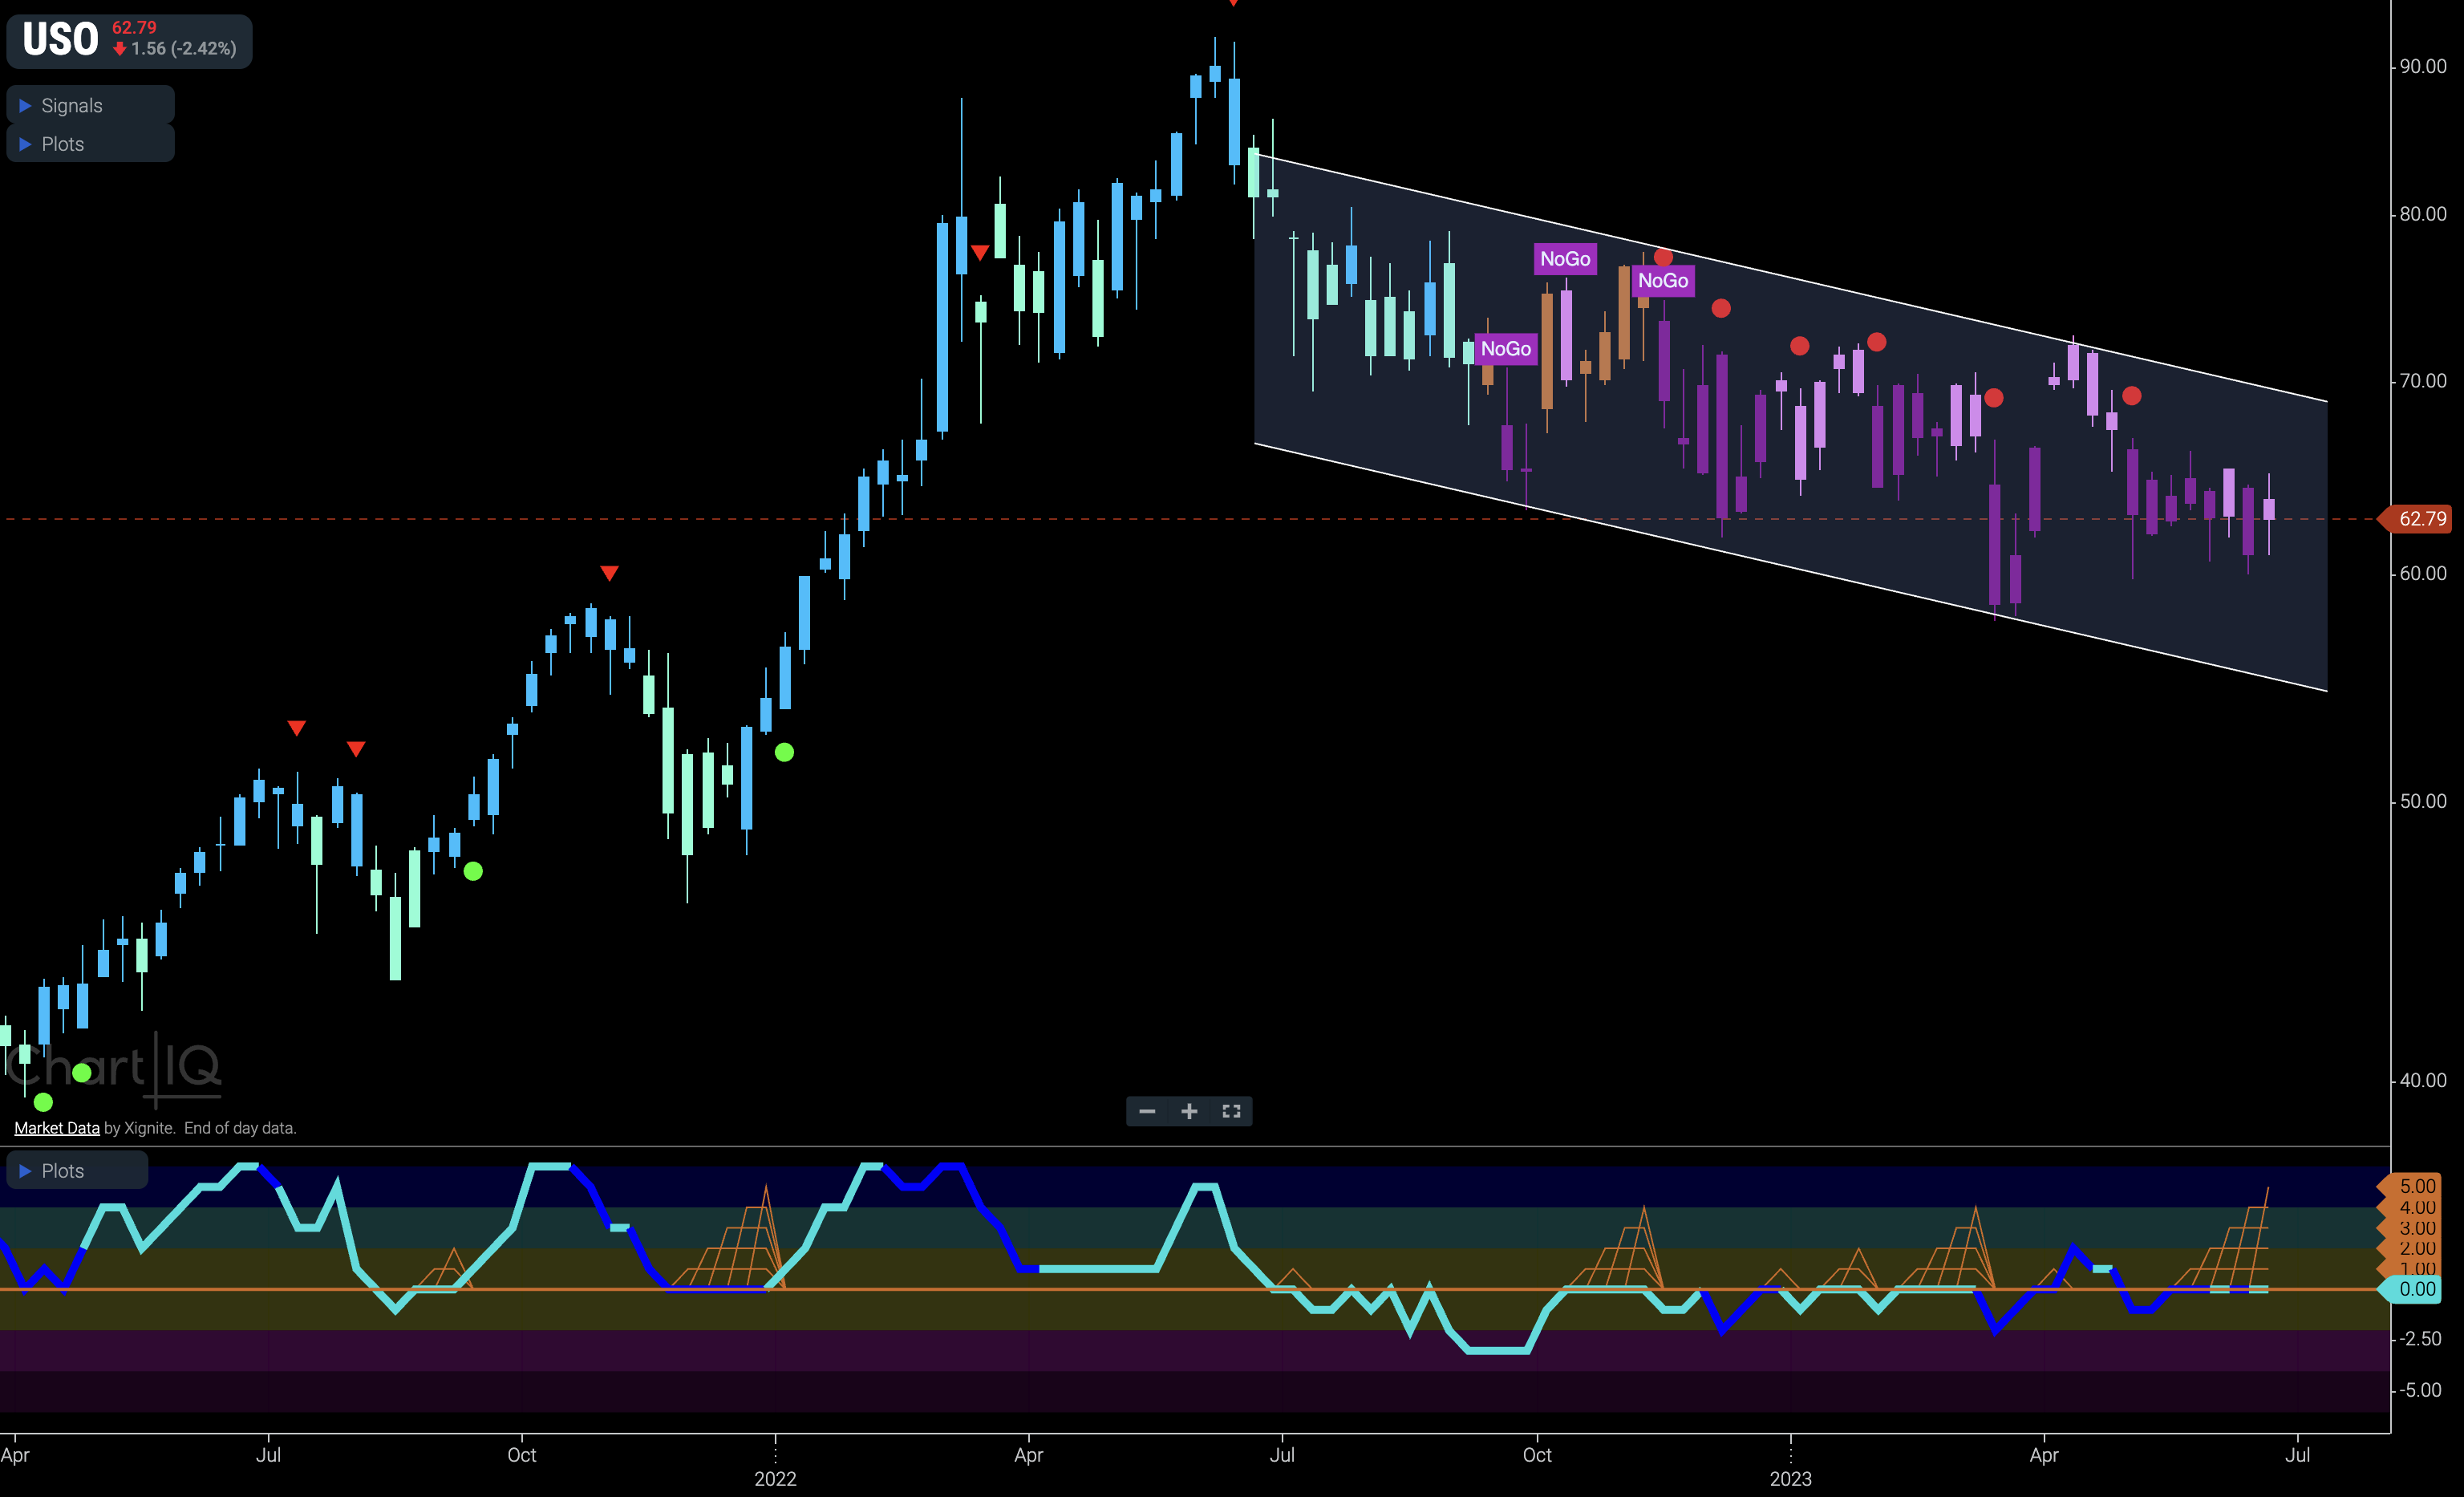
Price is still stuck in the middle of the downward sloping trend channel. GoNoGo Oscillator remains unable to get away from the zero line. That is it and that is all.
Gold Prices Fall below Key Support
Price is in a “NoGo” trend and we can see that as it paints a string of strong purple “NoGo” bars it has fallen through horizontal support. As it does this, GoNoGo Oscillator has been rejected by the zero line again and this time volume is heavy. It would not be a surprise to see gold prices fall further from here.
Sector RelMap
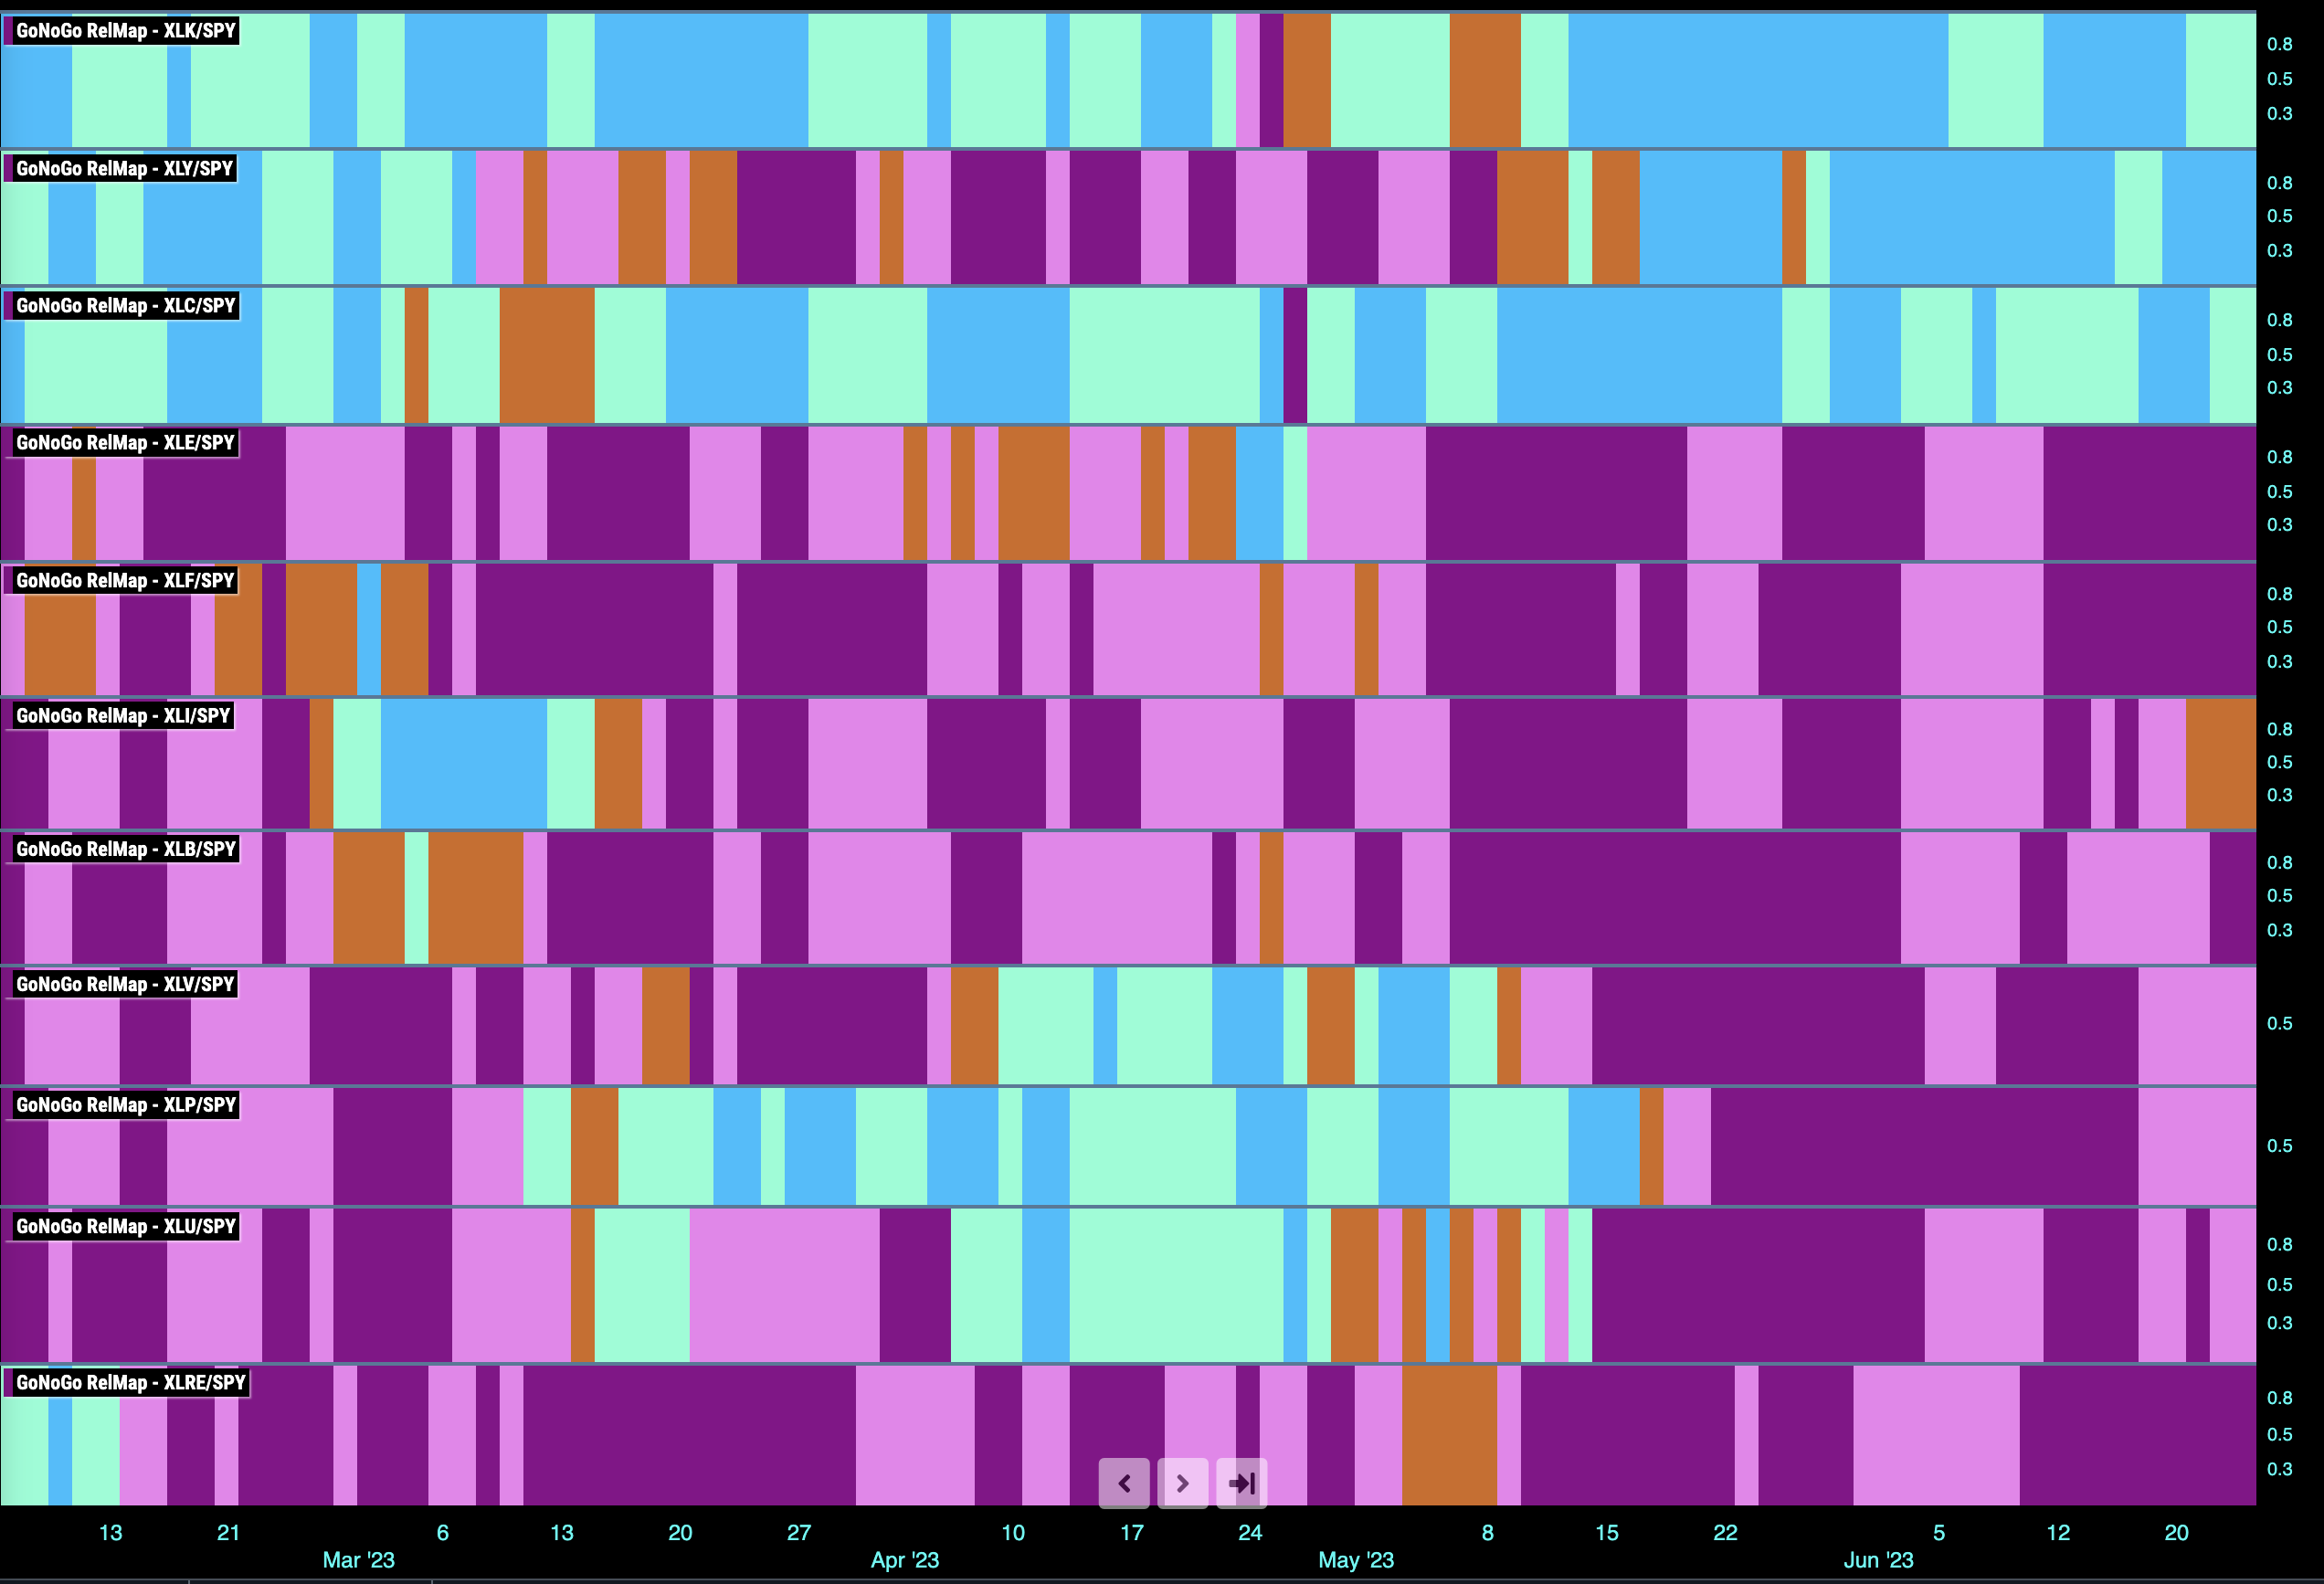
Below is the GoNoGo Sector RelMap. This GoNoGo RelMap applies the GoNoGo Trend to the relative strength ratios of the sectors to the base index. Looking at this map, we can quickly see where the relative outperformance is coming from as well as which sectors are lagging on a relative basis. 3 sectors are outperforming the base index this week. $XLK, $XLY, and $XLC are painting “Go” bars.
Technology Still a Stallwart
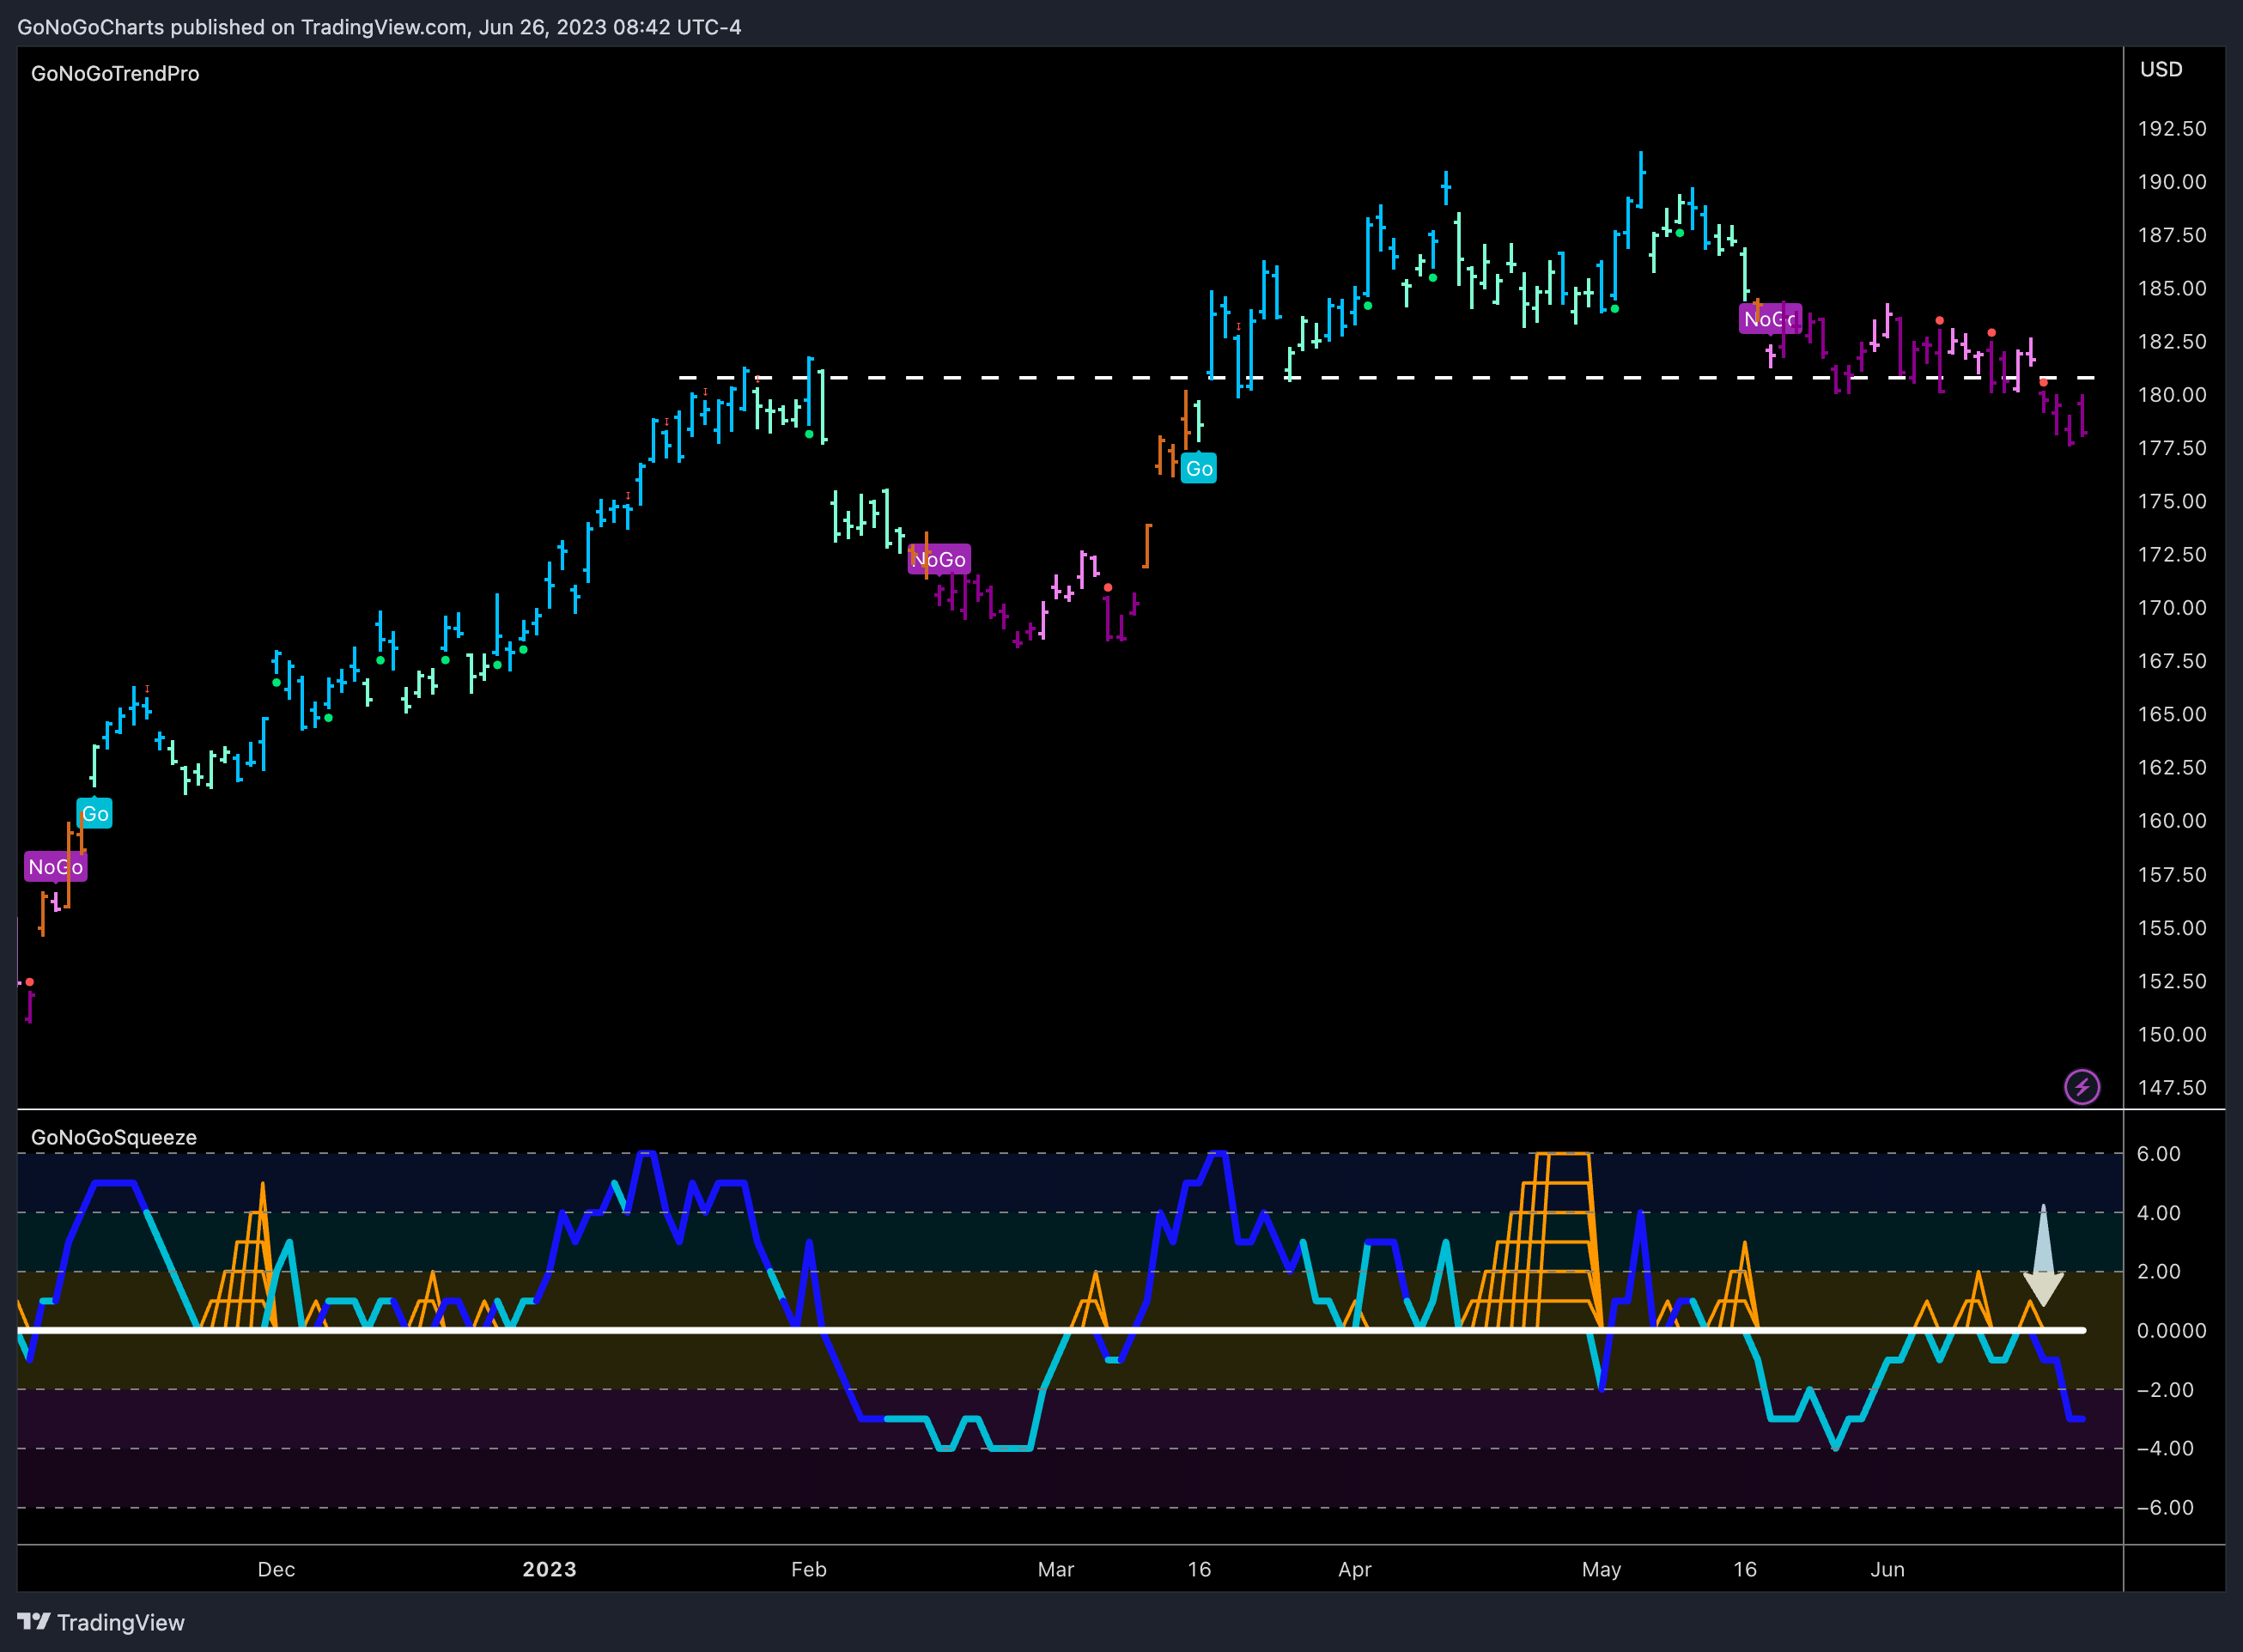
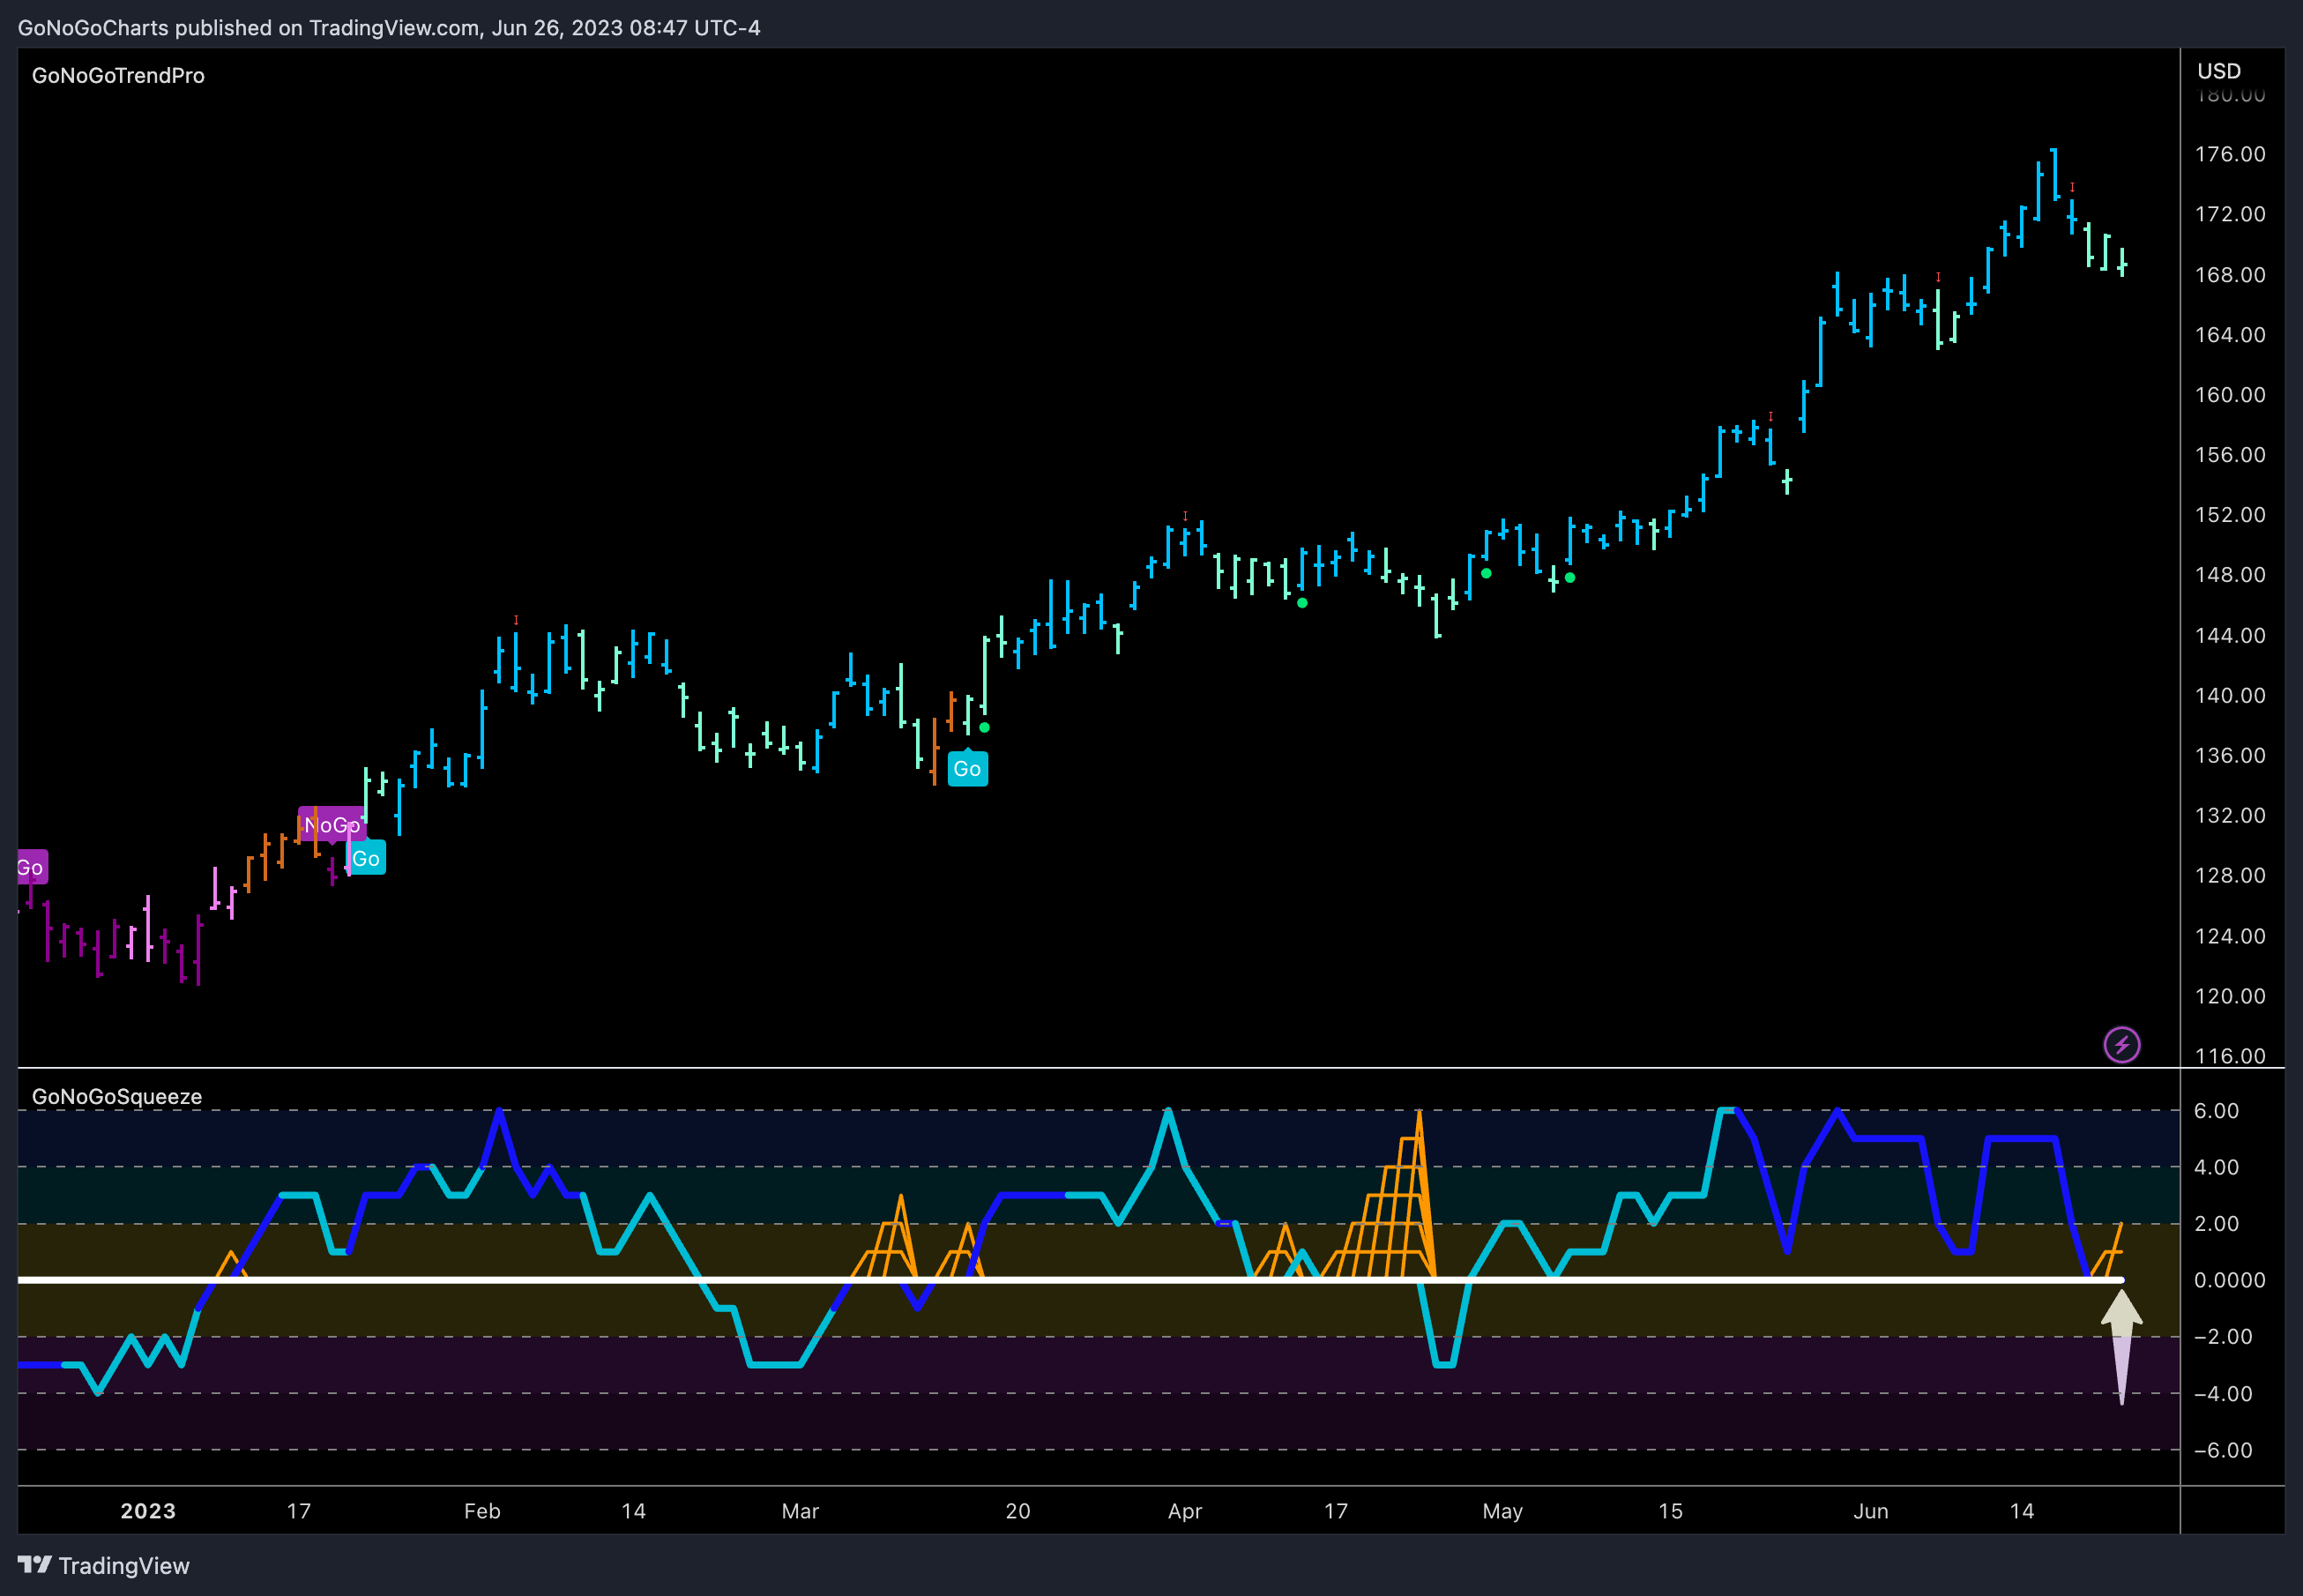
The daily chart of $XLK shows unequivocally why it has been such a driver of outperformance of late. After setting a series of higher highs and higher lows we see that price has pulled back from its recent high. We see GoNoGo Trend has painted several weaker aqua bars after the Go Countertrend Correction Icon (red arrow) suggested that prices may struggle in the short term. We look of course to the oscillator where we can see it is testing the zero line from above. In a healthy “Go” trend, we understand that GoNoGo Oscillator should find support at this level and momentum should stay on the side of the “Go” trend. If it does we can expect continued strength from the sector.
Relative Strength of Tech at Inflection Point
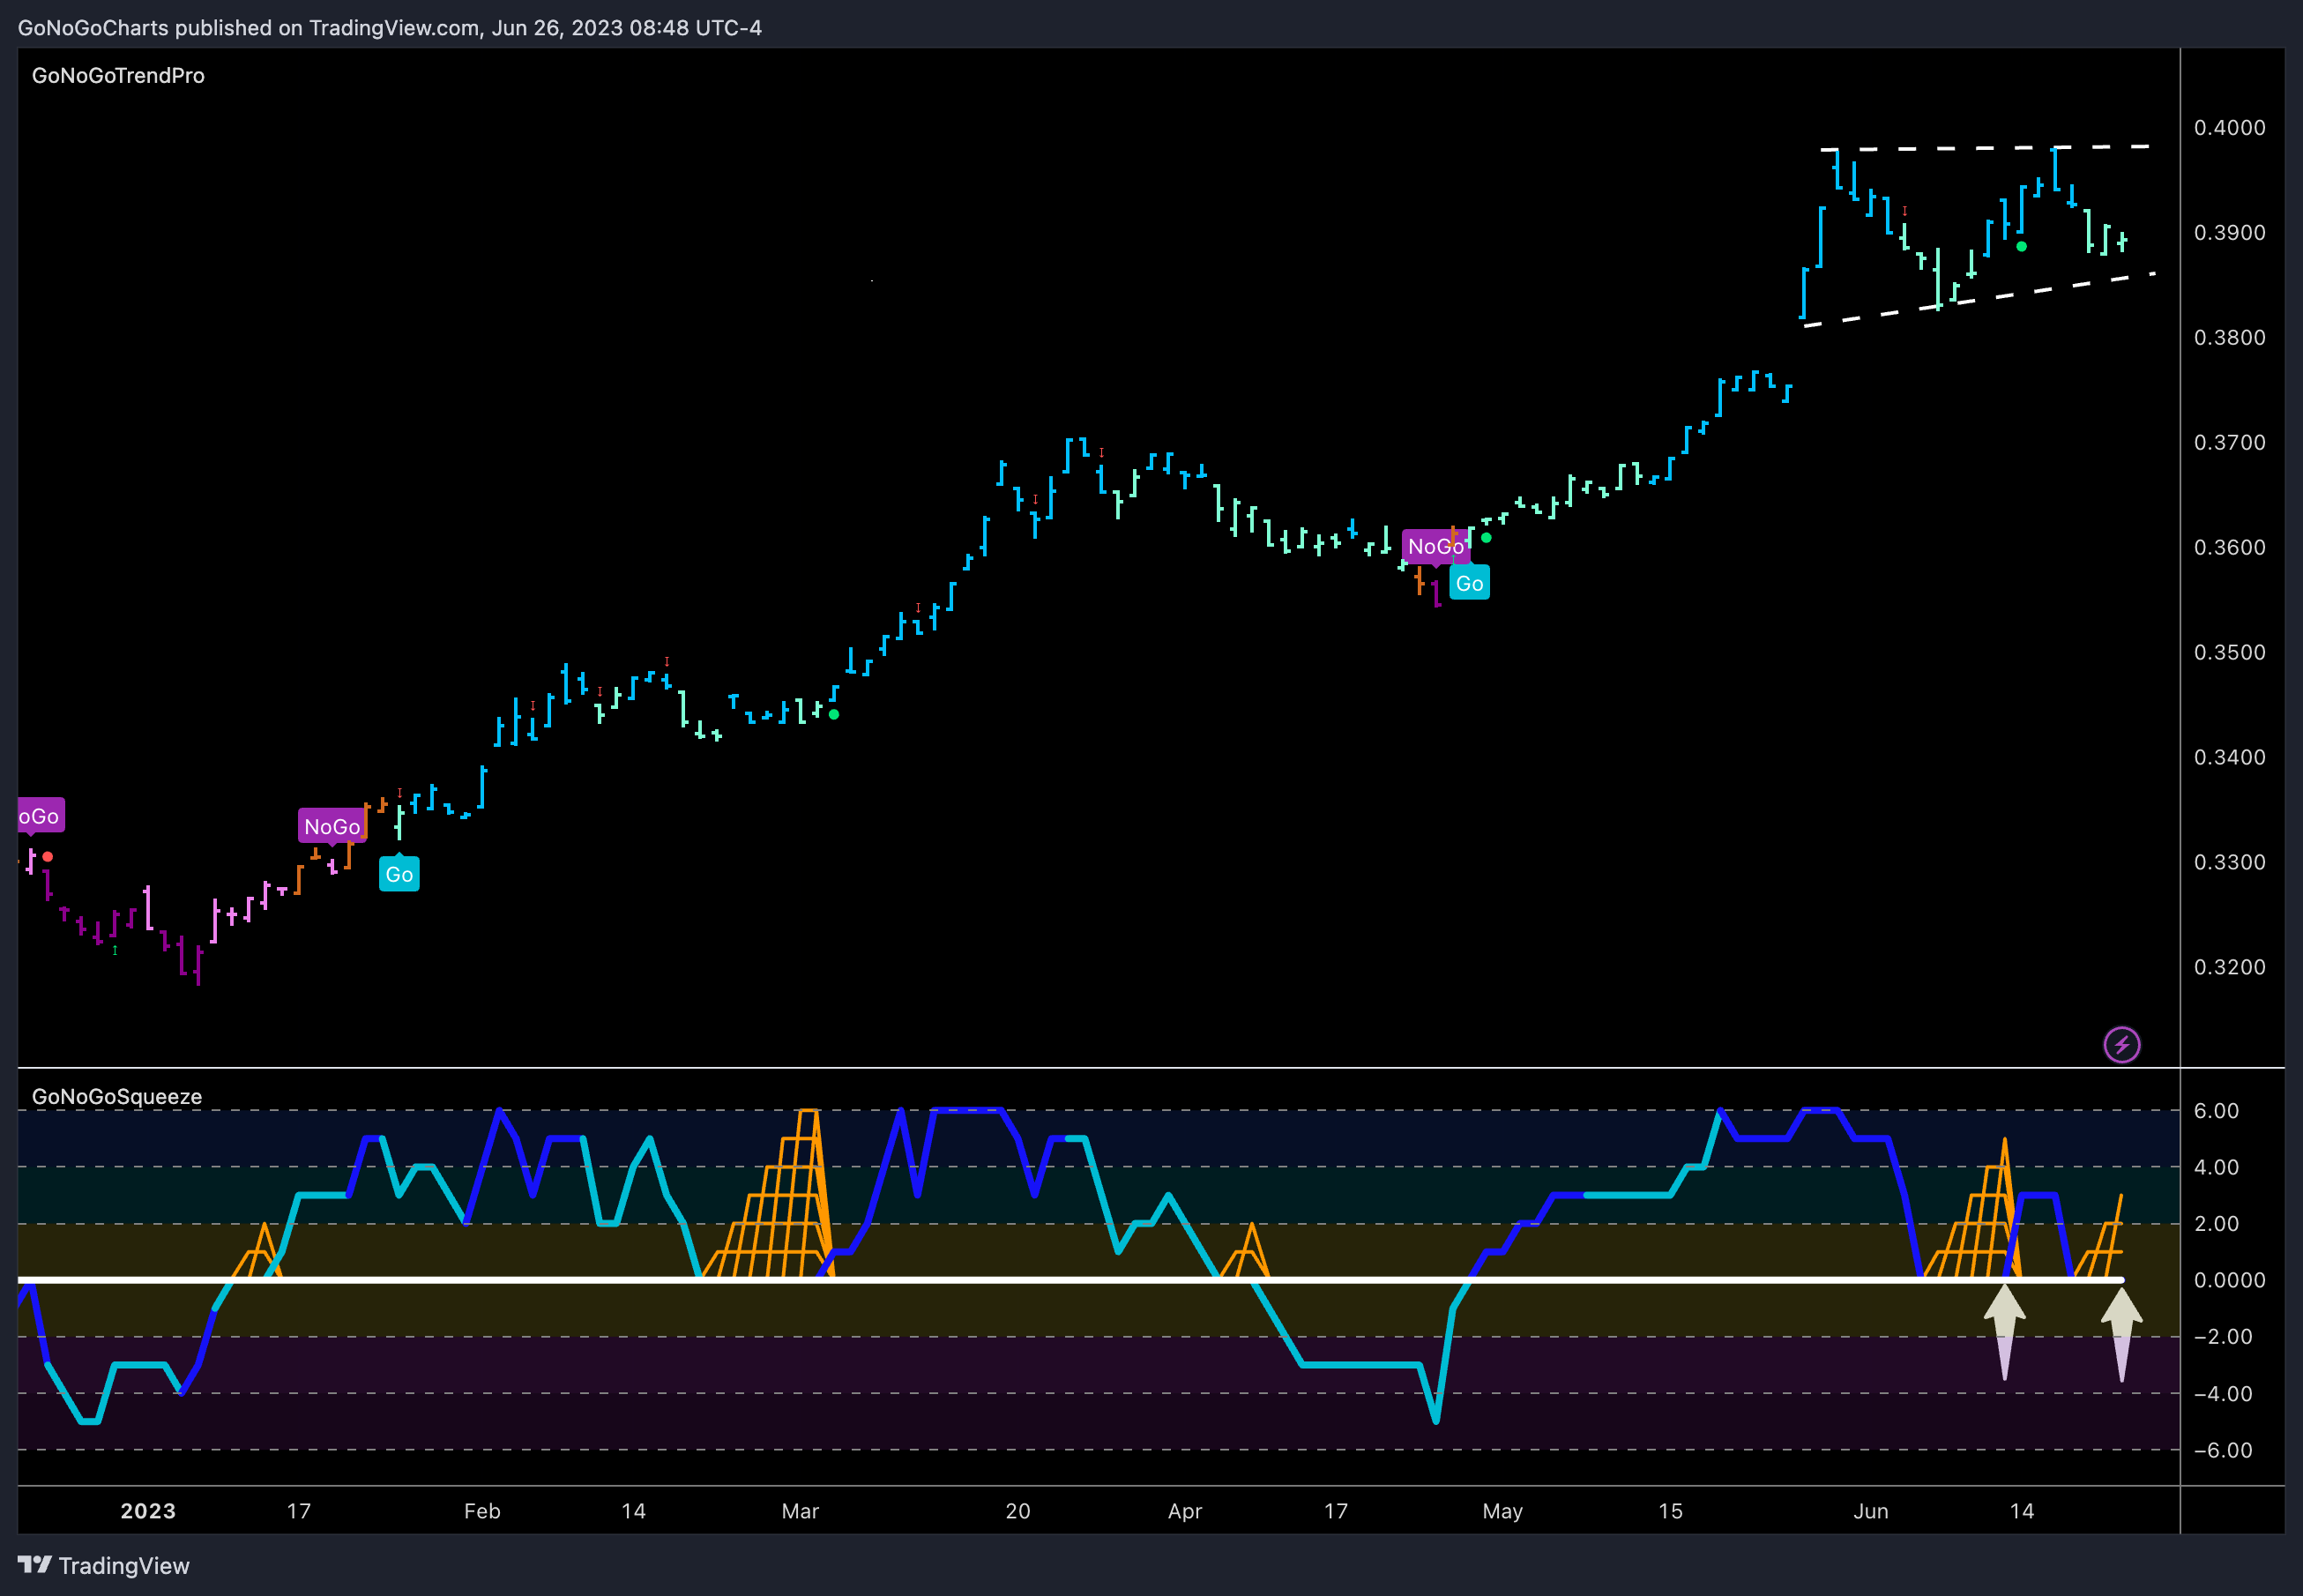
When looking at the ratio of $XLK to $SPY we can see that same picture playing out. After failing to make a new higher high, GoNoGo Oscillator has fallen to test the zero line where we will are looking for continued support. If price is likely to make an attempt at another new higher high then we will need to see momentum stay on the side of the “Go” trend.
Semiconductors to Make or Break the Tech Angle
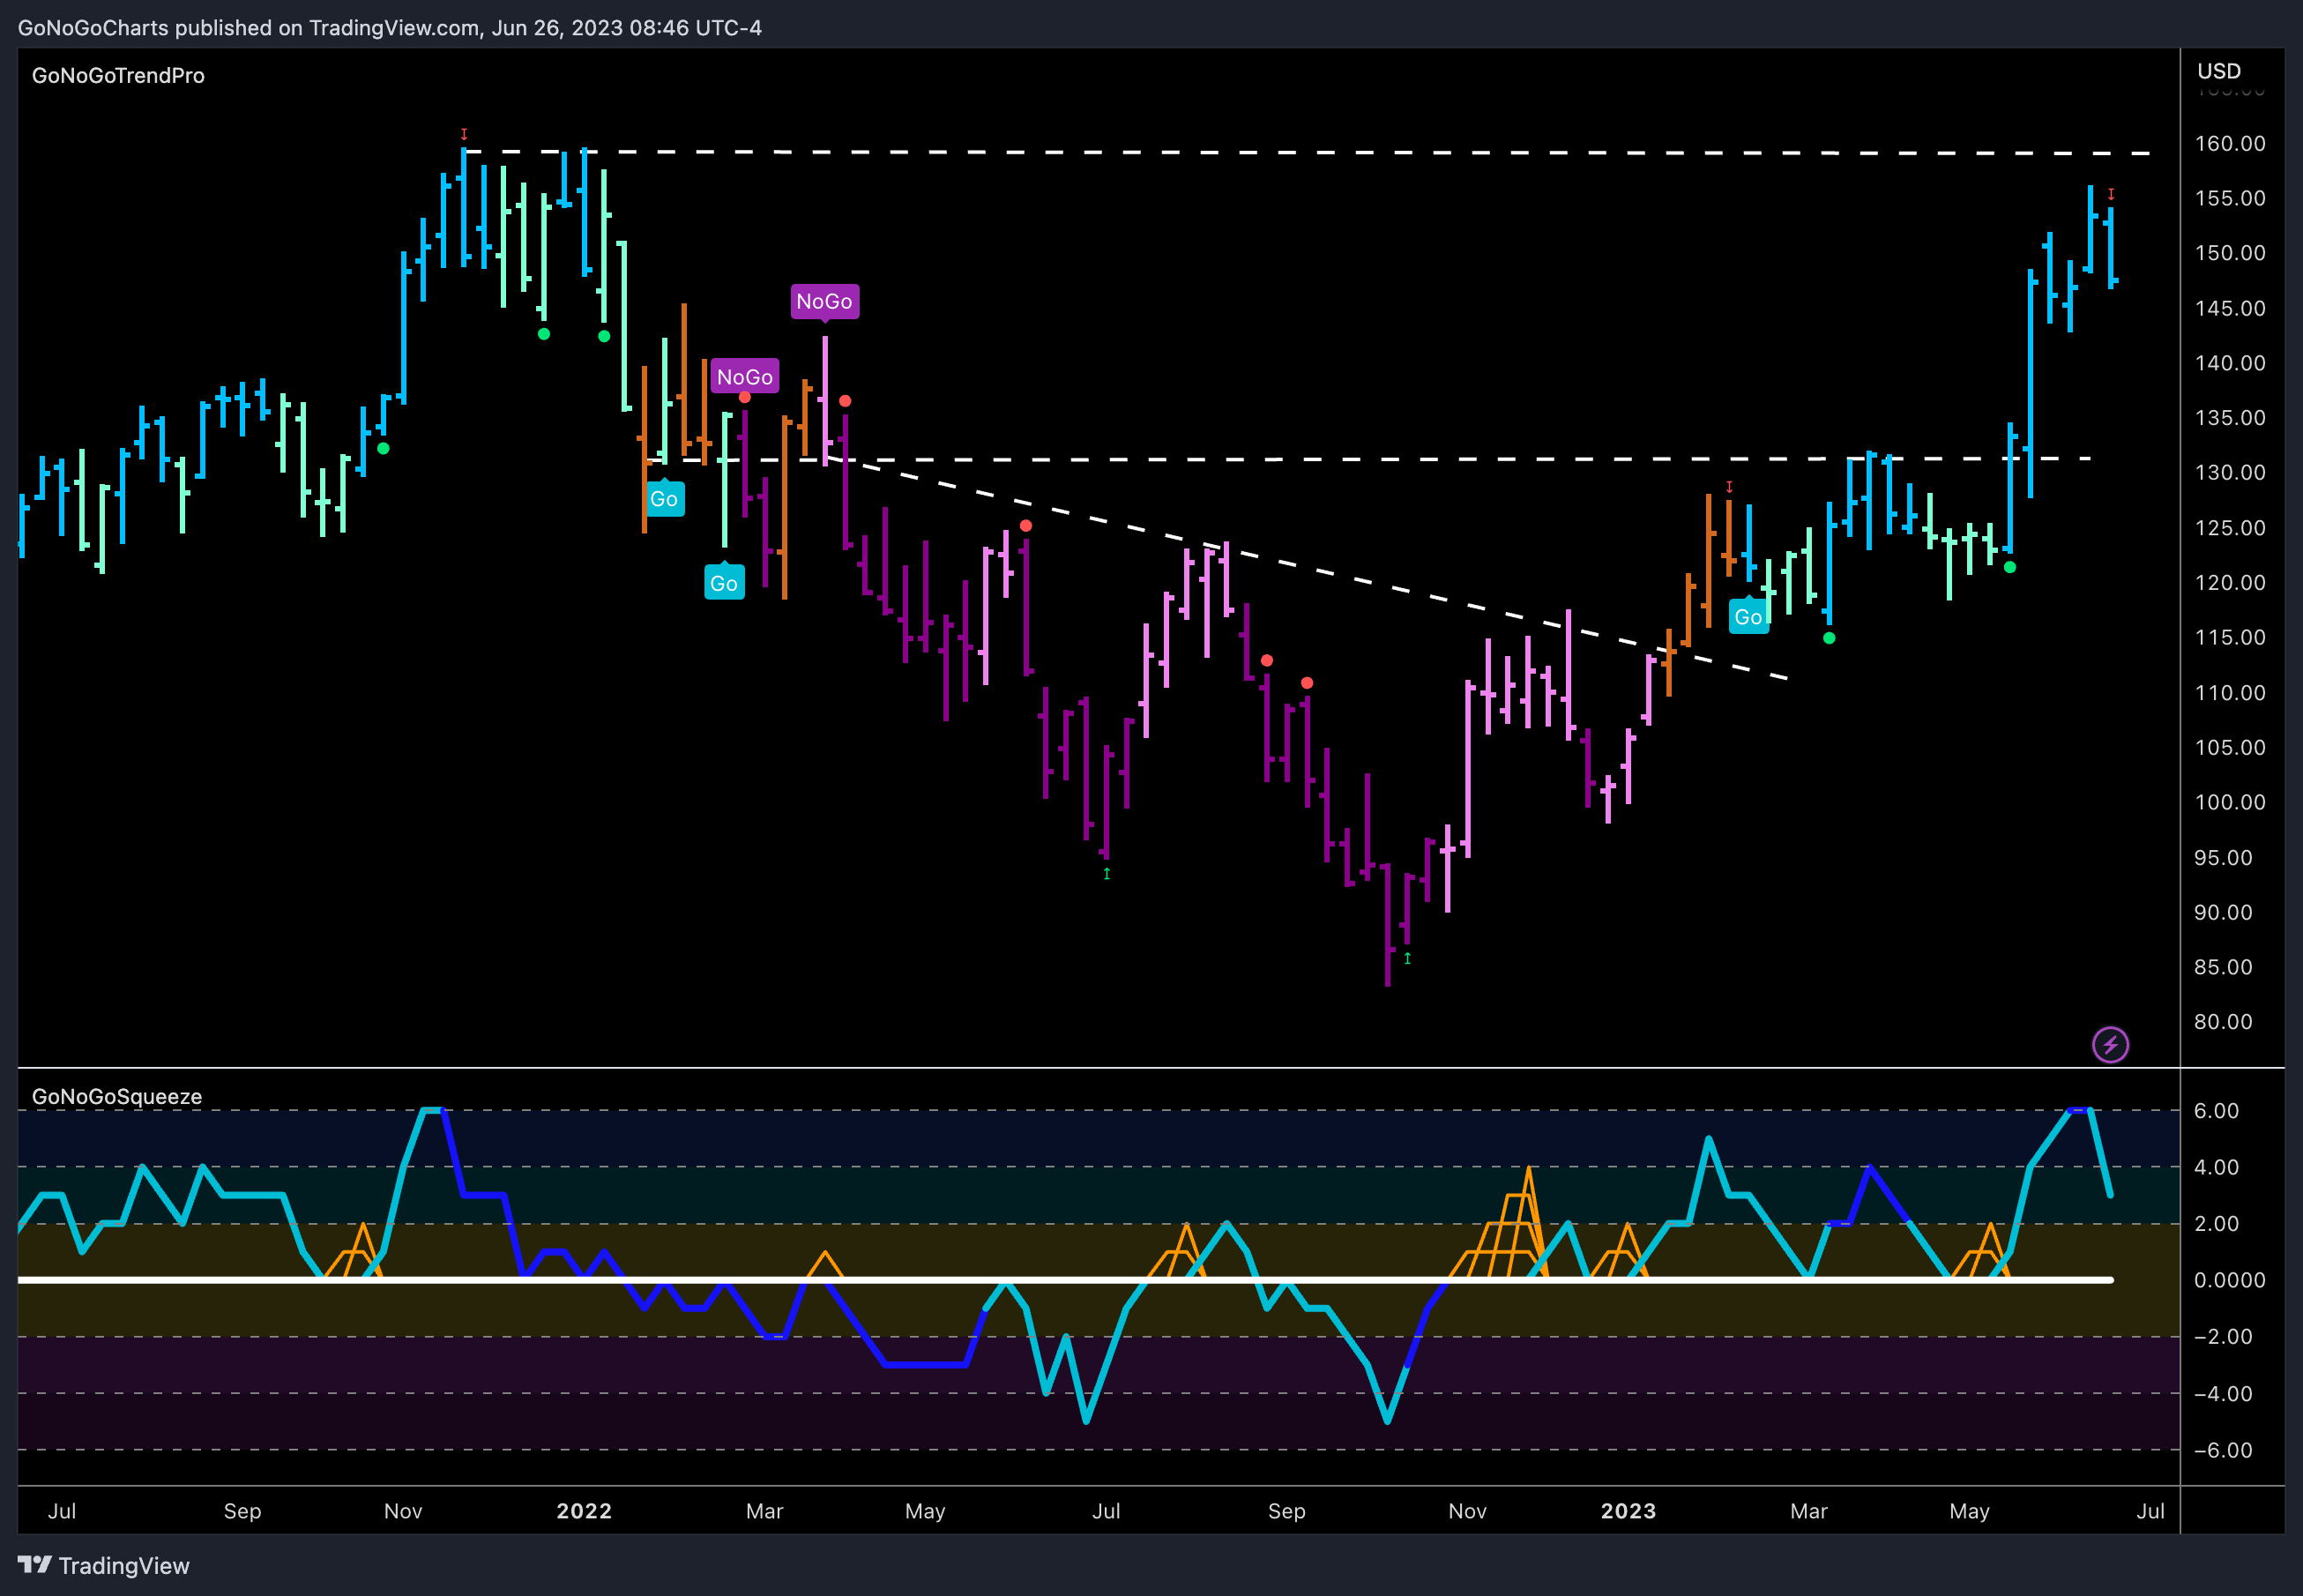
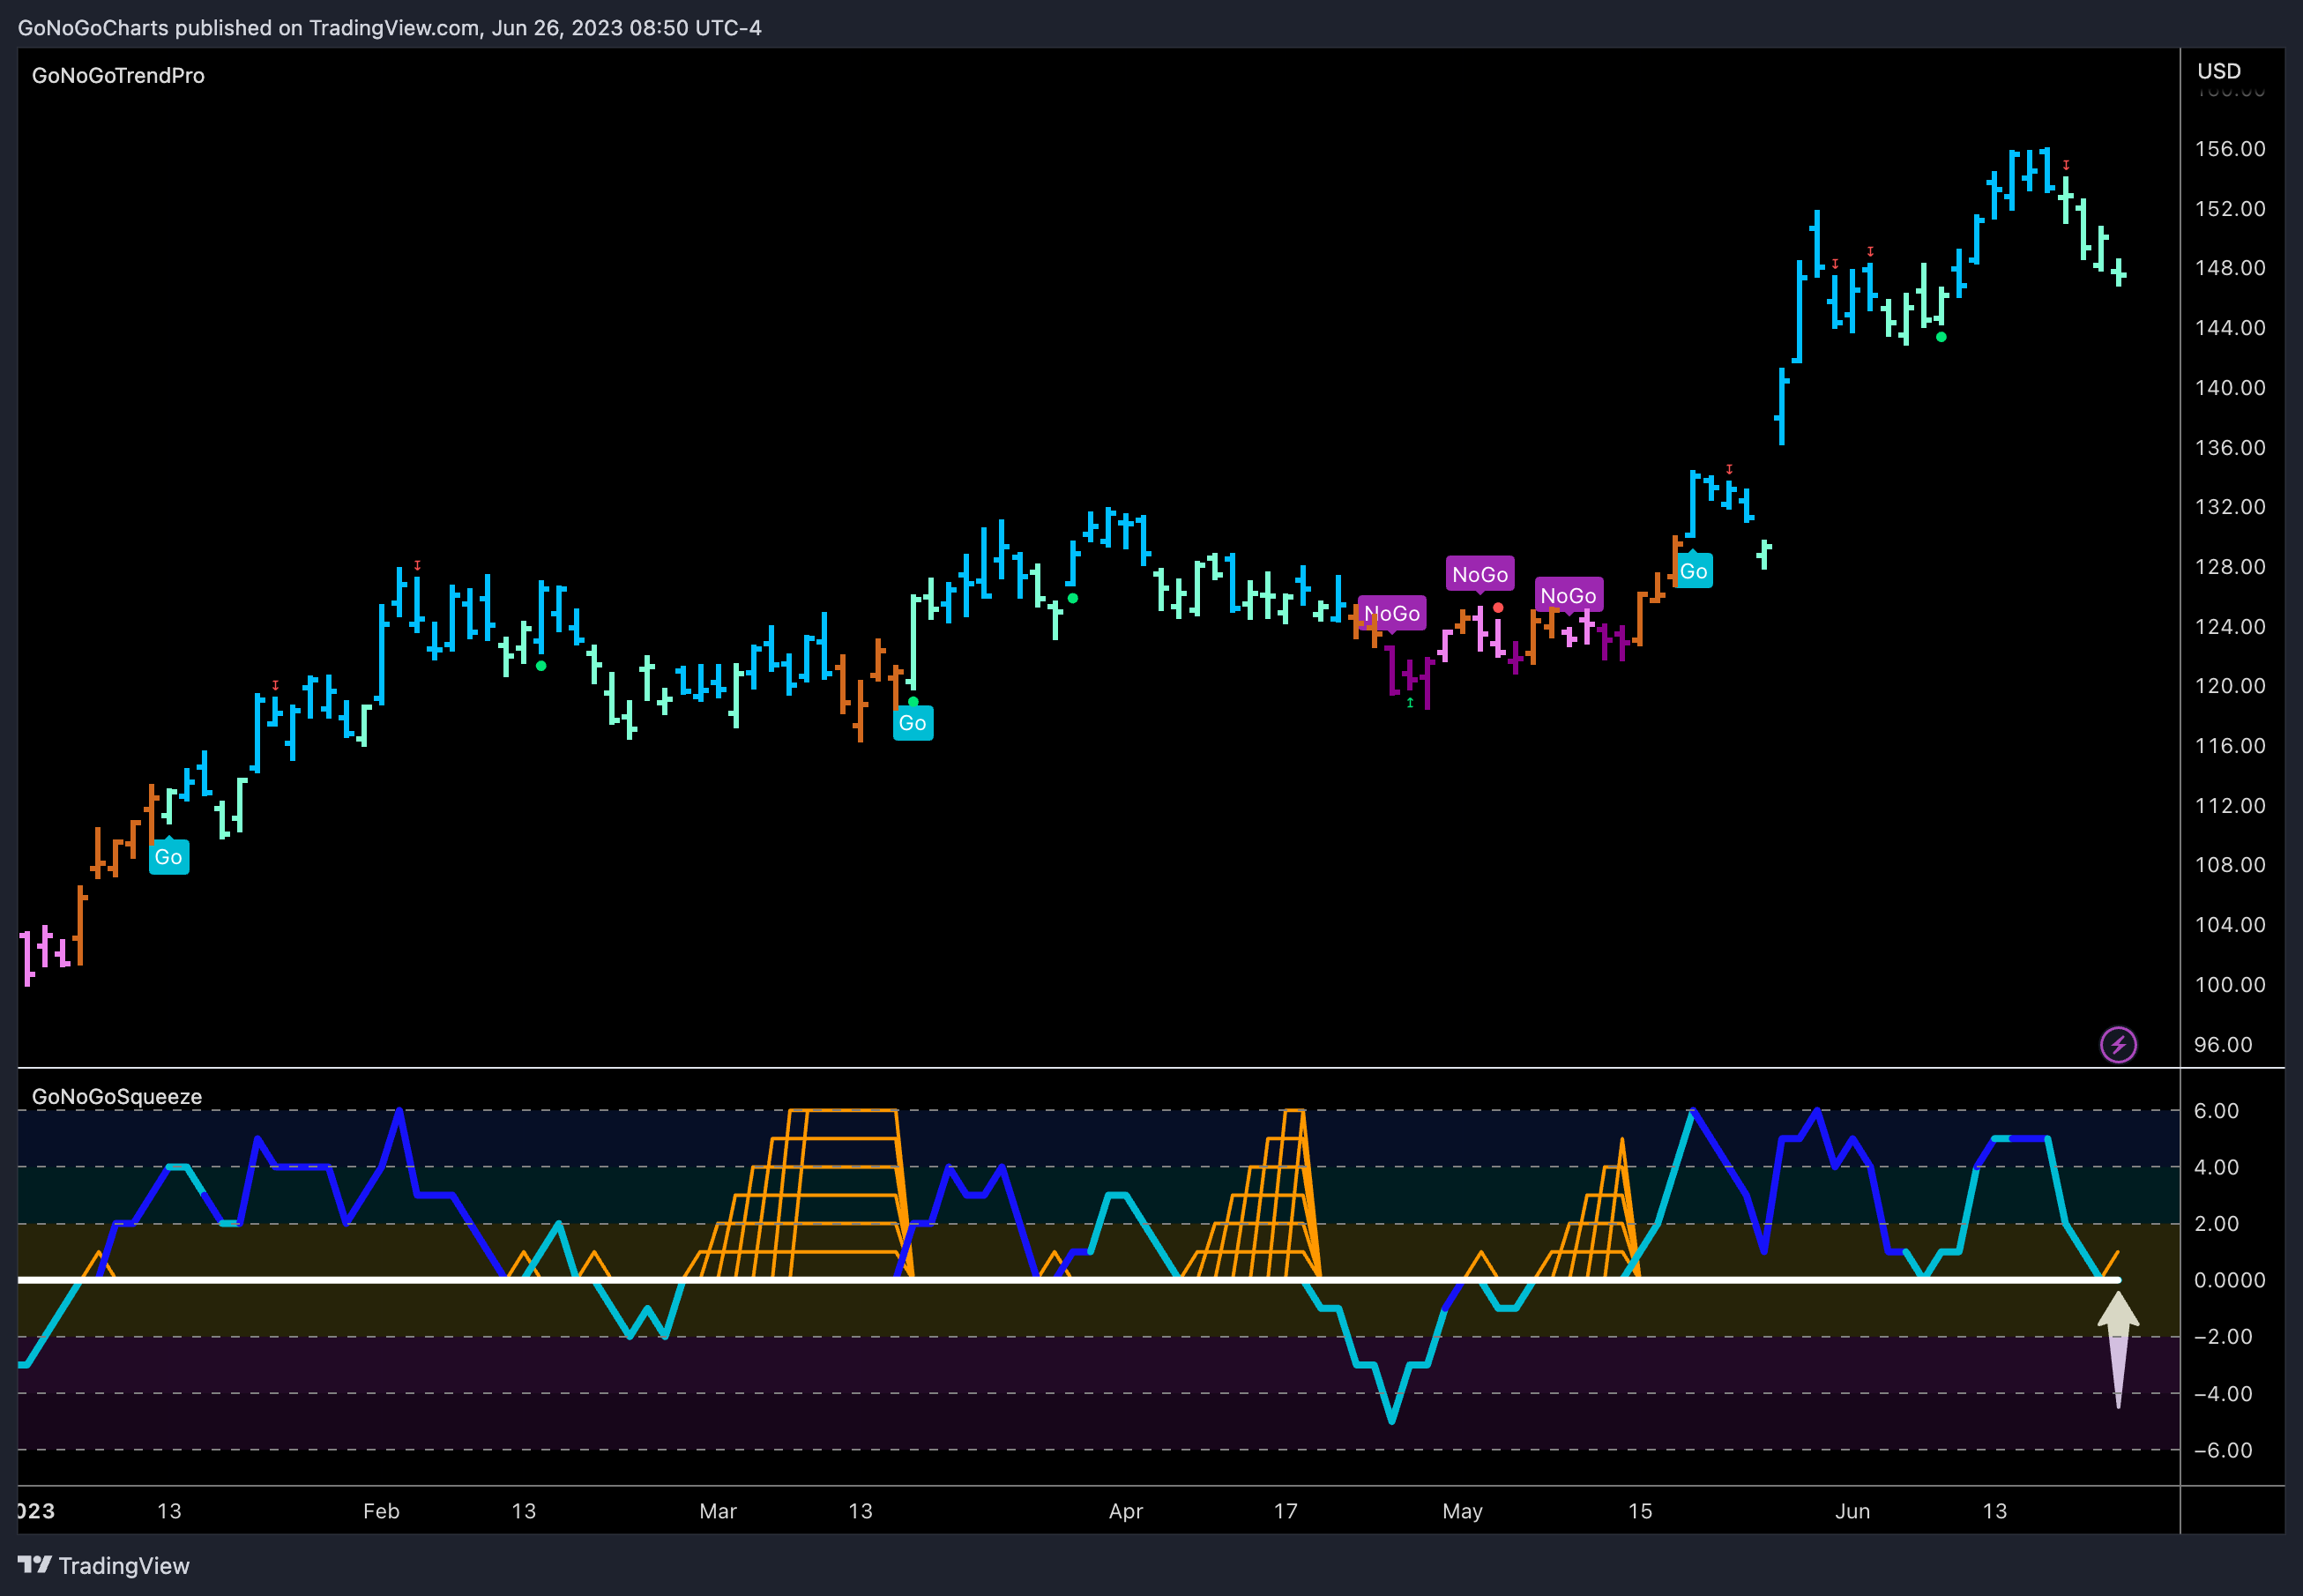
Semiconductors have been a strong outperformer within the outperforming technology sector. Is this likely to continue? We turn to the GoNoGo daily chart below of $SMH and see that GoNoGo Trend has hit a new higher high but has pulled back since the Go Countertrend Correction Icon (red arrow) and painted a string of weaker aqua bars. GoNoGo Oscillator has fallen to test the zero line from above where we will look to see if it finds support. If semiconductors are to continue to help lead this growth sector driven equity move higher, we will need to see momentum stay on the side of the “Go” trend.
The weekly chart below shows that the “Go” trend is still strong although we have seen a Go Countertrend Correction Icon (red arrow) which indicates a likely hood that in the short term prices may struggle to go higher. We also are seeing resistance from prior highs from late ’22. We must keep this picture in mind when putting the price action on the daily chart into context.
