Good morning and welcome to this week’s Flight Path. Let’s take a look at the GoNoGo Asset map below. Equities continue in their “Go” trend although GoNoGo Trend painted weaker aqua bars the entire week. Treasury bond prices held on to the “NoGo” trend that started the week prior but ended on a weaker pink bar. Commodities saw the “Go” trend strengthen this week with a string of strong blue bars and the U.S. dollar painted strong blue “Go” bars in the second half of the week as well.
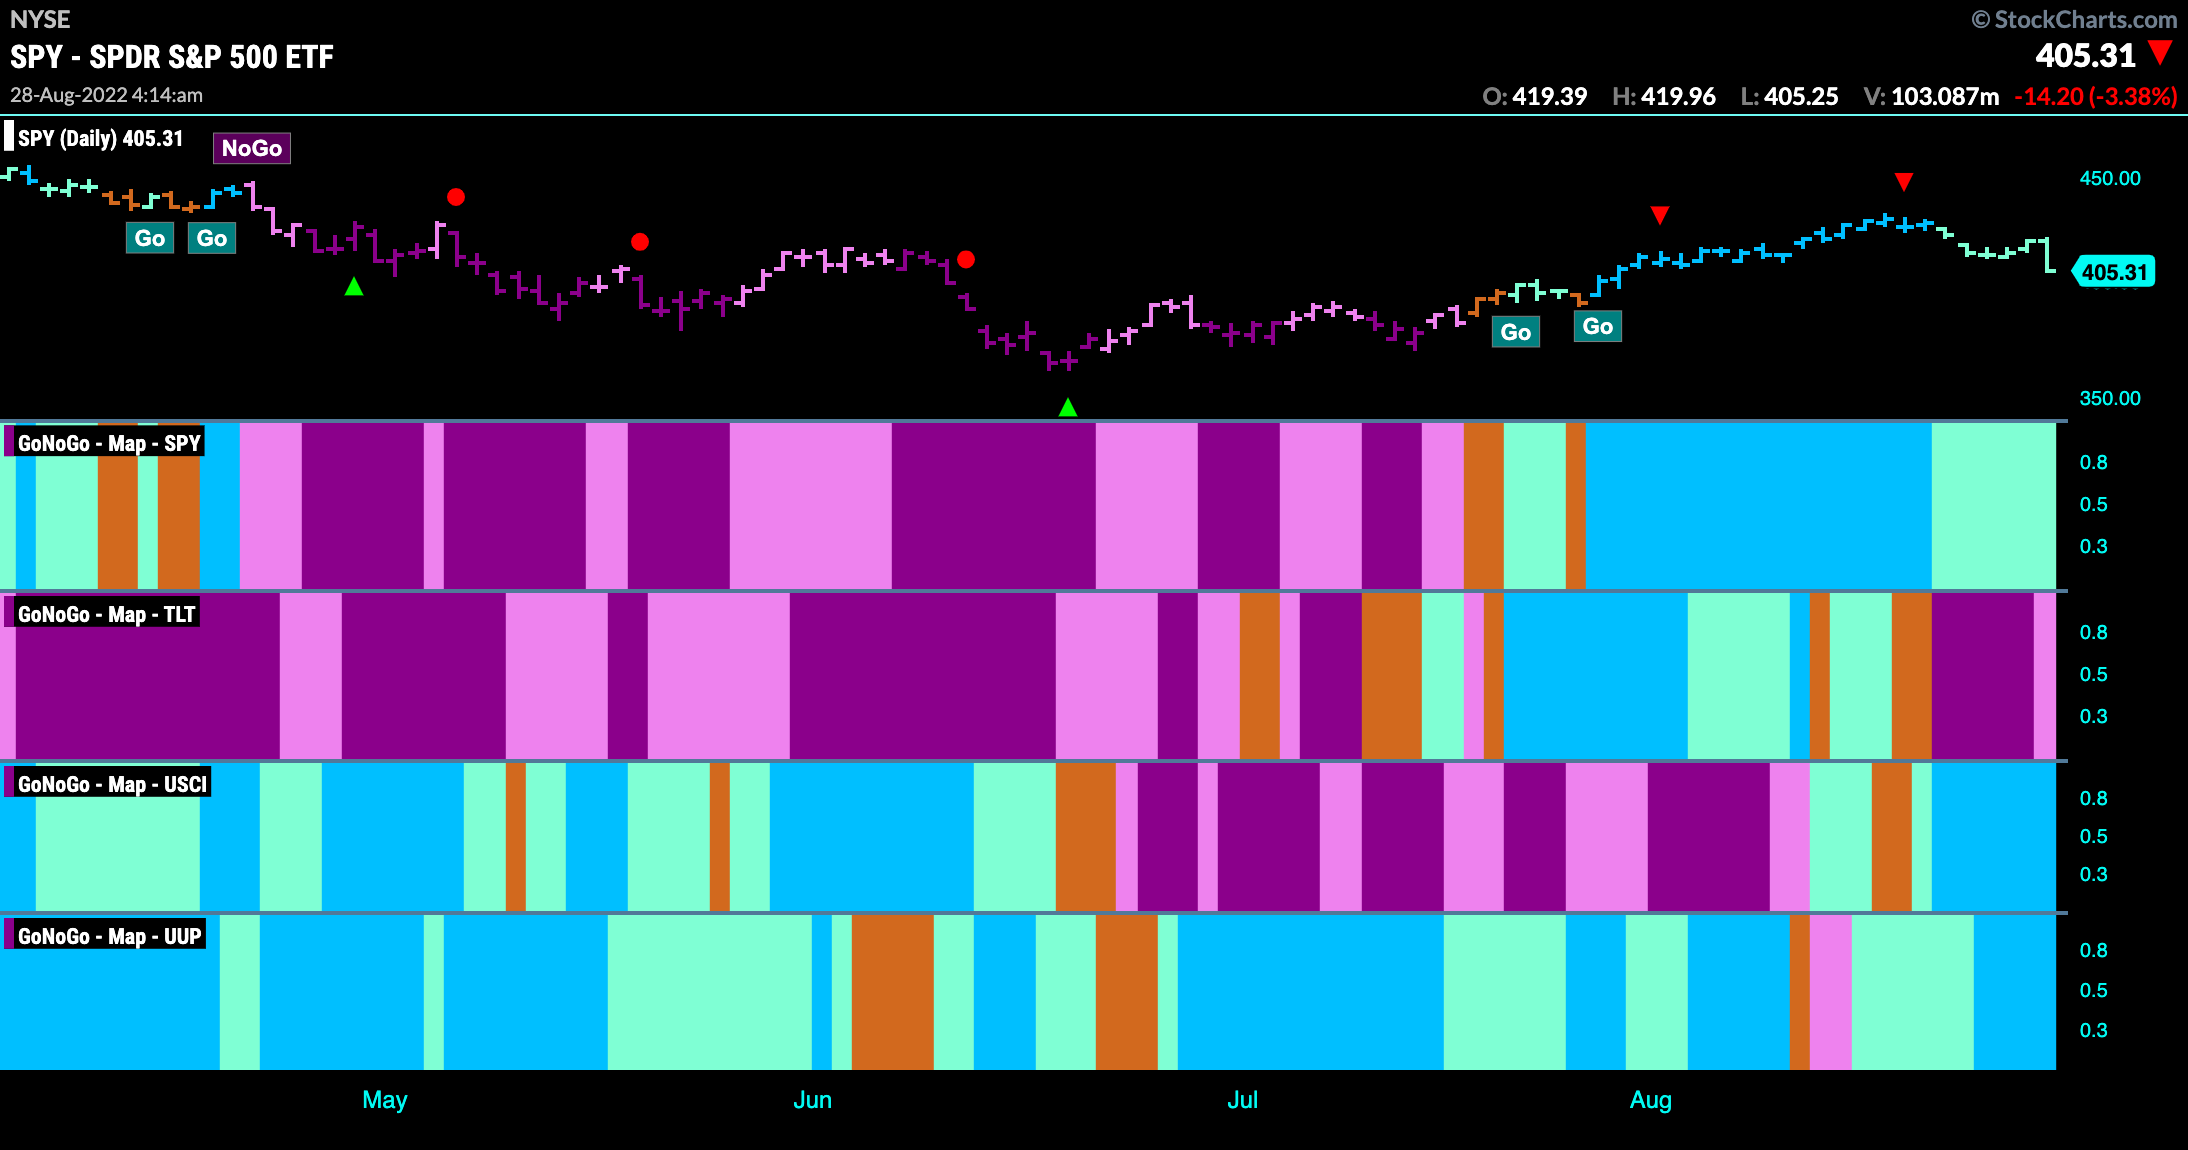
S&P 500 Fails to Hold the Zero line
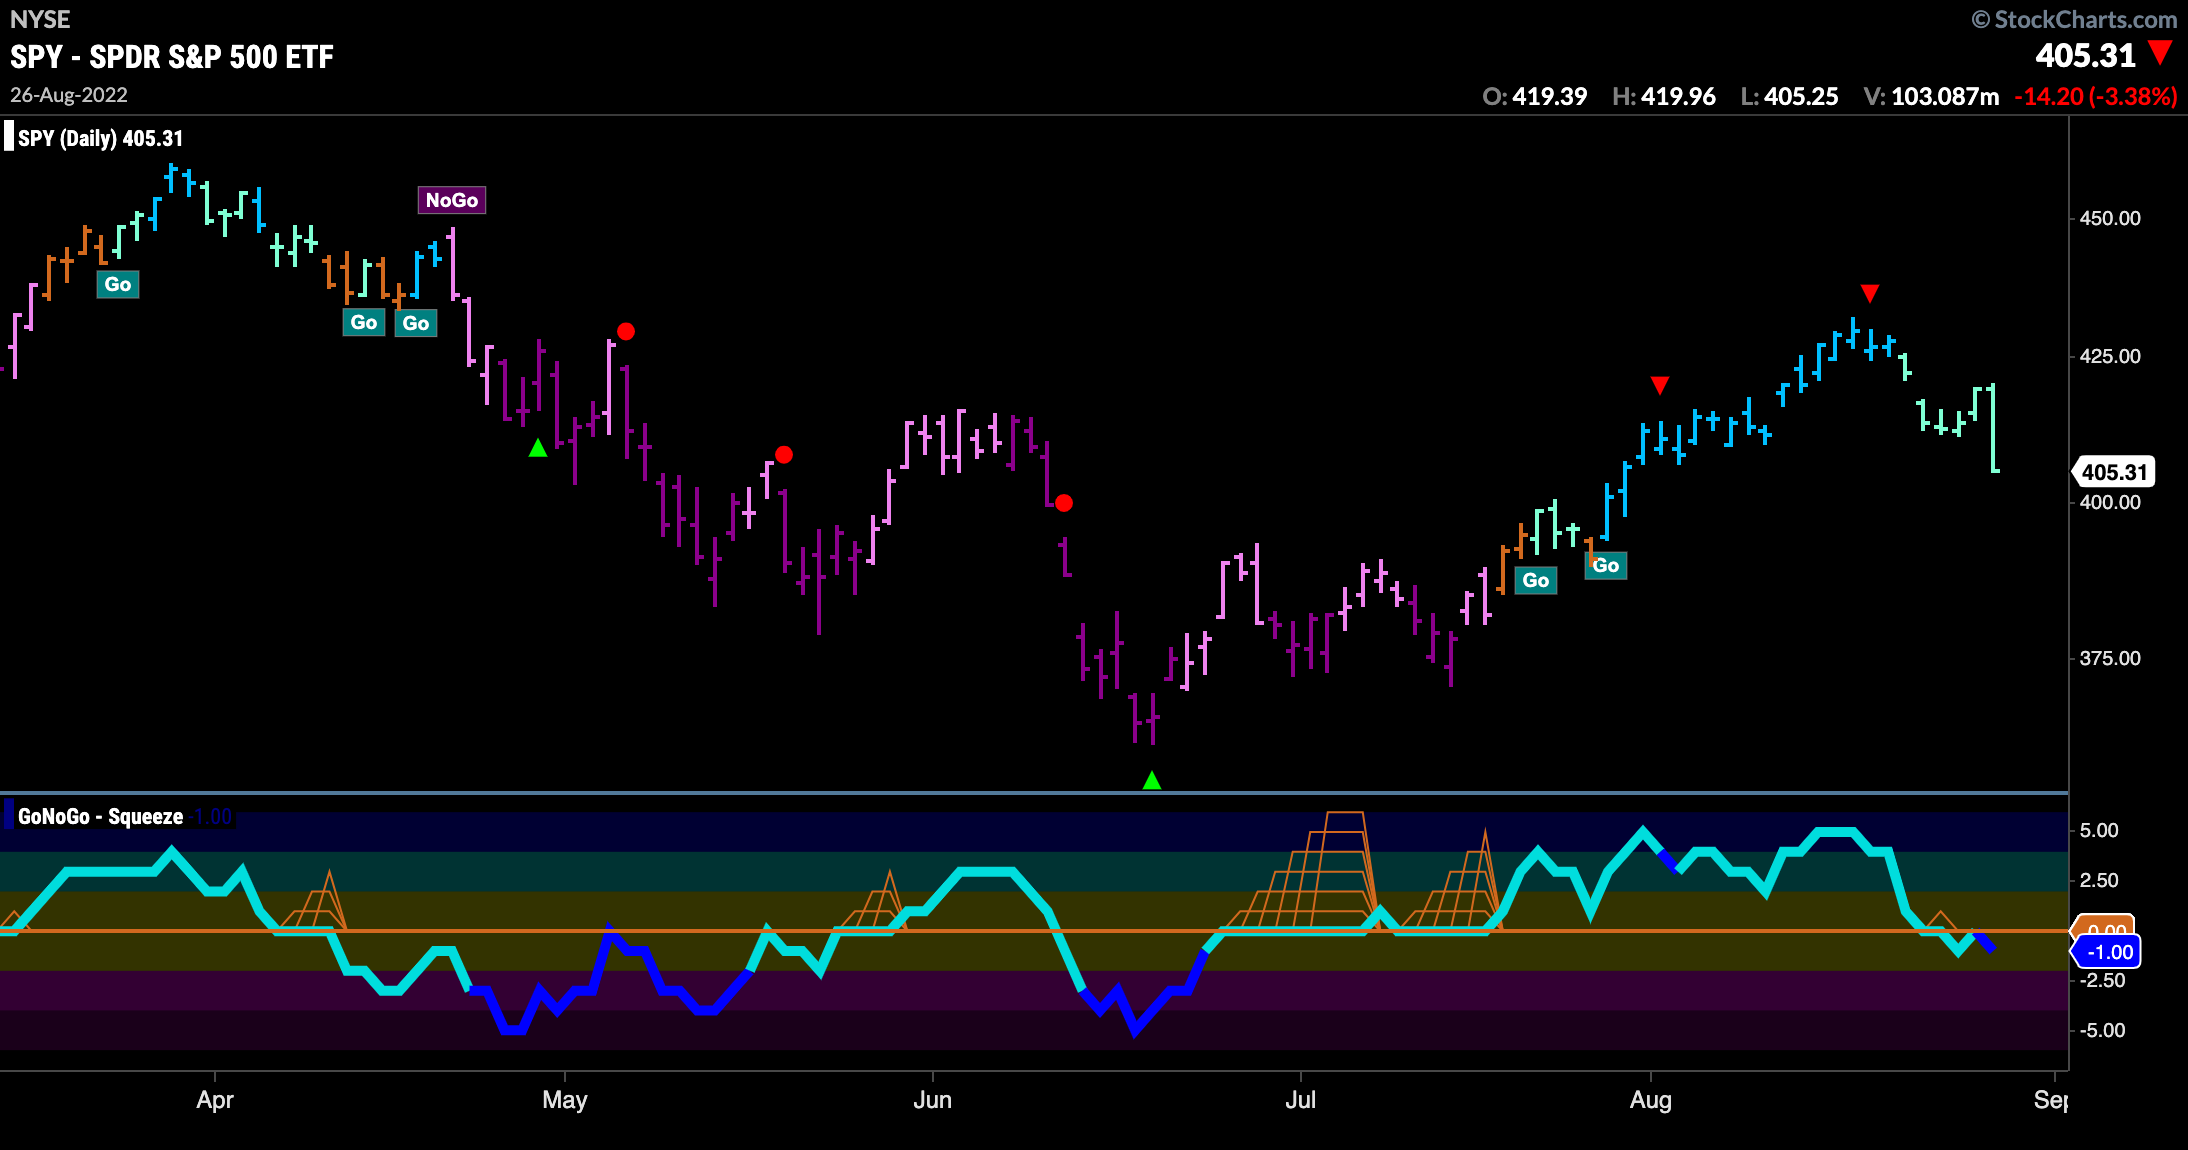
Not a good week for domestic U.S. equities. Wednesday saw GoNoGo Oscillator break below the zero line and it has stayed just in negative territory. Friday’s trading saw the oscillator turn darker blue indicating heavy volume. We will watch to see if this will lead to a larger correction or if the oscillator can regain positive territory.
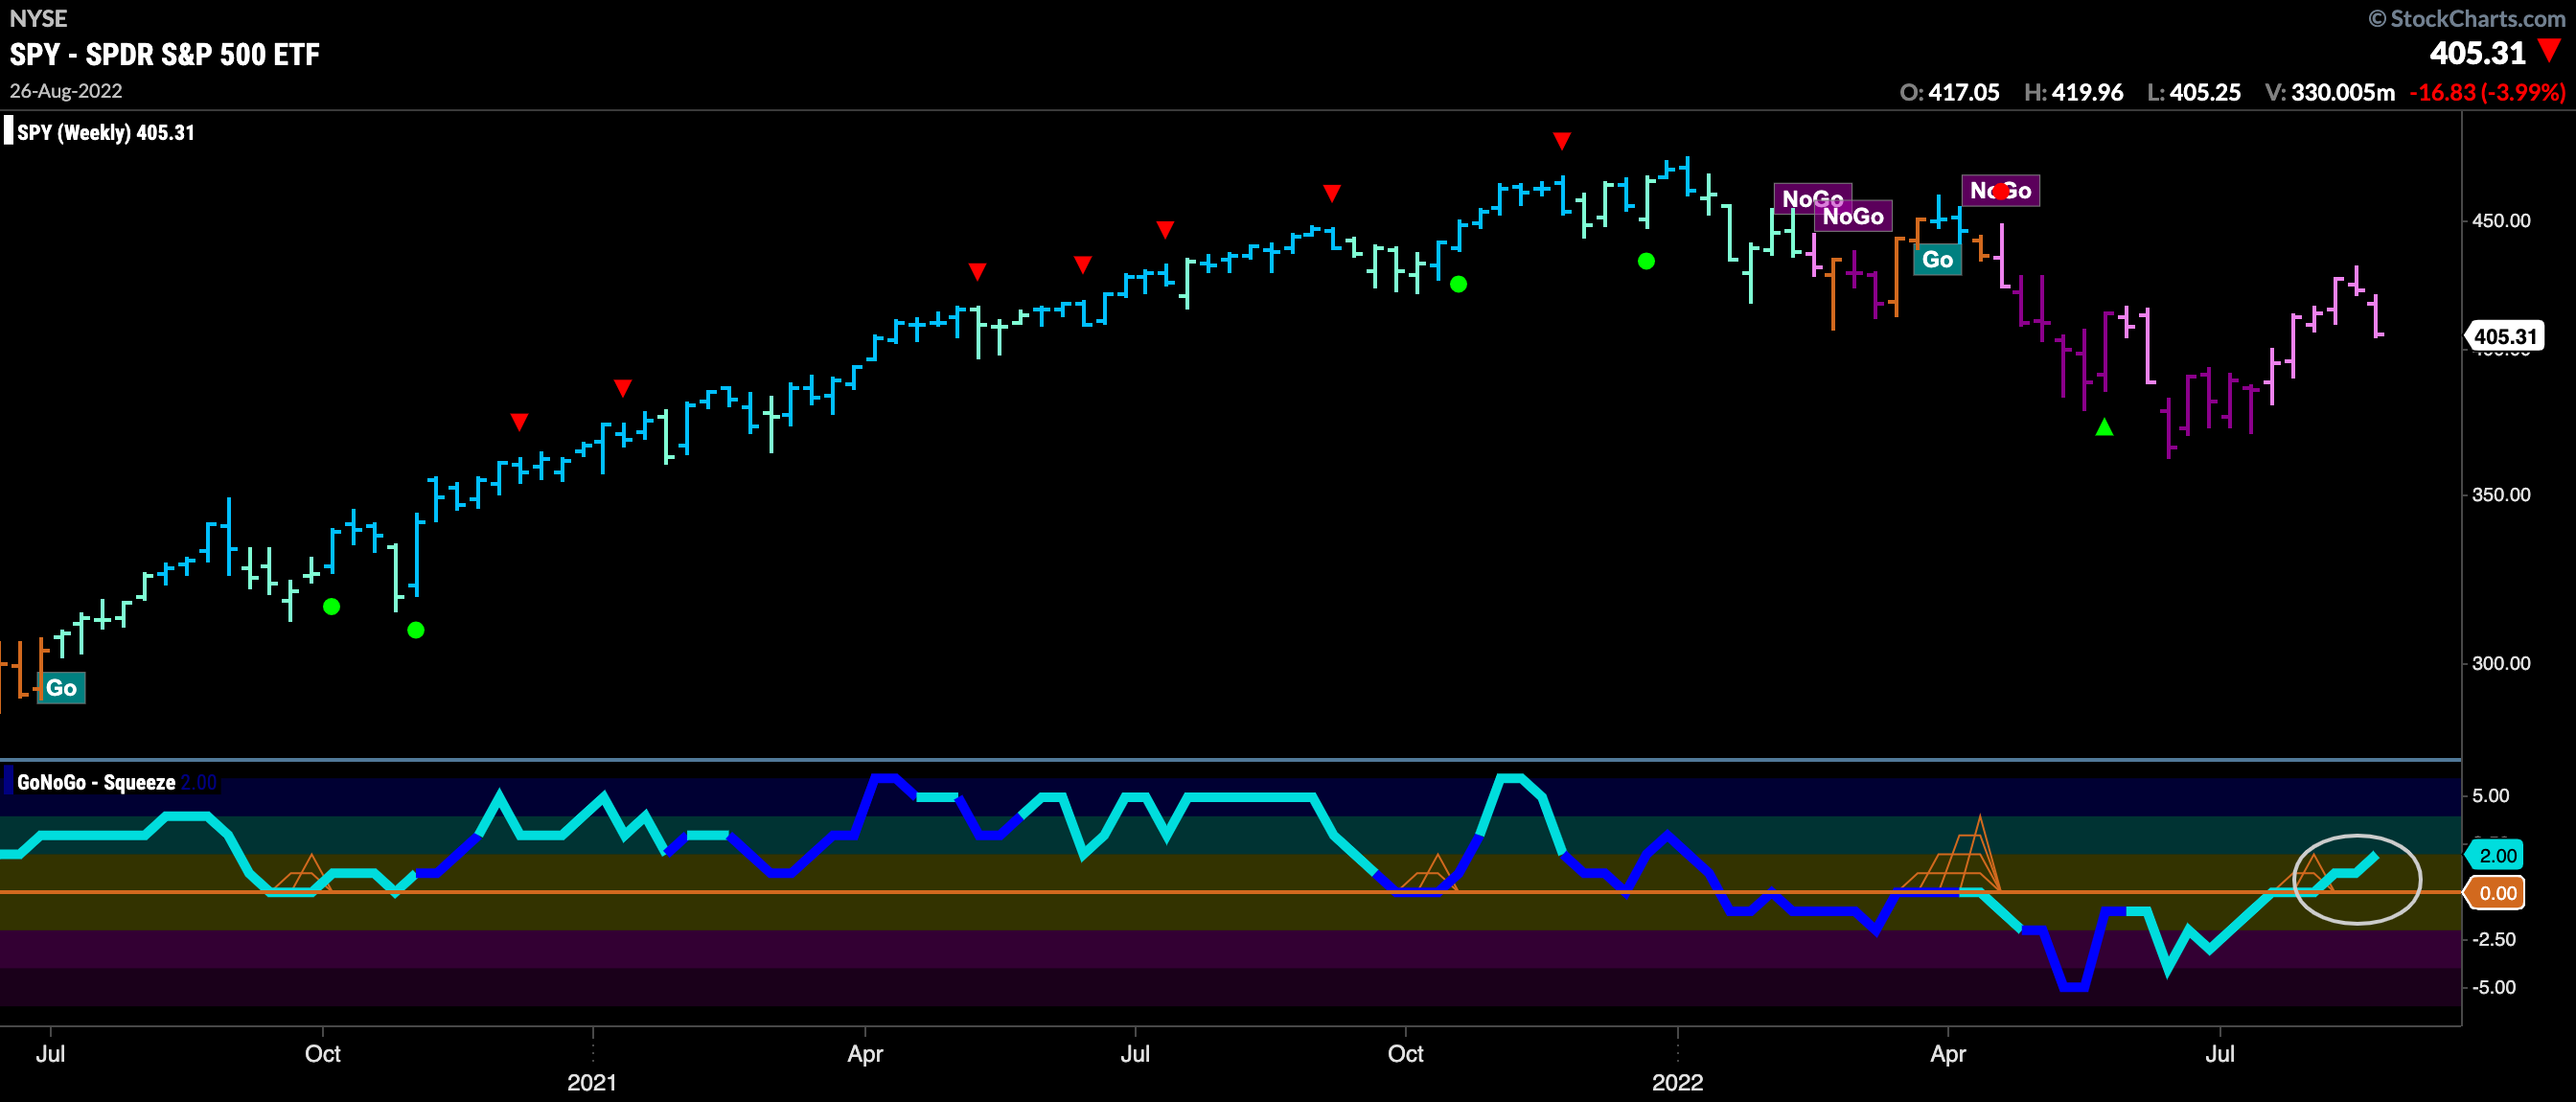
On the longer term chart, we see that although the weight of the evidence from a trend perspective tells us that the “NoGo” is still in place with the indicator painting pink bars, GoNoGo Oscillator is now clearly in positive territory. We will need to see the daily and weekly charts agree over the next few weeks.
“Go” Trend in Rates Returns
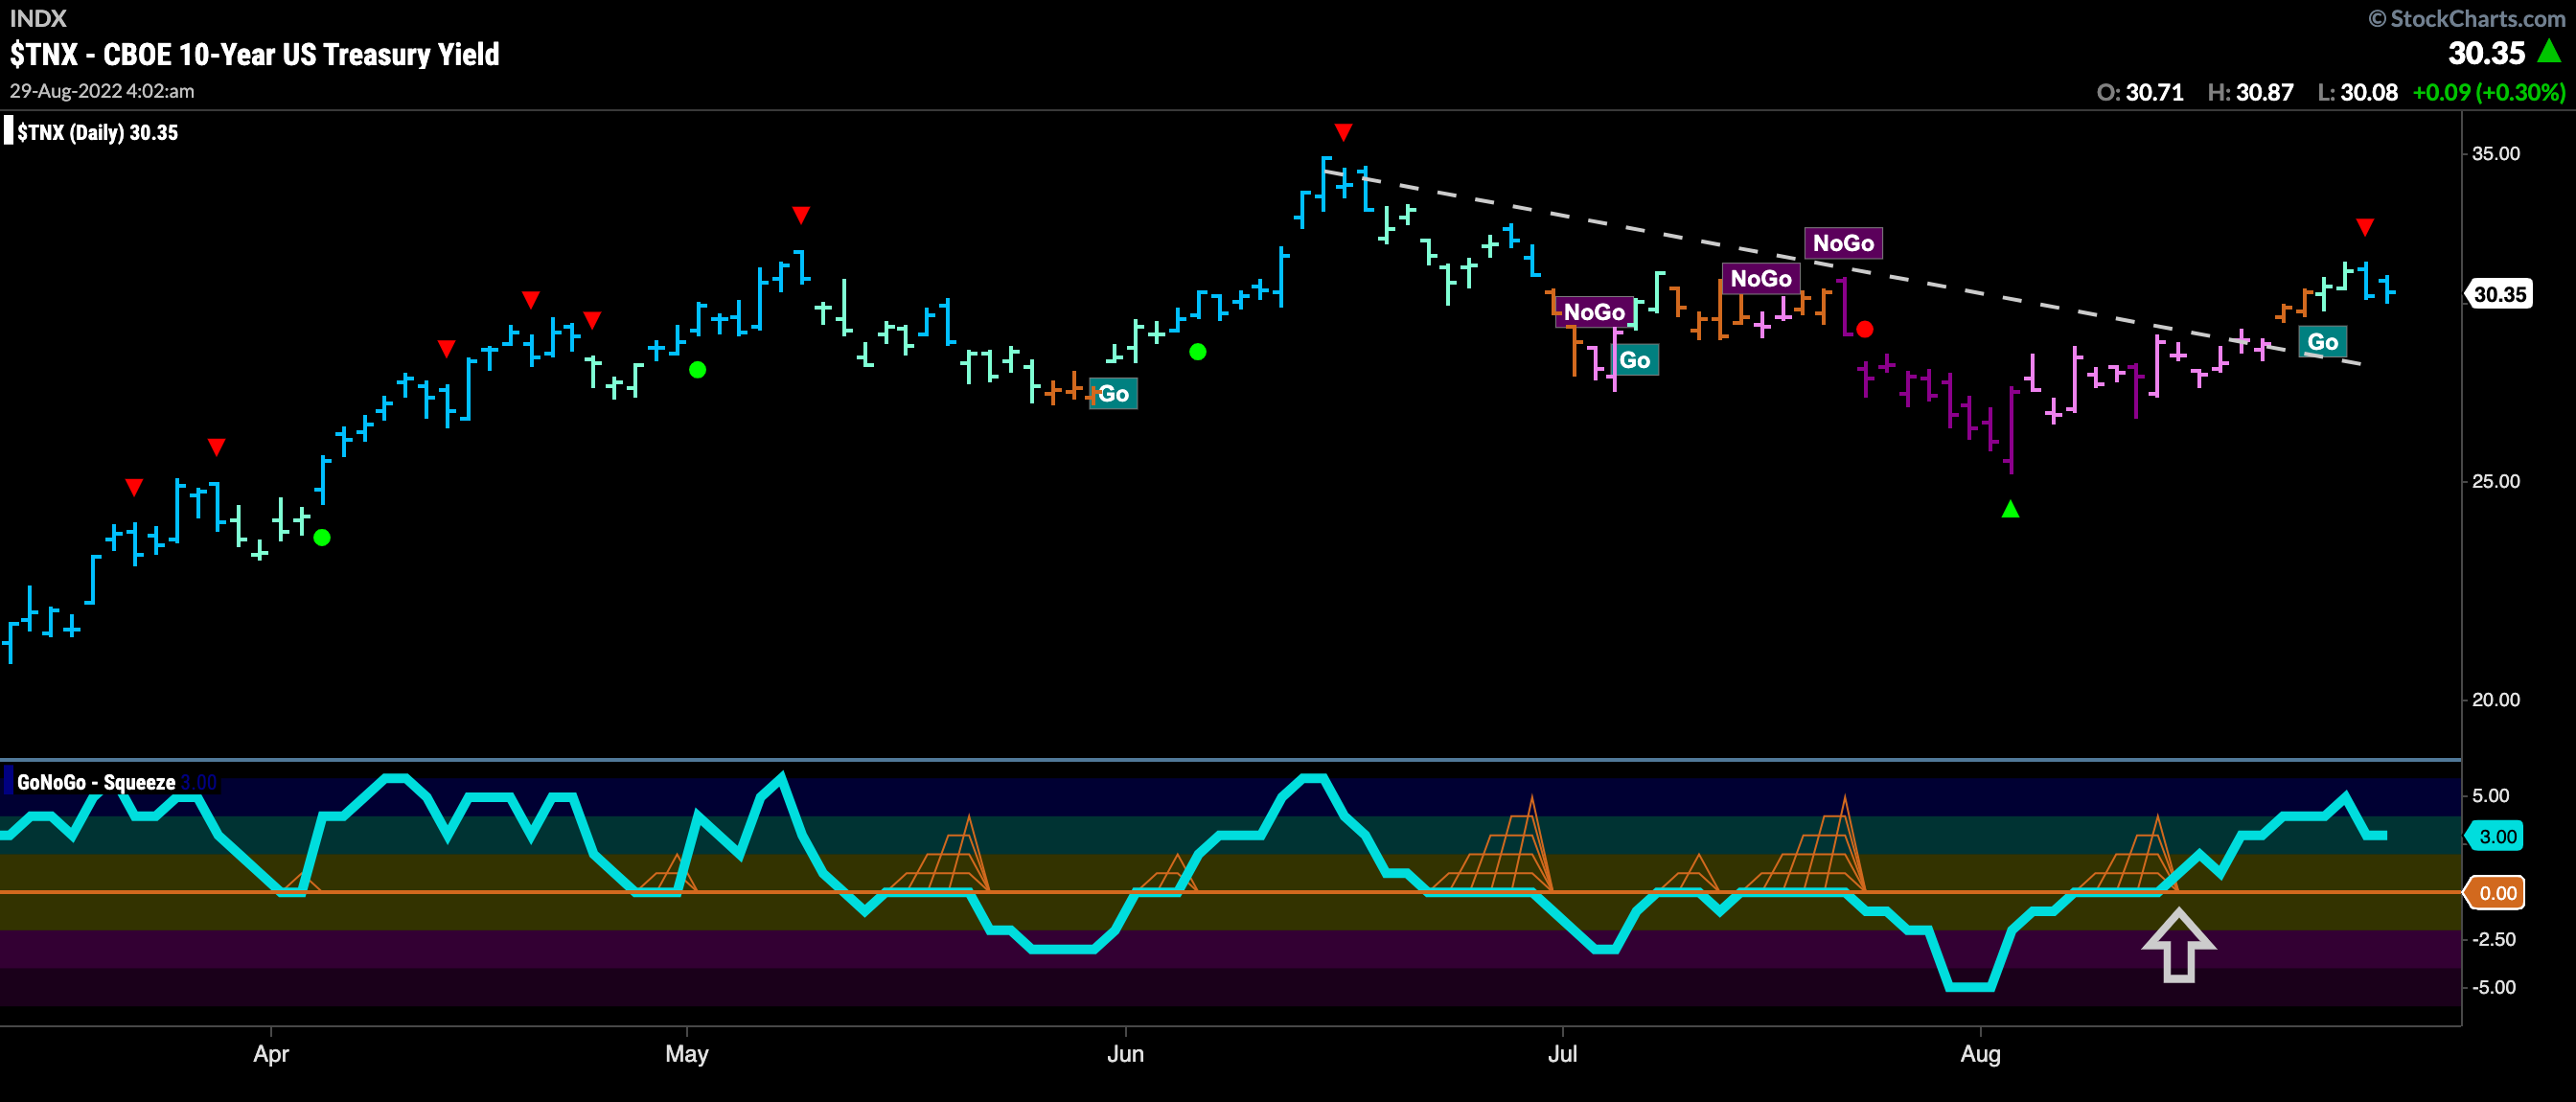
We have seen a continuation of the price action we noted in treasury rates over the last few weeks. The first sign of a change in environment was when GoNoGo Oscillator crossed above the zero line breaking out of a small GoNoGo Squeeze. Then, at the beginning of last week we saw an amber “Go Fish” bar which this week has been followed by aqua and blue “Go” bars. We will look to see if price continues higher in which case it will attempt to set a new high.
Strong “Go” Trend in U.S. Dollar
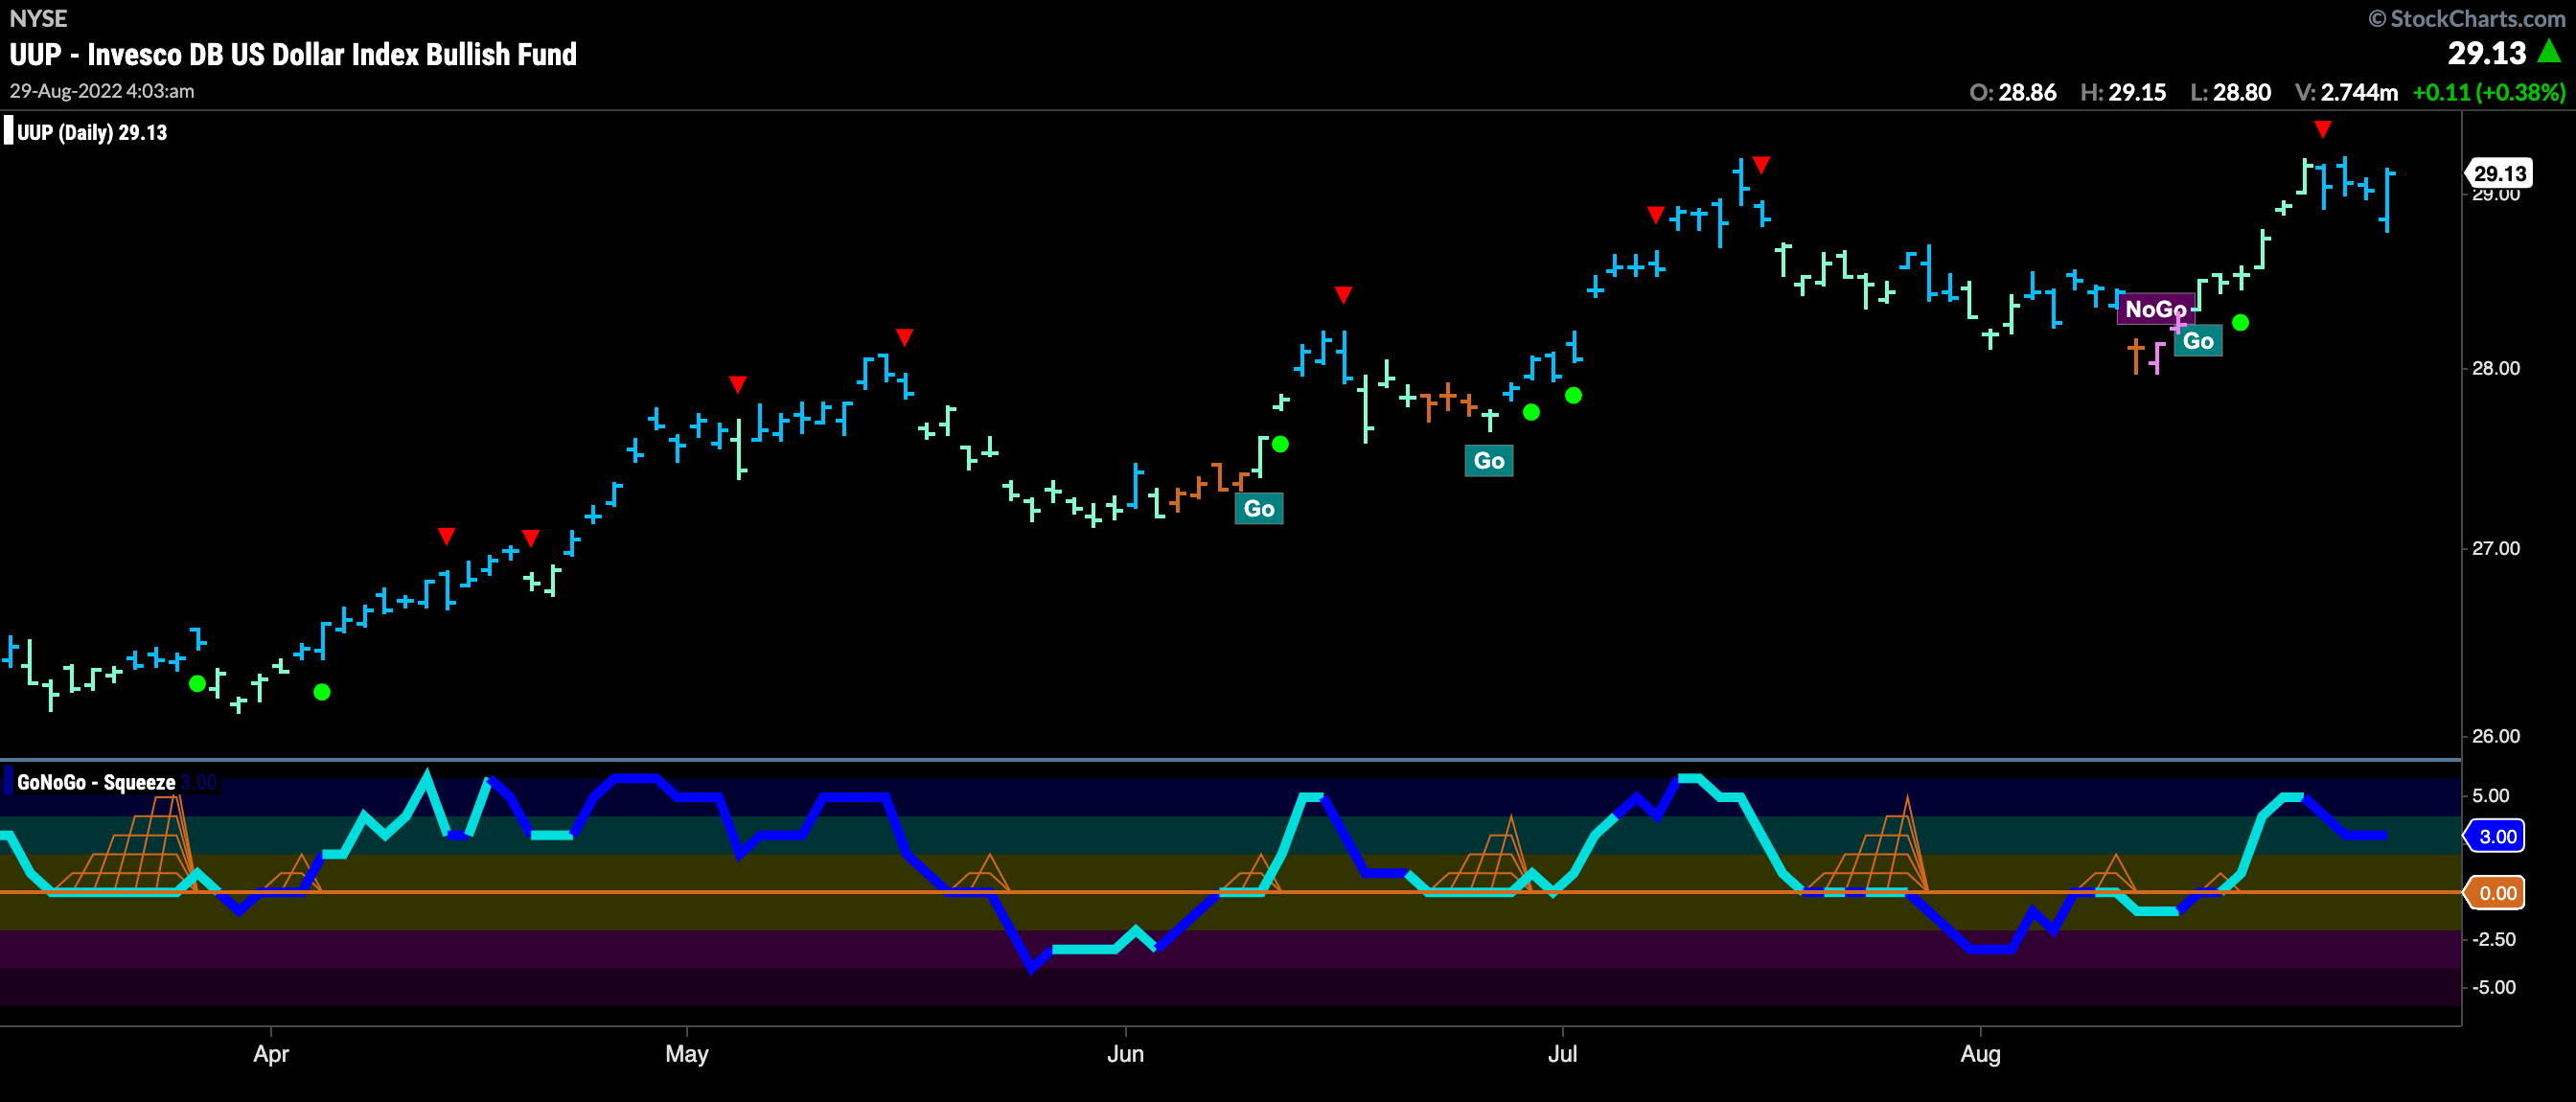
GoNoGo Trend shows that the trend is strong in the dollar this week as we see blue “Go” bars and GoNoGo Oscillator in positive territory on heavy volume. We have seen price move sideways since triggering a Go Countertrend Correction arrow earlier in the week and so we will see if a fresh surge in momentum can push price to a new high.
“NoGo” persists for Oil but Momentum Pushes into Positive Territory
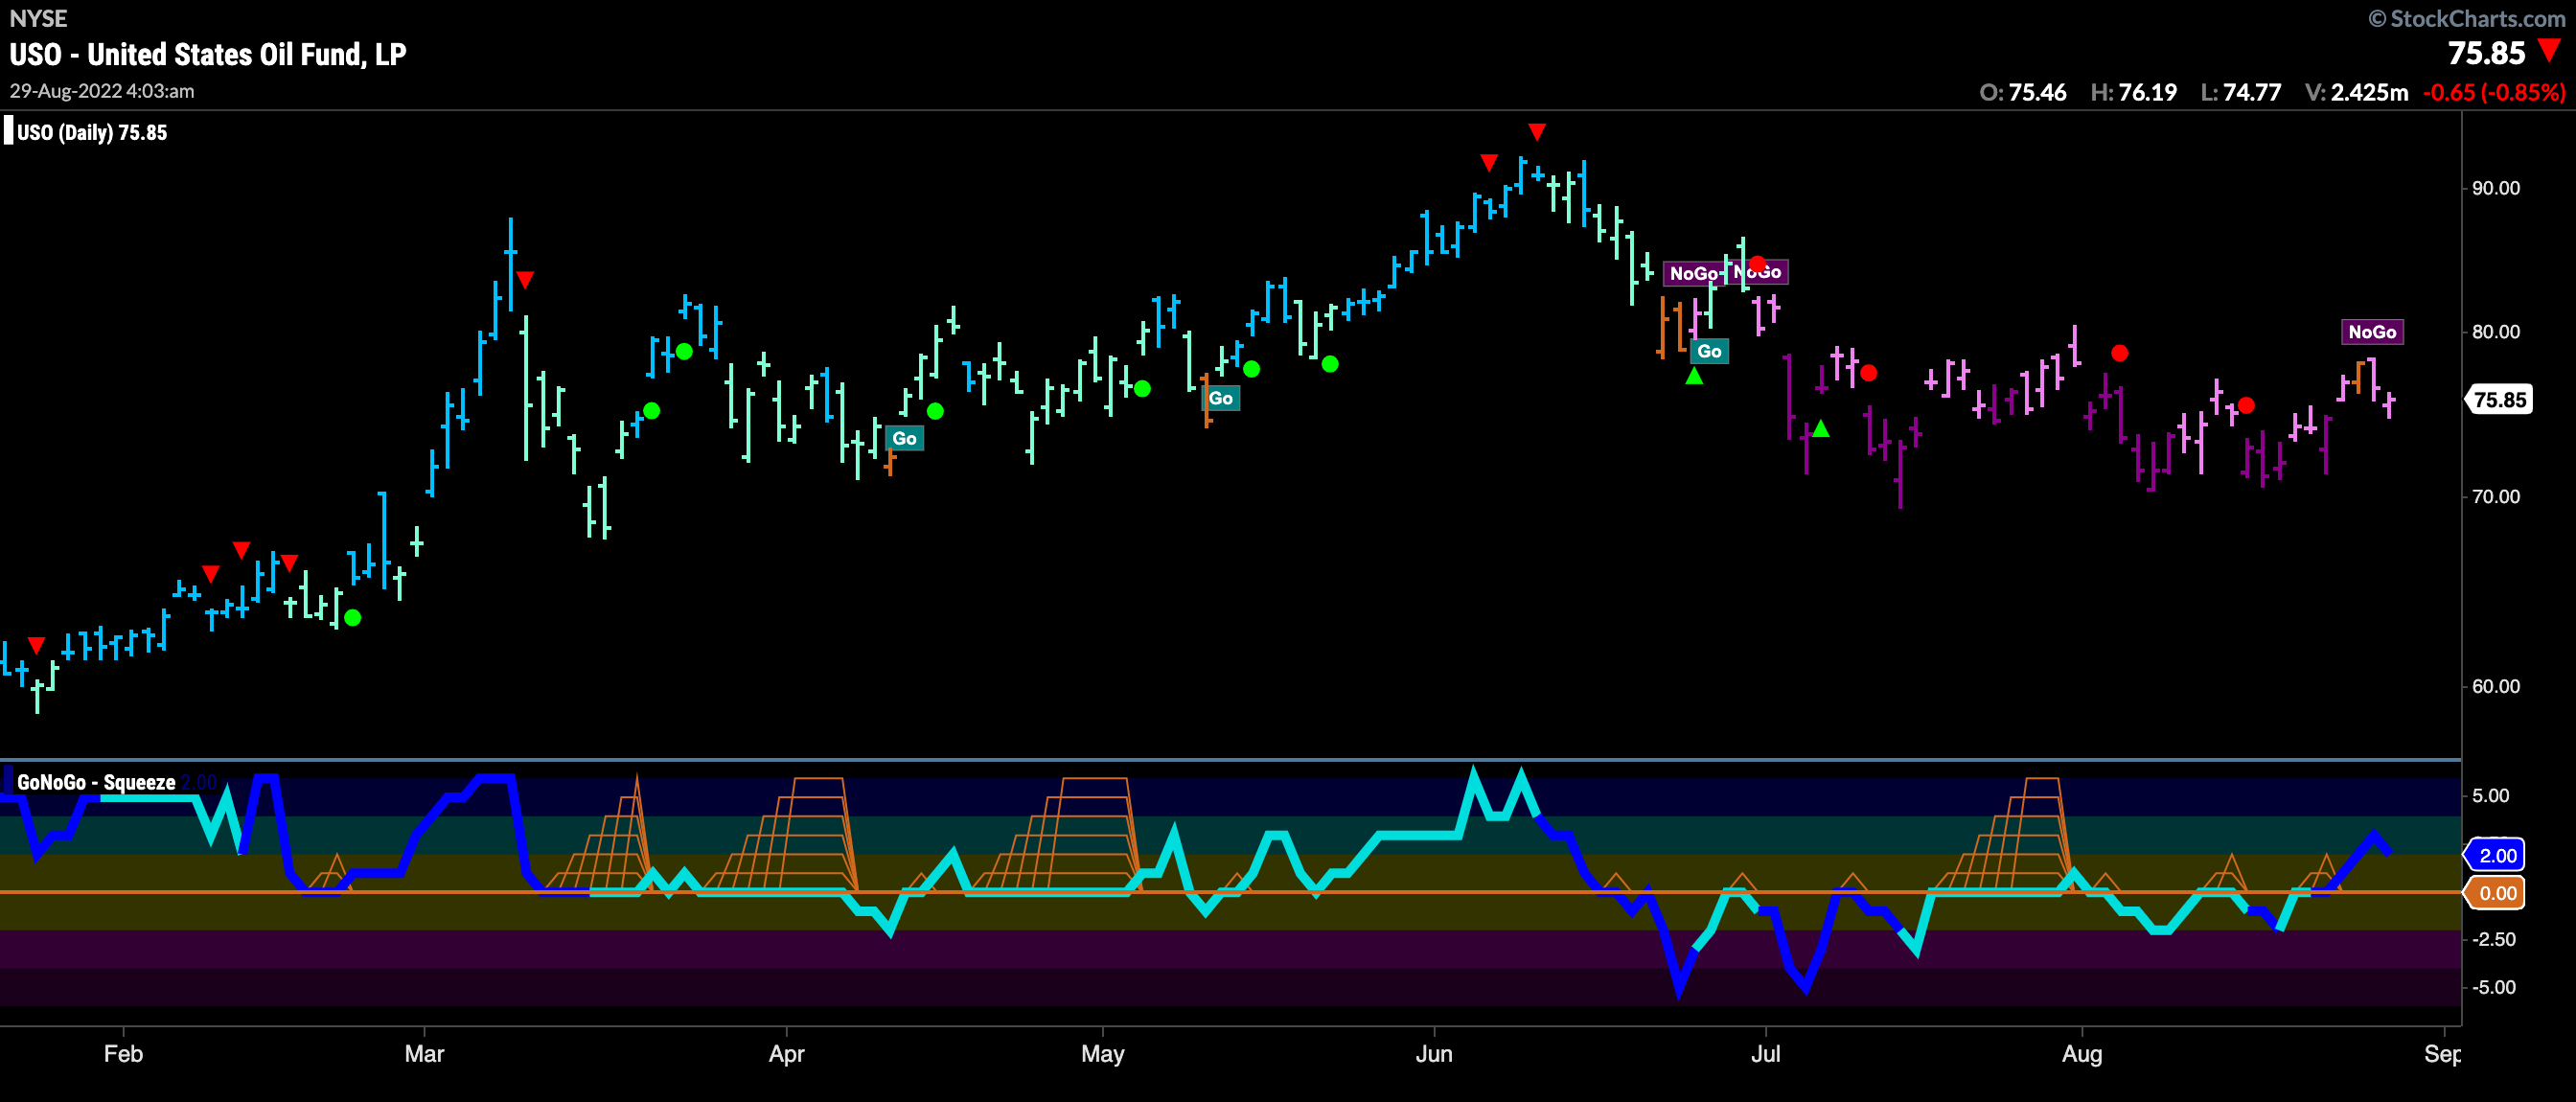
Below is the daily GoNoGo Chart of $USO. We can see that the “NoGo” remains in place although price has moved mostly sideways since entering the “NoGo”. GoNoGo Oscillator has broken into positive territory on heavy volume and so we can consider that a threat to the “NoGo”. We will watch to see if this is enough of a momentum push to see price make a new high and potentially a trend change.
Sector RelMap
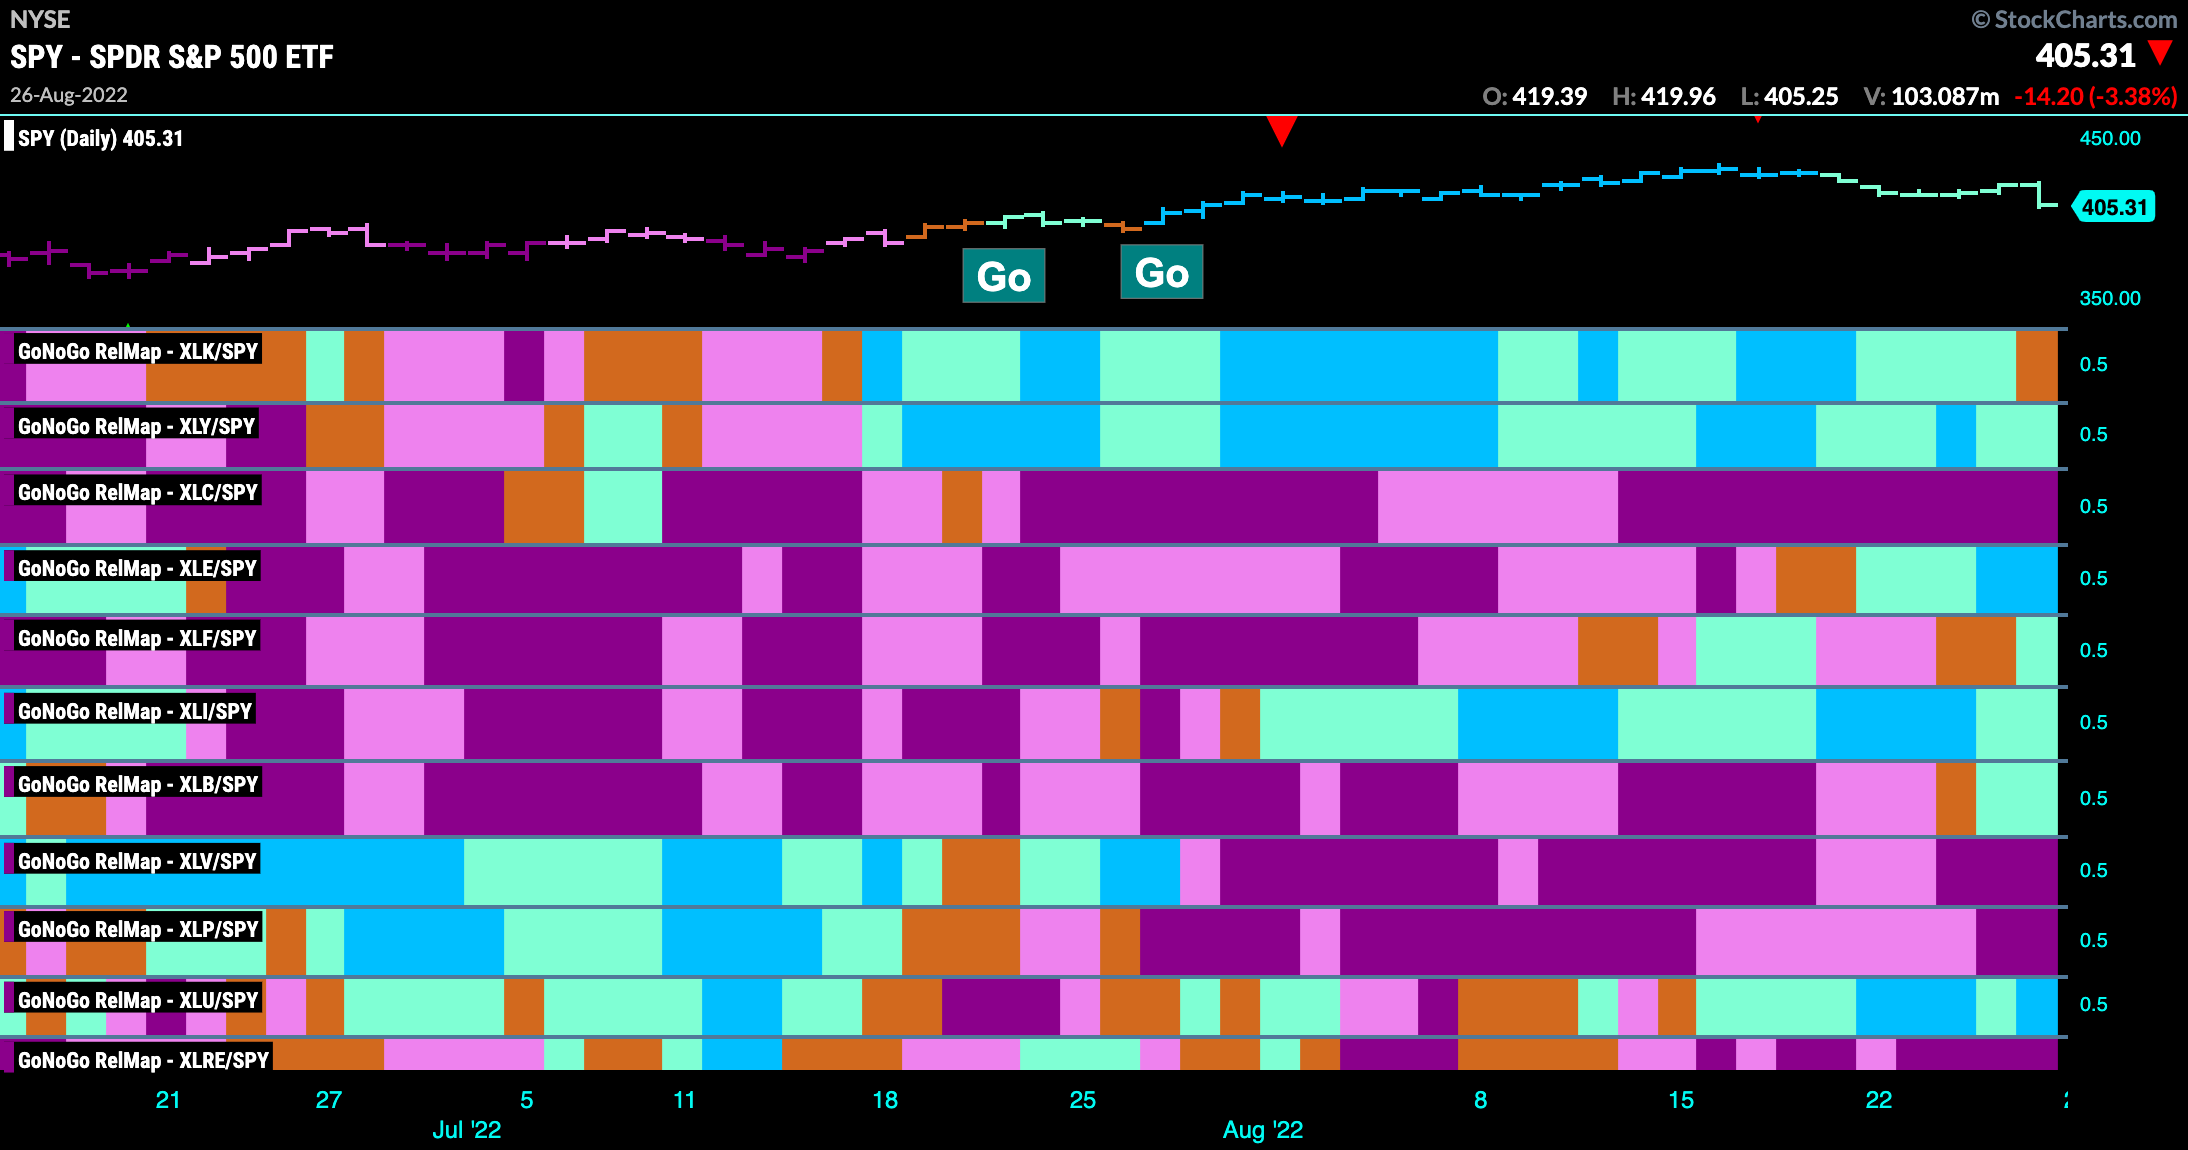
Below is the GoNoGo Sector Relmap. This GoNoGo Relmap applies the GoNoGo Trend to the relative strength ratios of the sectors to the base index. Looking at this map, we can quickly see where the relative outperformance is coming from as well as which sectors are lagging on a relative basis. We see more sectors outperforming the broader market this week. Interesting to see some of the value sectors returning to lead the market. Materials and energy joining industrials, utilities, and discretionary.
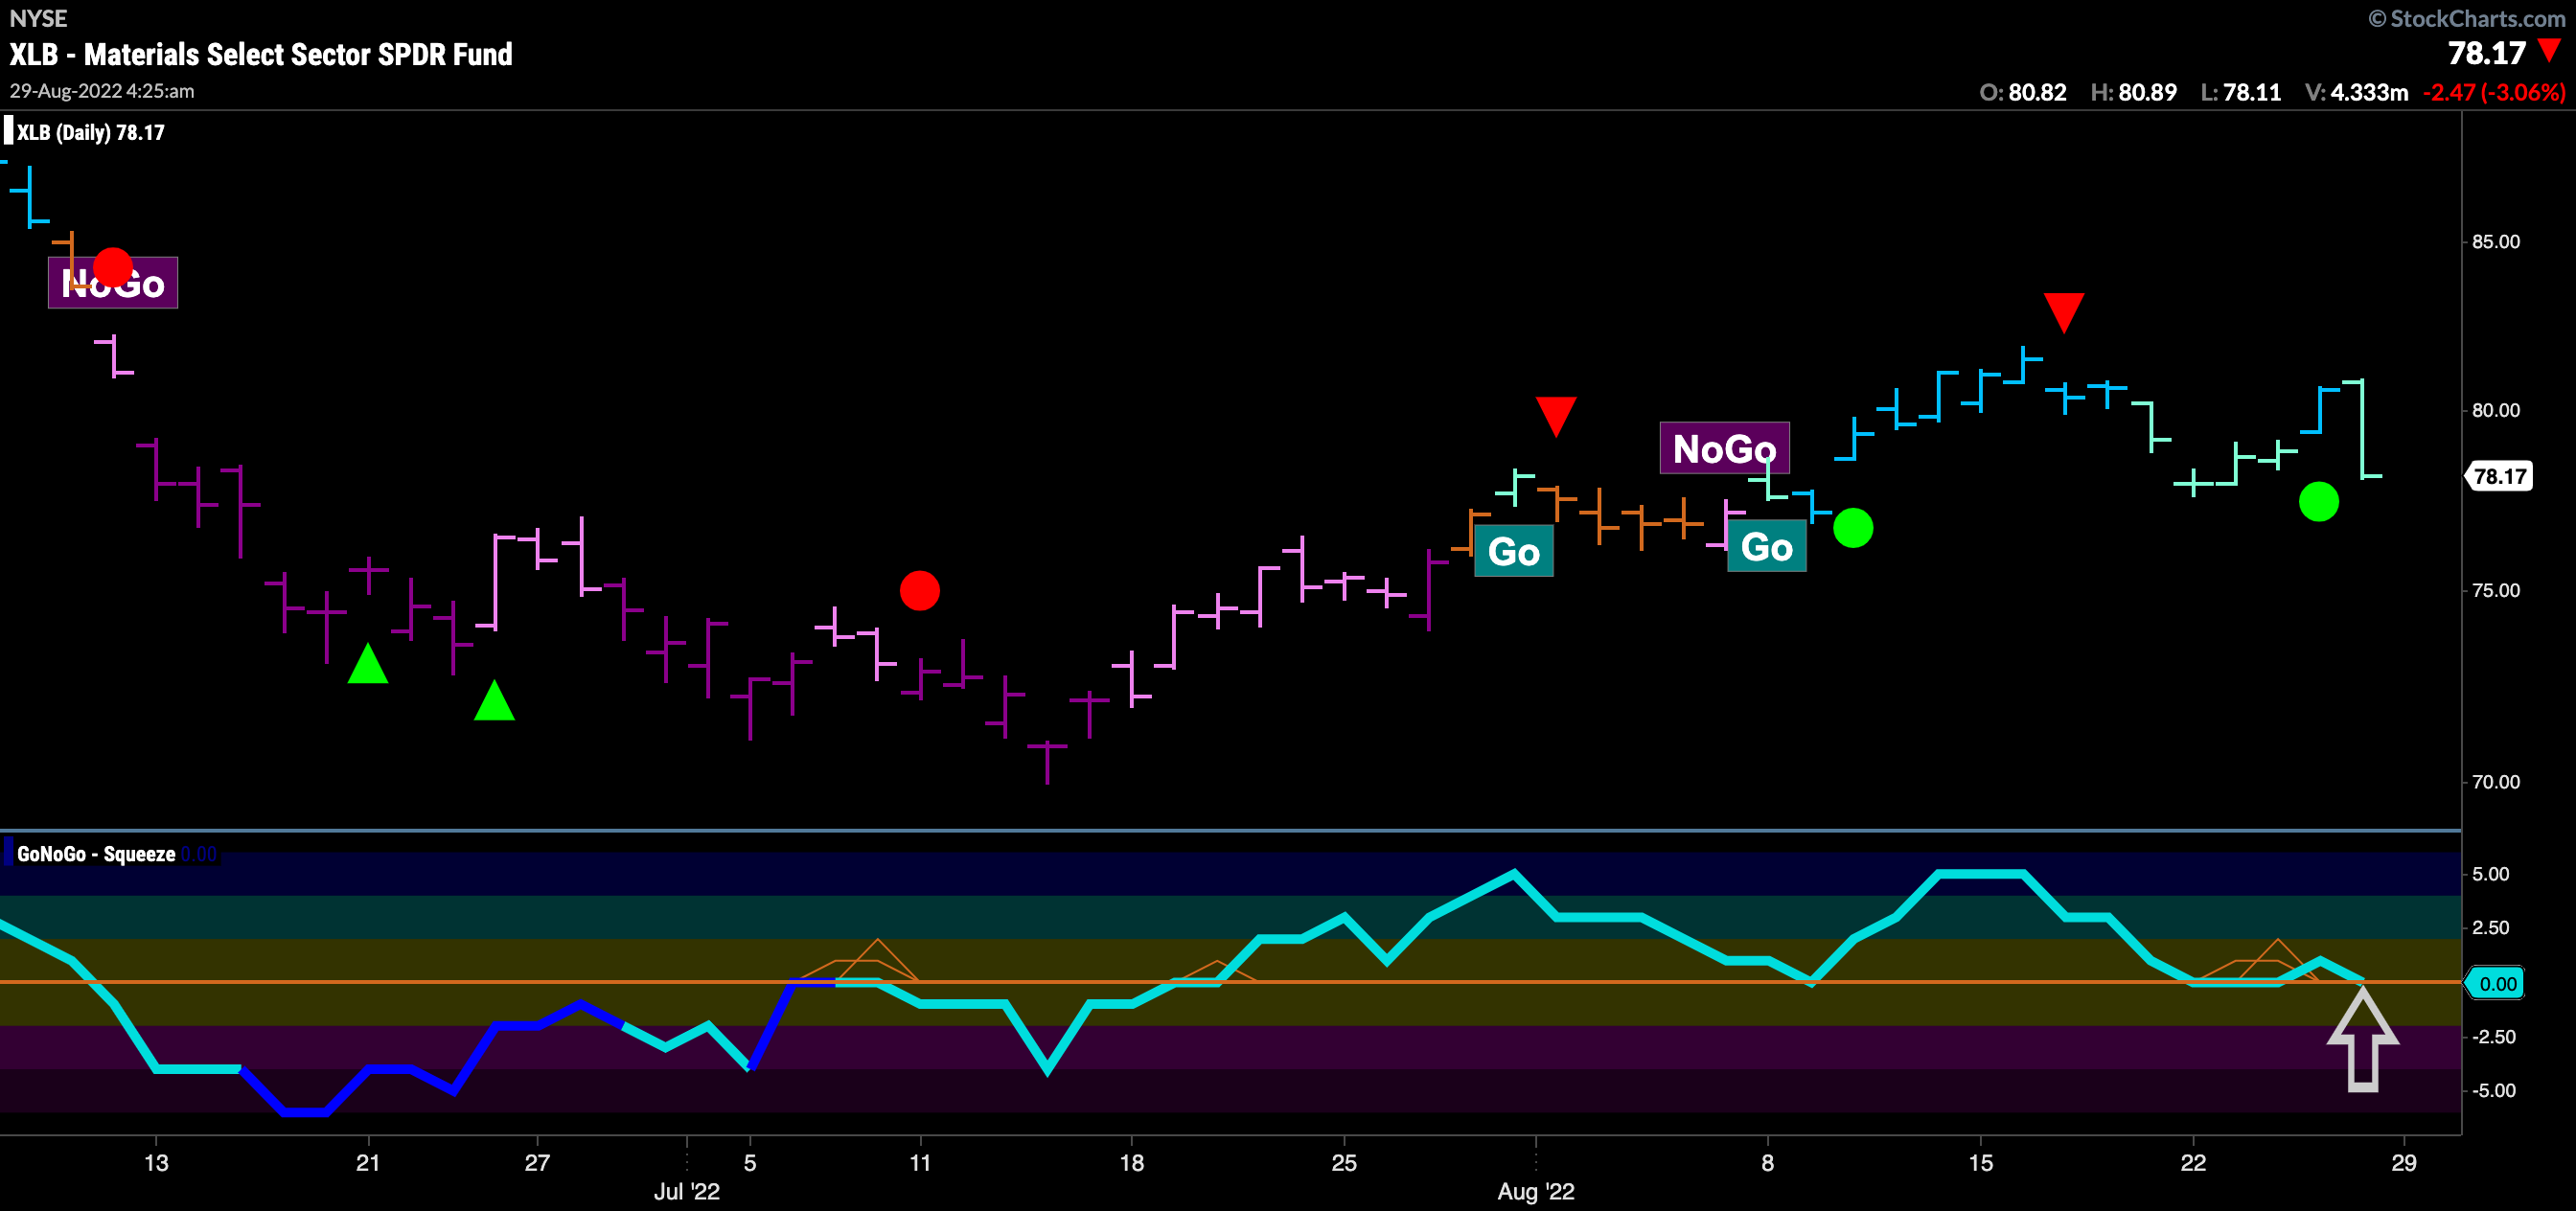
Materials Seeking Support at Zero
As the “Go” trend suffered a hit on Friday the materials sector sees GoNoGo Oscillator at the zero line looking for support. We will look to see if the oscillator can rally back into positive territory which would be a good sign for the “Go” trend that is in place. If the oscillator cannot find support at zero, we may see price move lower still which would be a threat to the “Go” trend.
CF Industries Holdings, Inc in Strong “Go” trend
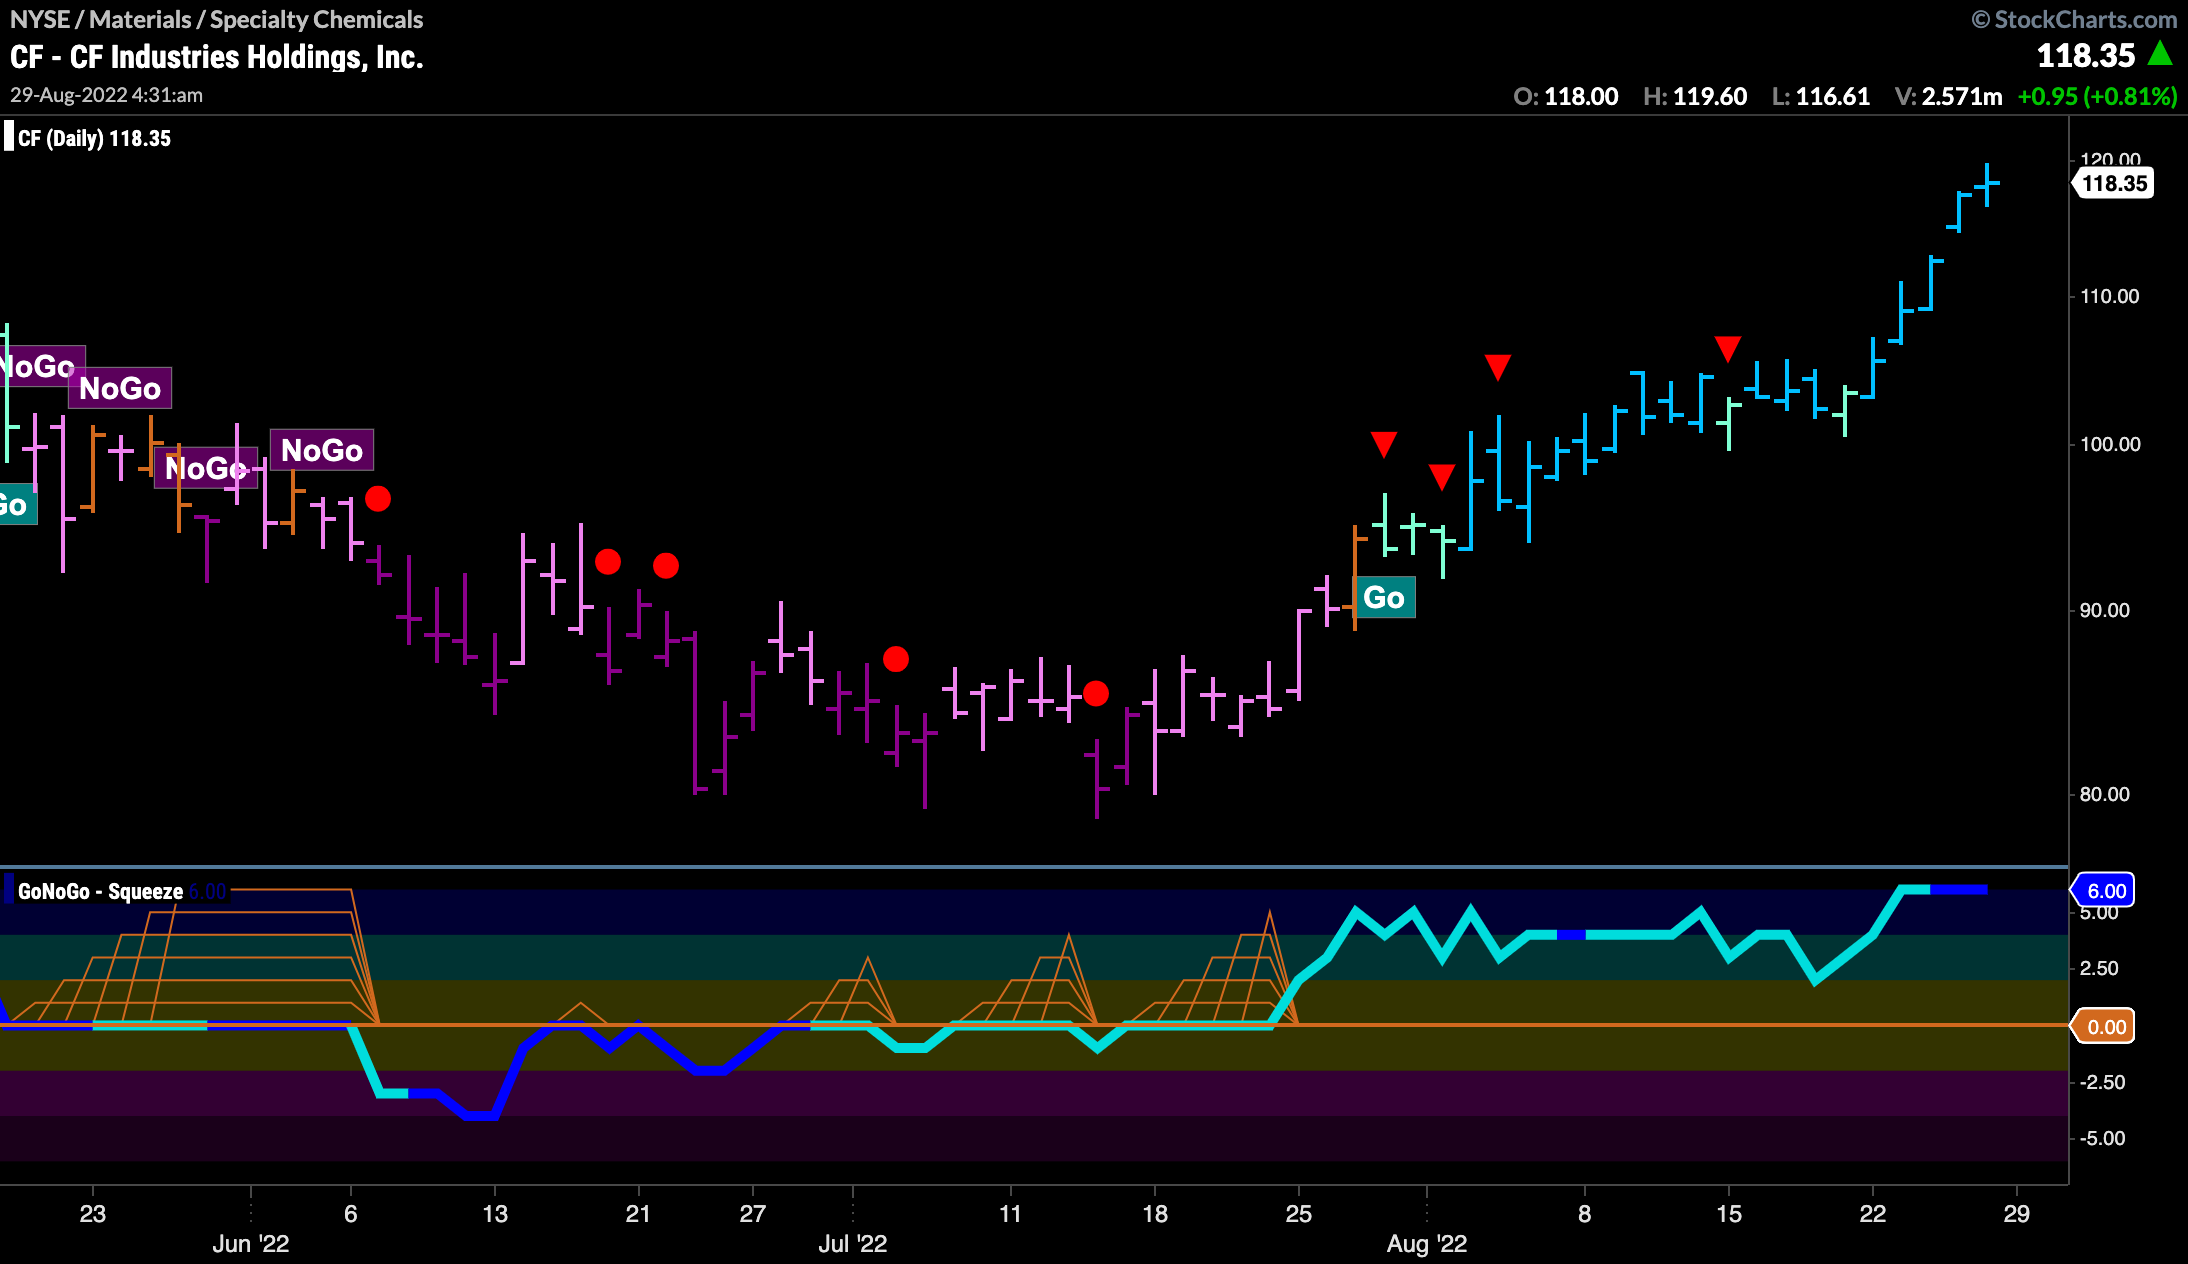
$CF is a materials stock that is perhaps well positioned to thrive if the outperformance of the sector continues. The weekly chart below shows price making a new high higher high. GoNoGo Trend is painting strong blue “Go” bars. GoNoGo Oscillator has broken back through the zero line and has soared into positive territory. This “Go” trend has been in place since late 2020 and shows no signs of stopping.
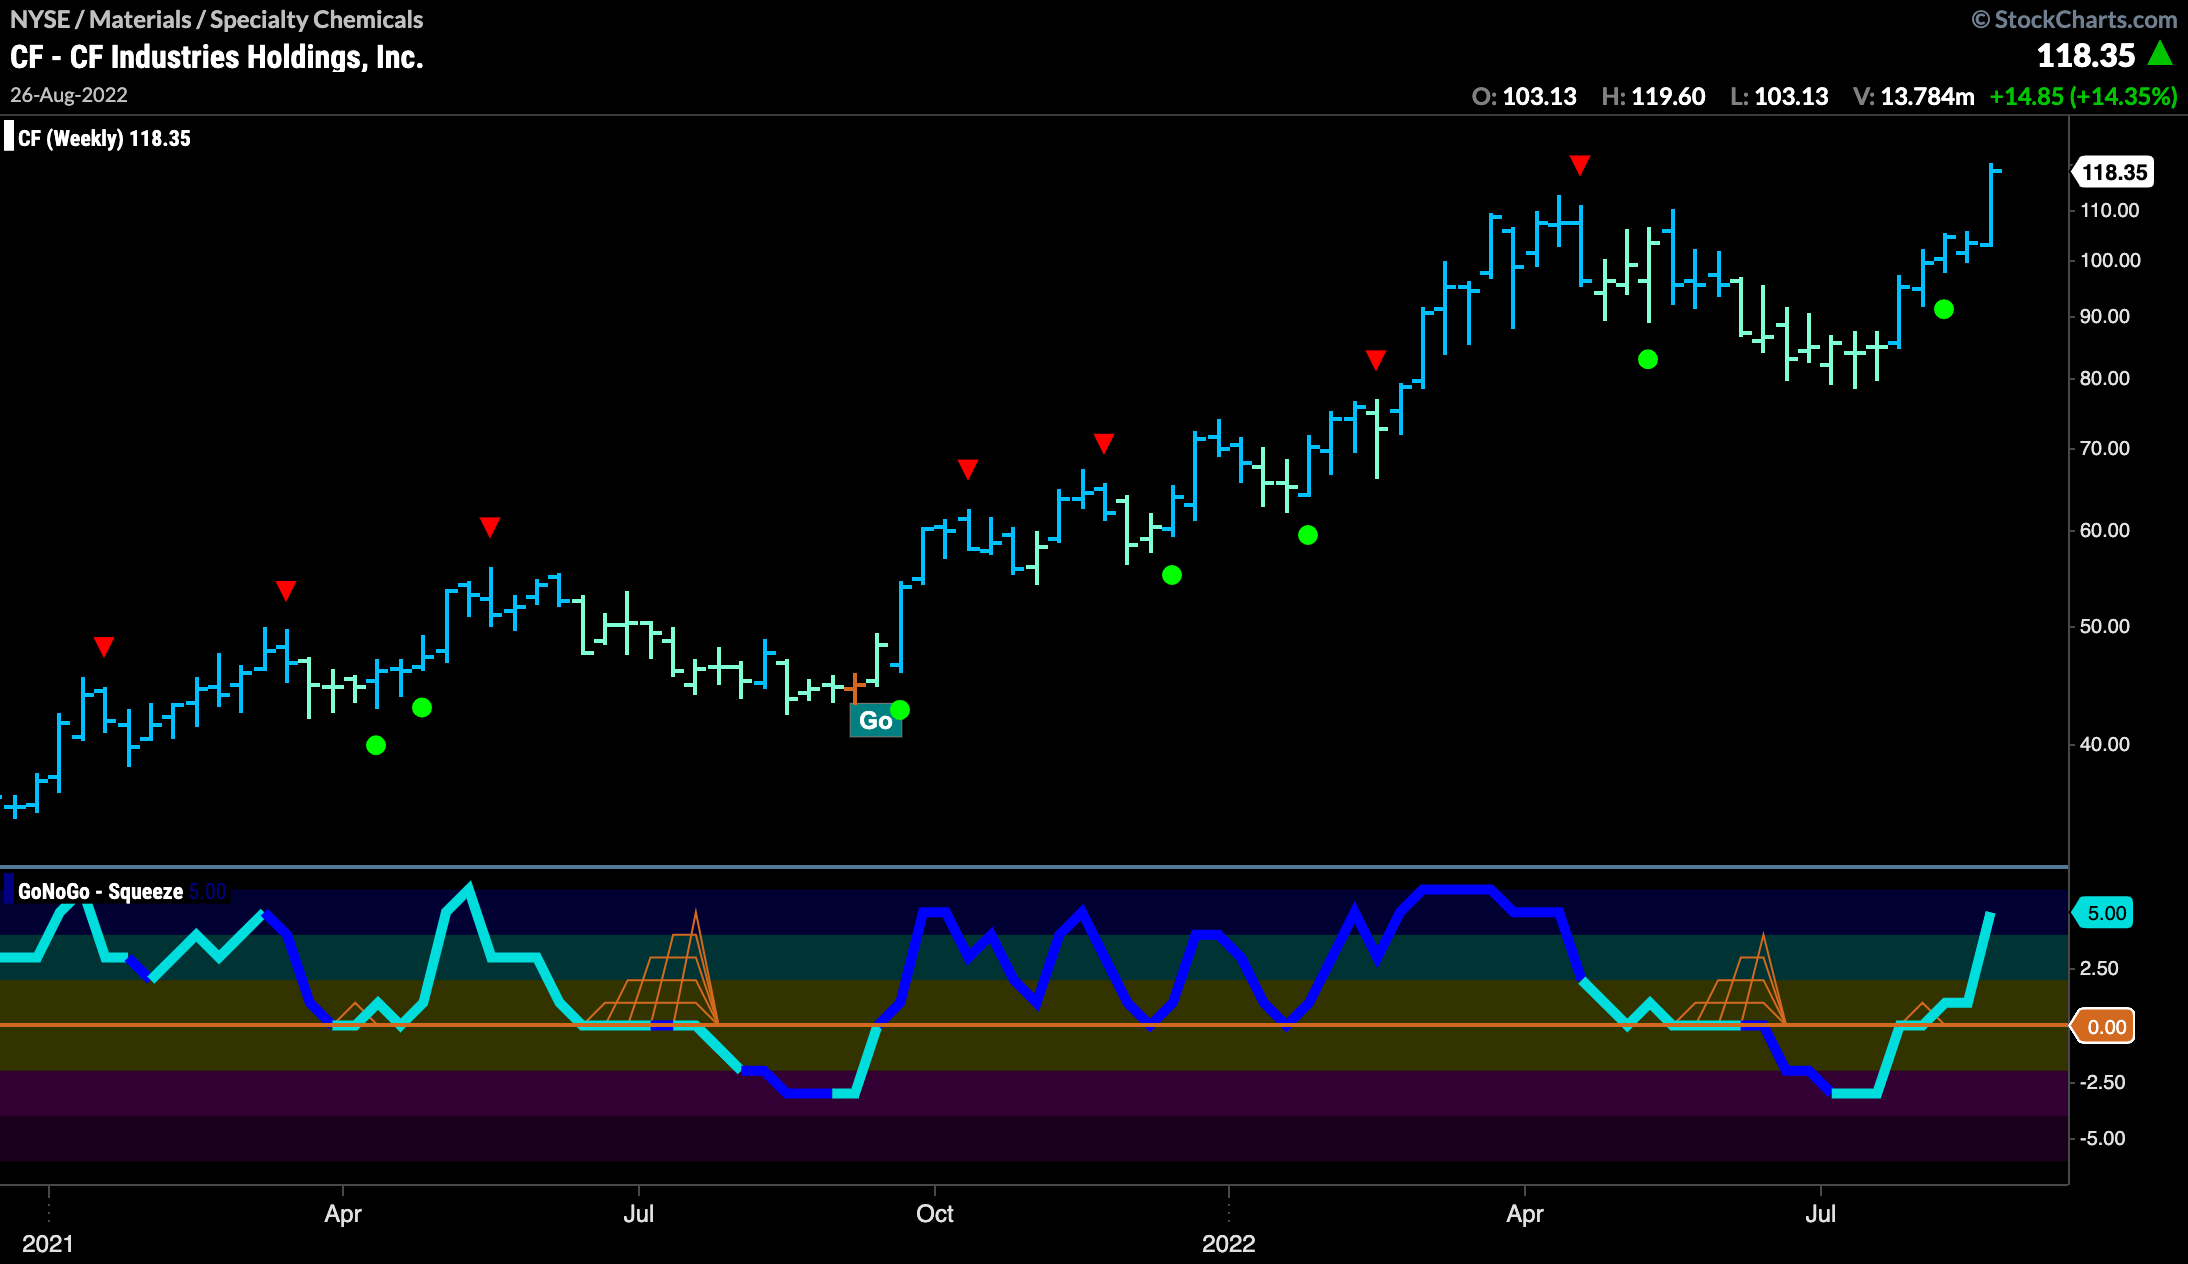
If the larger time frame shows a strong trend then we can look for opportunities on a smaller time frame to participate in that trend. The last “Go” signal on the daily chart below at the end of July has been followed by strong “Go’ bars as price has raced higher. We could look for pullbacks in this trend and even step down in timeframe again to find entry points. On the daily chart, GoNoGo Oscillator is overbought. When it comes out of overbought territory we will look for support at the zero line.
