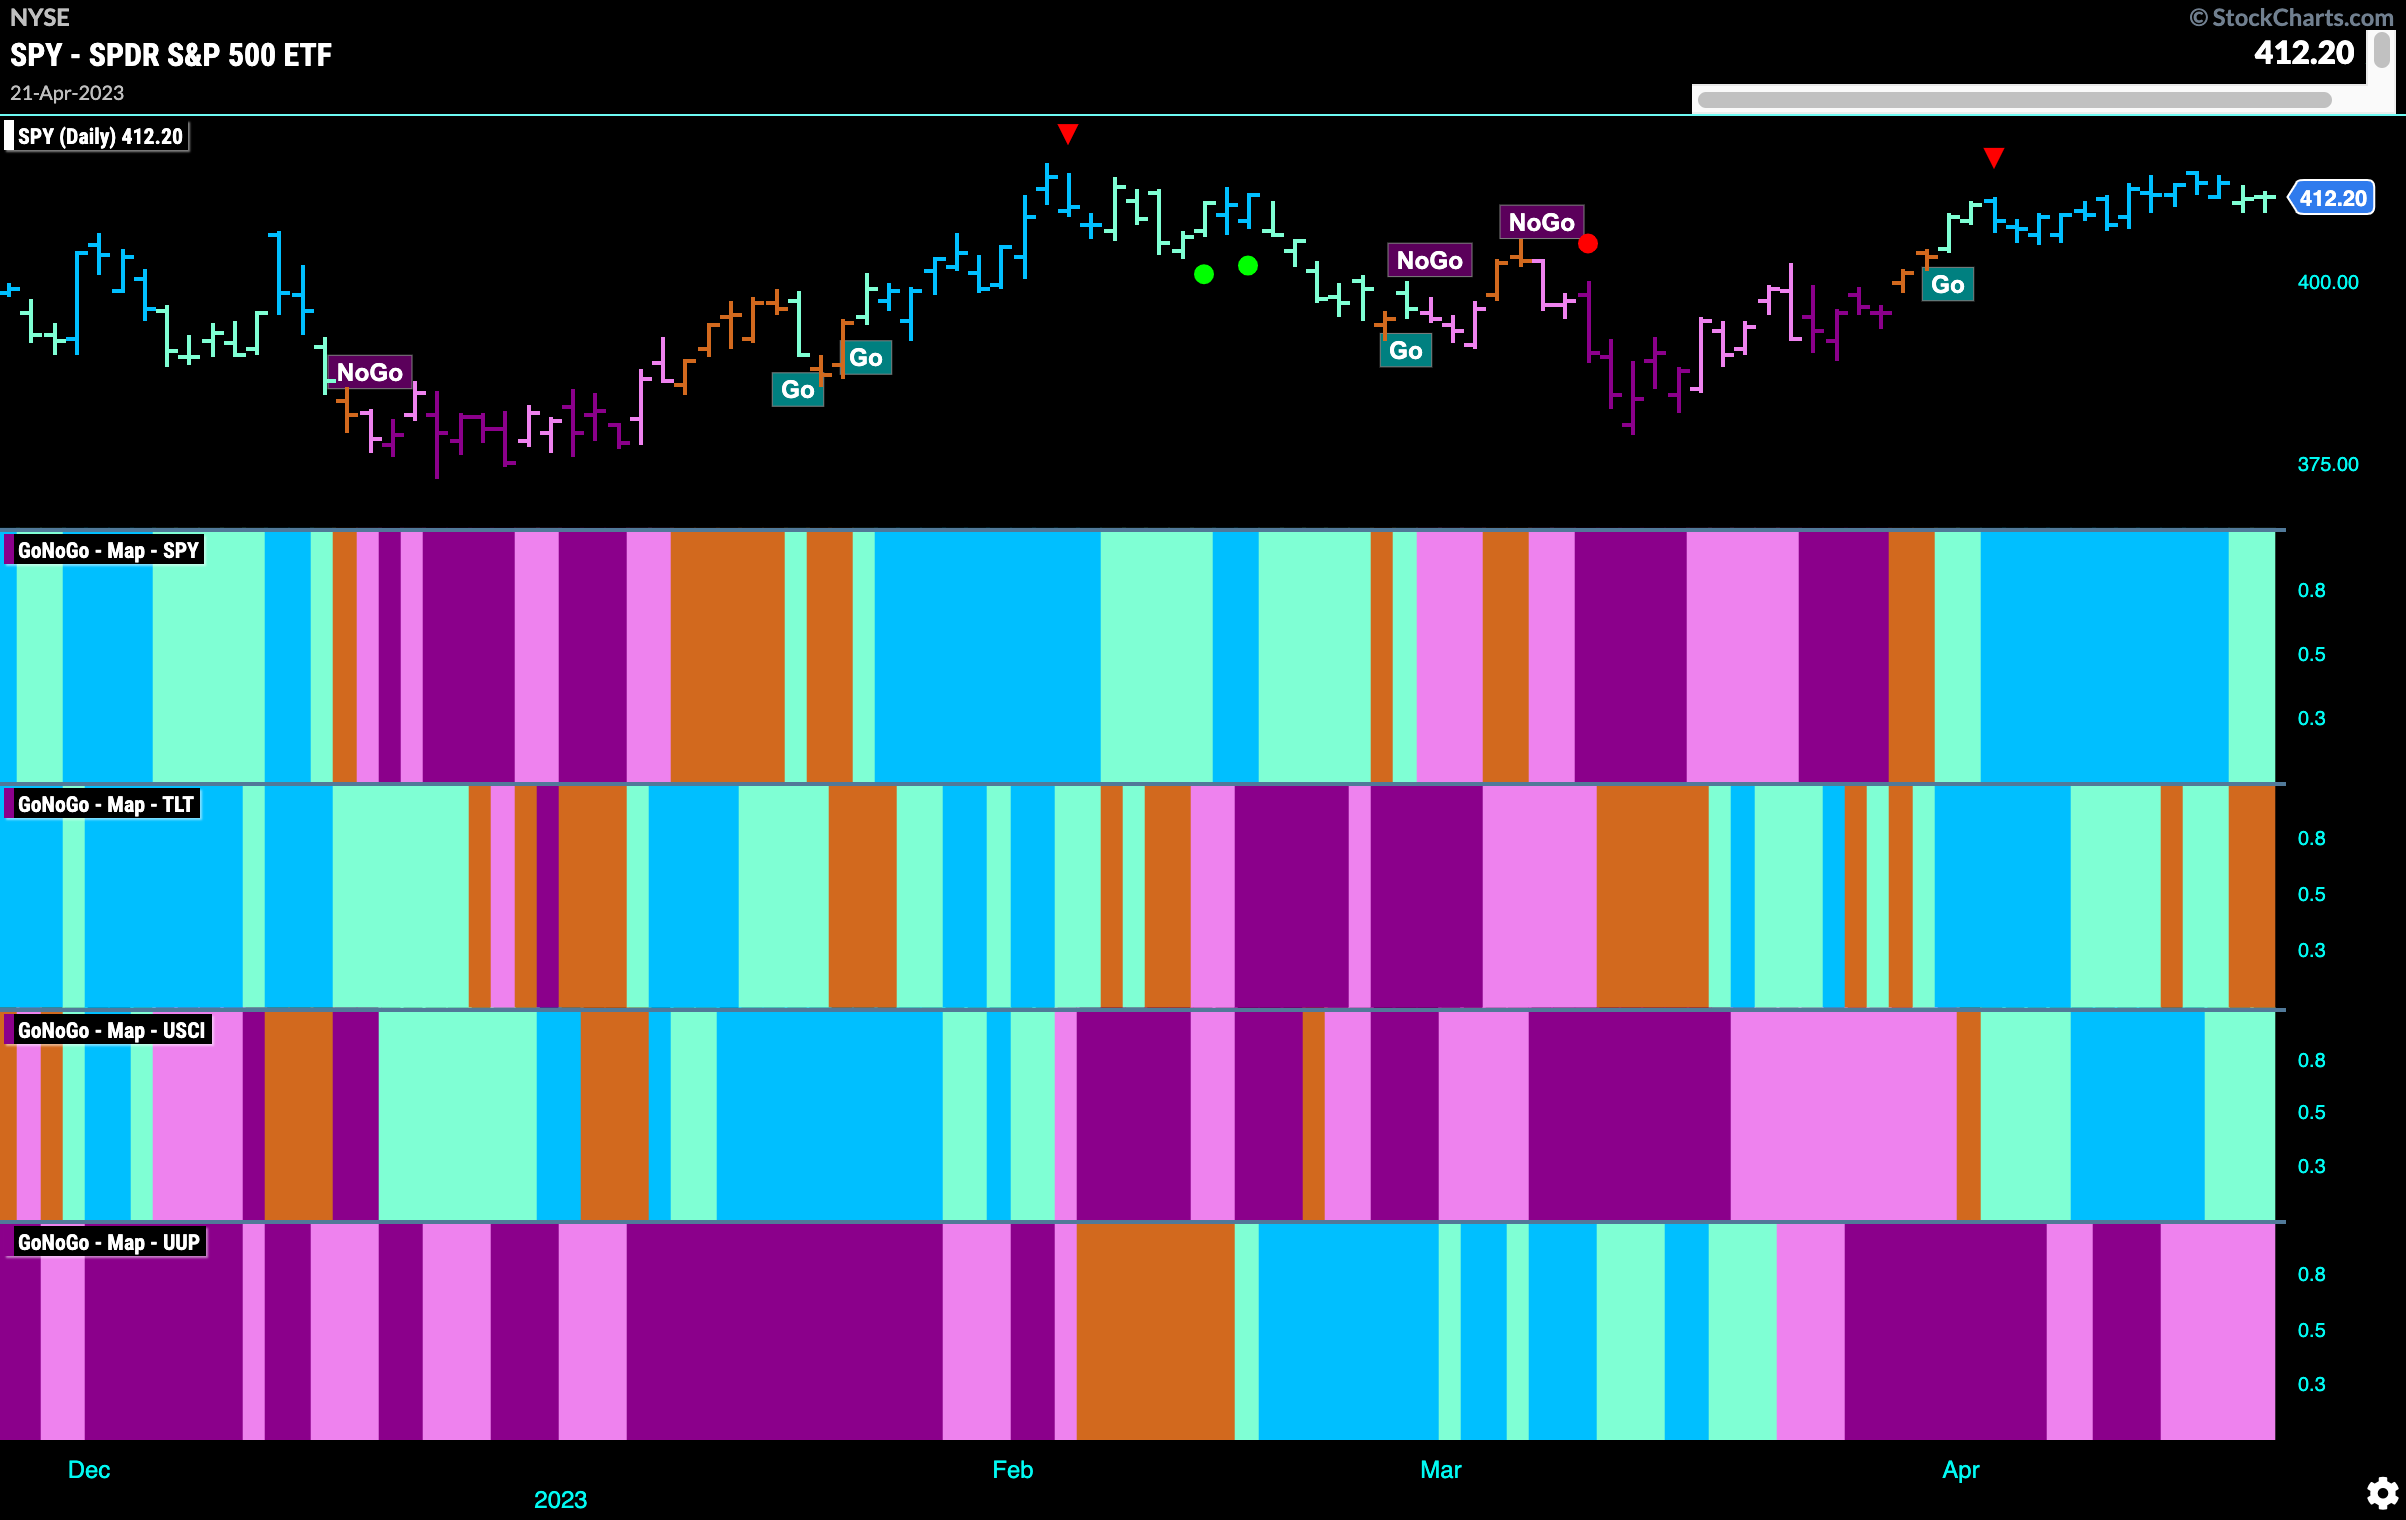
Good morning and welcome to this week’s Flight Path. Let’s take a look at the GoNoGo Asset map below. The trend remains in place for U.S. equities this week although we do see some weaker aqua “Go” bars as price fell off toward the latter part of the week. Treasury bond prices felt some uncertainty this week painting amber “Go Fish” bars and commodities, like equities, held on to a weaker “Go” trend. The dollar, although experiencing somewhat elevated prices this week, remained in pink “NoGo” bars.
Equities Fail at Prior High
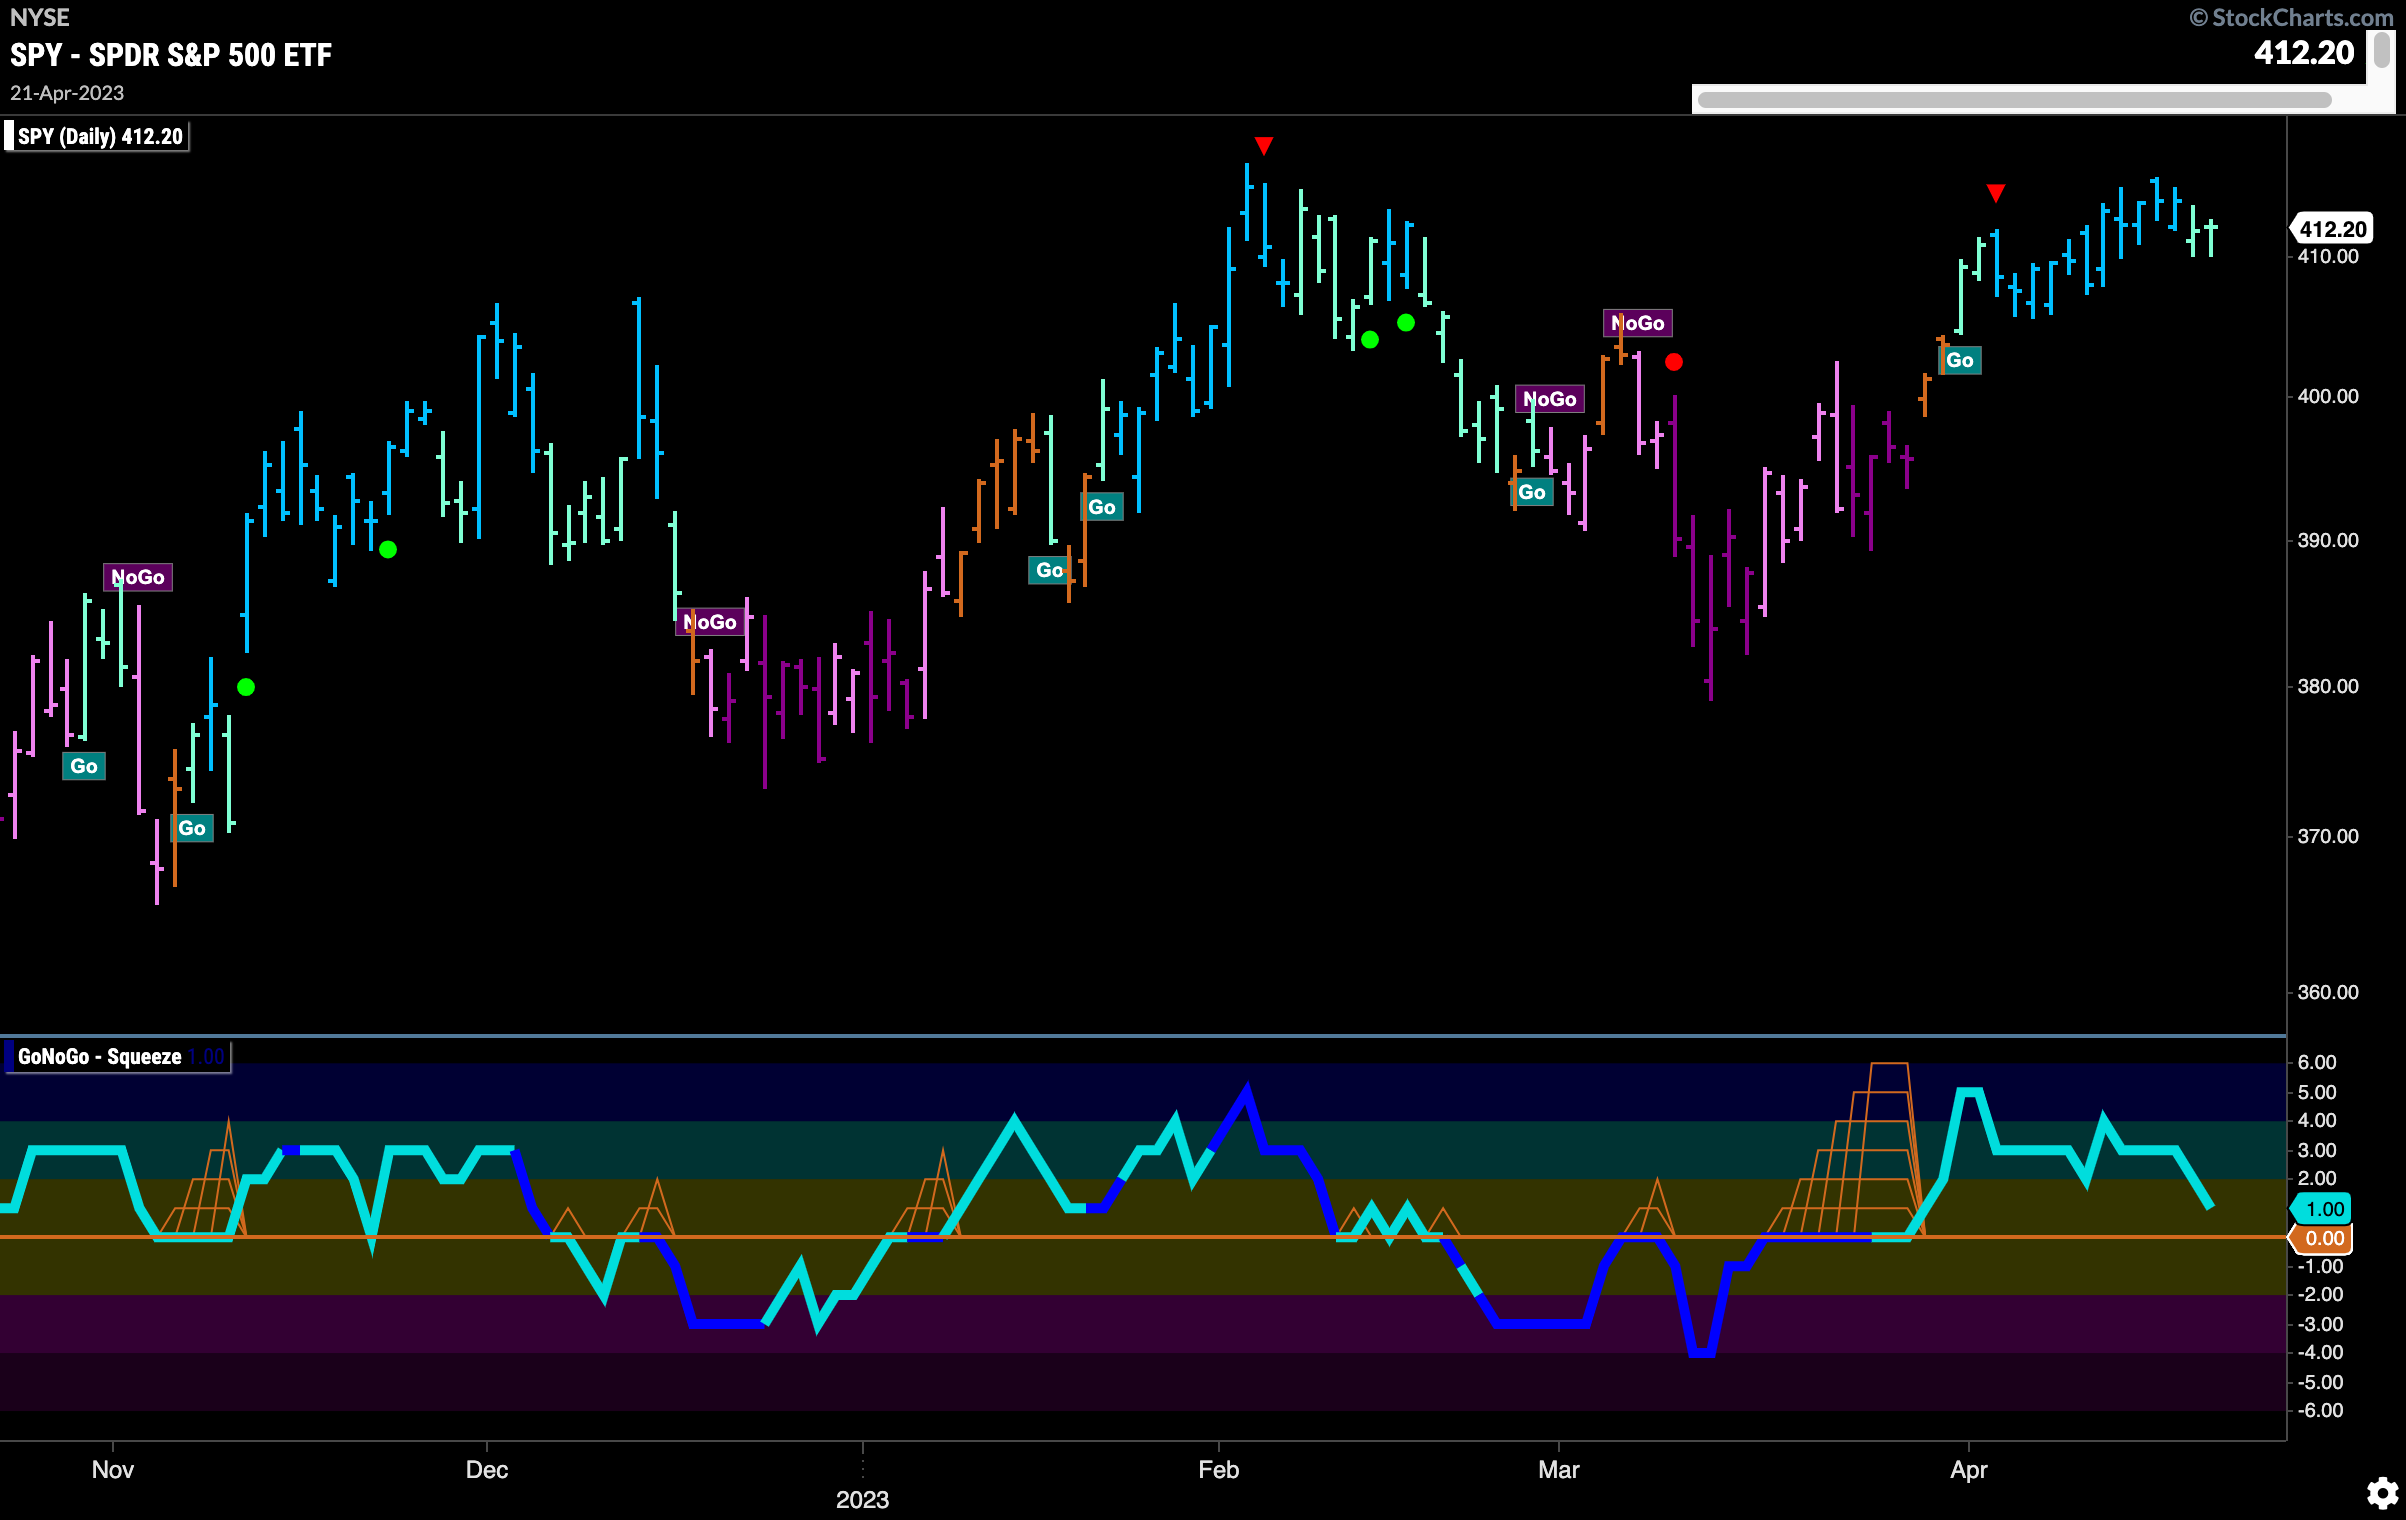
Last week we mentioned that price was approaching its February high. This week we saw resistance at that level and price fell away, ending the week painting weaker aqua “Go” bars. GoNoGo Oscillator is falling toward the zero line and we will watch closely. If this “Go” trend is to continue and potentially make new highs we will need to see the oscillator find support at this level.
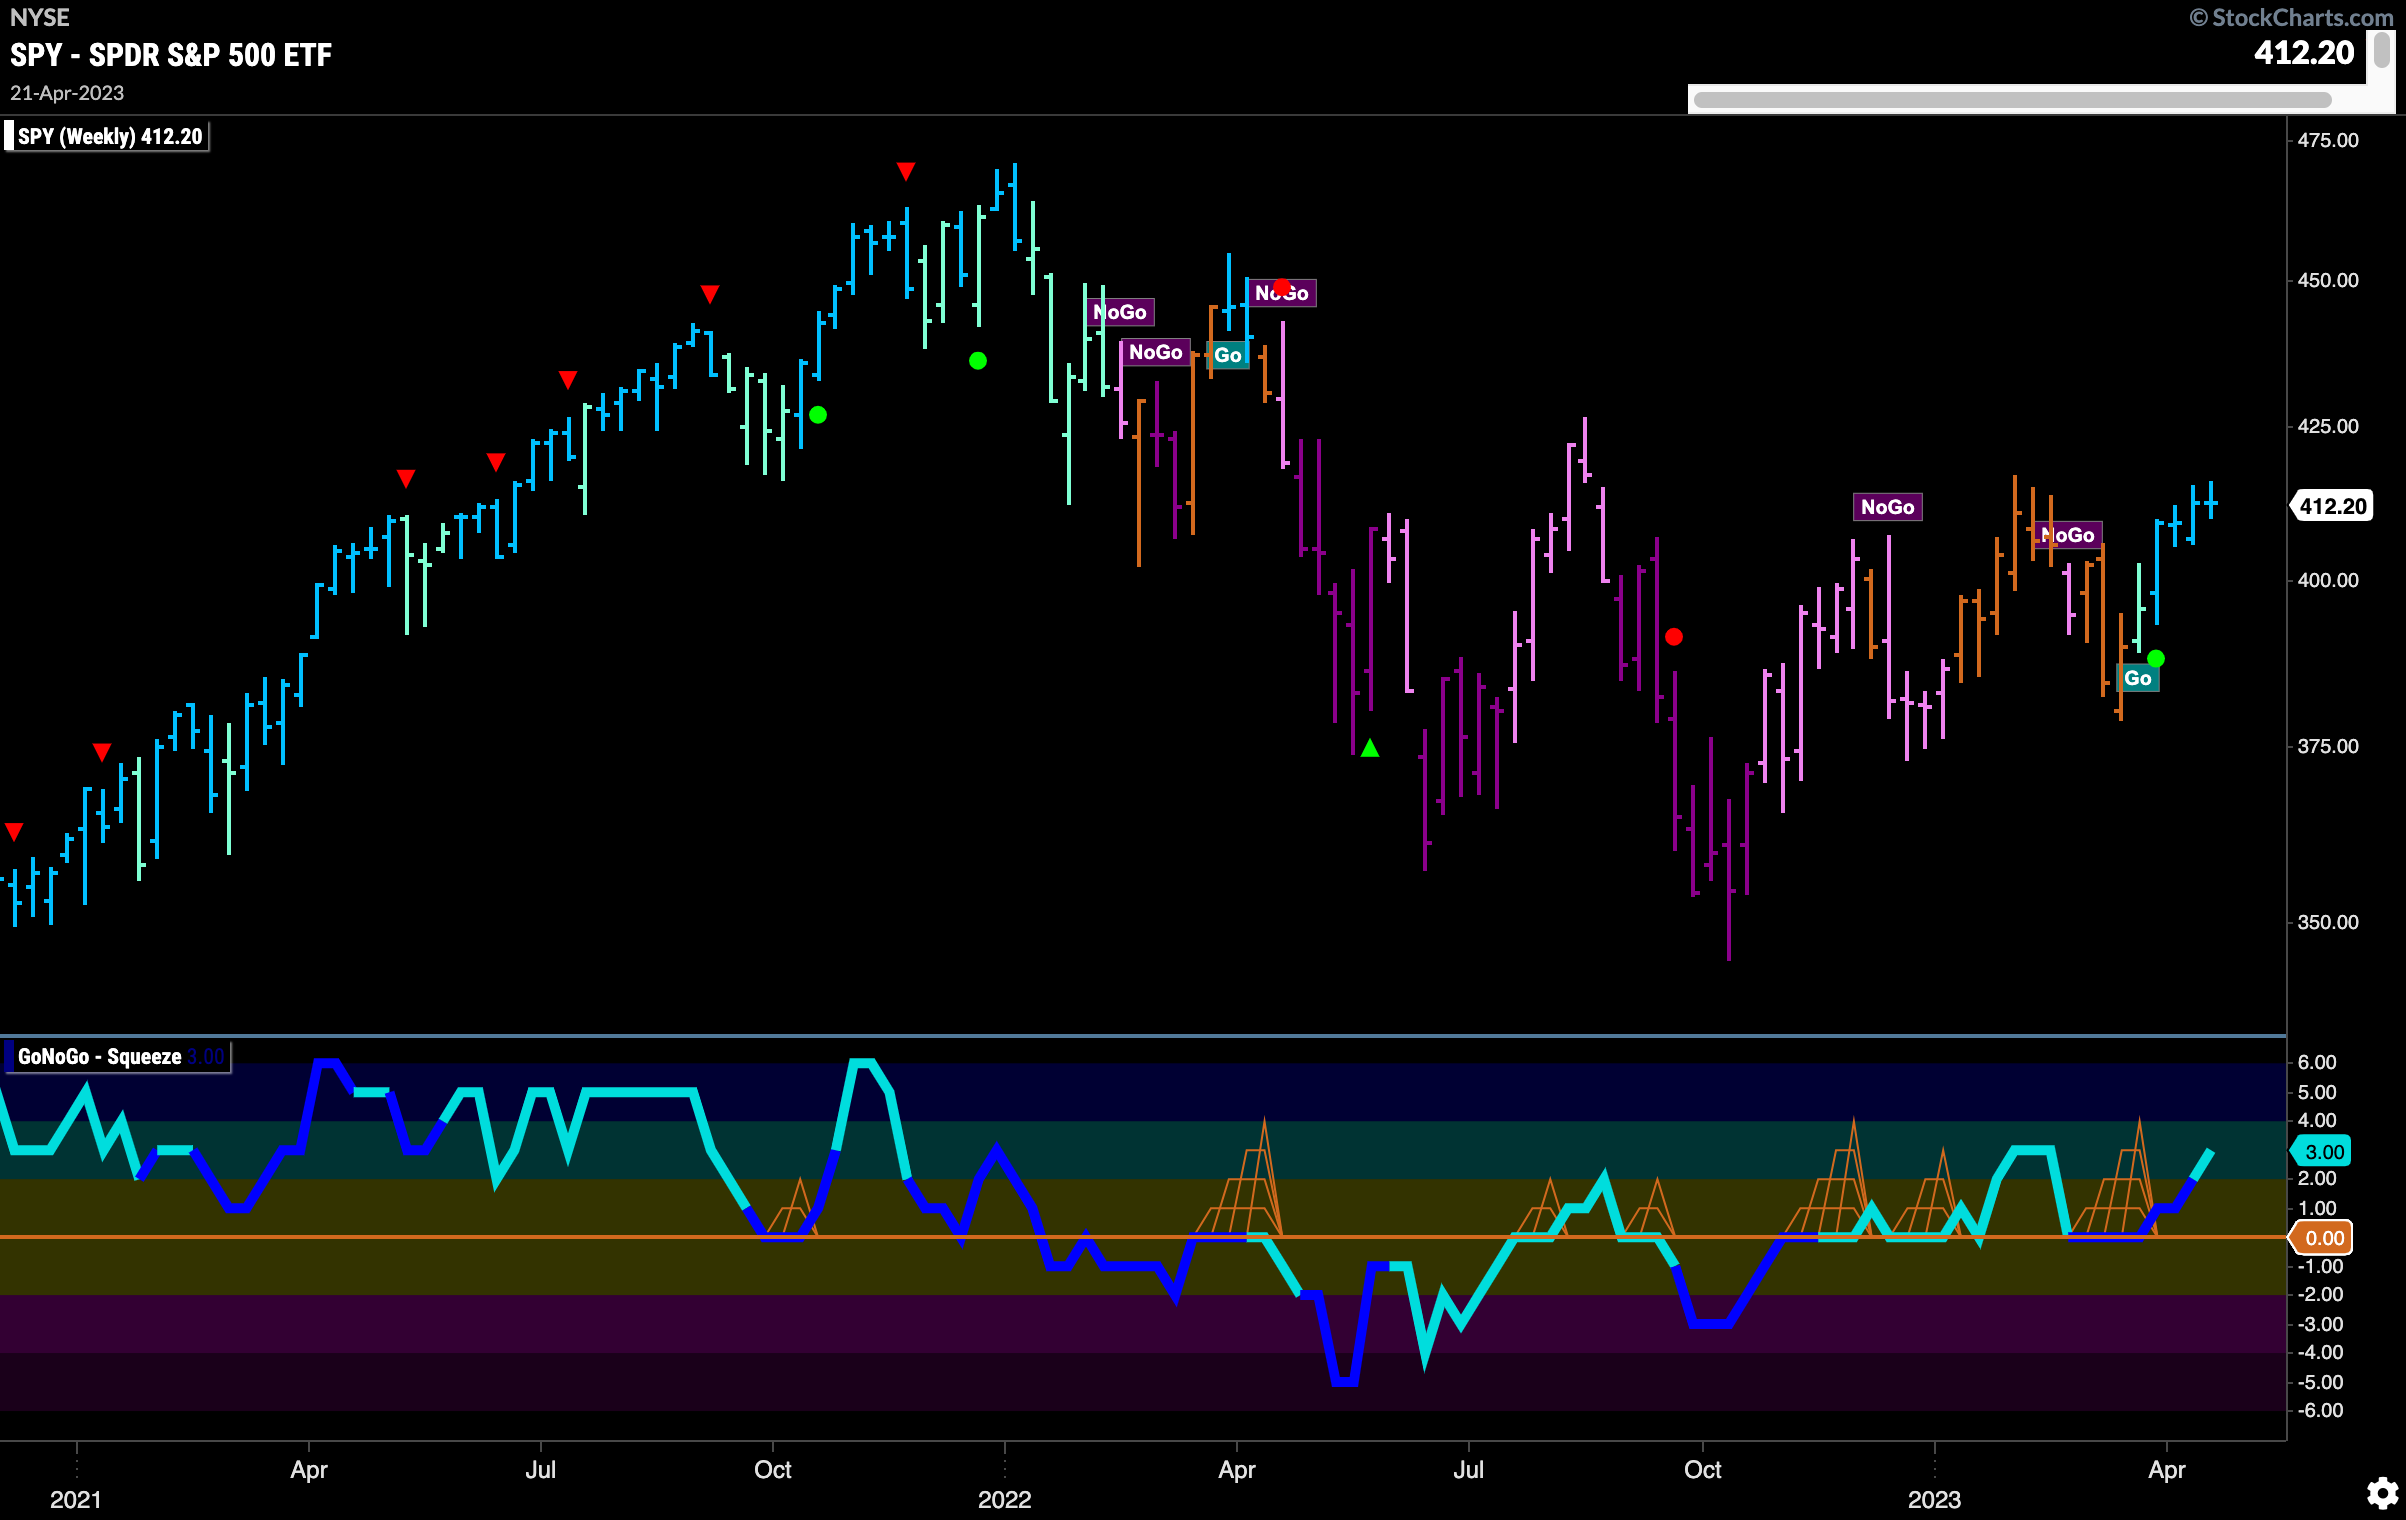
The longer term weekly chart gives us hope that we will see that support on the daily chart. Although last week’s price action appears to represent a doji (open and close the same, representing uncertainty), there are many positive signs from the below chart. We can see that we are in a strong “Go” trend with the indicator painting bright blue bars. GoNoGo Oscillator is in positive territory but not yet overbought after recently finding support at the zero line.
Treasury Remains in “NoGo” Trend
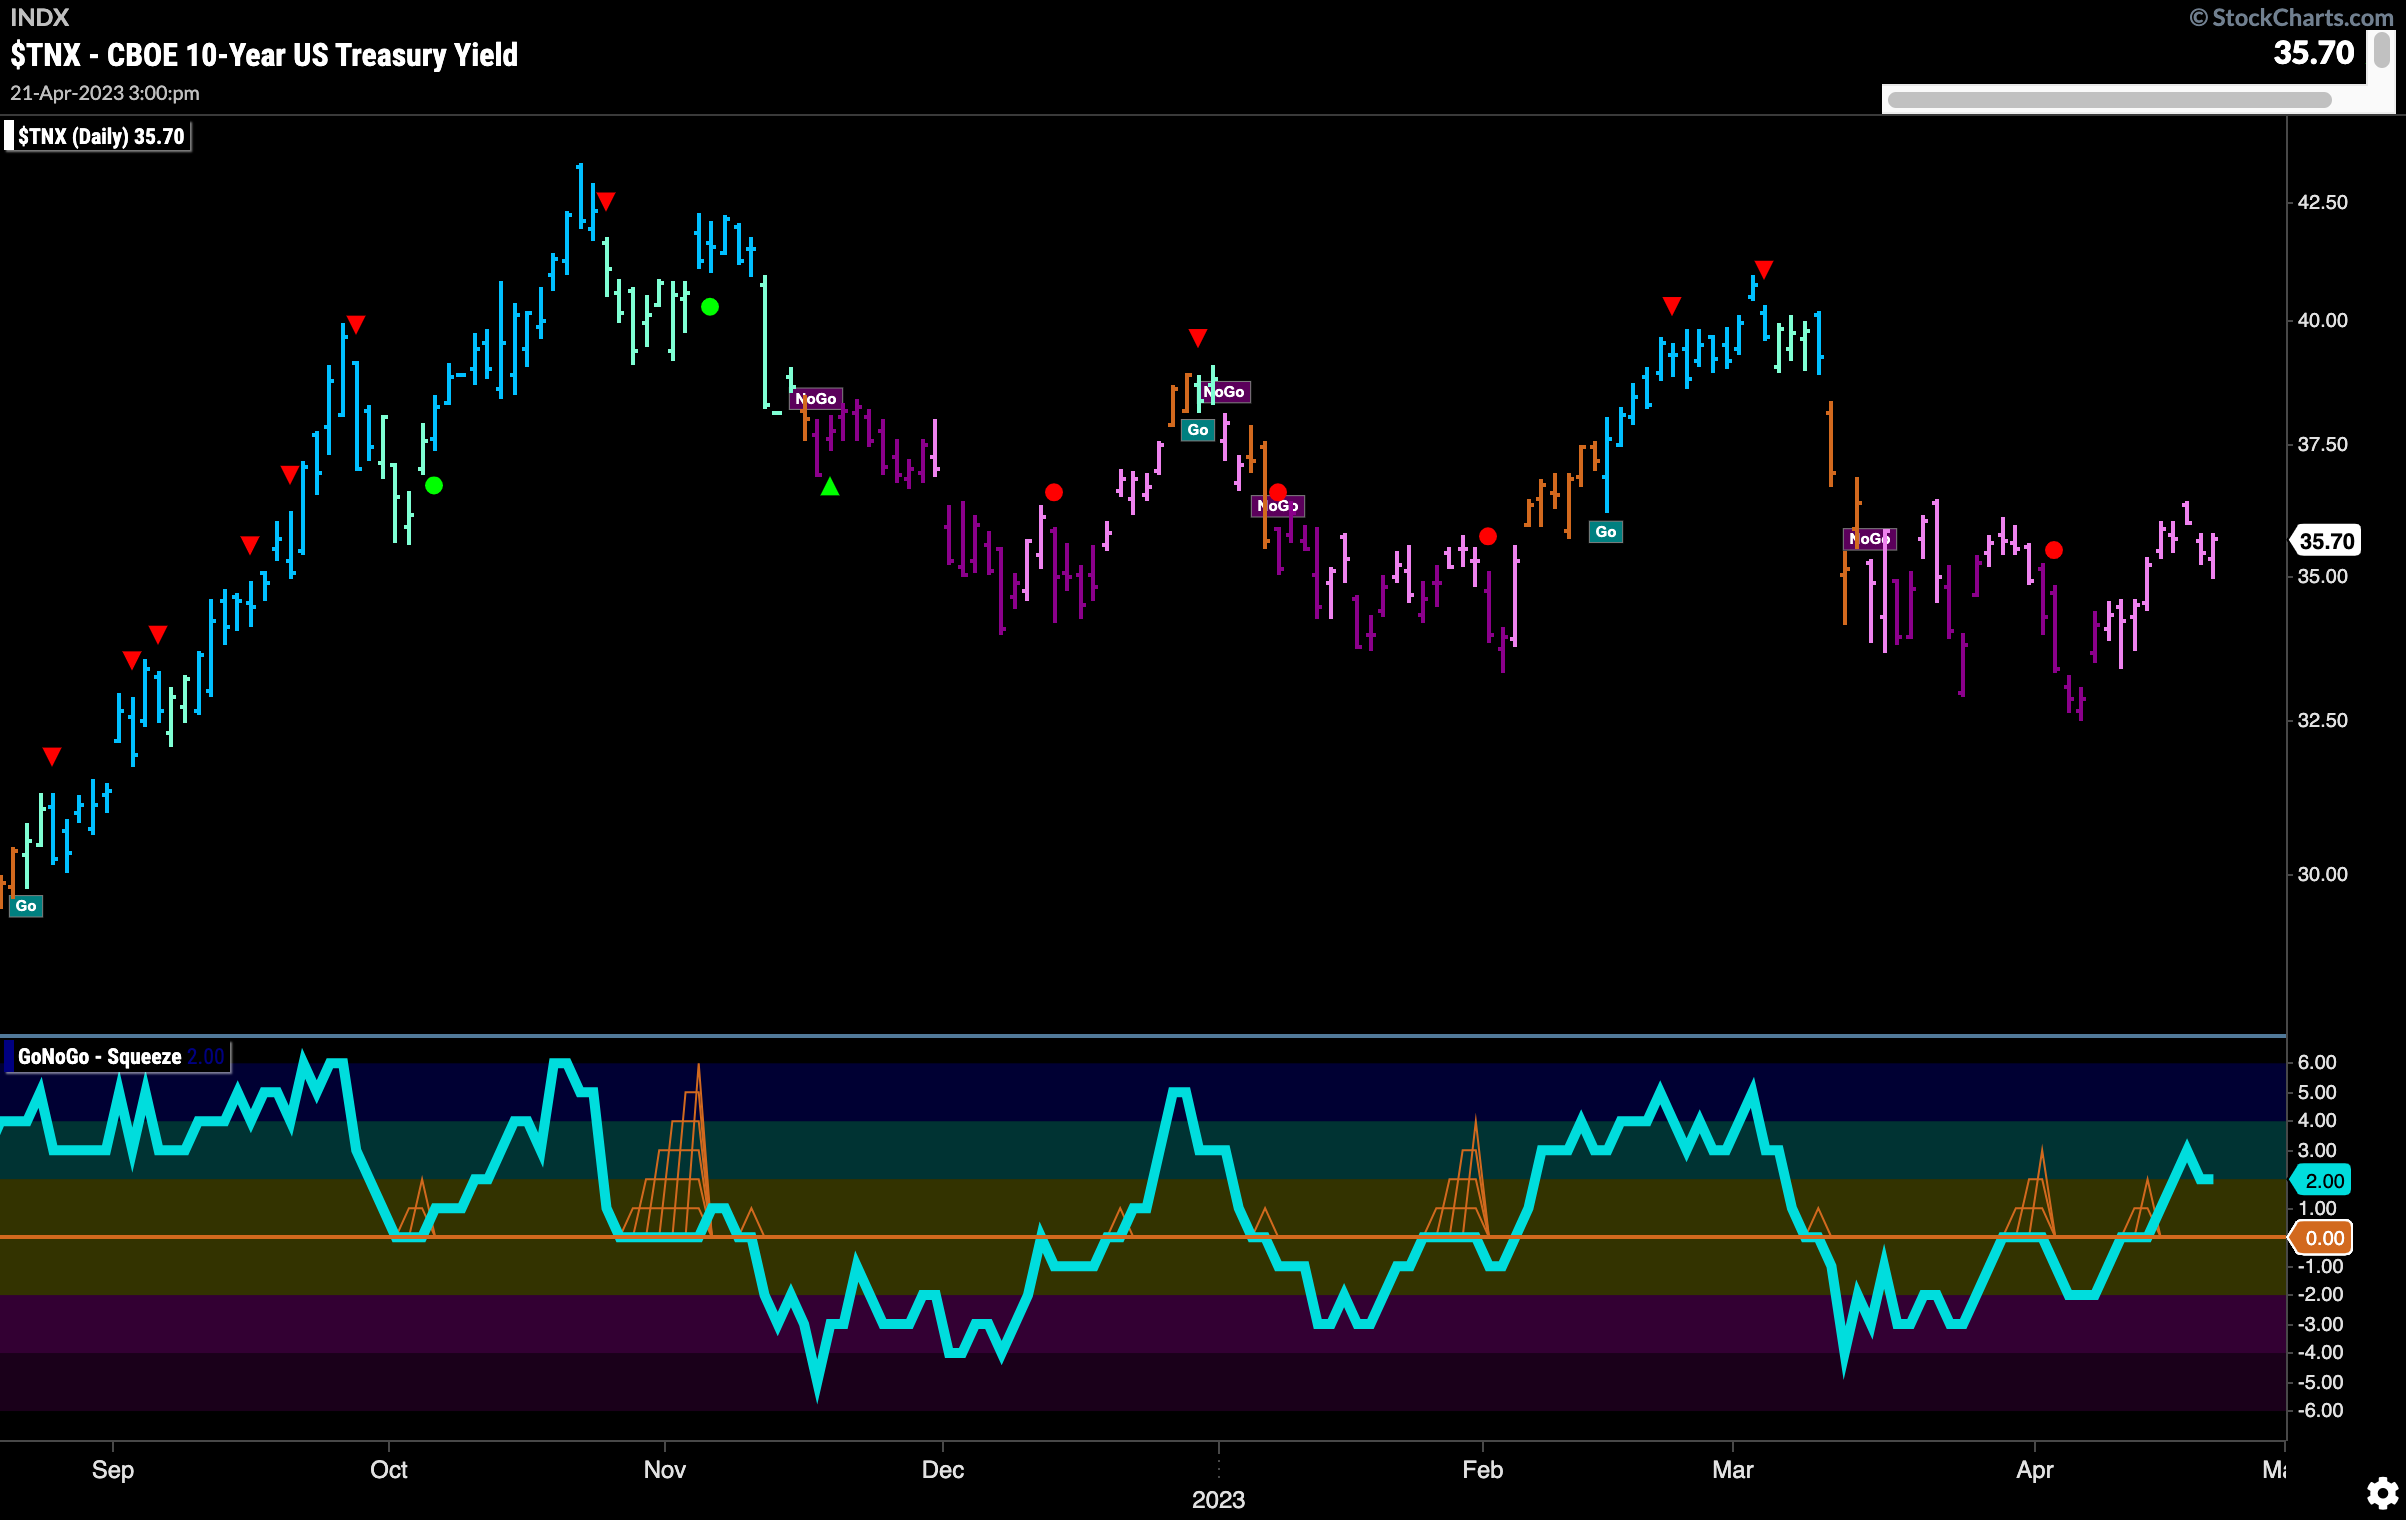
Treasury rates saw continued pink “NoGo” bars this week as price was turned away at prior high levels. We see that the weight of the evidence suggests the “NoGo” trend continues however GoNoGo Oscillator is in positive territory having broken above the zero line.
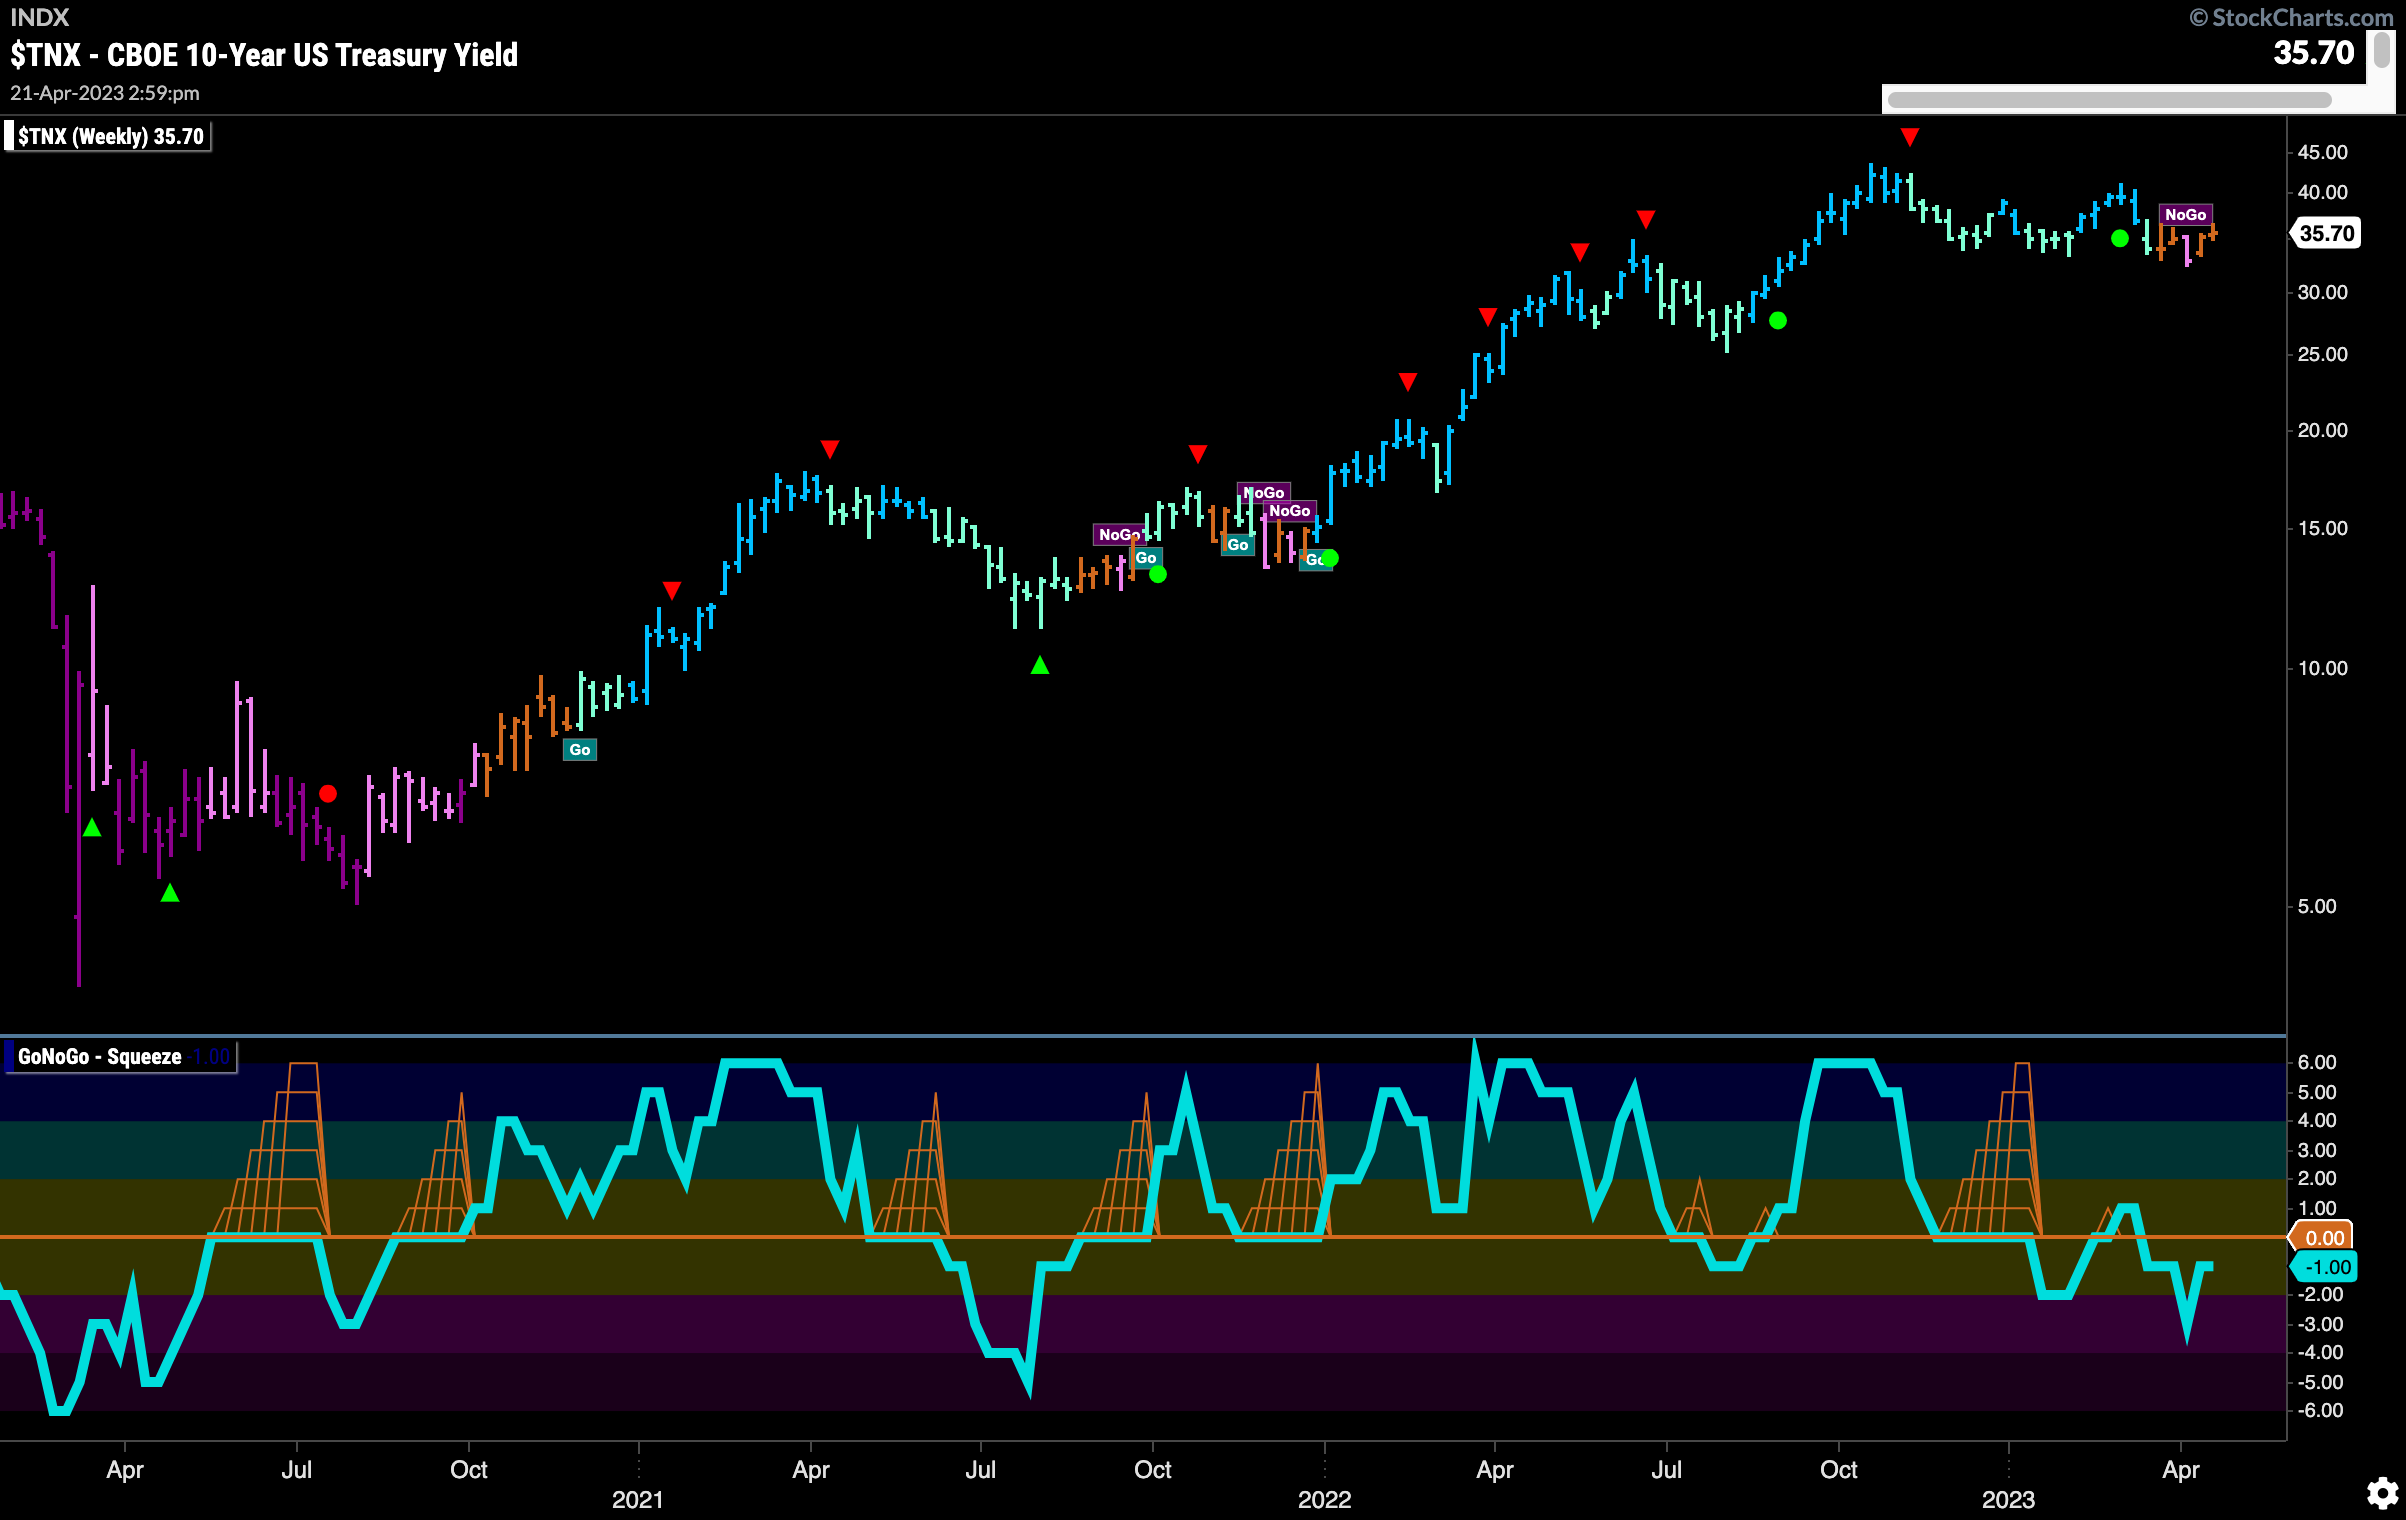
The weekly chart shows continued uncertainty. After a lone pink “NoGo” bar GoNoGo Trend paints a second amber “Go Fish” bar, 4th in the last five. There is some support at these levels as we can see price moving mostly sideways. GoNoGo Oscillator is still in negative territory though so as investors make up their mind we know that momentum is still slightly bearish.
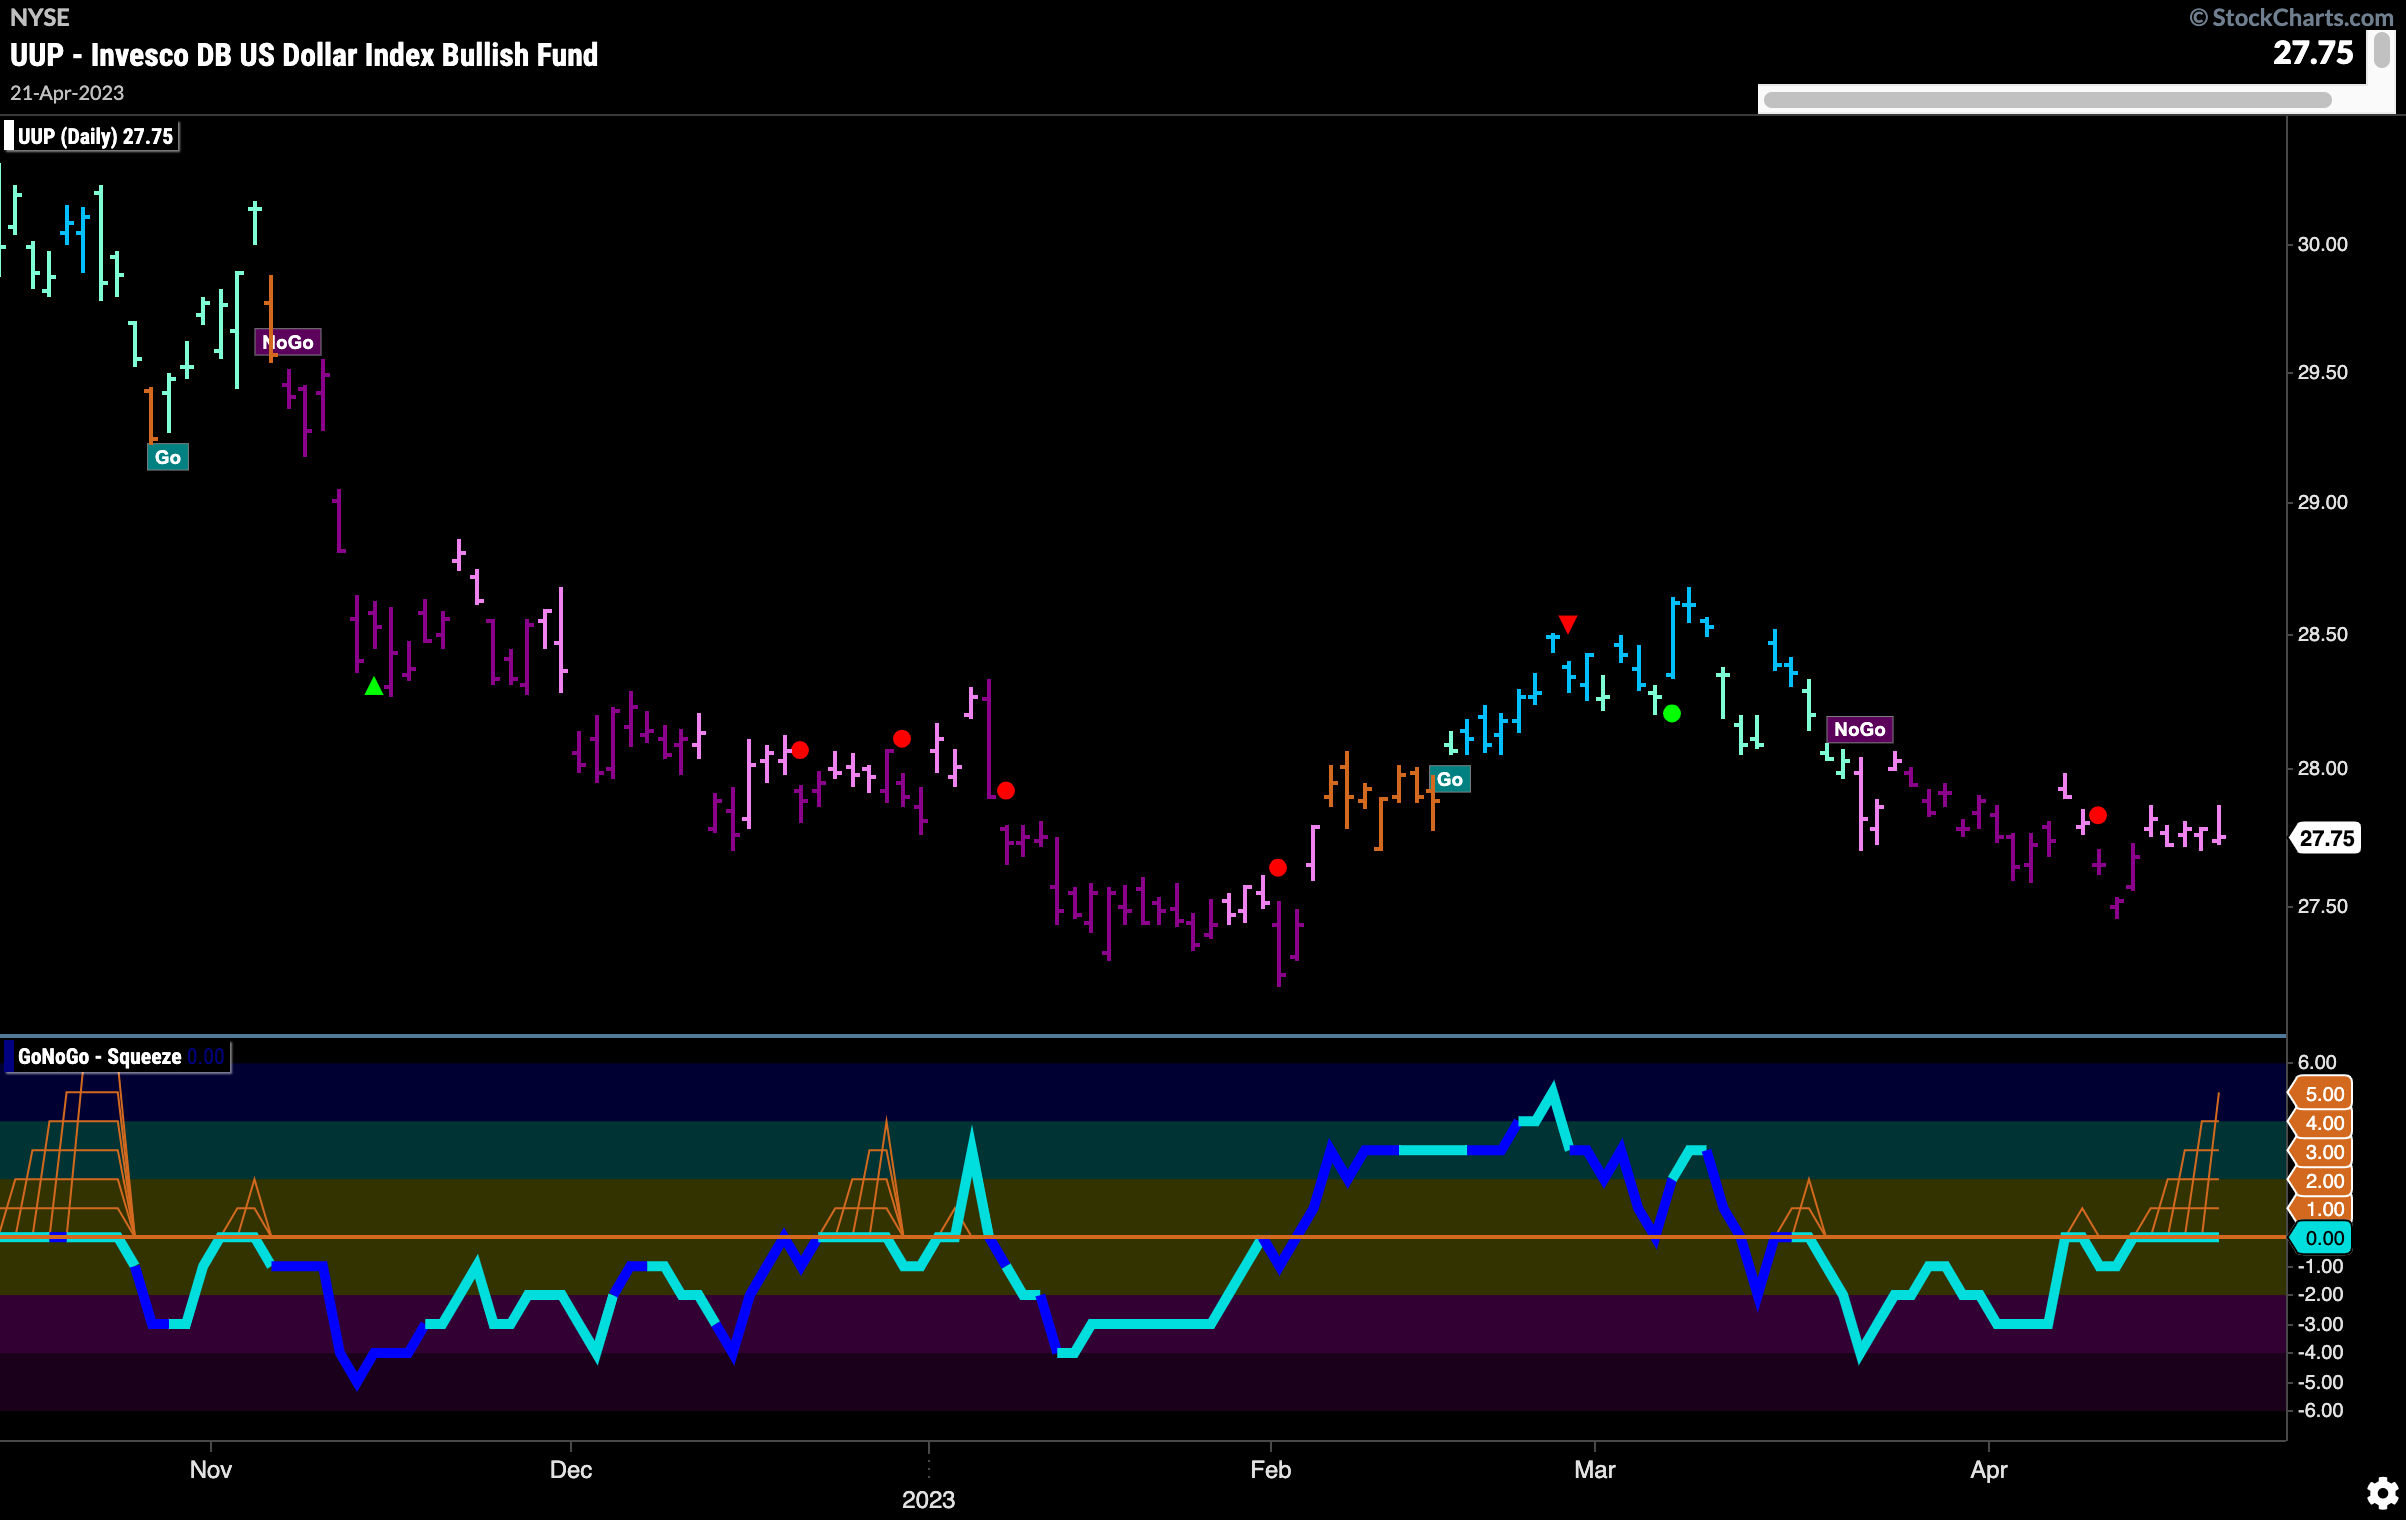
Dollar “NoGo” Trend Weakens
GoNoGo Trend saw prices jump higher at the beginning of the week and then stay there. This caused GoNoGo Trend to paint uninterrupted pink “NoGo” bars, the weaker bearish form. GoNoGo Oscillator rode the zero line all week which allowed the climbing grid of GoNoGo Squeeze to rise close to its max. We will watch to see in which direction the GoNoGo Squeeze is broken to give us clues about price’s next direction.
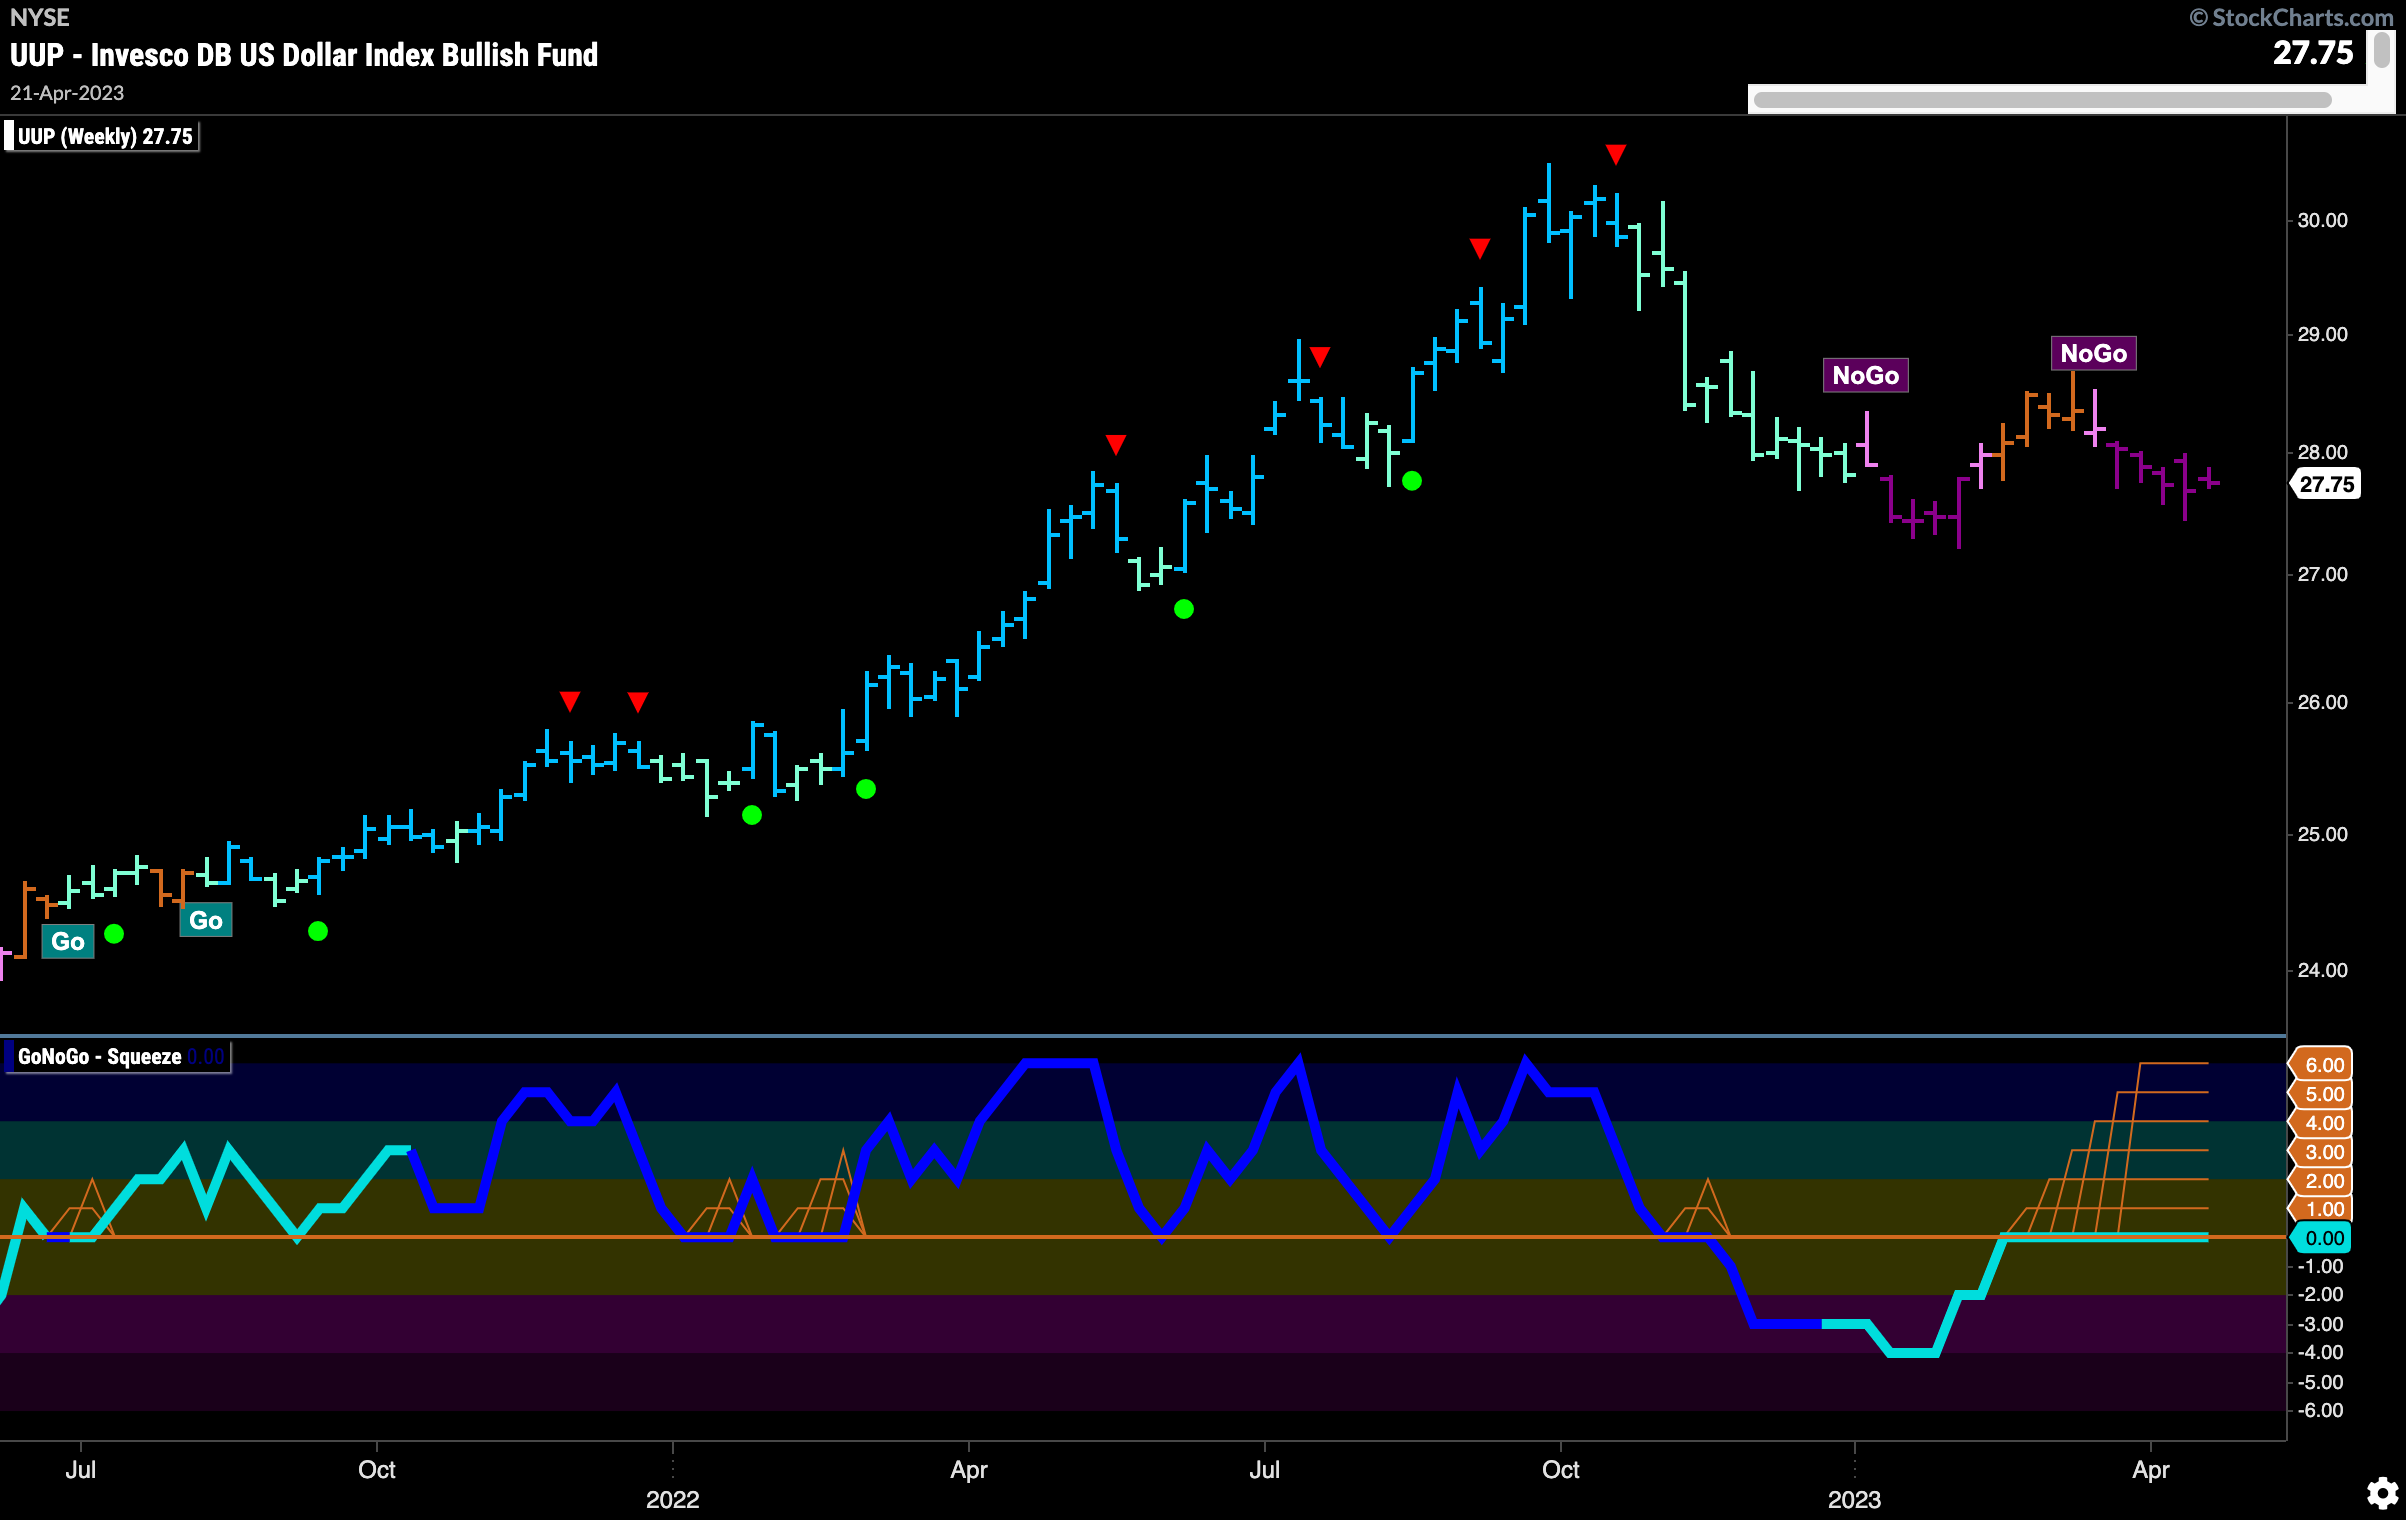
The weekly chart tells us that there is a significant battle taking place between buyers and sells as price volatility was very compressed this week. With a strong “NoGo” trend in place, GoNoGo Oscillator remained stuck at the zero line. We are in an extended Max GoNoGo Squeeze in the oscillator panel as there is not enough directional momentum to allow the oscillator to move either into positive or negative territory. It will be telling when this Squeeze is broken.
Oil Stalls in Attempt to Break above Resistance
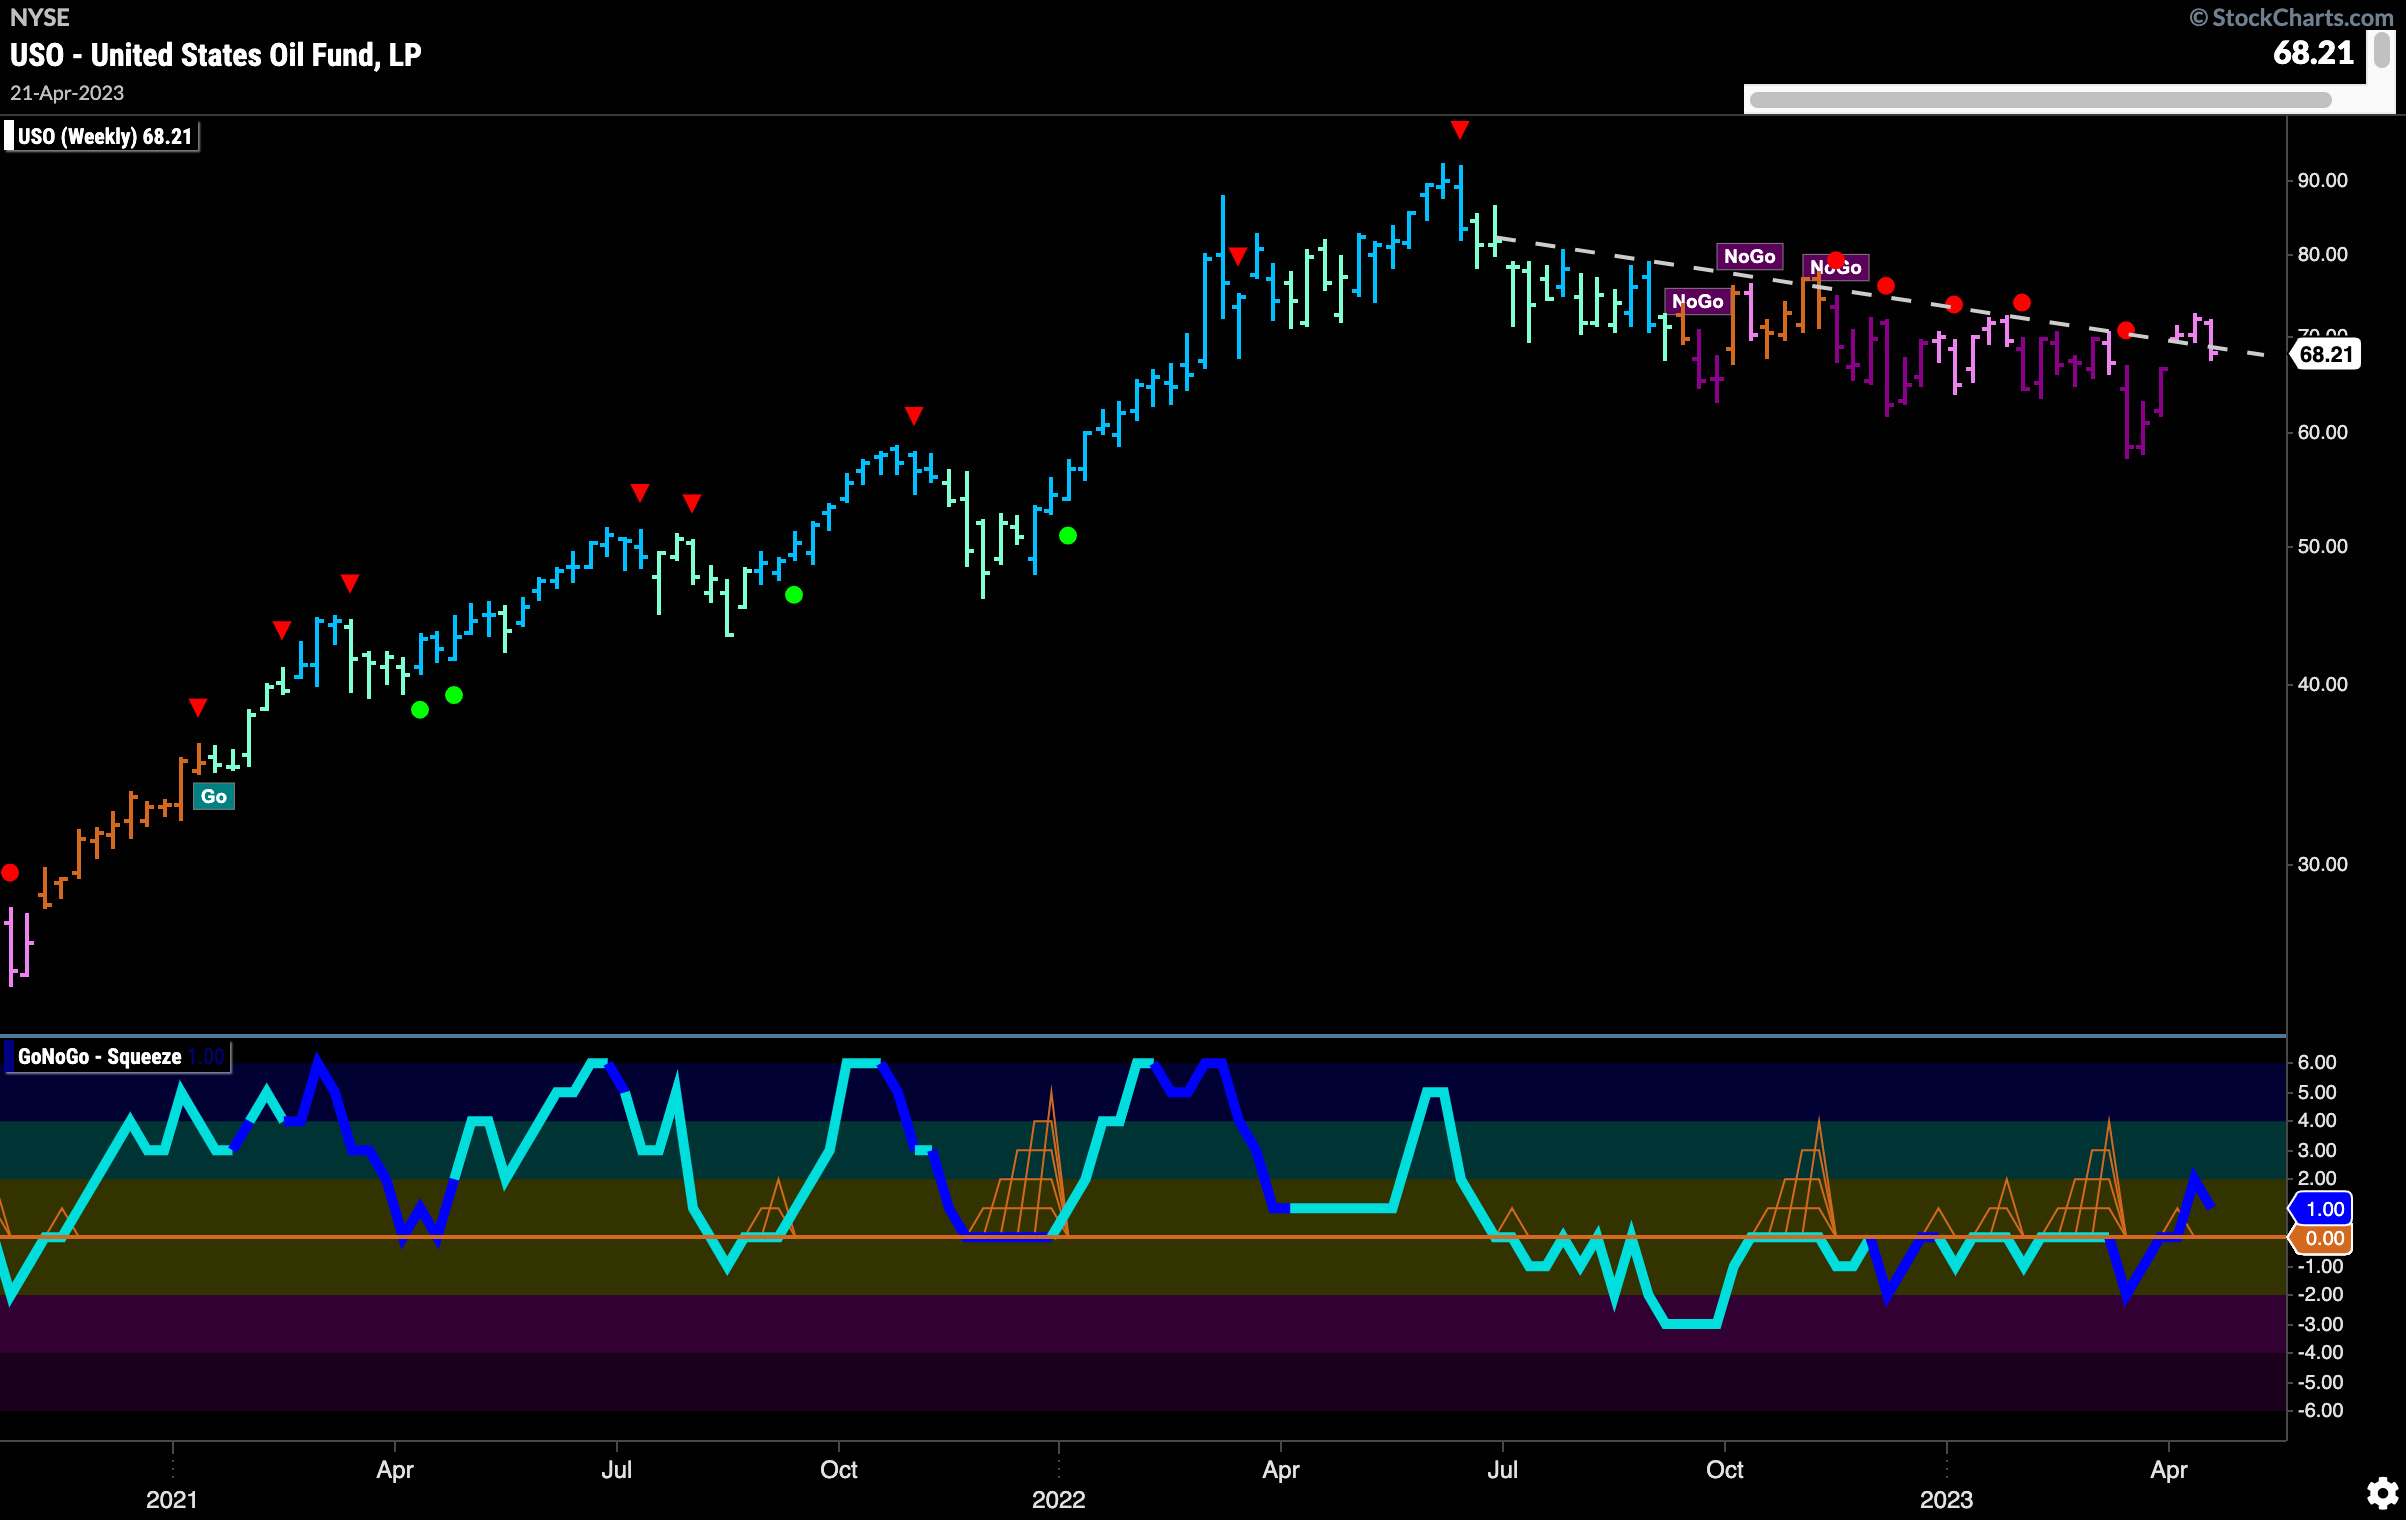
$USO this week saw price retreat and fall back to the downward sloping trend line that we have had on this chart for several months. The question now becomes this; will this level now become support for price moving forward or will it fall back into the down trend that has consumed it all year. GoNoGo Oscillator is in positive territory on heavy volume and so this suggests that there may be an attempt for higher prices.
Gold Consolidates After High
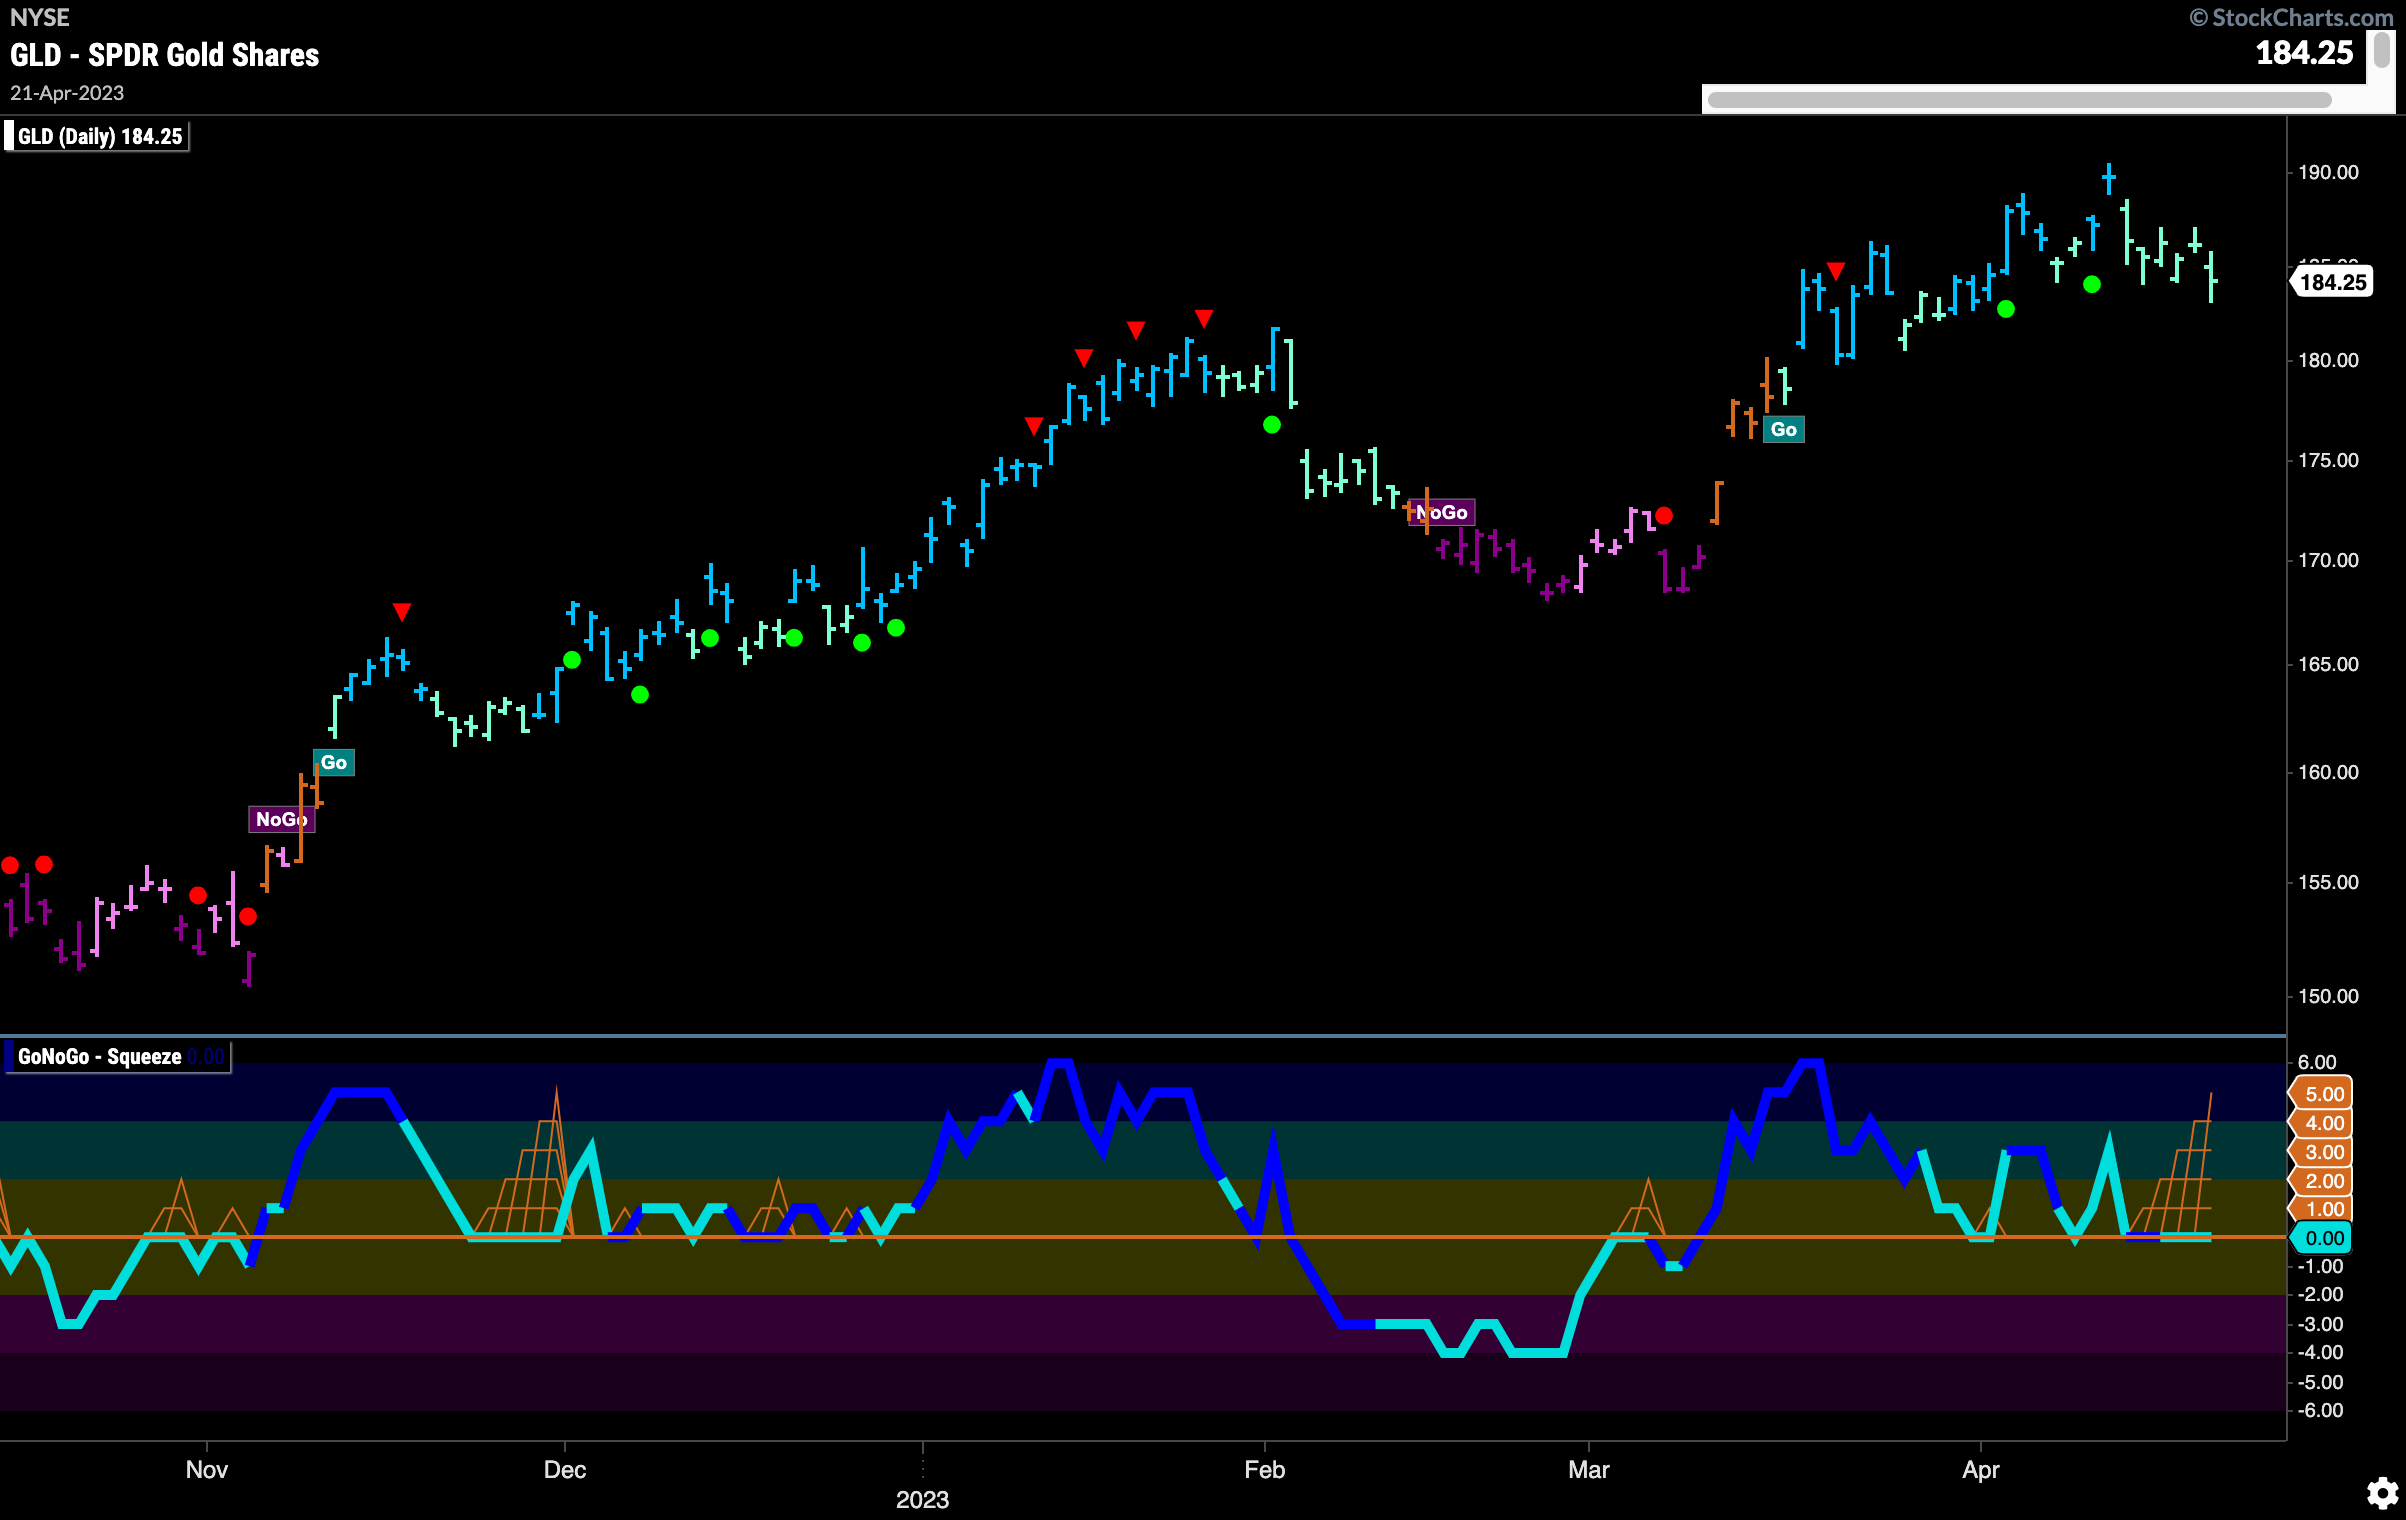
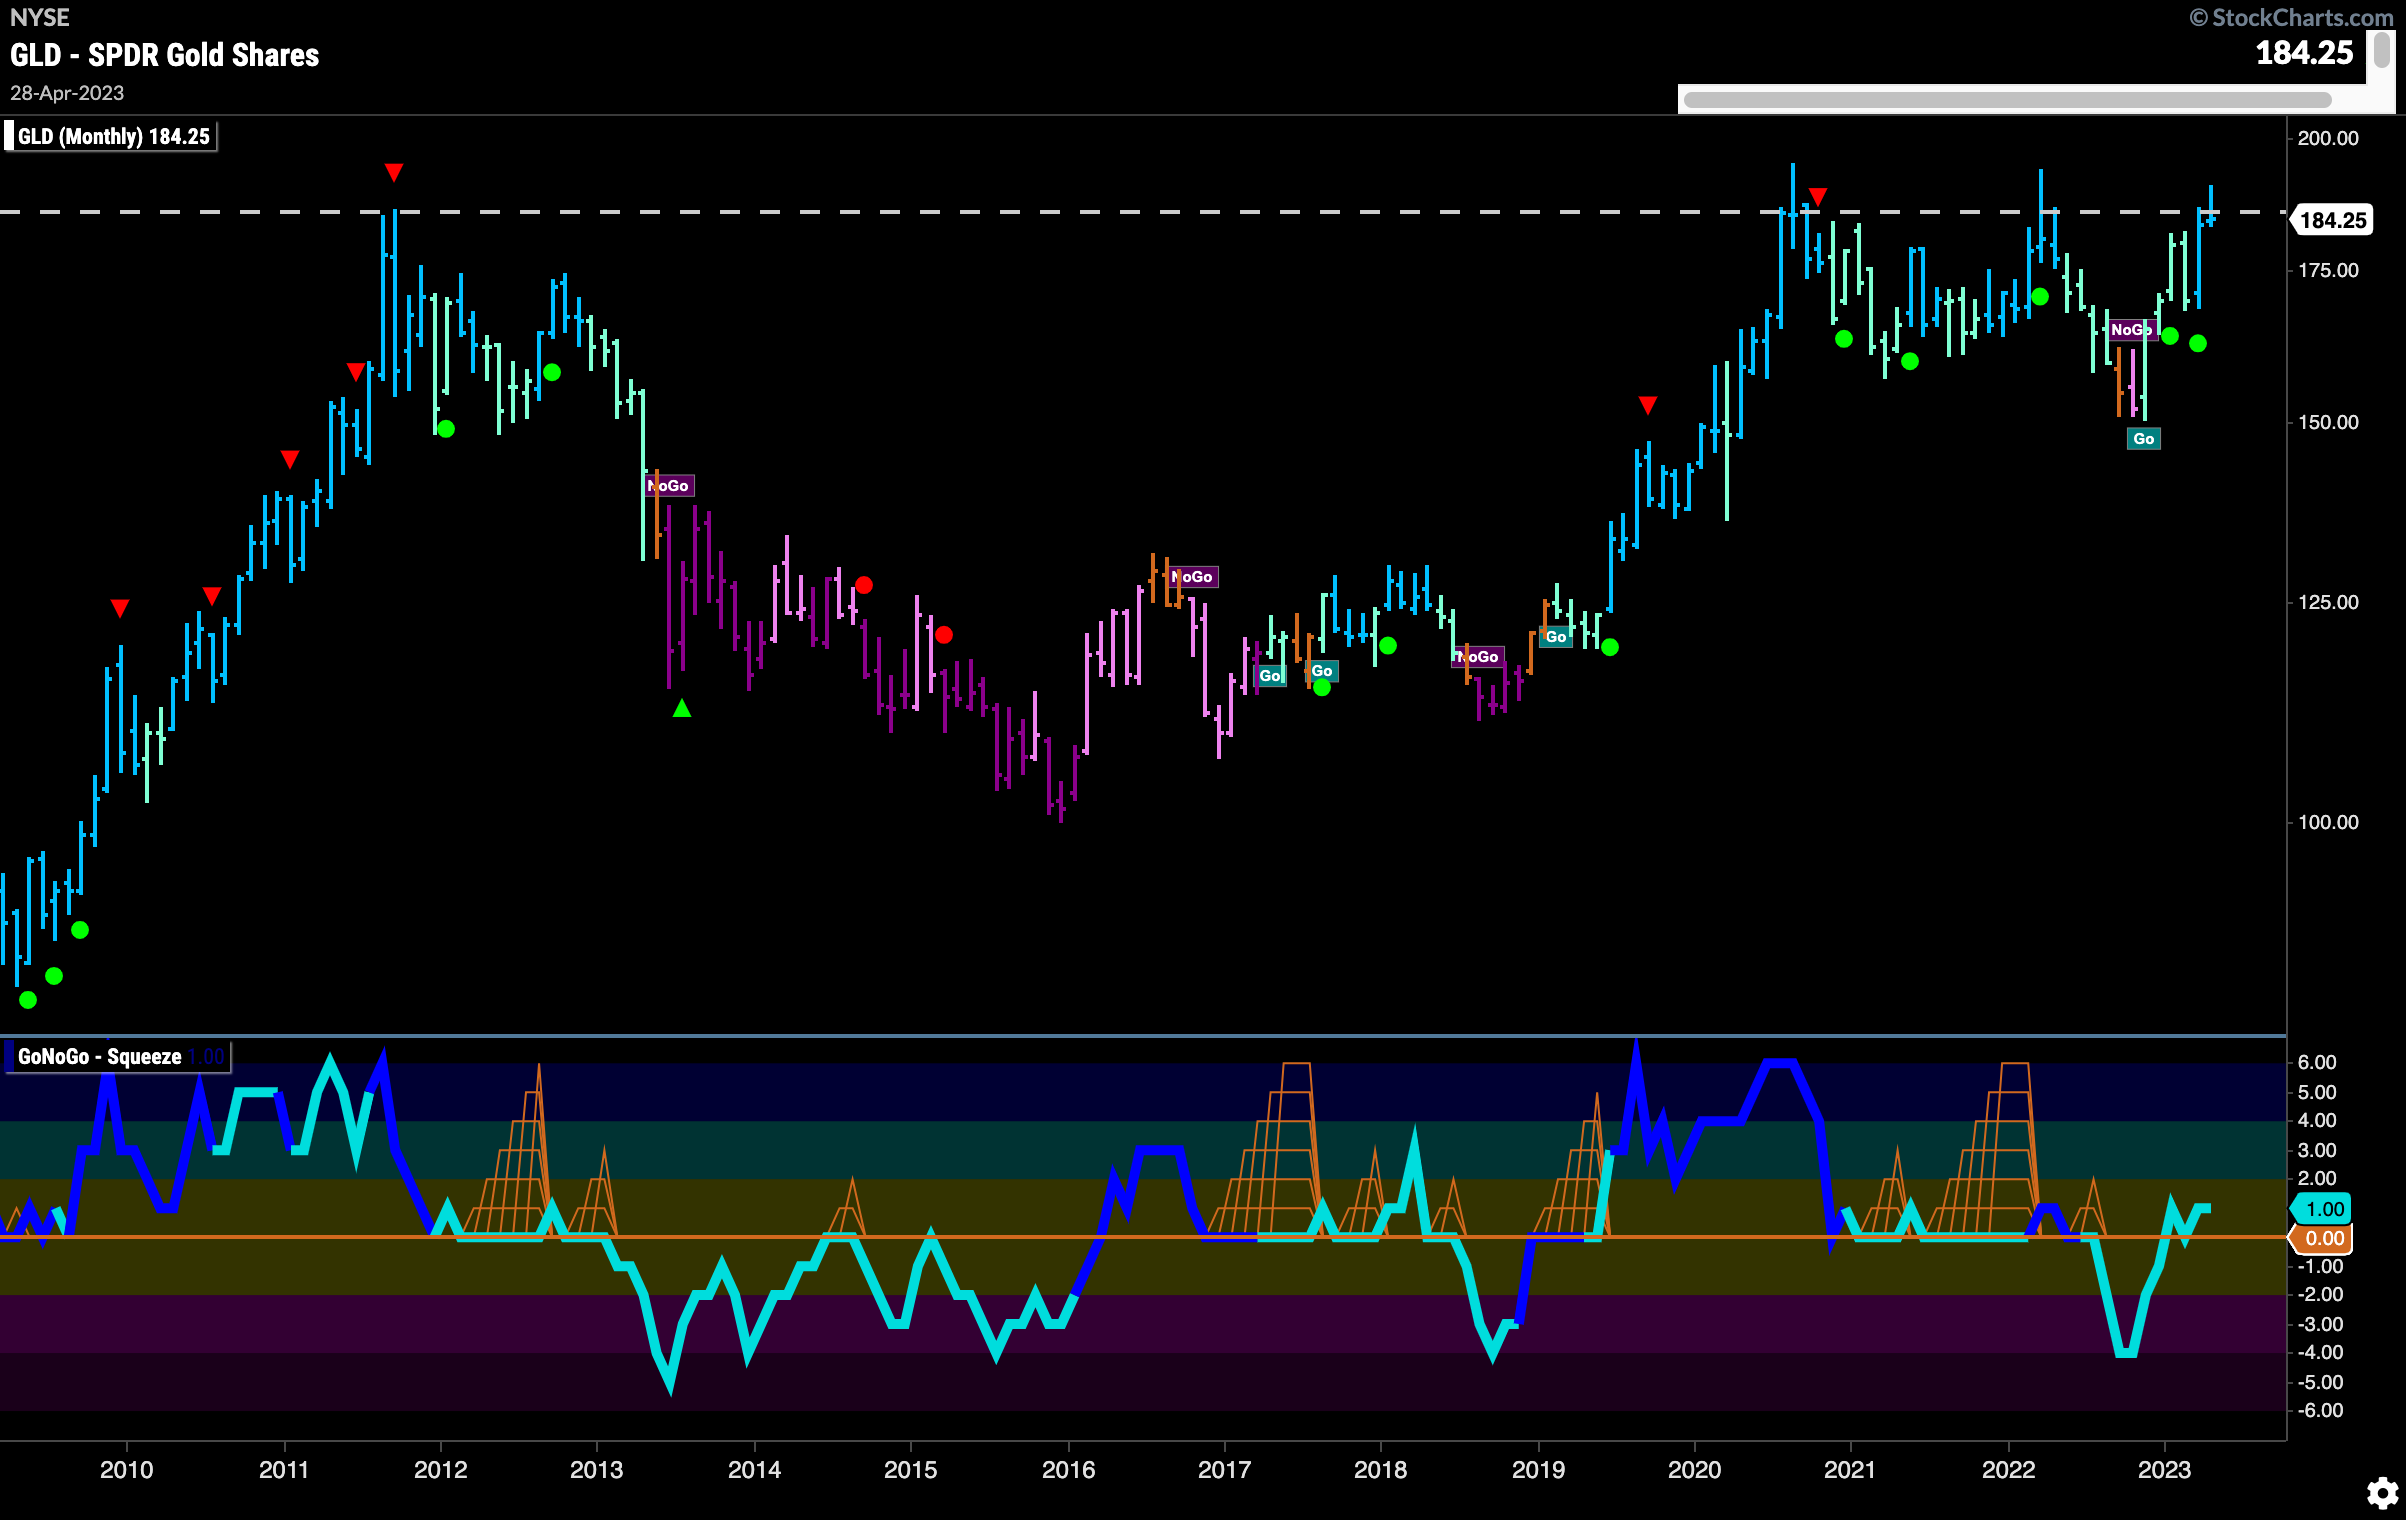
$GLD has pulled back after hitting a new high last week. This week saw a string of weaker aqua “Go” bars and we see the oscillator fall to the zero line. It remained at that objective level of support for several bars and we see a GoNoGo Squeeze rising close to its max. We will watch closely to see if the zero level can continue to act as support allowing the “Go” trend to continue in the price panel.
The monthly chart of $GLD shows just how important these levels are. If we can consolidate at these levels and edge higher we would be taking out decade long resistance. GoNoGo Oscillator has rallied back above the zero level and so momentum is offering its support as price tries to take out the the lip of this cup and handle.
Sector RelMap
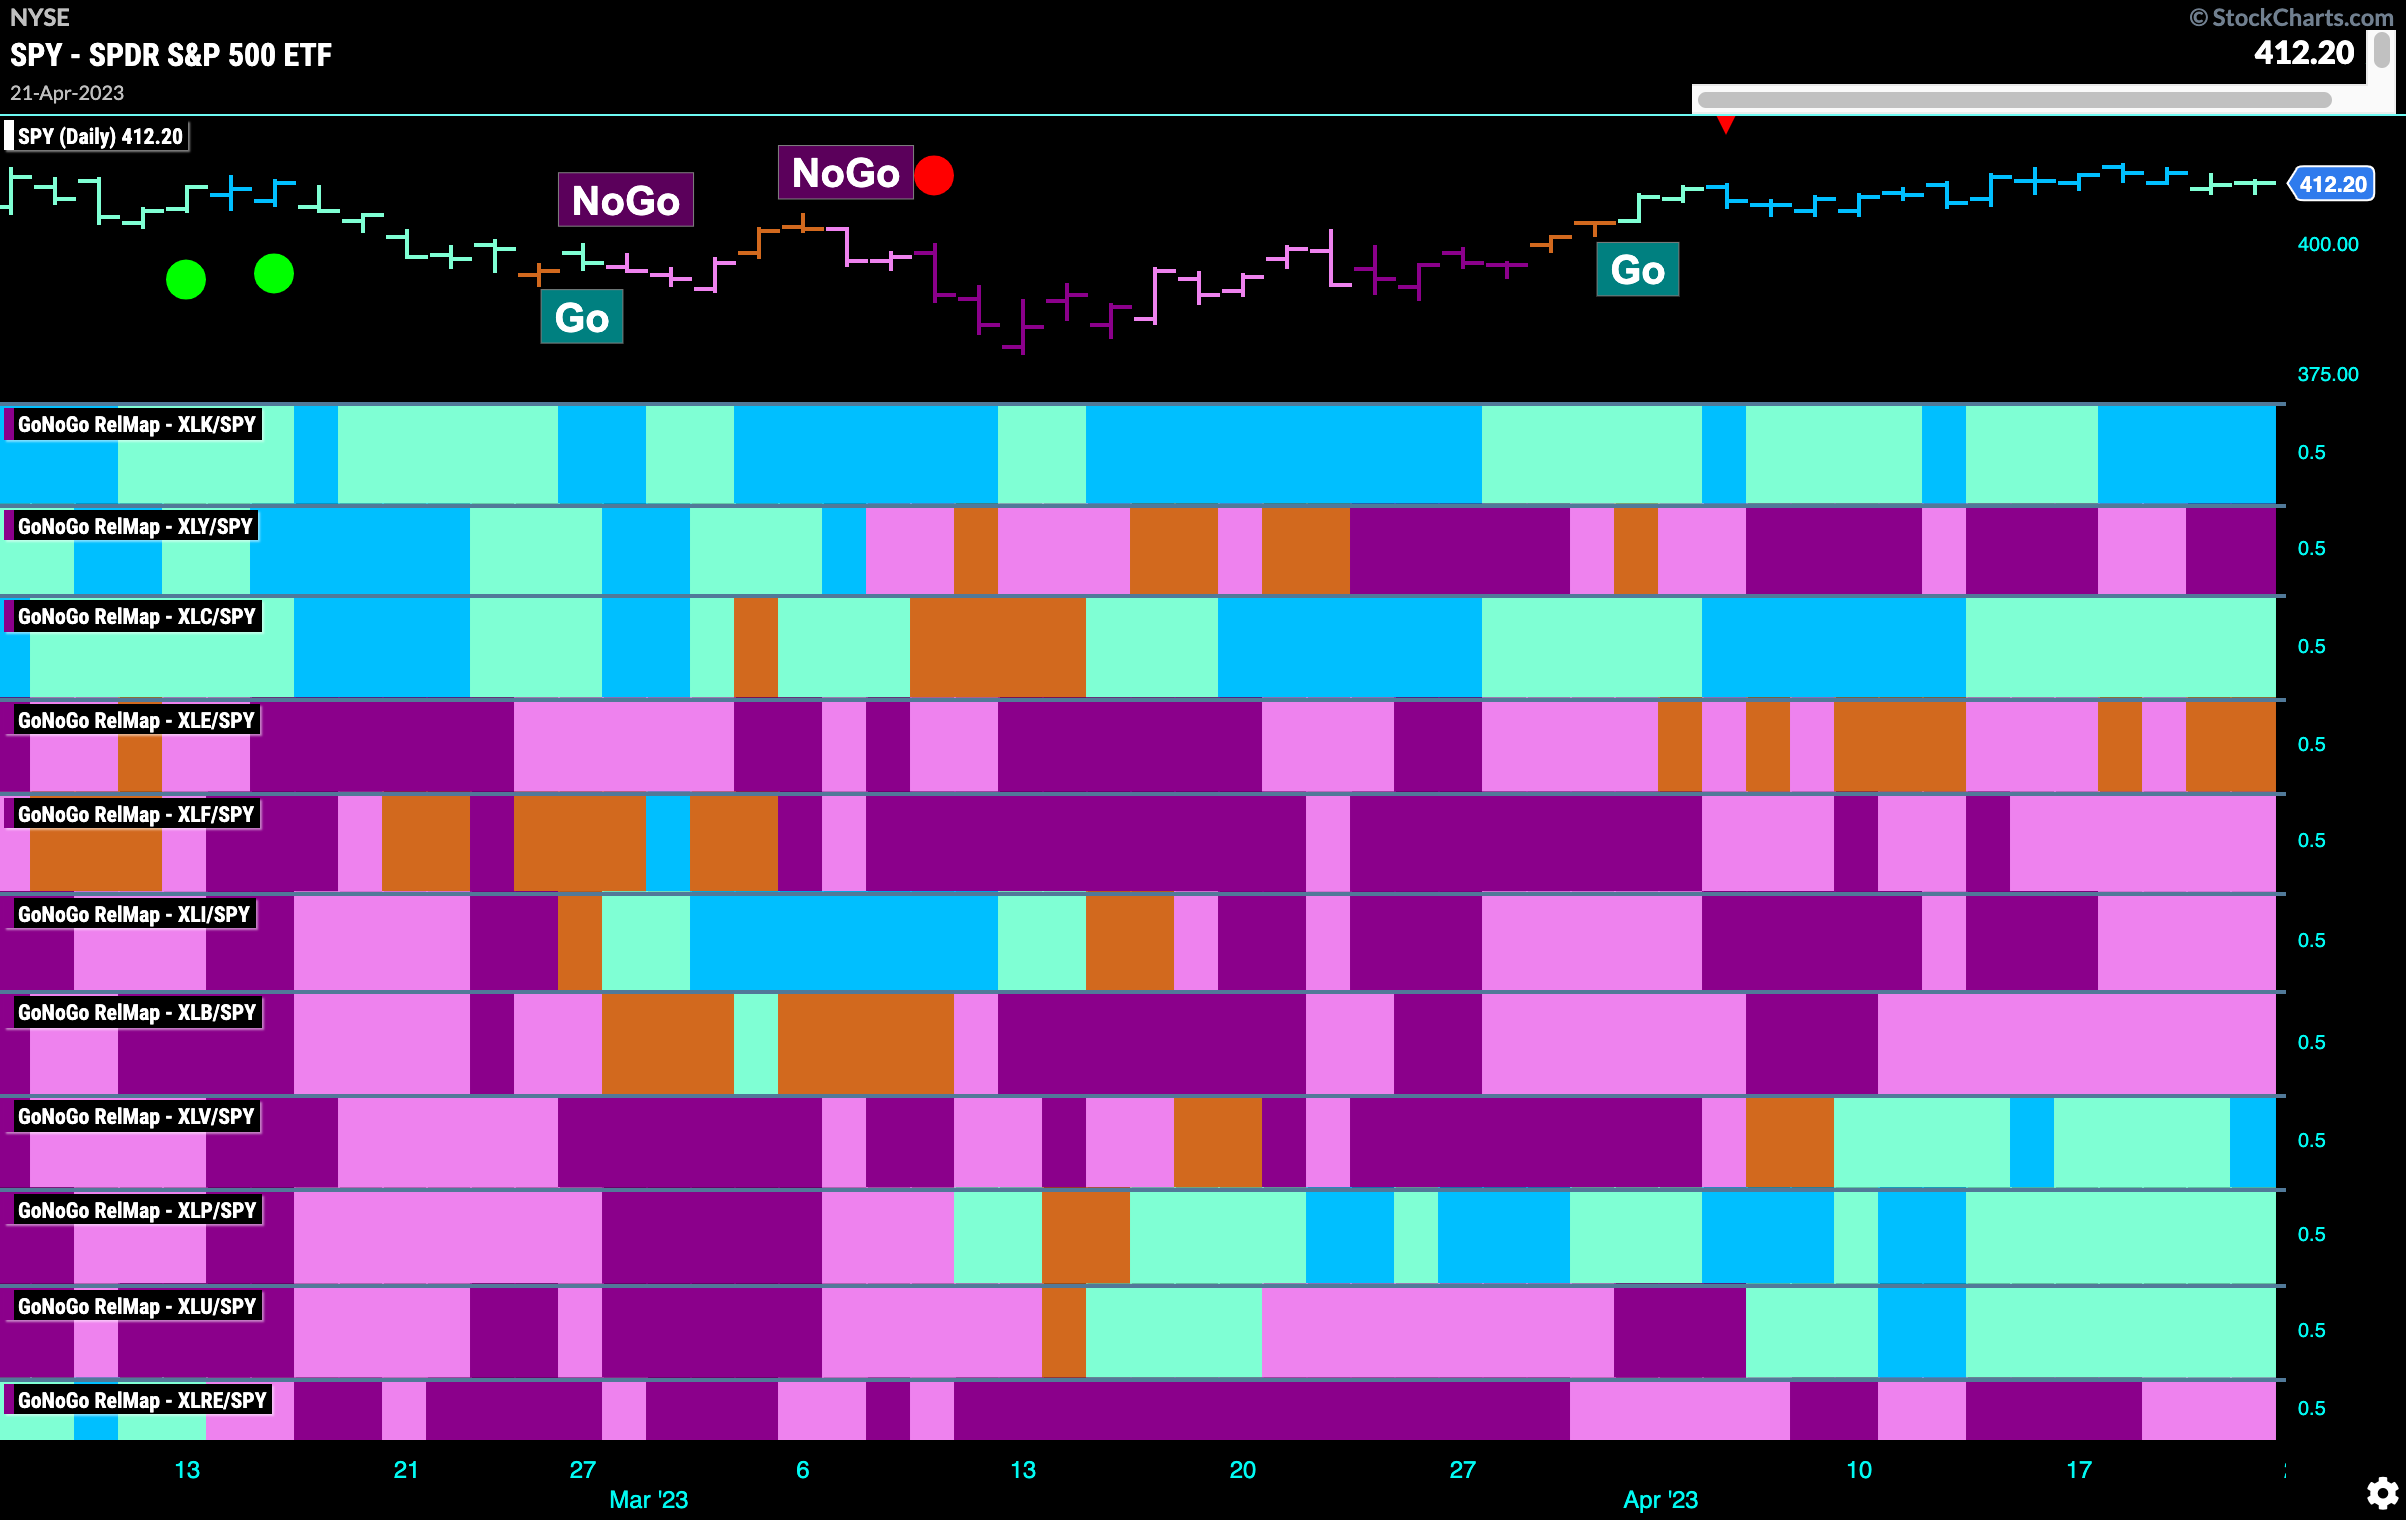
Below is the GoNoGo Sector RelMap. This GoNoGo RelMap applies the GoNoGo Trend to the relative strength ratios of the sectors to the base index. Looking at this map, we can quickly see where the relative outperformance is coming from as well as which sectors are lagging on a relative basis. 5 sectors are outperforming the base index this week. $XLK, $XLC, $XLV, $XLP, and $XLU are painting “Go” bars.
Sub-Industry Group RelMap
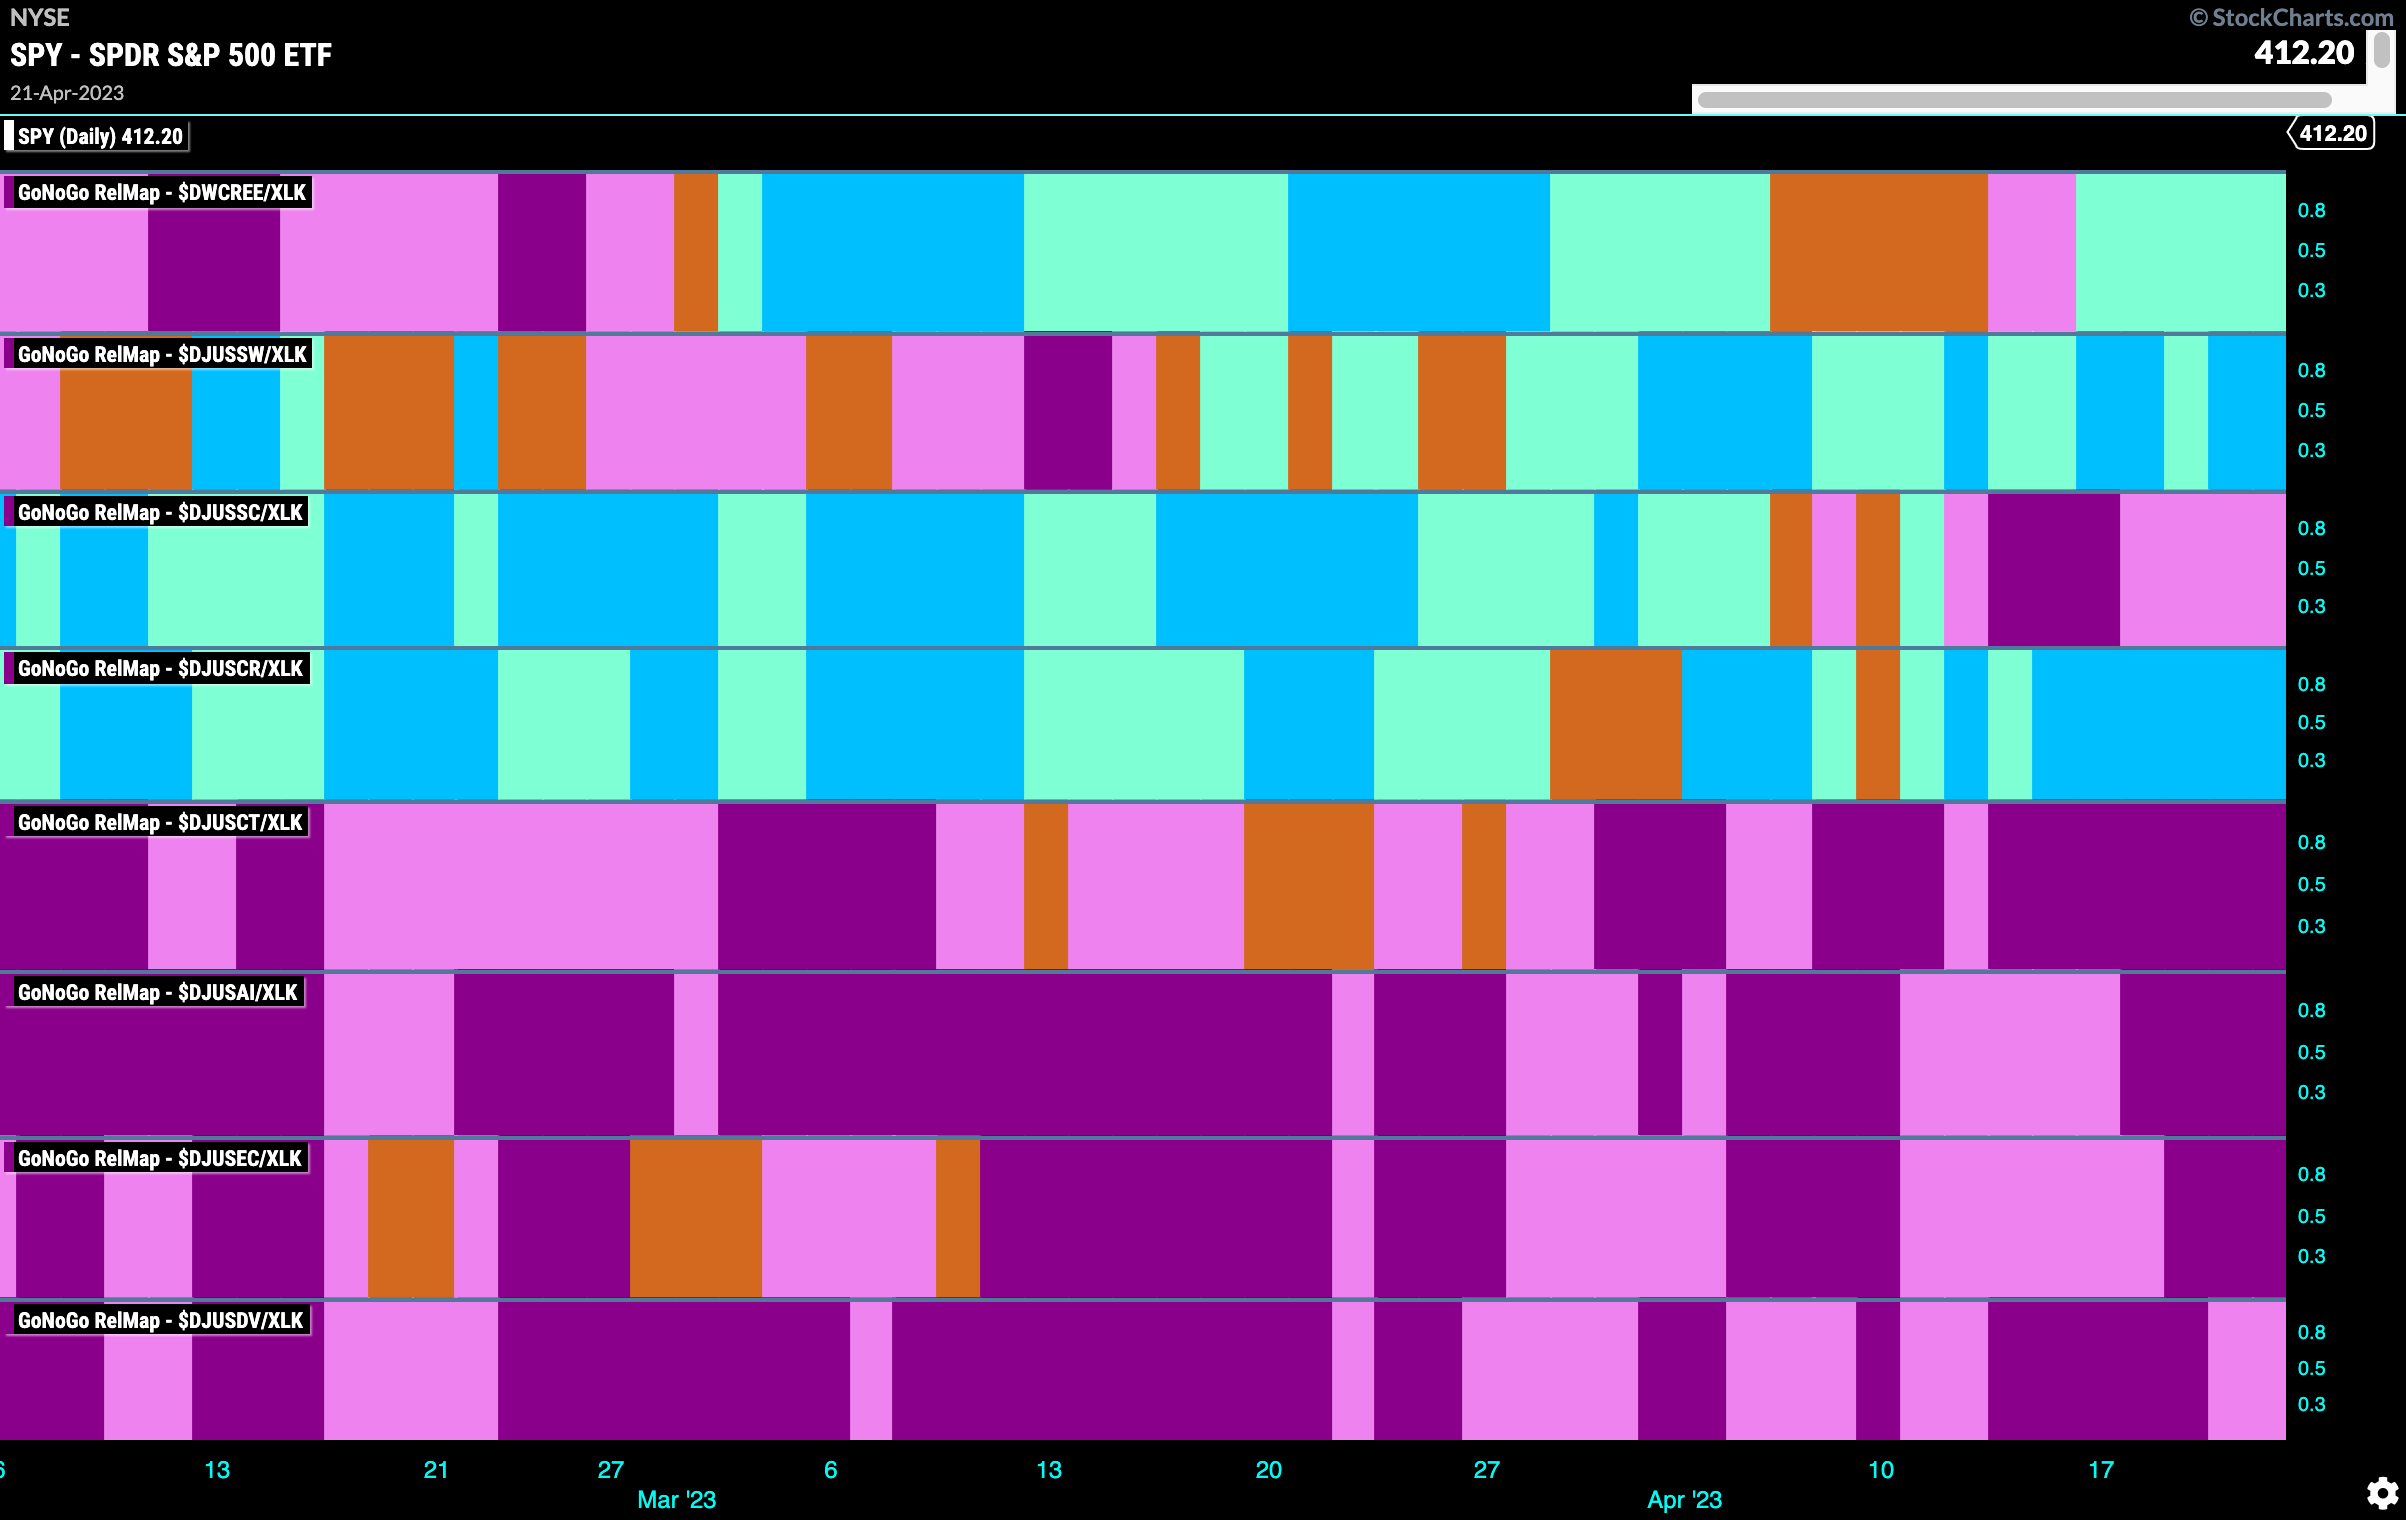
In the above GoNoGo Sector RelMap, we see renewed strength in the outperformance of the technology sector as it paints strong blue “Go” bars on a relative basis to the S&P. The below RelMap is the GoNoGo RelMap of the industry subgroups within the technology sector. We can see that a strong out-performer is the software index, second panel. We can see that at the end of March it transitioned through a few amber “Go Fish” bars and since then has seen the “Go” trend strengthen and is now painting strong blue bars.
Salesforce Looks for New Highs
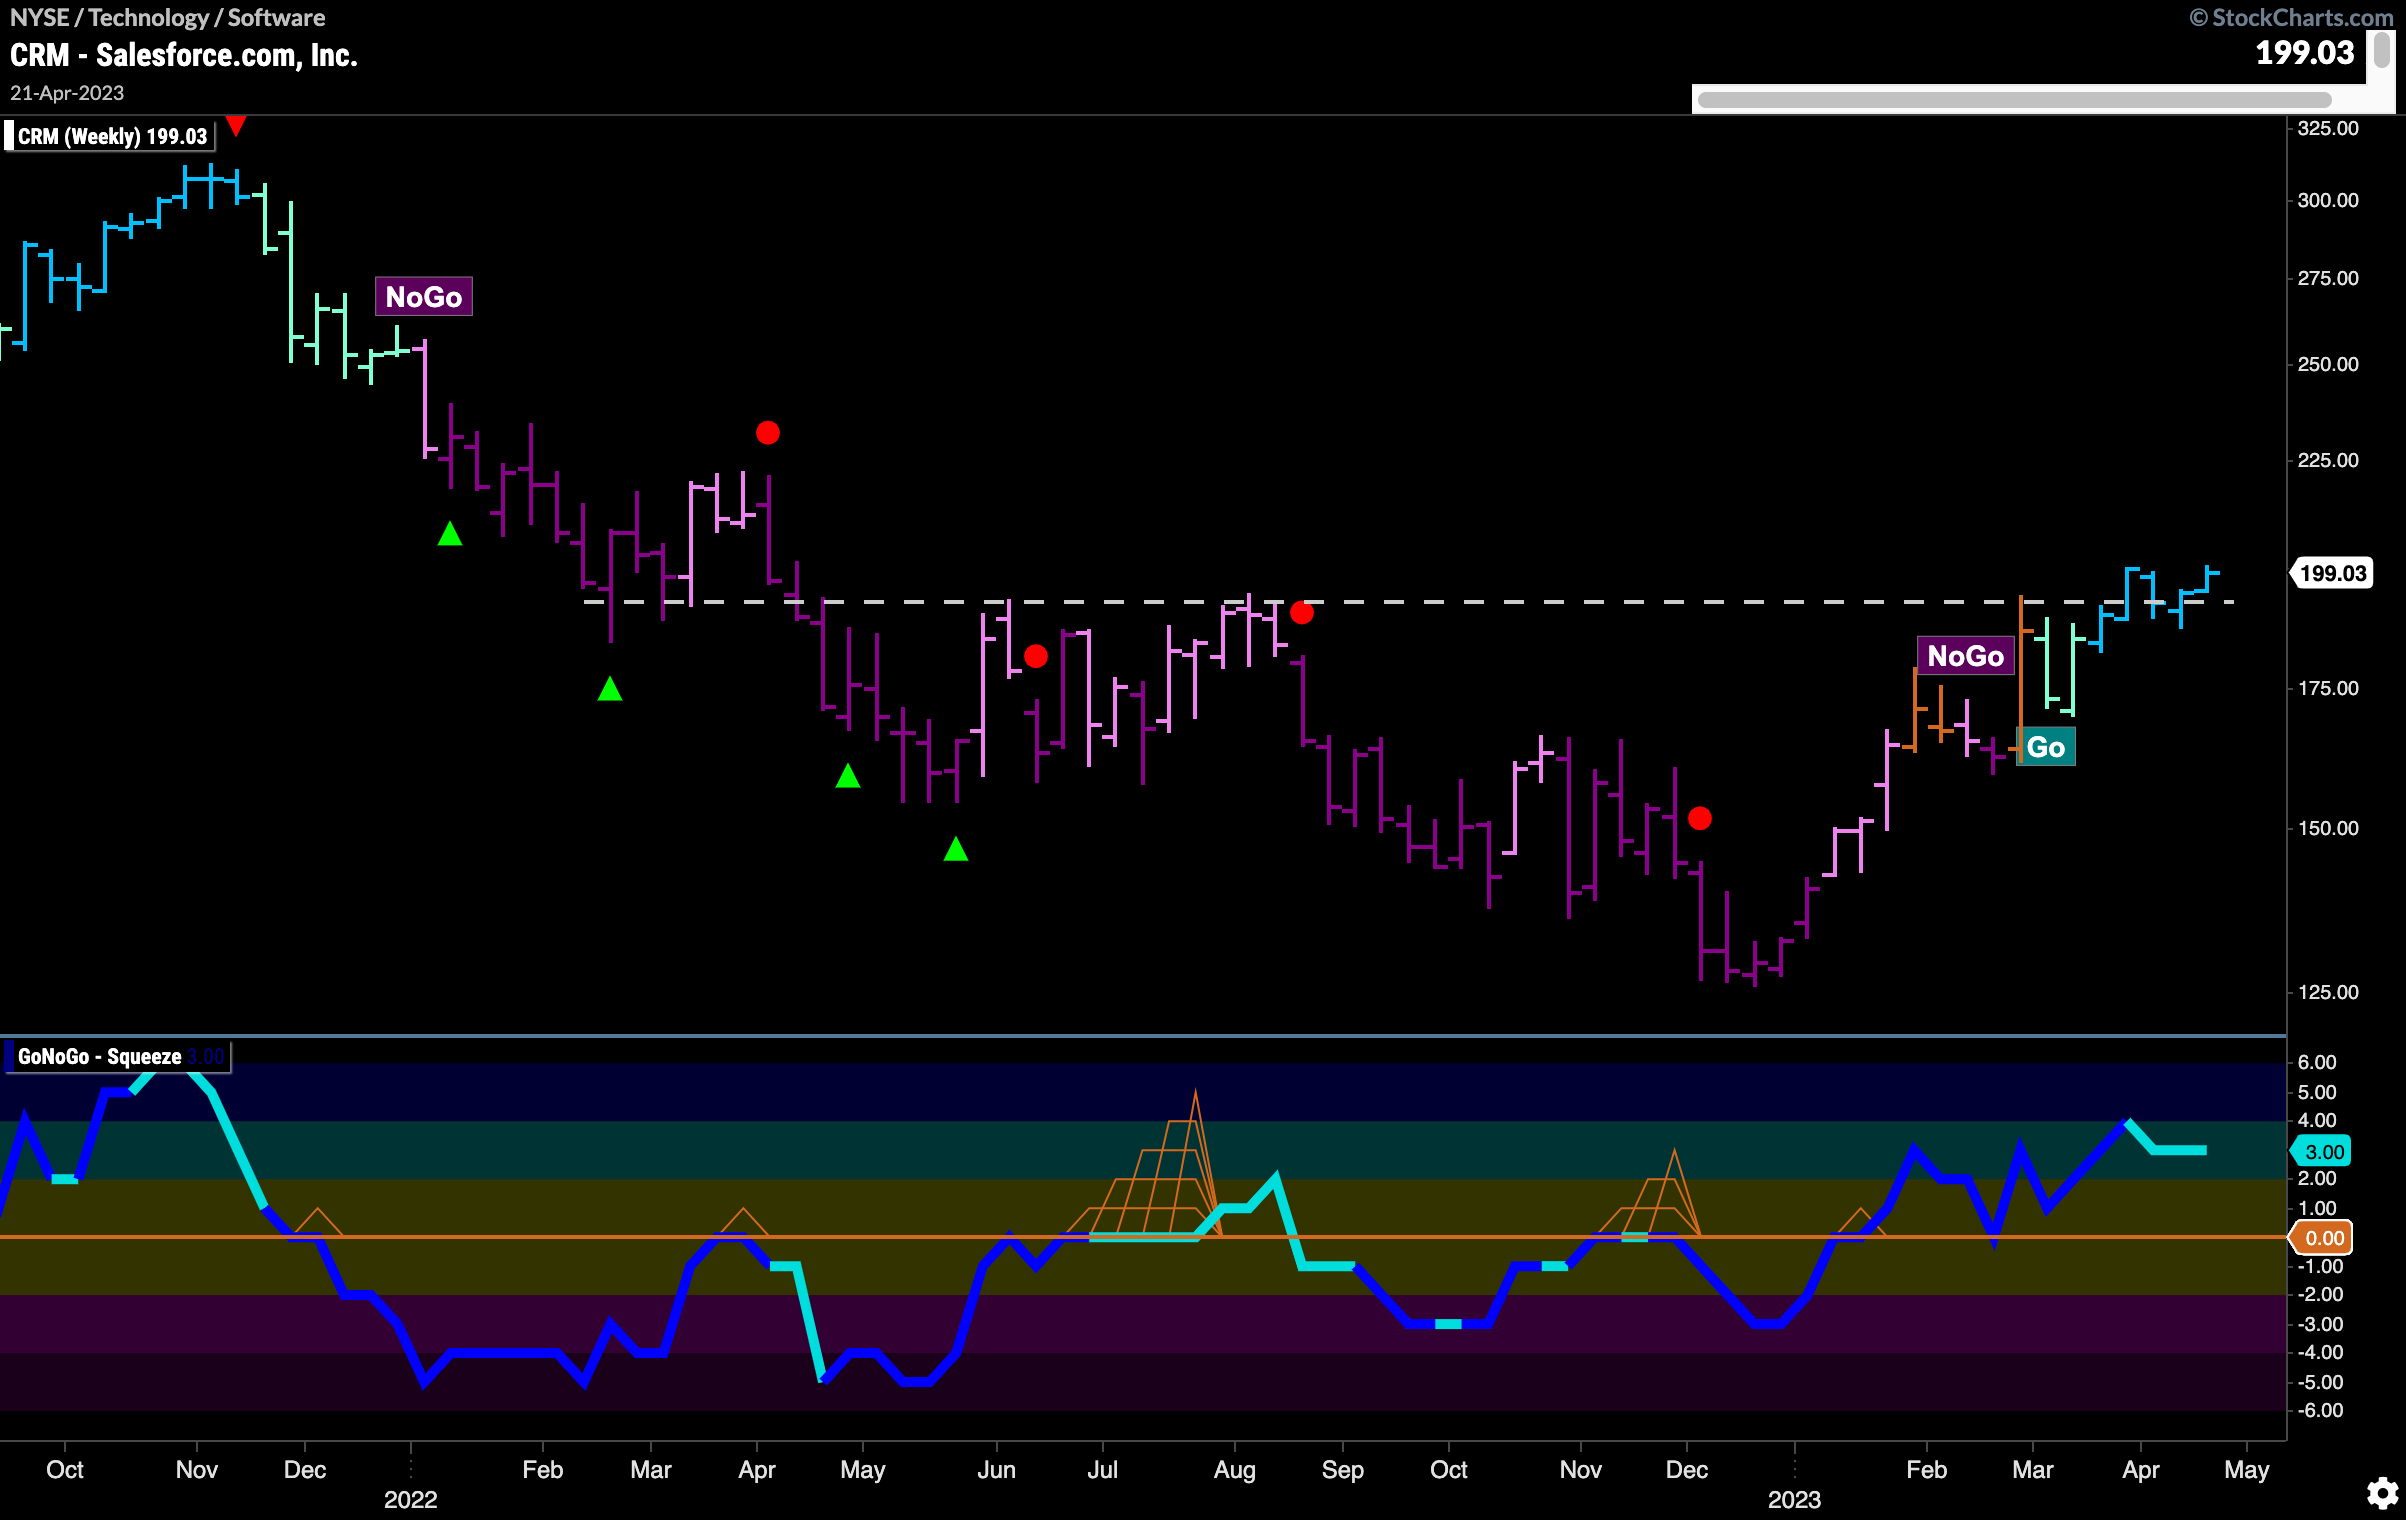
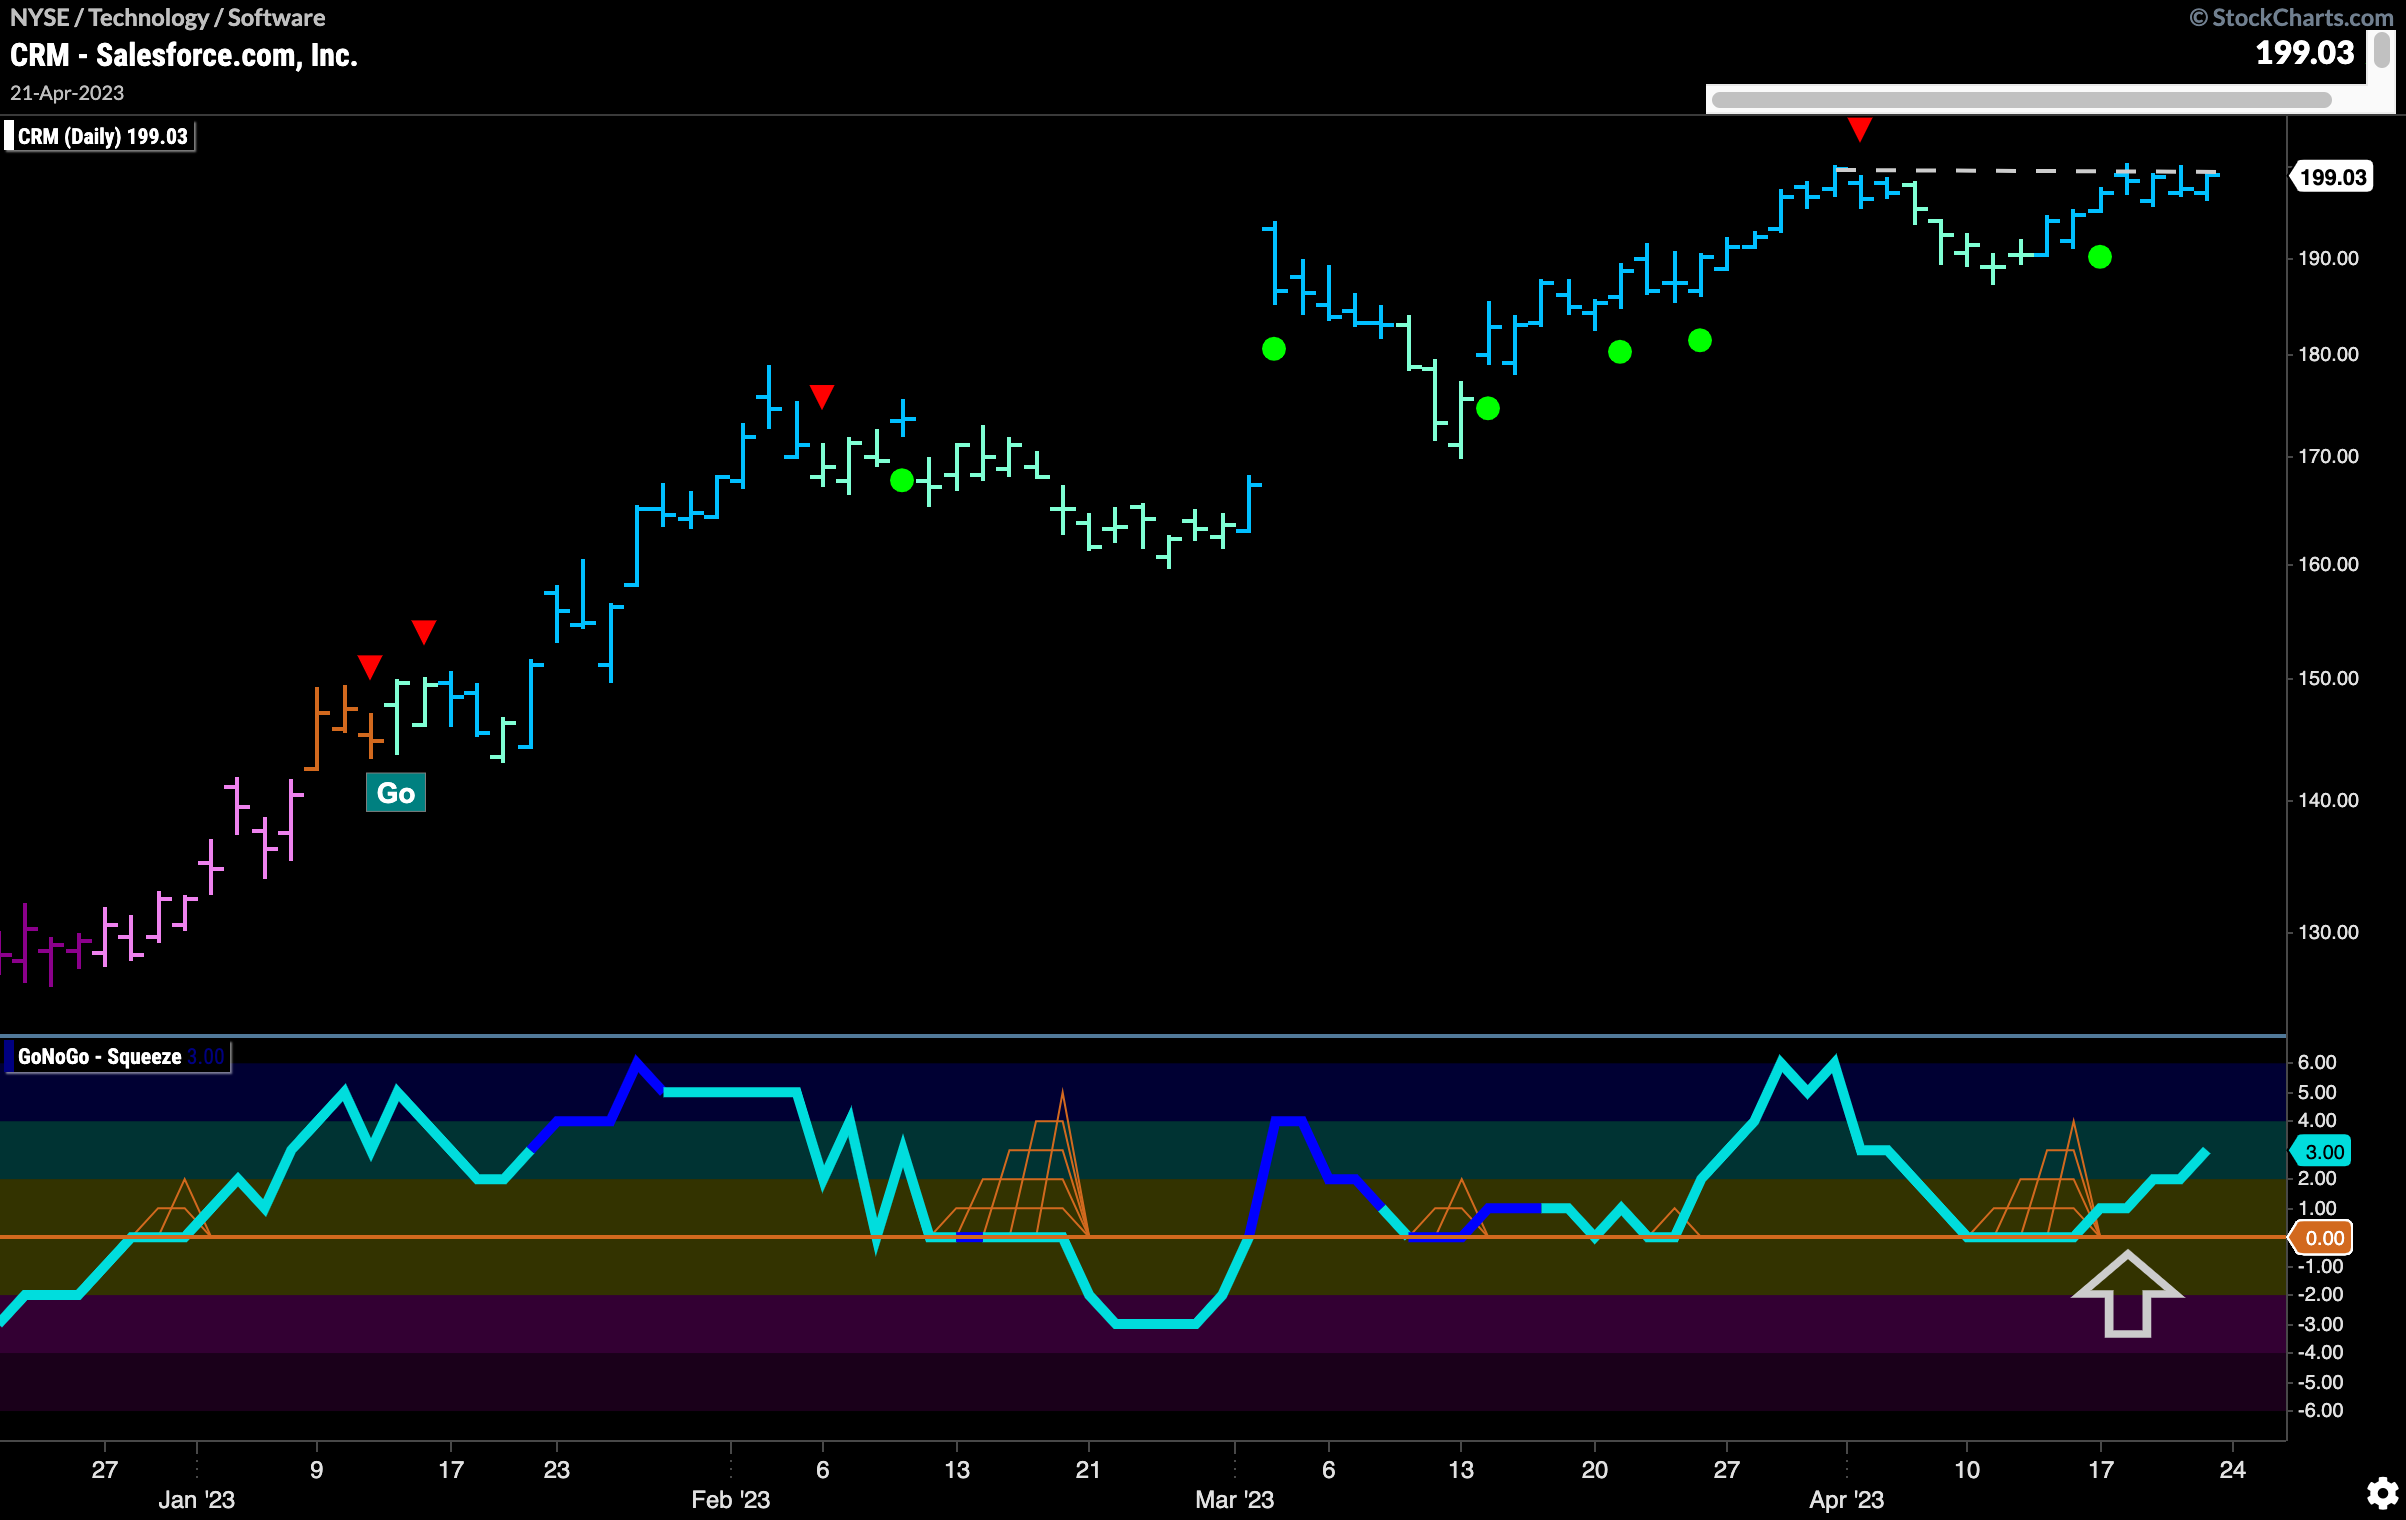
A strong performer within the software index is $CRM. We can see that the “Go” trend has been in place since early January. After a series of higher highs and higher lows price is testing the resistance from its most recent high. That high price saw a Go Countertrend Correction Icon (red arrow) which suggested price may struggle to go higher in the short term. That is what happened as GoNoGo Trend painted weaker aqua bars as price fell from that high. GoNoGo Oscillator fell to test the zero line from above where after a short GoNoGo Squeeze it rallied back into positive territory. This Go Trend Continuation (green circle) told us that price may have the momentum it needs to attack that prior high. We will watch to see if it can break higher from here.
The weekly chart below shows there is a possibility that this is just the start of a new “Go” trend. GoNoGo Trend has now painted consecutive strong blue “Go” bars as price appears to have moved above and consolidated above prior resistance. GoNoGo Oscillator is in positive territory but not yet overbought. We can look for price to move higher from here.
