Good morning and welcome to this week’s Flight Path. The week ended with all of the major asset classes painting “Go” bars. However, we saw a little uncertainty in places during trading. After a few bars of weaker aqua “Go” bars, we saw equities finish with strong blue bars at new all time highs. Treasury bond prices saw a dip into uncertainty but ended strongly. The U.S. commodities index rebounded after a “Go Fish” bar with a few strong blue bars and the dollar hung onto weaker aqua “Go” bars.
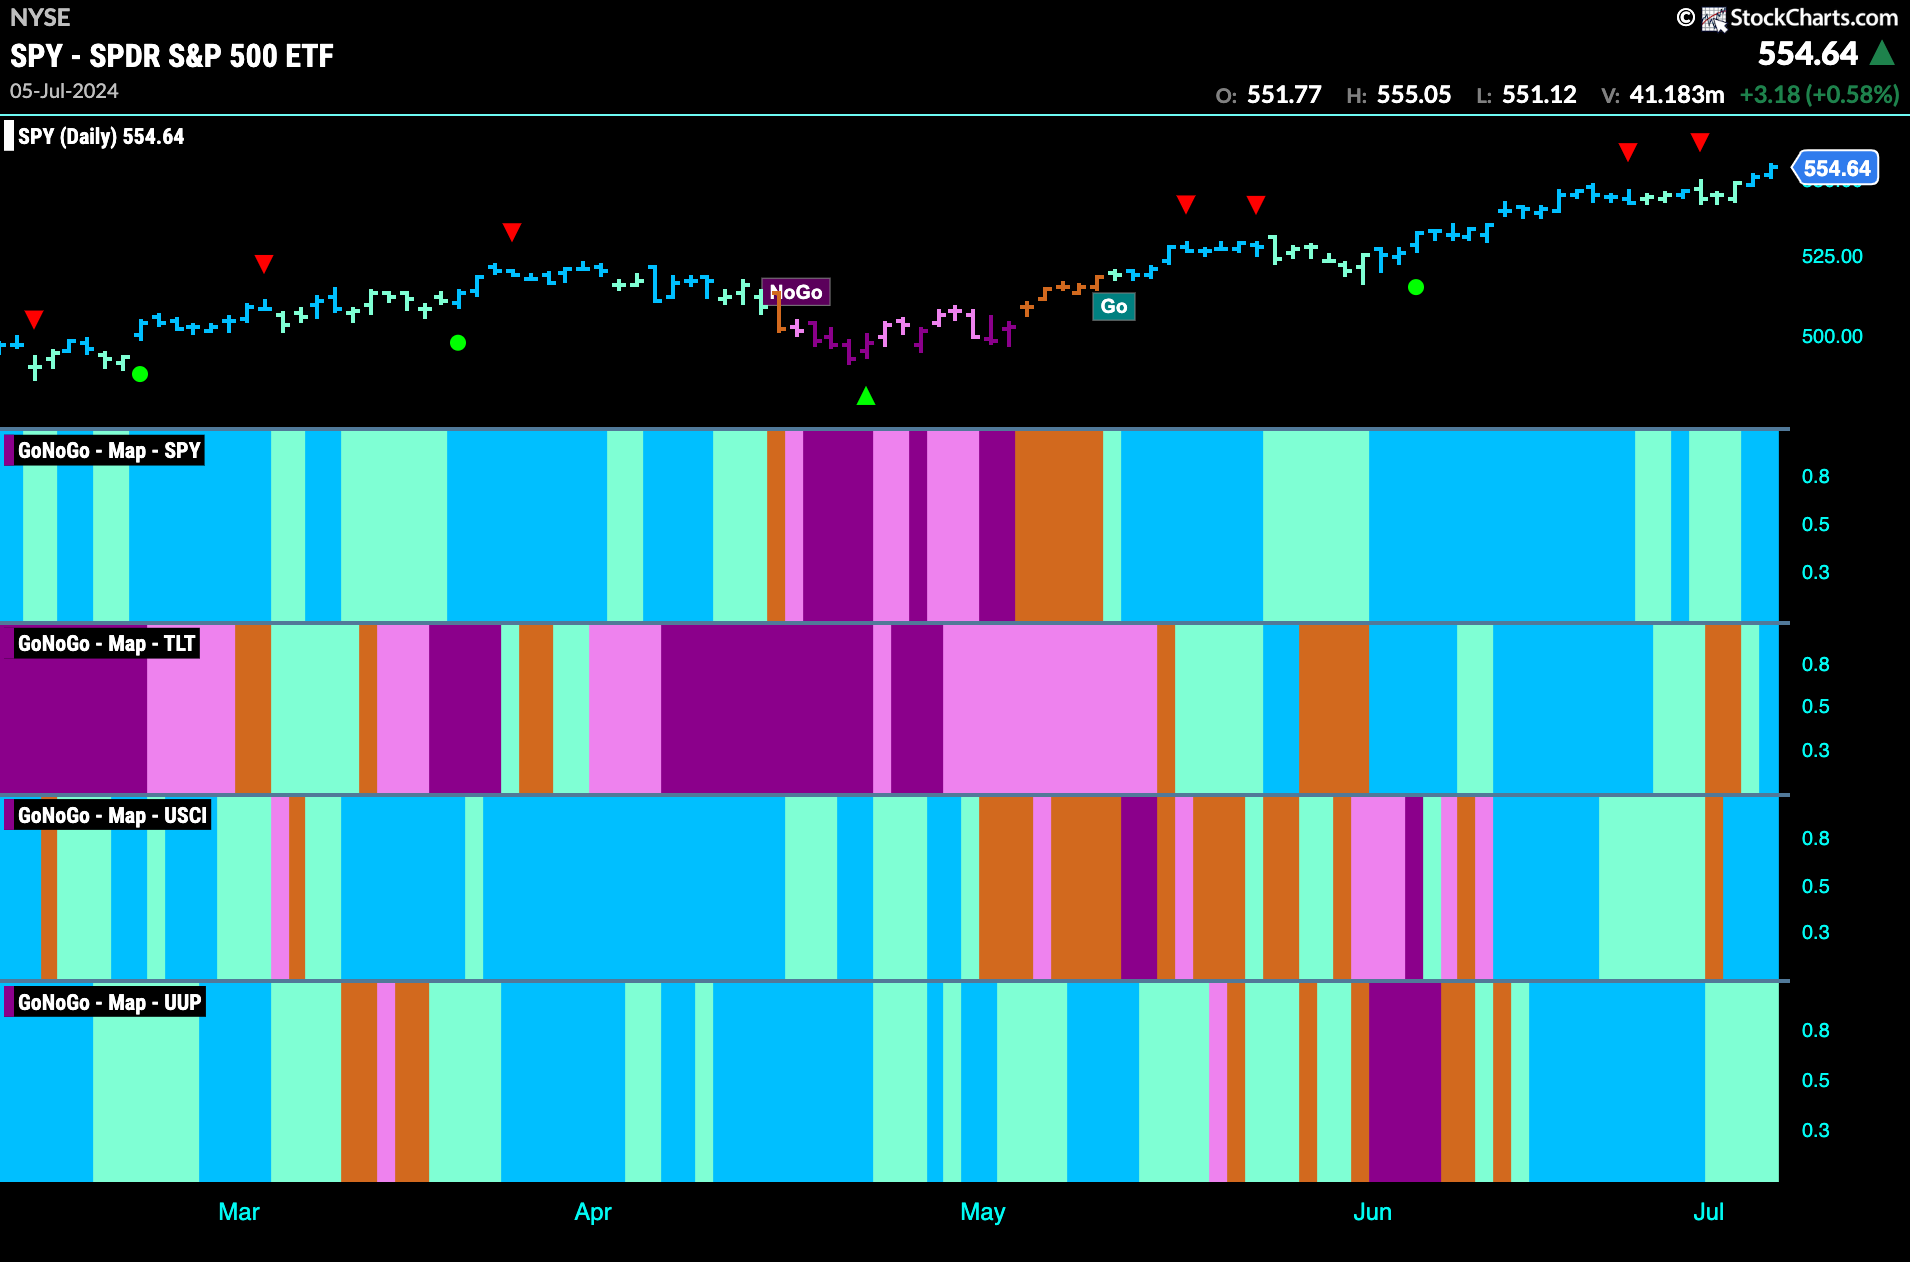
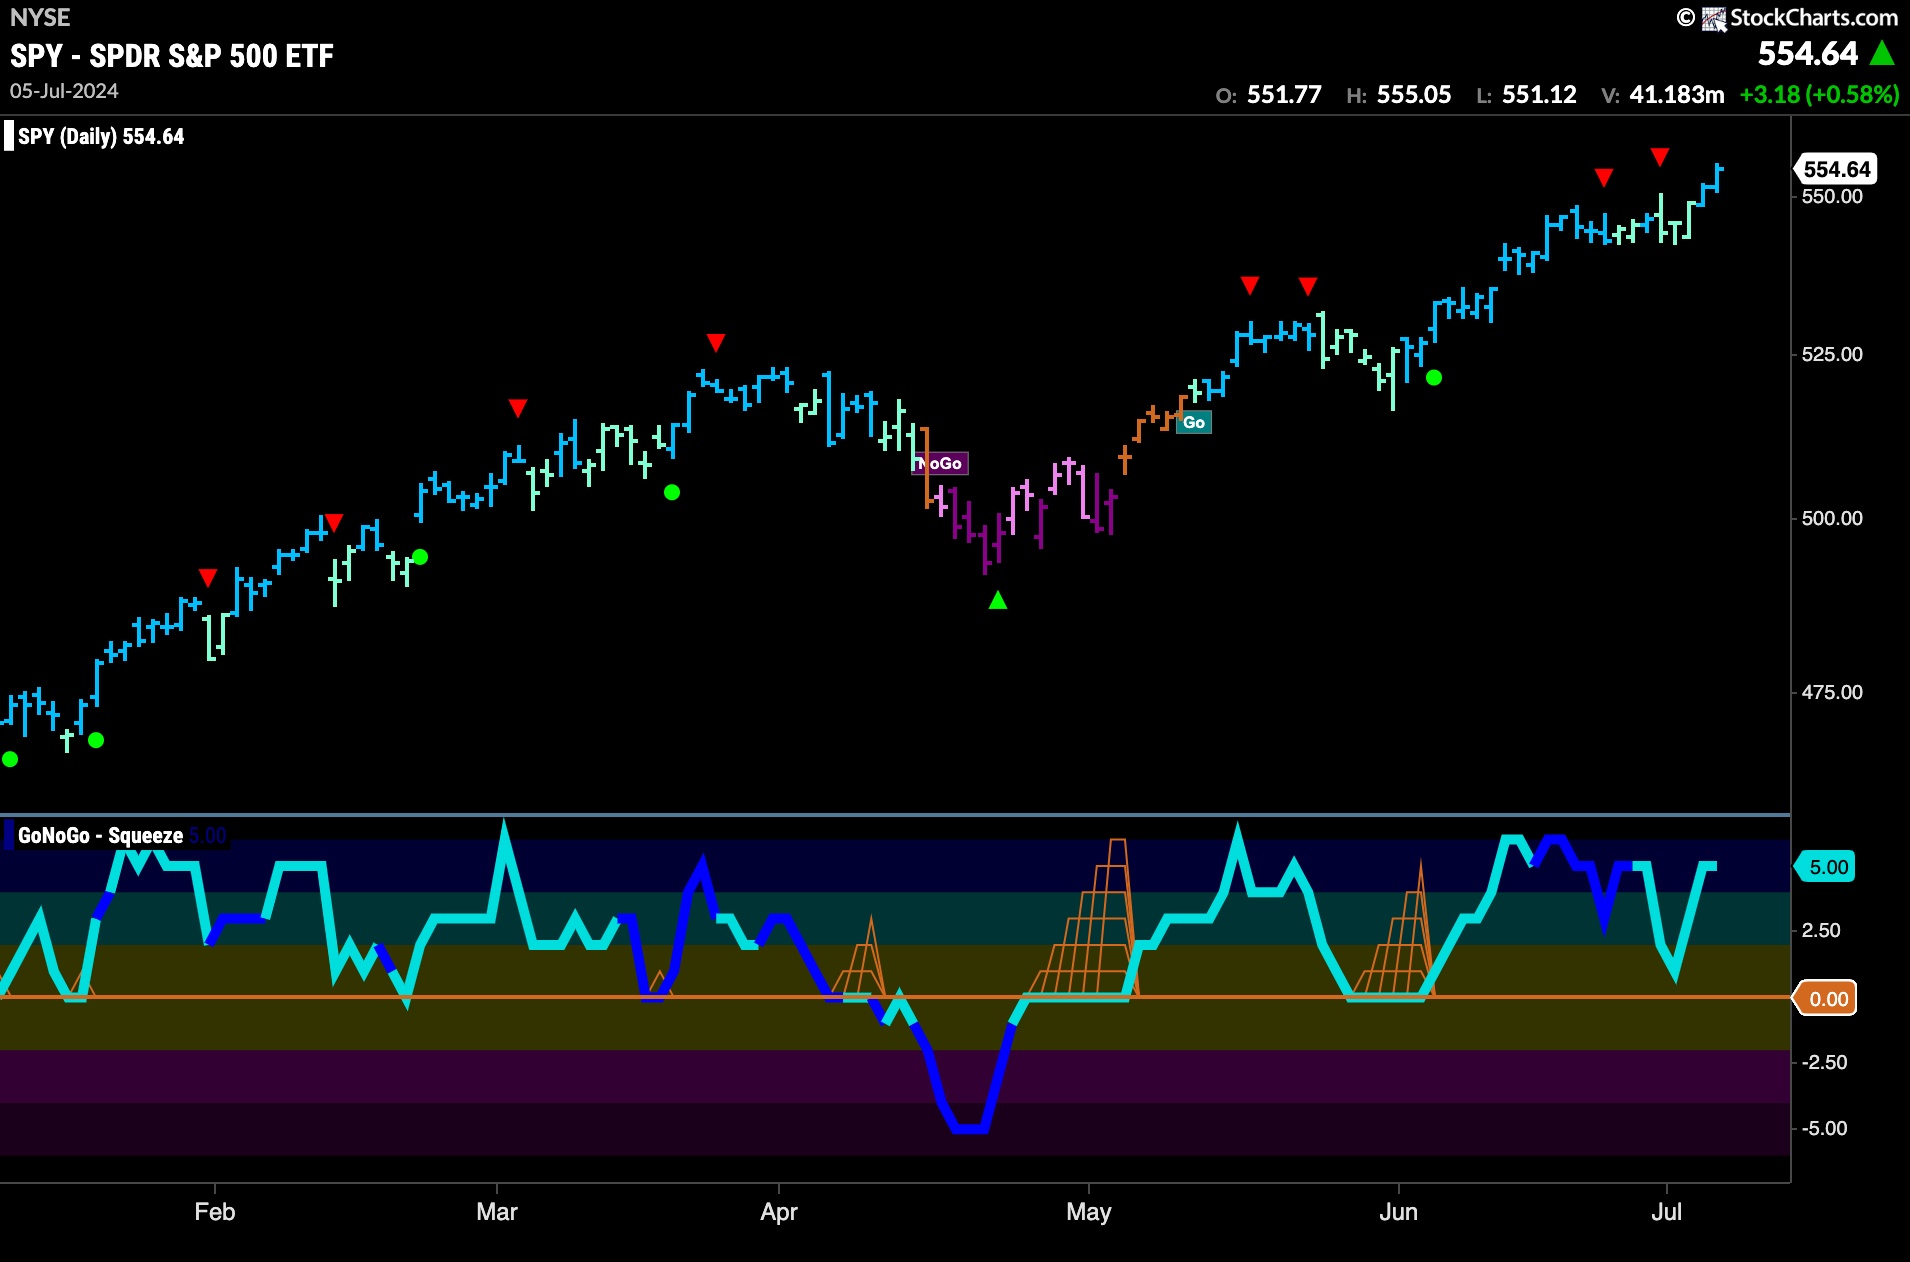
$SPY Looks Strong at the End of the Week
After a few weeks that now look like consolidation, we saw price hit new highs this week on strong blue “Go” bars. This comes after a few weaker aqua bars moved price sideways and GoNoGo Oscillator fell close to the zero level. It rallied quickly though and we are seeing strong momentum as price climbs.
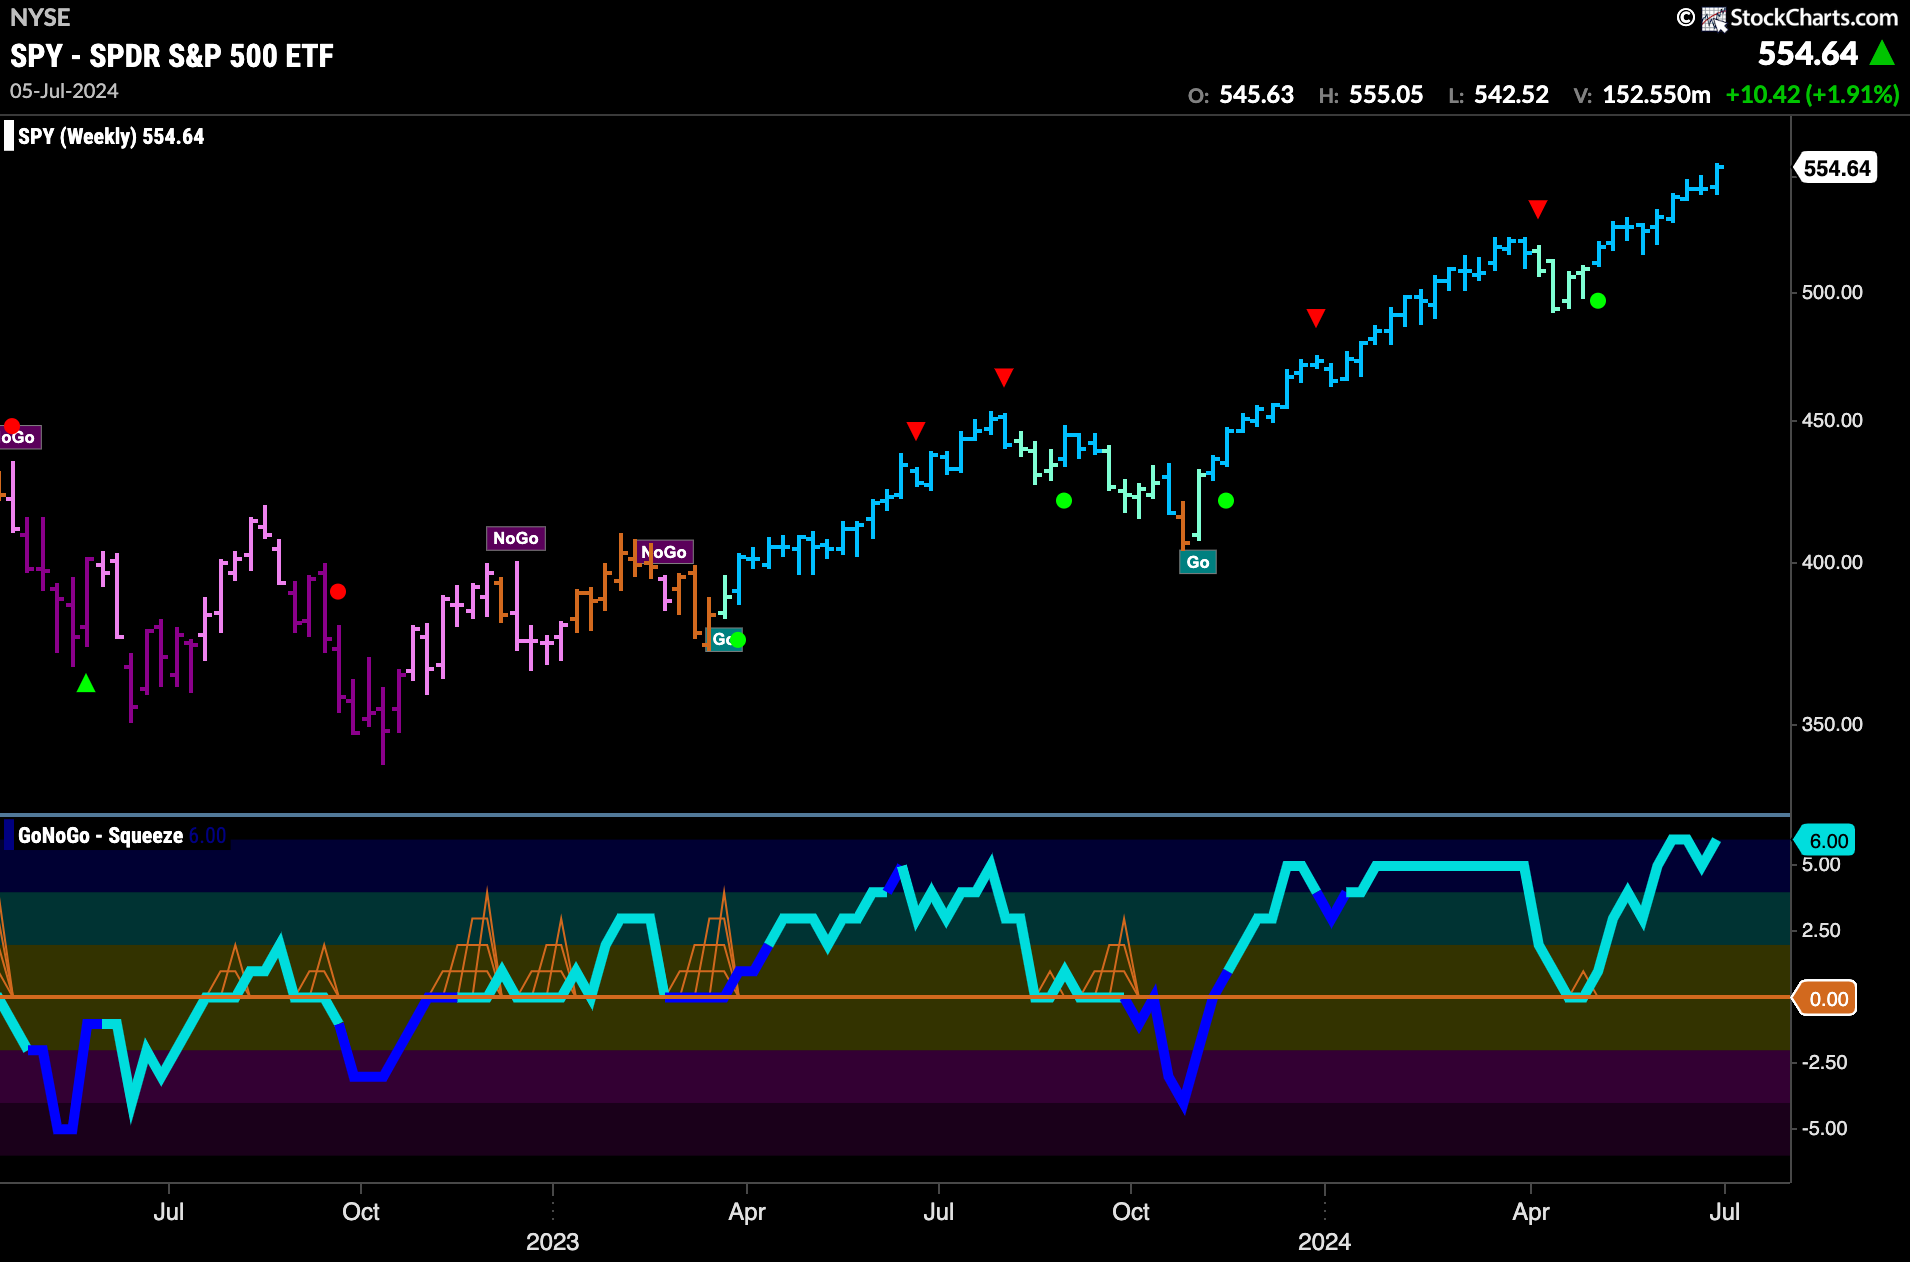
Another higher weekly close tells us that the “Go” trend remains strong on the larger timeframe. We now have seen 9 consecutive strong blue “Go” bars since the period of weakness in April. GoNoGo Oscillator stays overbought for another week which tells us how enthusiastic the market is as price soars.
Treasury Rates Return to Strong “NoGo” bars
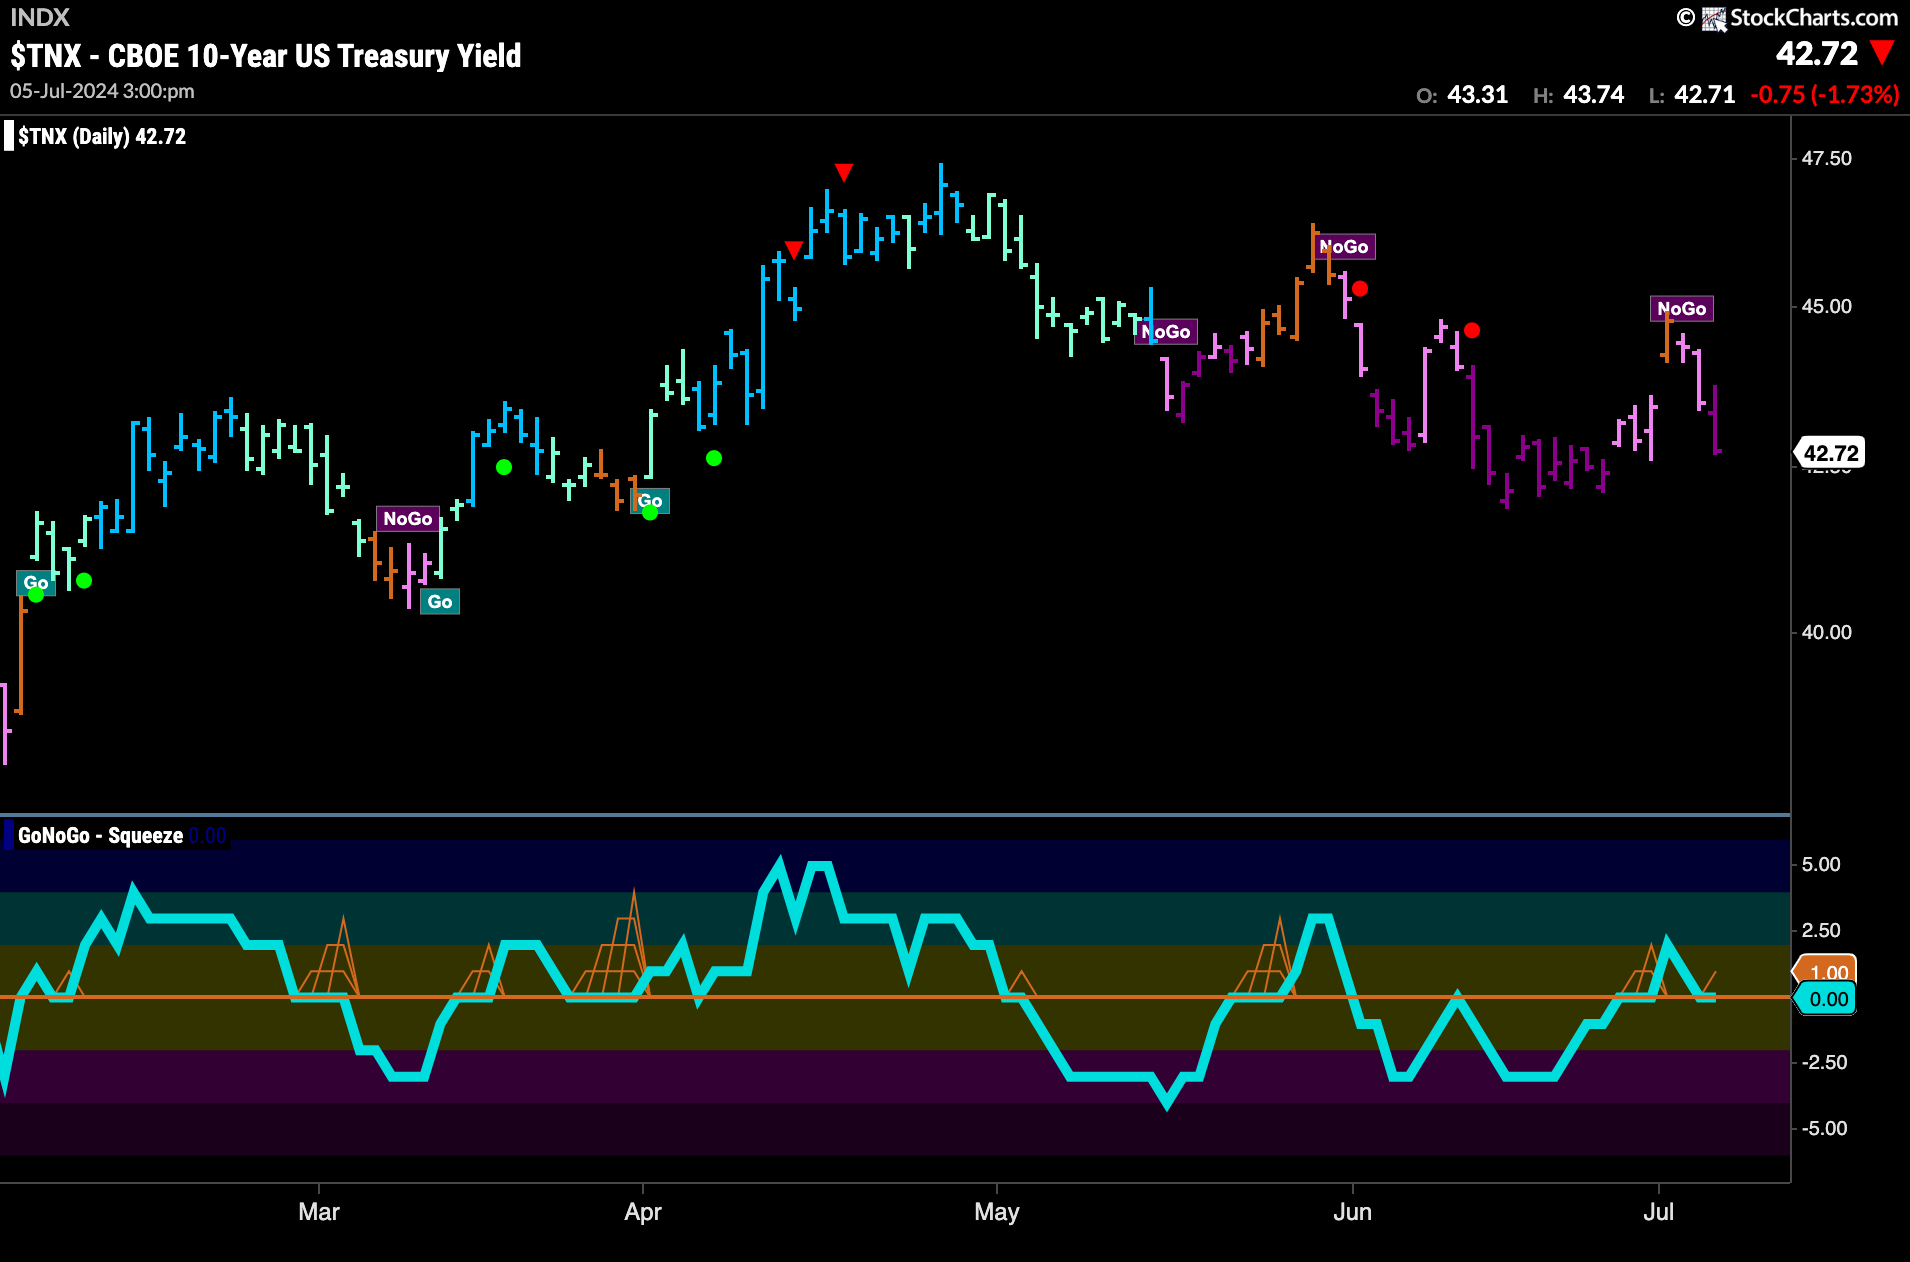
Treasury rates jumped higher earlier in the week and it was enough to make GoNoGo Trend paint an amber “Go Fish” bar. However, the “NoGo” returned as the week finished with first pink and then a strong purple bar. GoNoGo Oscillator which had broken into positive territory has quickly returned to test the zero line from above. It will be important to see if this level now offers support.
Dollar Falls from Highs on Weak Aqua “Go” Bars
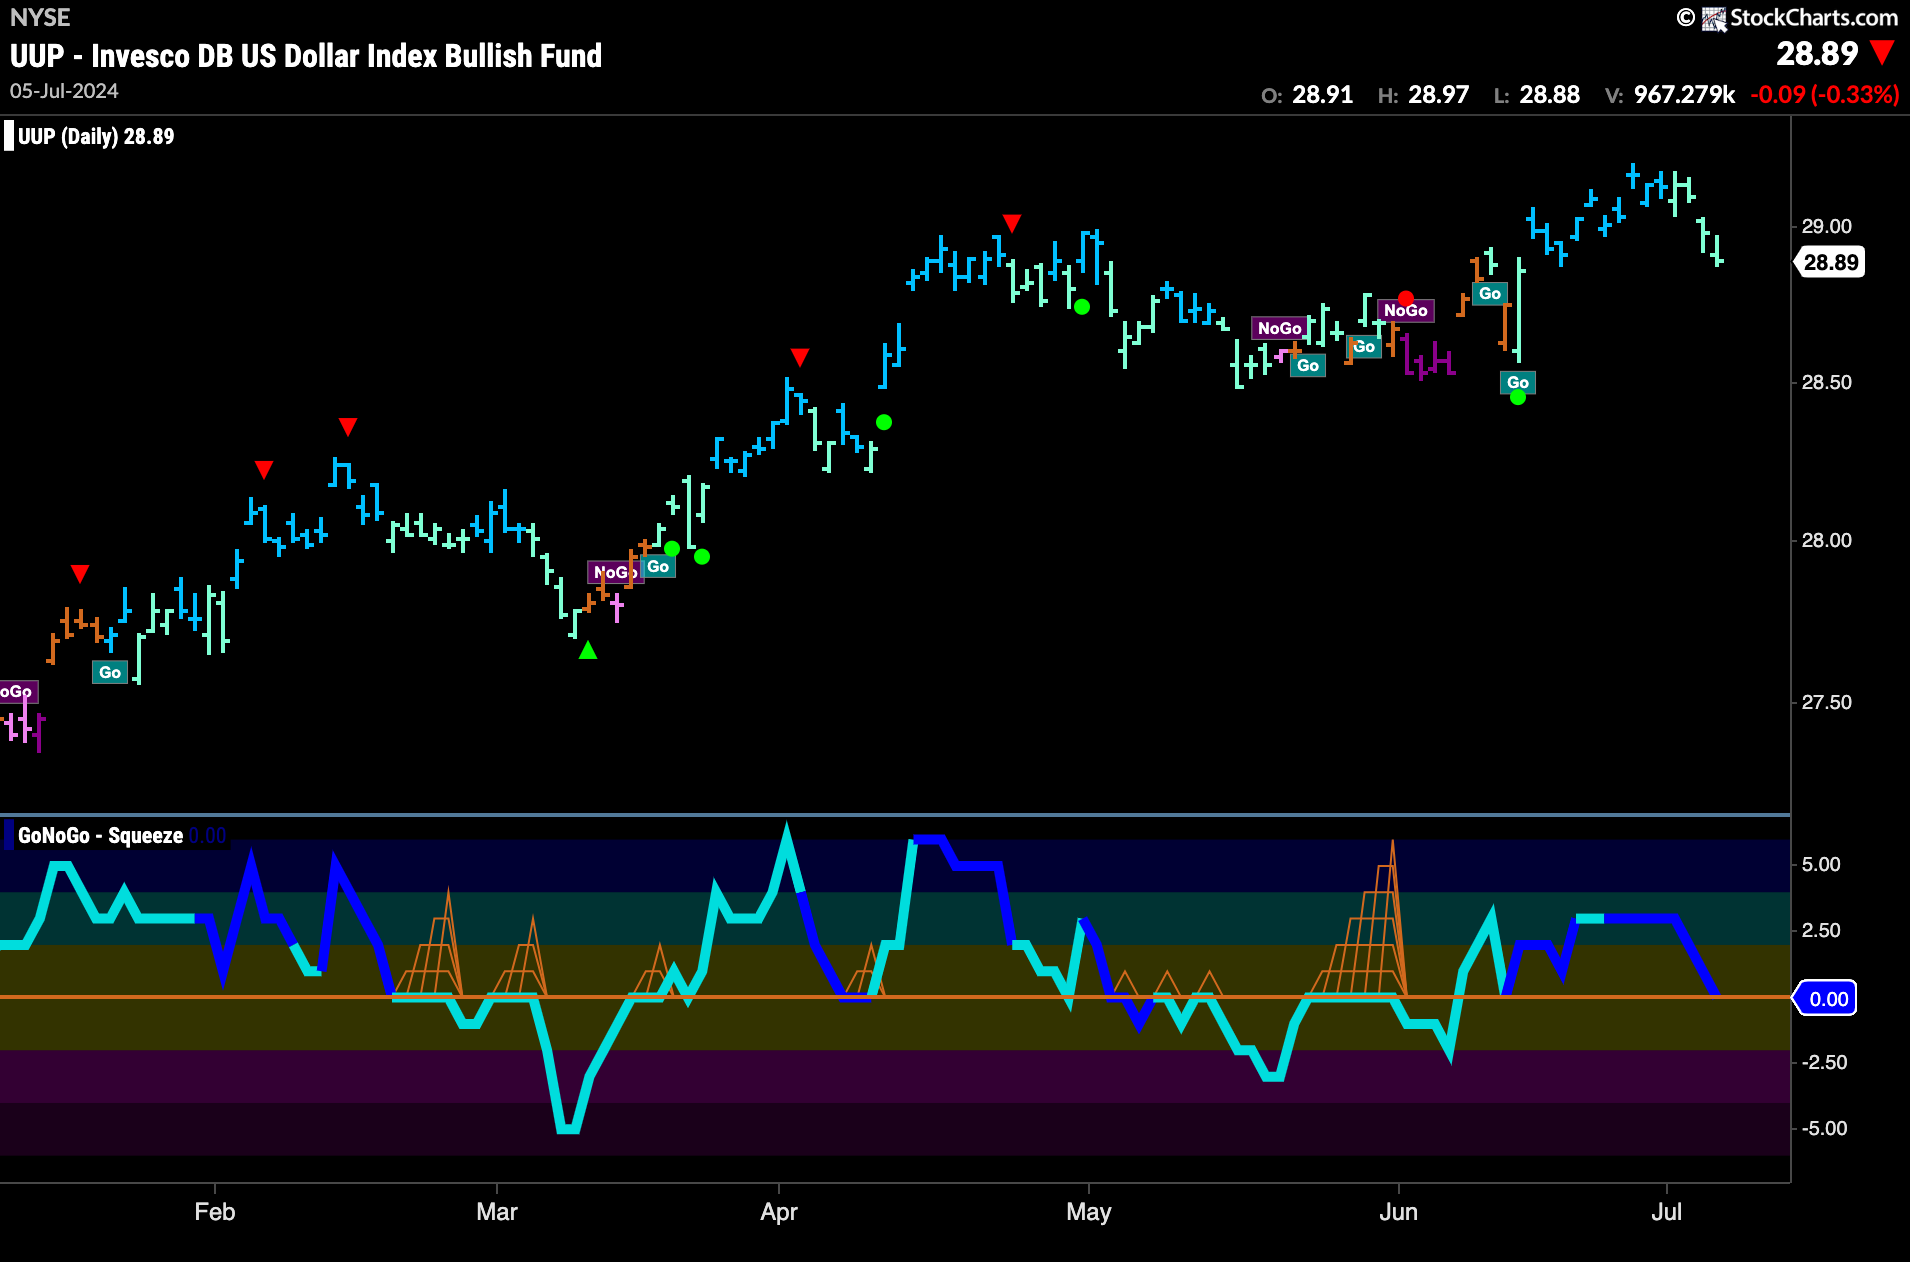
The daily chart below shows that price fell sharply from the most recent high. This week saw a predominance of weaker aqua bars as the “Go” trend shows weakness. GoNoGo Oscillator has fallen to test the zero line from above and volume is heavy. We will pay close attention to the oscillator panel this week to see if the zero level offers support. If it does, we will be able to infer that the “Go” trend is still healthy.
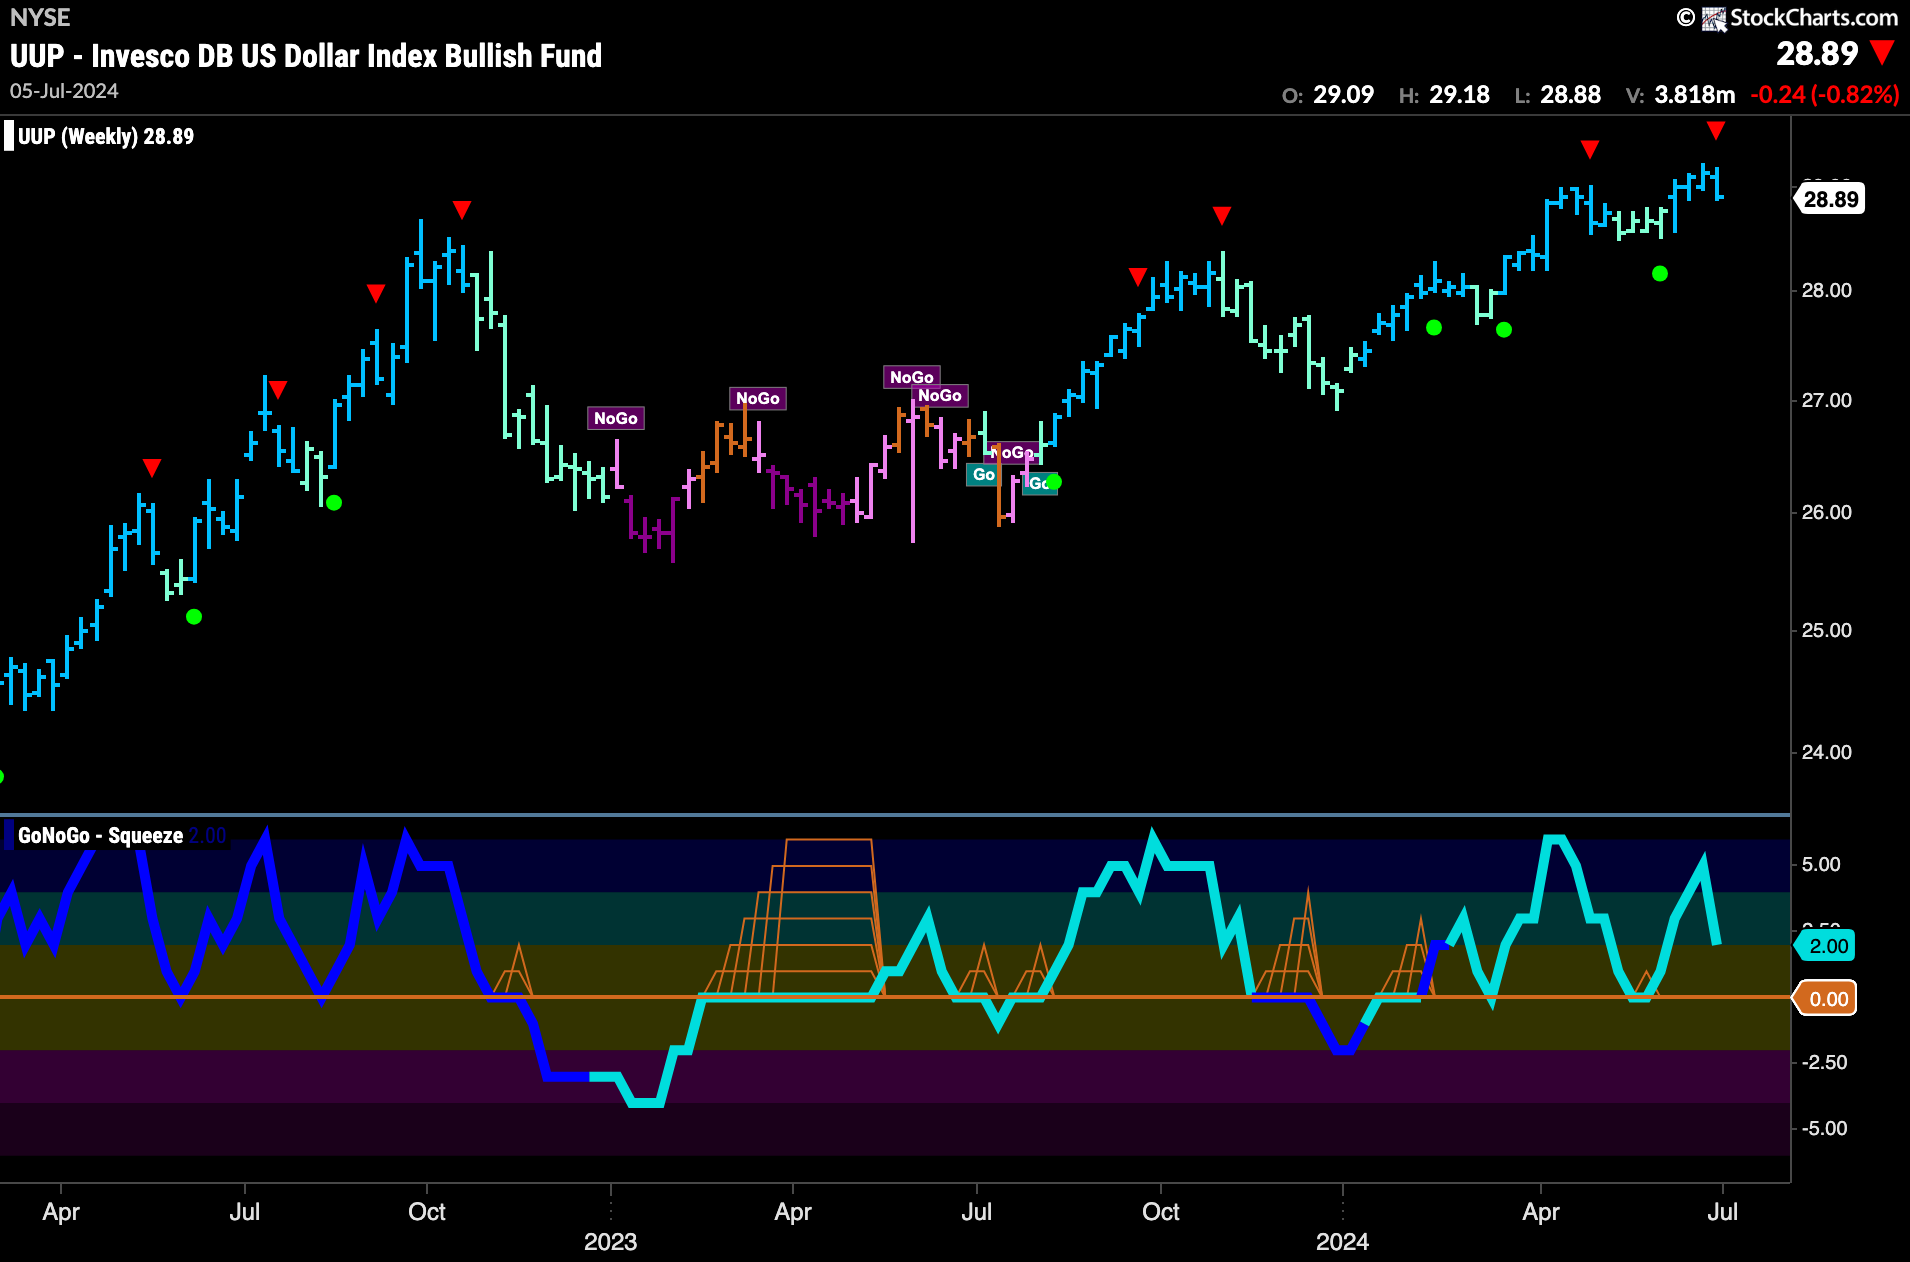
The weekly chart tells us that we are still in a persistent longer term “Go” trend with another strong blue “Go” bar. GoNoGo Oscillator has fallen from overbought territory and so the chart has triggered a Go Countertrend Correction Icon (red arrow) at a new high. We will watch the oscillator as it approaches the zero line to see if it finds support at that level.
USO Paints More Strong Blue “Go” Bars at Key Level
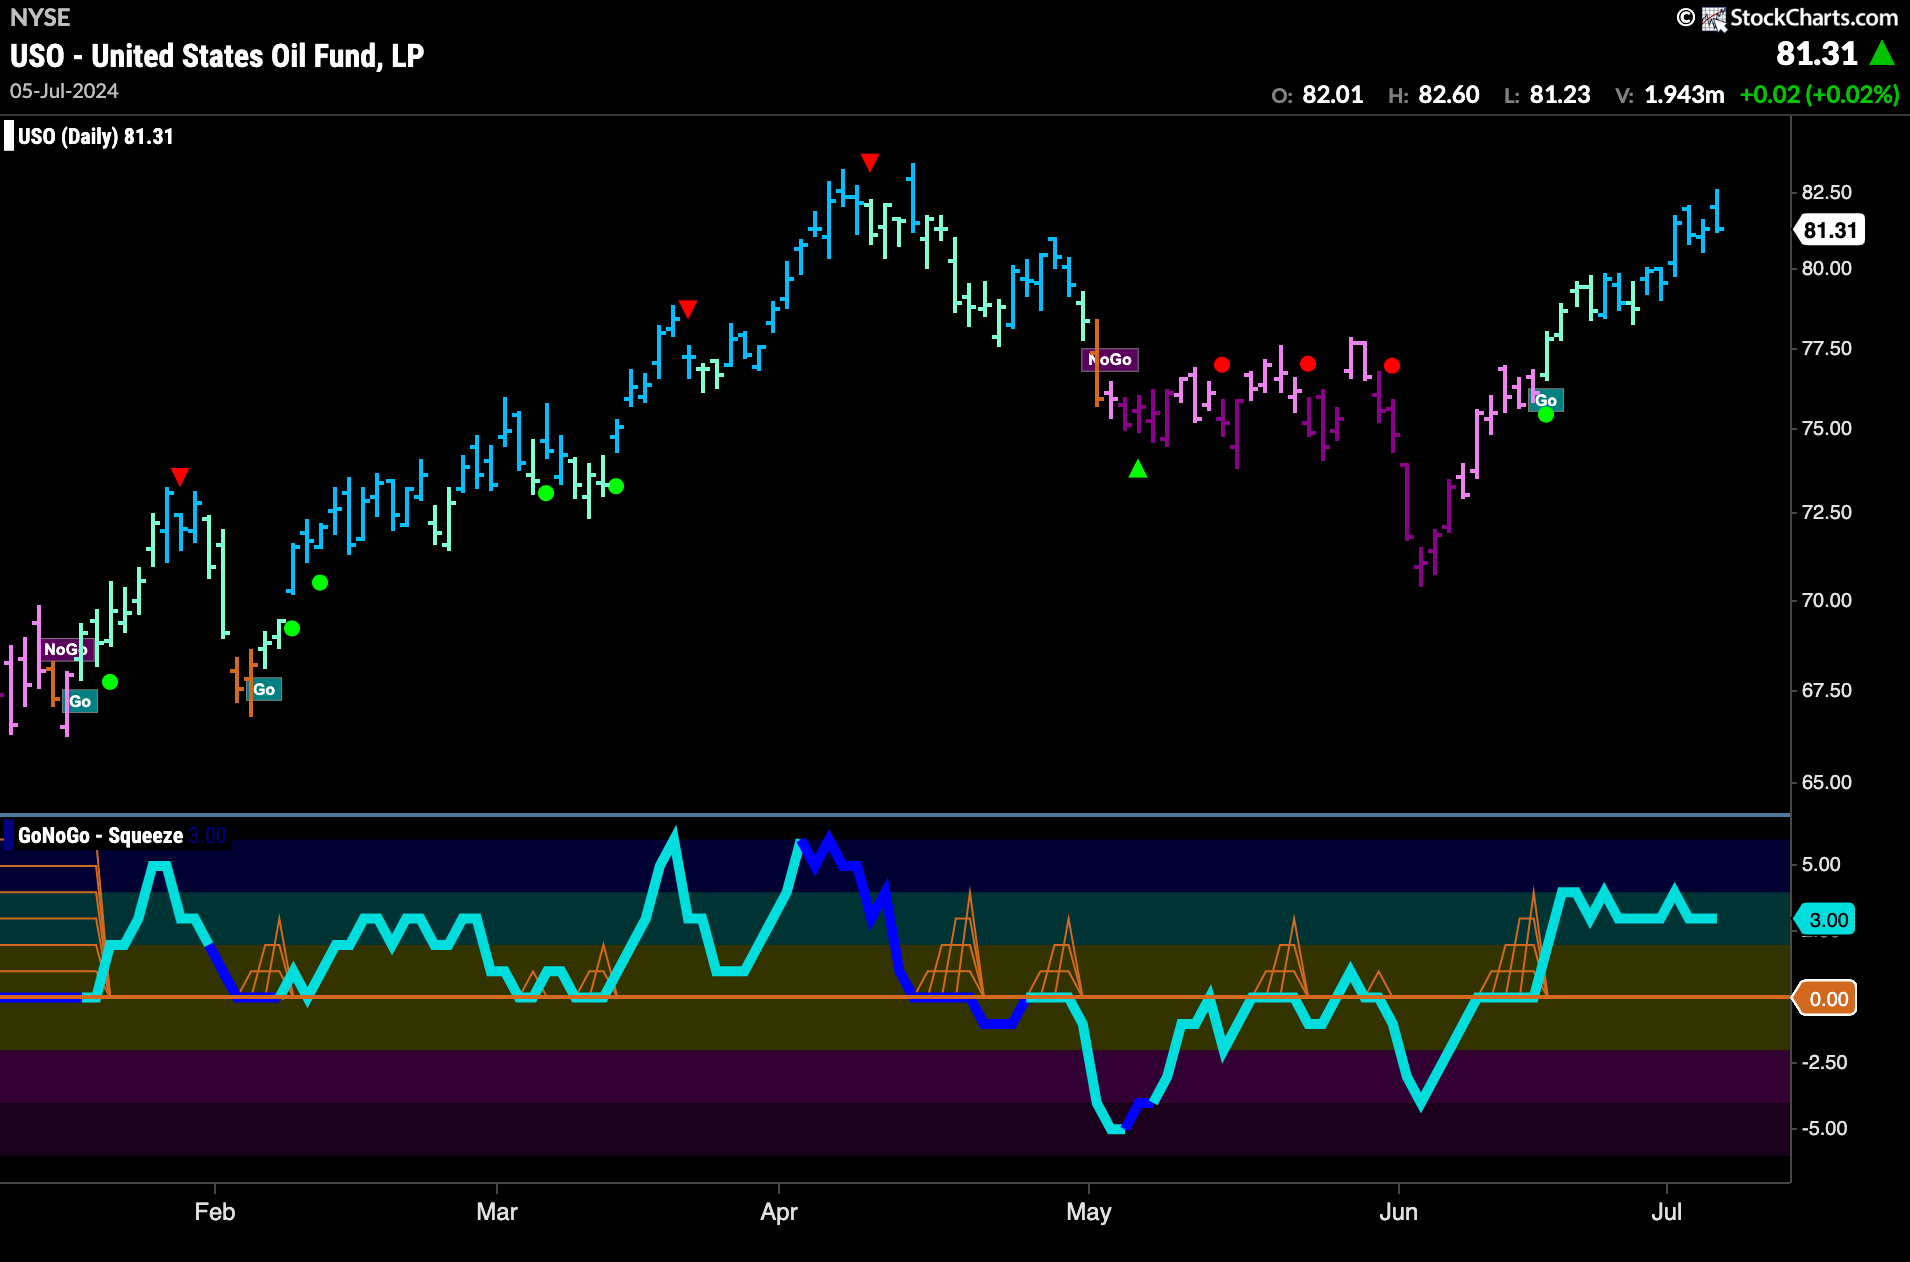
GoNoGo Trend painted a full week of strong blue “Go” bars as price rose close to highs from April. GoNoGo Oscillator is in positive territory but not oversold and so we will see if price can push on to new highs with momentum on its side.
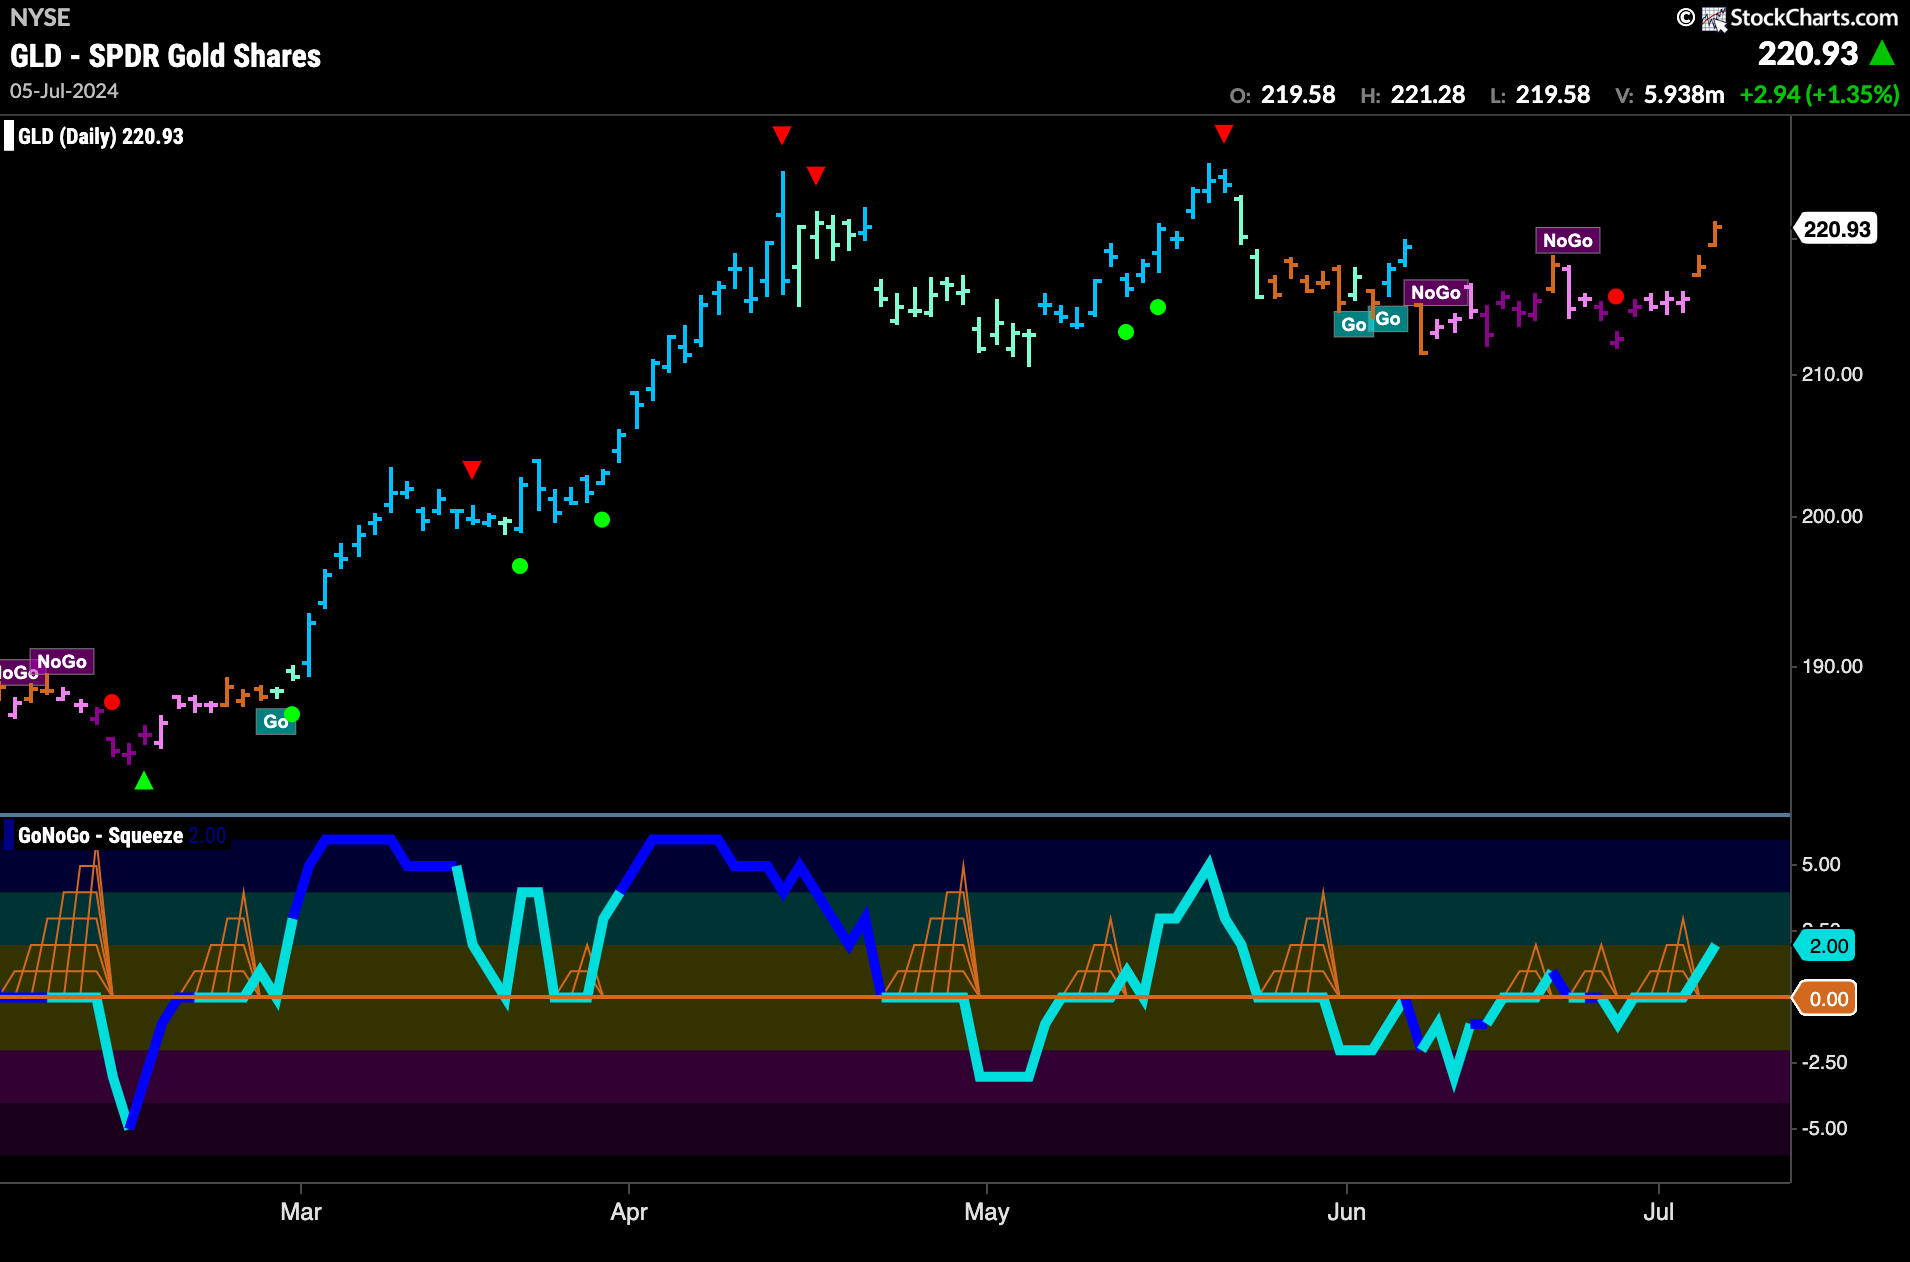
Gold Enters Period of Uncertainty in Trading Range
Price rallied as the week came to a close. After consistently finding support at the bottom of the range close to the May lows, we saw GoNoGo Trend first paint weaker pink bars and then a couple of amber “Go Fish” bars. GoNoGo Oscillator has also broken into positive territory after a few weeks of being unable to distance itself from that level. We will see if this positive momentum will help push price higher and into a new “Go” trend.
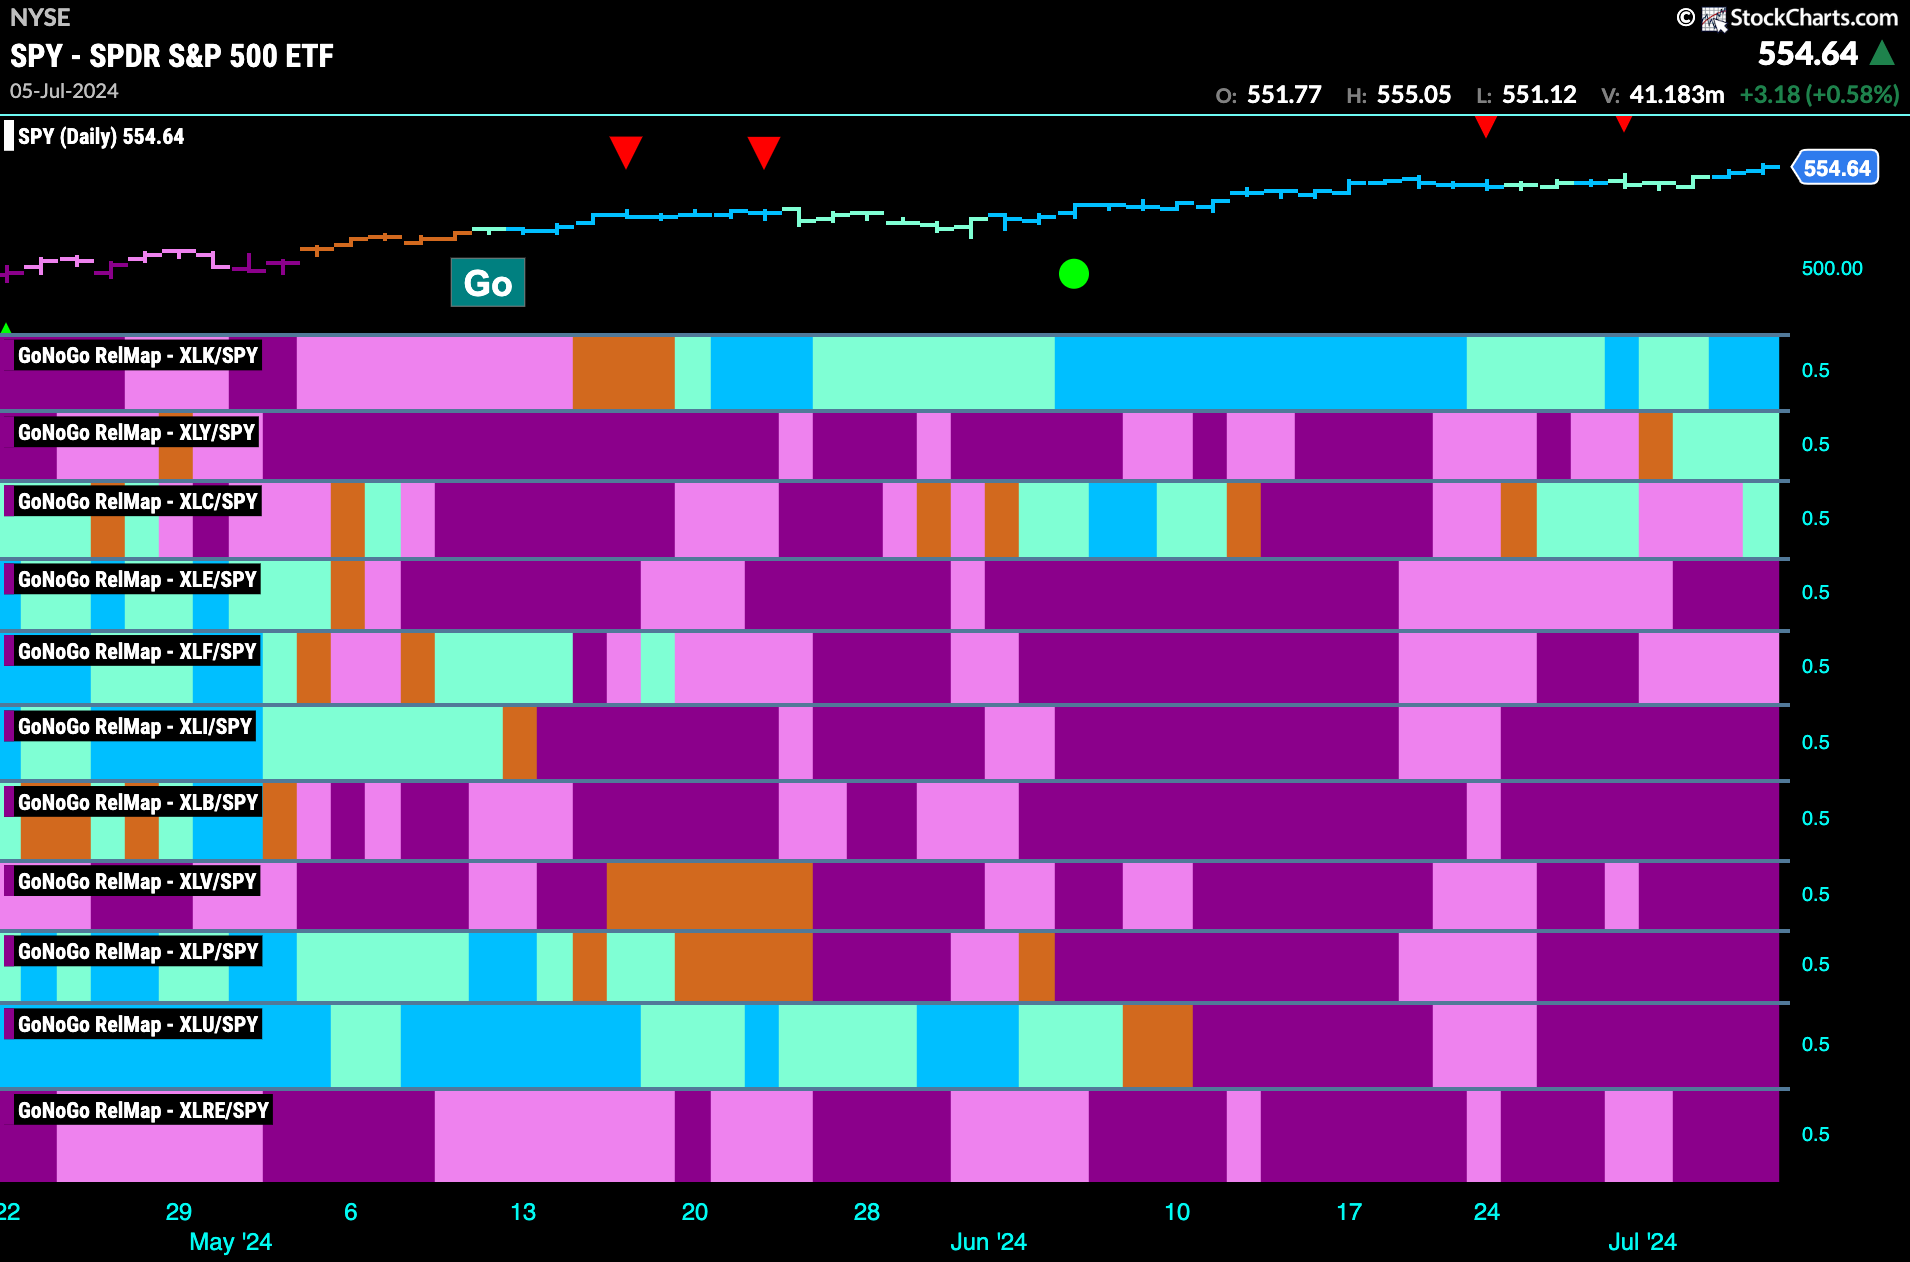
Sector RelMap
Below is the GoNoGo Sector RelMap. This GoNoGo RelMap applies the GoNoGo Trend to the relative strength ratios of the sectors to the base index. Looking at the map, we can see that 3 sectors are outperforming the base index this week. $XLK, $XLY and $XLC are painting relative “Go” bars.
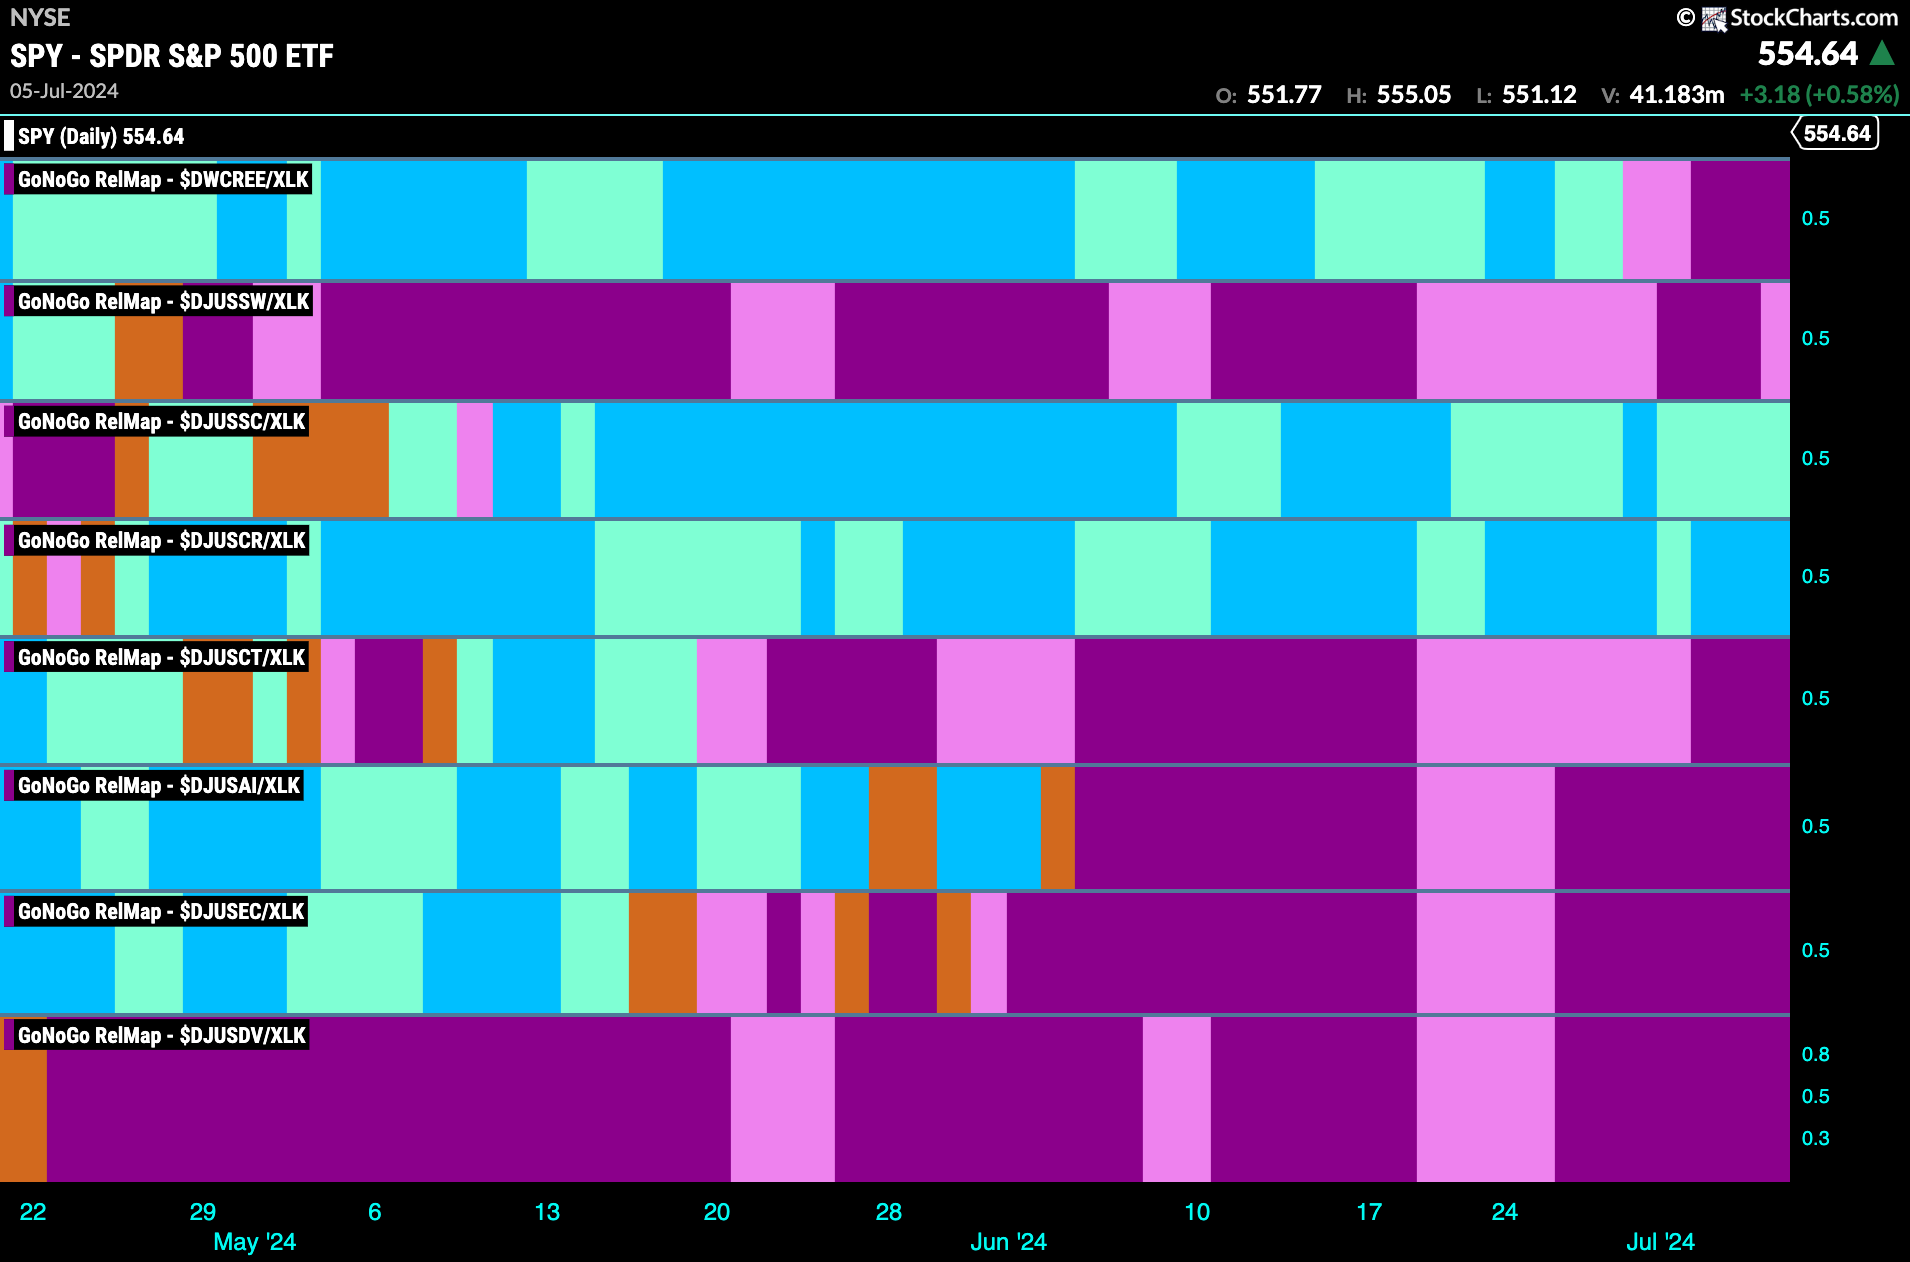
Technology Sub-Group RelMap
As we saw above, the technology sector has continued to outperform is painting strong blue relative “Go” bars. The sector has been the most persistent out-performer of late and that continued this week. If we look at the Sub Group RelMap below we can see that the out-performance is being driven by two sectors. Semi-conductors and computer hardware are the relative leaders with computer hardware painting stronger blue “Go” bars.
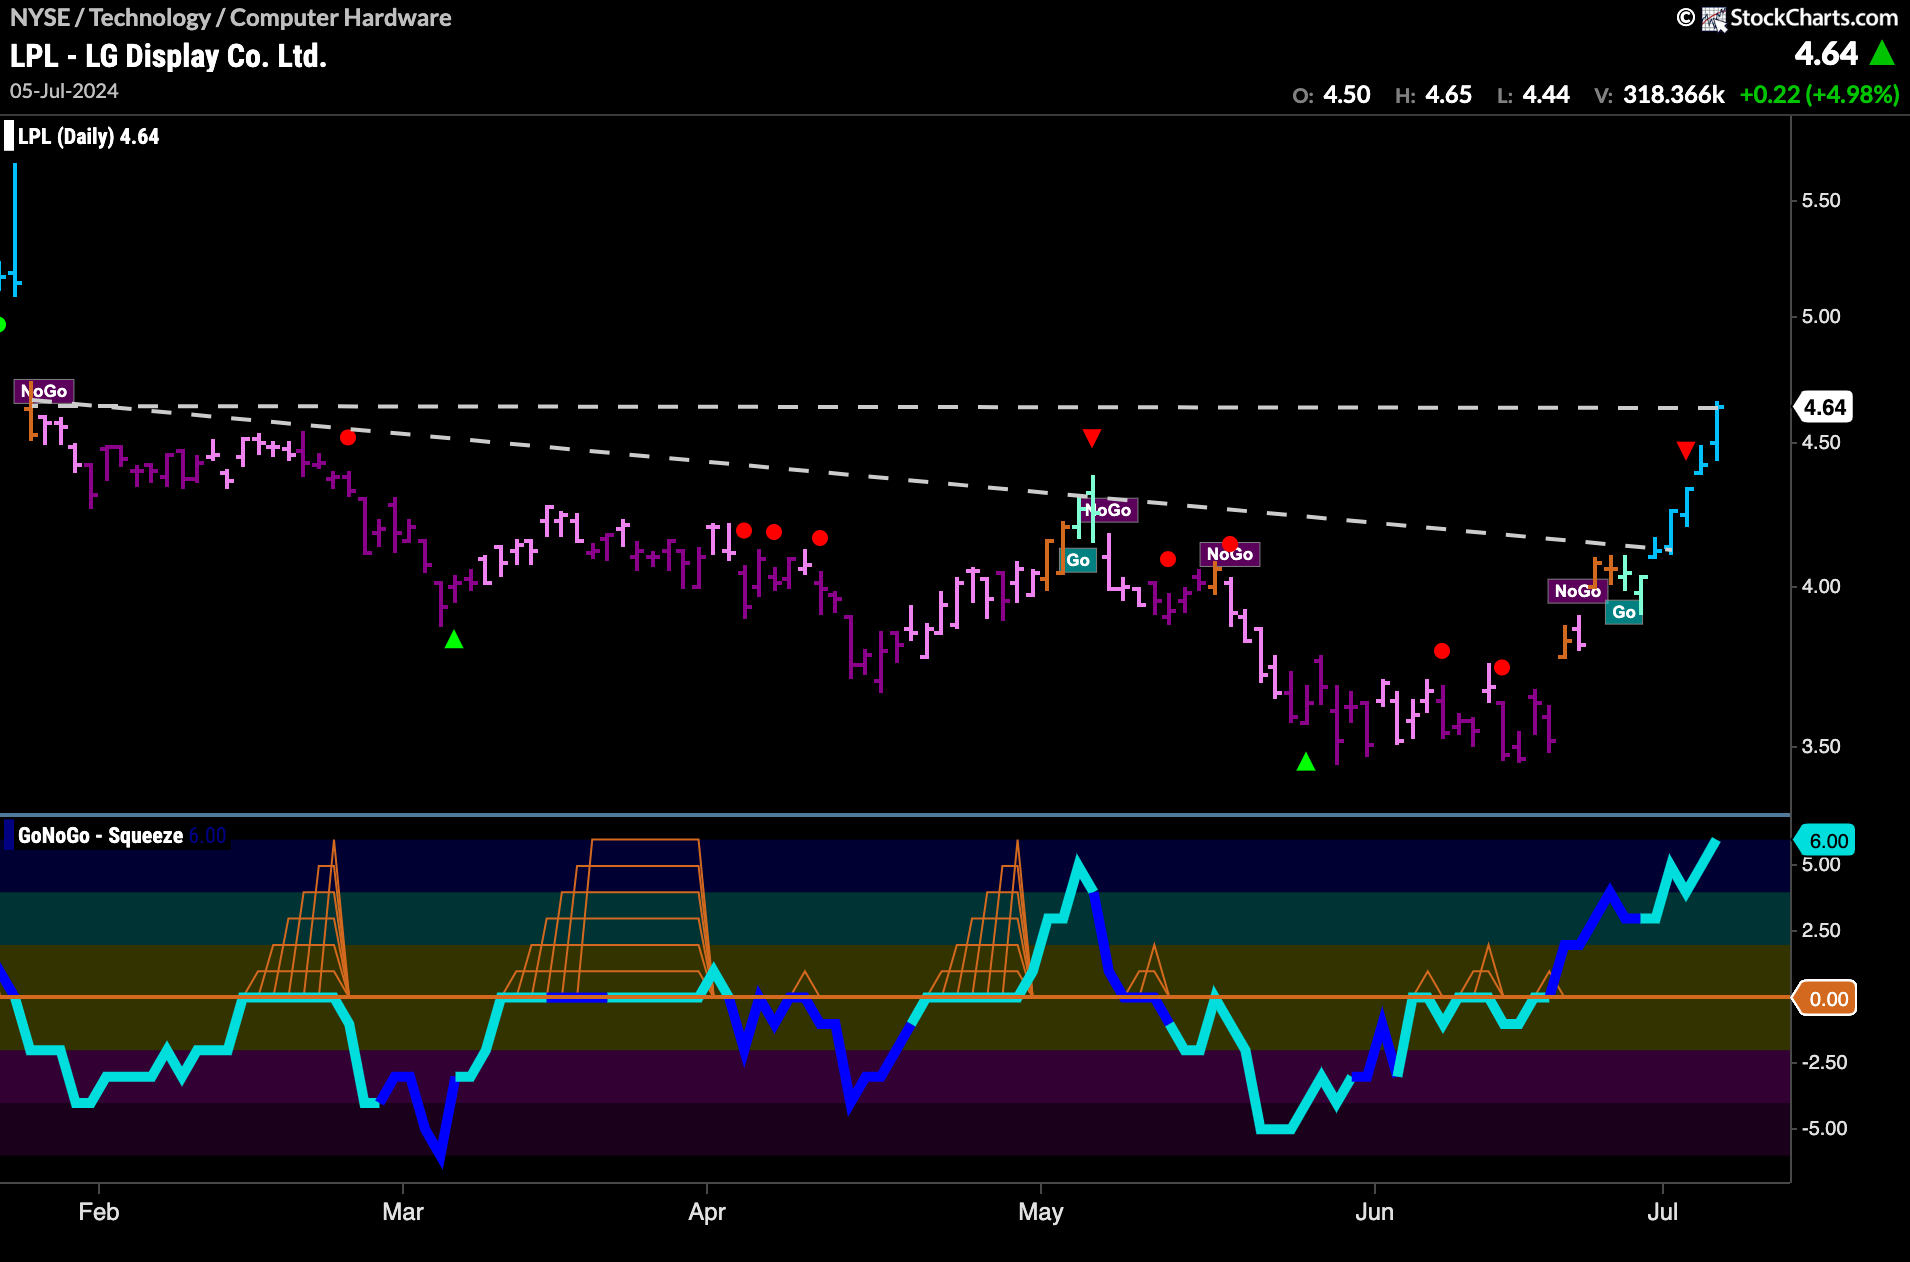
$LPL in Strong “Go” Trend as it Runs Up Against Resistance
$LPL has seen a new “Go” trend emerge. Price rallied off the lows a few weeks ago and GoNoGo Trend displayed market uncertainty with amber “Go Fish” bars before the trend changed and painted aqua “Go” bars followed by stronger blue bars. GoNoGo Oscillator tipped us off to this change when it burst through the zero line on heavy volume in June. We will watch to see if surging momentum and strong trend conditions will allow price to break above horizontal resistance.
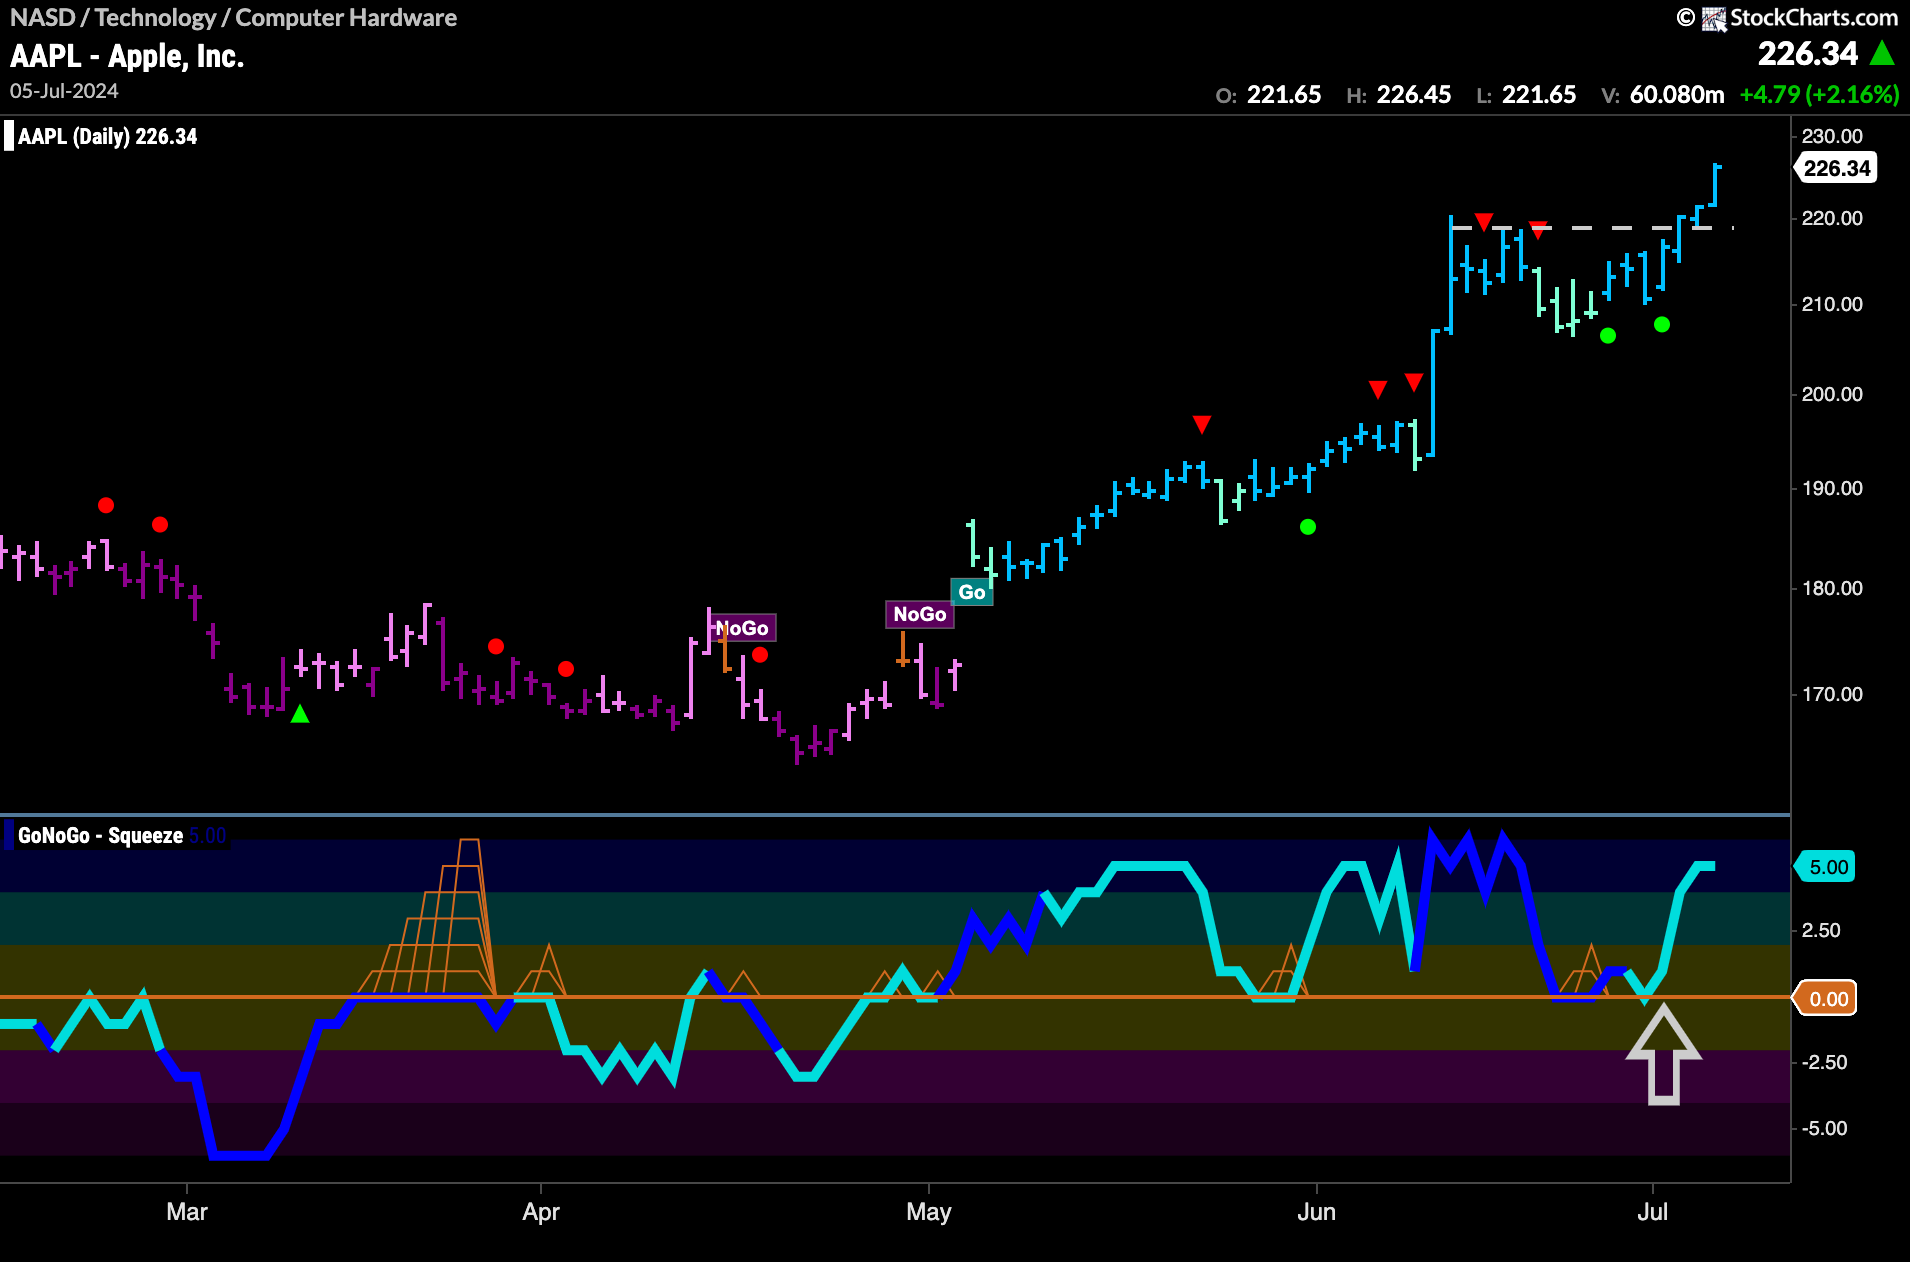
$AAPL Sees Price Break to New Highs
The price chart of $AAPL below shows that the trend is strong. Having been in a “Go” trend since early May we have seen GoNoGo Oscillator finding support at the zero level. Last month, we saw Go Countertrend Correction Icons (red arrows) and price fell temporarily and GoNoGo Trend painted some weaker aqua bars. GoNoGo Oscillator found support at zero and so confirmed the “Go” trend with continuation icons (green circles). Now, price has broken to new higher highs with surging momentum. We will look for price to move higher from here.
