
Good morning and welcome to this week’s Flight Path. The equity “Go” trend continued this week as we see the week end with stronger blue bars. Treasury bond prices saw a return to a “Go” trend as rates fall. U.S. commodities were able to maintain the “Go” trend albeit with the indicator painting weaker aqua bars. The dollar, in a “Go” trend now for several months saw the trend continue but we did see a little weakness with aqua bars.

$SPY Hangs on to “Go” Trend
The GoNoGo chart below shows that after a few bars of weakness $SPY was able to rally for most of the week and GoNoGo Trend painted strong blue bars. Price is has not been able to set a new higher high so that will be important to watch for this week. GoNoGo Oscillator is testing the zero line from below and we see a GoNoGo Squeeze building to its Max. If it breaks out of the GoNoGo Squeeze into positive territory then we will expect price to make a run at a new higher high.

On the longer term chart, GoNoGo Trend tells us that the trend is still strong. We are looking to consolidate at prior highs having seen GoNoGo Oscillator find support at the zero line. If we see momentum return on the daily chart above, we will expect price to consolidate here and look to go even higher over the coming weeks.

Treasury Rates Enter “NoGo” Trend
GoNoGo Trend shows that the “Go” trend gave way this week to “NoGo” bars. We have seen mostly strong purple bars after the “Go” ended and we will watch to see if this week rates make an attempt at a new low. This change in trend should have come as no surprise as GoNoGo Oscillator broke out of a GoNoGo Squeeze a few weeks ago into negative territory. This informed us that momentum was out of step with the “Go” trend. Now with a “NoGo” trend in place and momentum negative but not oversold, we will watch to see if rates move lower.

The Dollar Looks for Positive Momentum in “Go” Trend
GoNoGo Trend continued to paint “Go” bars this week but after failing to make a higher high we see weakness with the indicator painting aqua bars. GoNoGo Oscillator shows that there is a tug of war happening between buyers and sellers at this level with a Max GoNoGo Squeeze in effect. It will be important to watch the breakout of the Squeeze for an indication of price’s next direction. If the Squeeze is broken into positive territory then this would be a good sign for dollar bulls.

$USO Sees Weakness Turn into a “NoGo”
$USO’s continued slide saw GoNoGo Trend finally paint an amber “Go Fish” bar that was immediately followed by a pink “NoGo”. This informs us that there is downside pressure on price. This movement lower came after a Go Countertrend Correction Icon (red arrow) at the last high and that was followed by GoNoGo Oscillator breaking out of a small GoNoGo Squeeze into negative territory. With price firmly stuck in a range, we will see if any trend can be maintained.

$GLD Soars to New Highs on Strong “Go” Bars
GoNoGo Trend painted a week of uninterrupted strong blue “Go” bars as the trend proved to be strong this week. New highs were set on strong blue bars as we are well above the highs from late last year. GoNoGo Oscillator continues to show market enthusiasm as the oscillator maintains overbought readings at a value of 5 and volume is heavy.

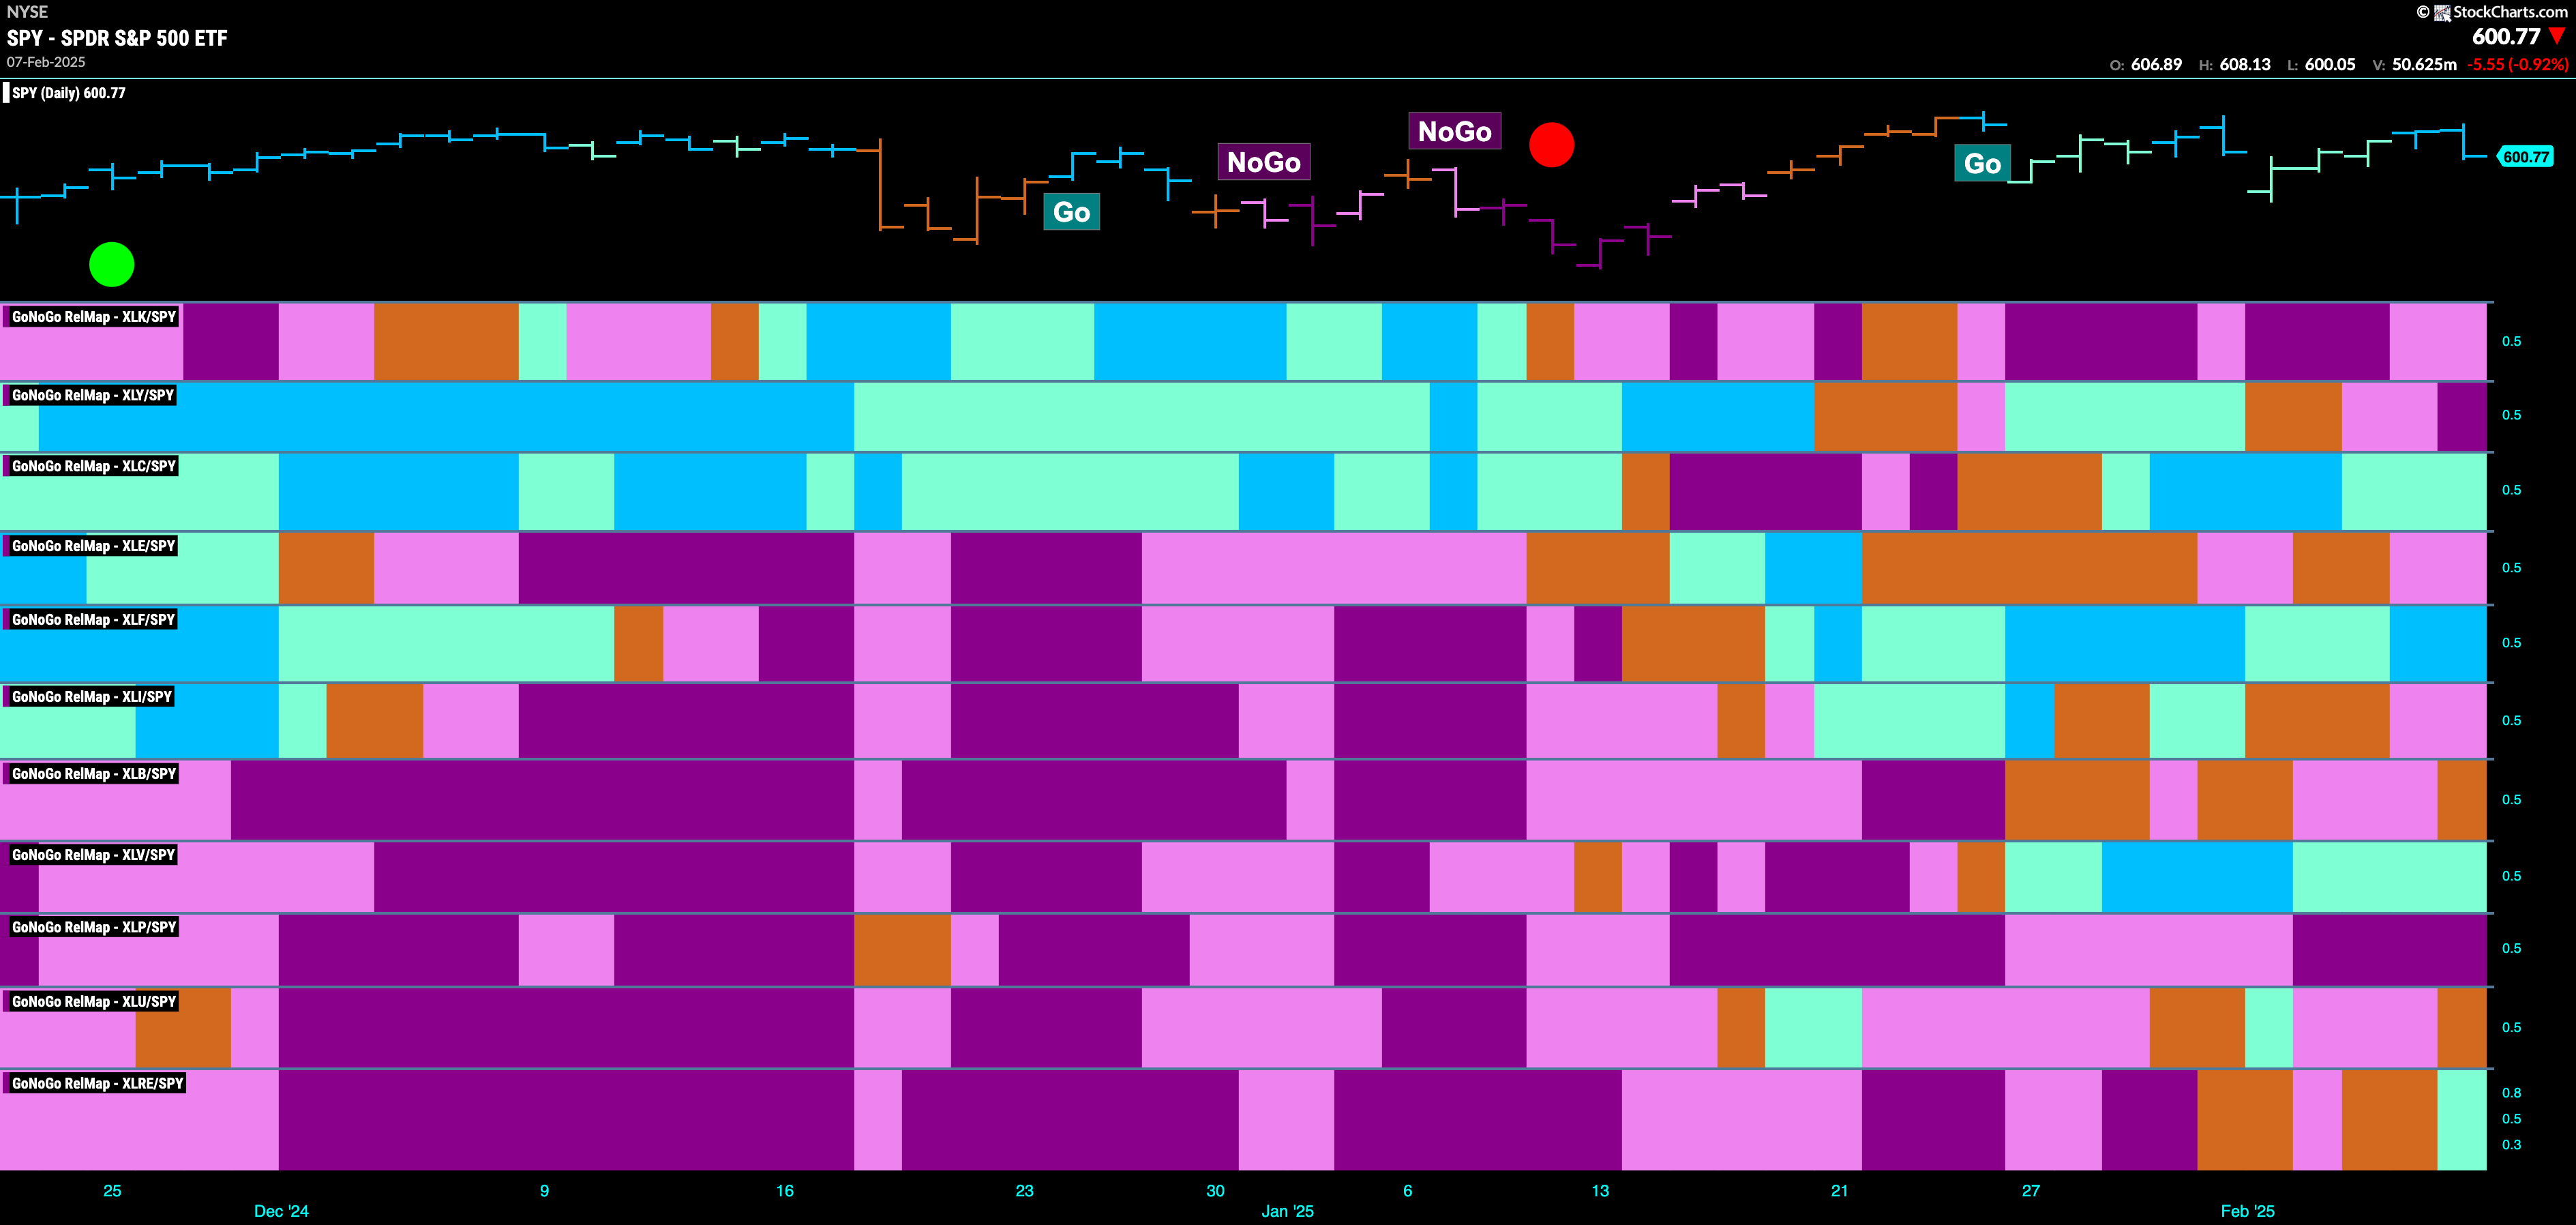
Sector RelMap
Below is the GoNoGo Sector RelMap. This GoNoGo RelMap applies the GoNoGo Trend to the relative strength ratios of the sectors to the base index. With this view we can get a sense of the relative out performance and relative underperformance of the sectors. 4 sectors are in relative “Go” trends. $XLC, $XLF, $XLV, and $XLRE are painting relative “Go” bars.

Financials Sub-Group RelMap
The chart below shows a relative trend breakdown of the sub groups within the financials sector this week. The Sub-Group RelMap plots the GoNoGo Trend of each sub index to the $XLF. We saw in the above GoNoGo Sector RelMap that $XLF is strong relatively speaking as it paints bright blue relative “Go” bars to the S&P 500. If we look at the breakdown of the groups in the map below we can see where that outperformance is coming from. Painting “Go” bars in the 8th panel is the mortgage finance sub group.

$SNFCA Looks to Make New High
After GoNoGo Oscillator found support at the zero line a week ago, price made a run at overhead resistance in the form of prior highs. It looks to have temporarily failed and we see a Go Countertrend Correction icon (red arrow) telling us that in the short term price may struggle to go higher. With a “Go” trend in place we will watch the oscillator panel. If it finds support at zero as it falls to that level we will expect price to make another run at breaking that resistance level and setting a new higher high.

$TREE Looks for Support in New “Go” Trend
$TREE entered a “Go” trend a few weeks ago and this is now a crucial moment. As the trend looks to develop, GoNoGo Oscillator has fallen to test the zero level from above and we see a Max GoNoGo Squeeze as buyers struggle with sellers for direction. If the oscillator breaks out of the GoNoGo Squeeze into positive territory we can expect the trend to continue and for price to make a run at a new higher high in the coming days and weeks.


