Good morning and welcome to this week’s Flight Path. Equities saw the “Go” trend remain strong with an uninterrupted week of strong blue “Go” bars. Treasury bond prices remained in the “Go” trend as well but we saw weaker aqua bars as the week ended. U.S. commodities returned to a “Go” trend but the indicator painted weaker aqua bars this week. The dollar held on to its strong “NoGo” trend with purple bars.
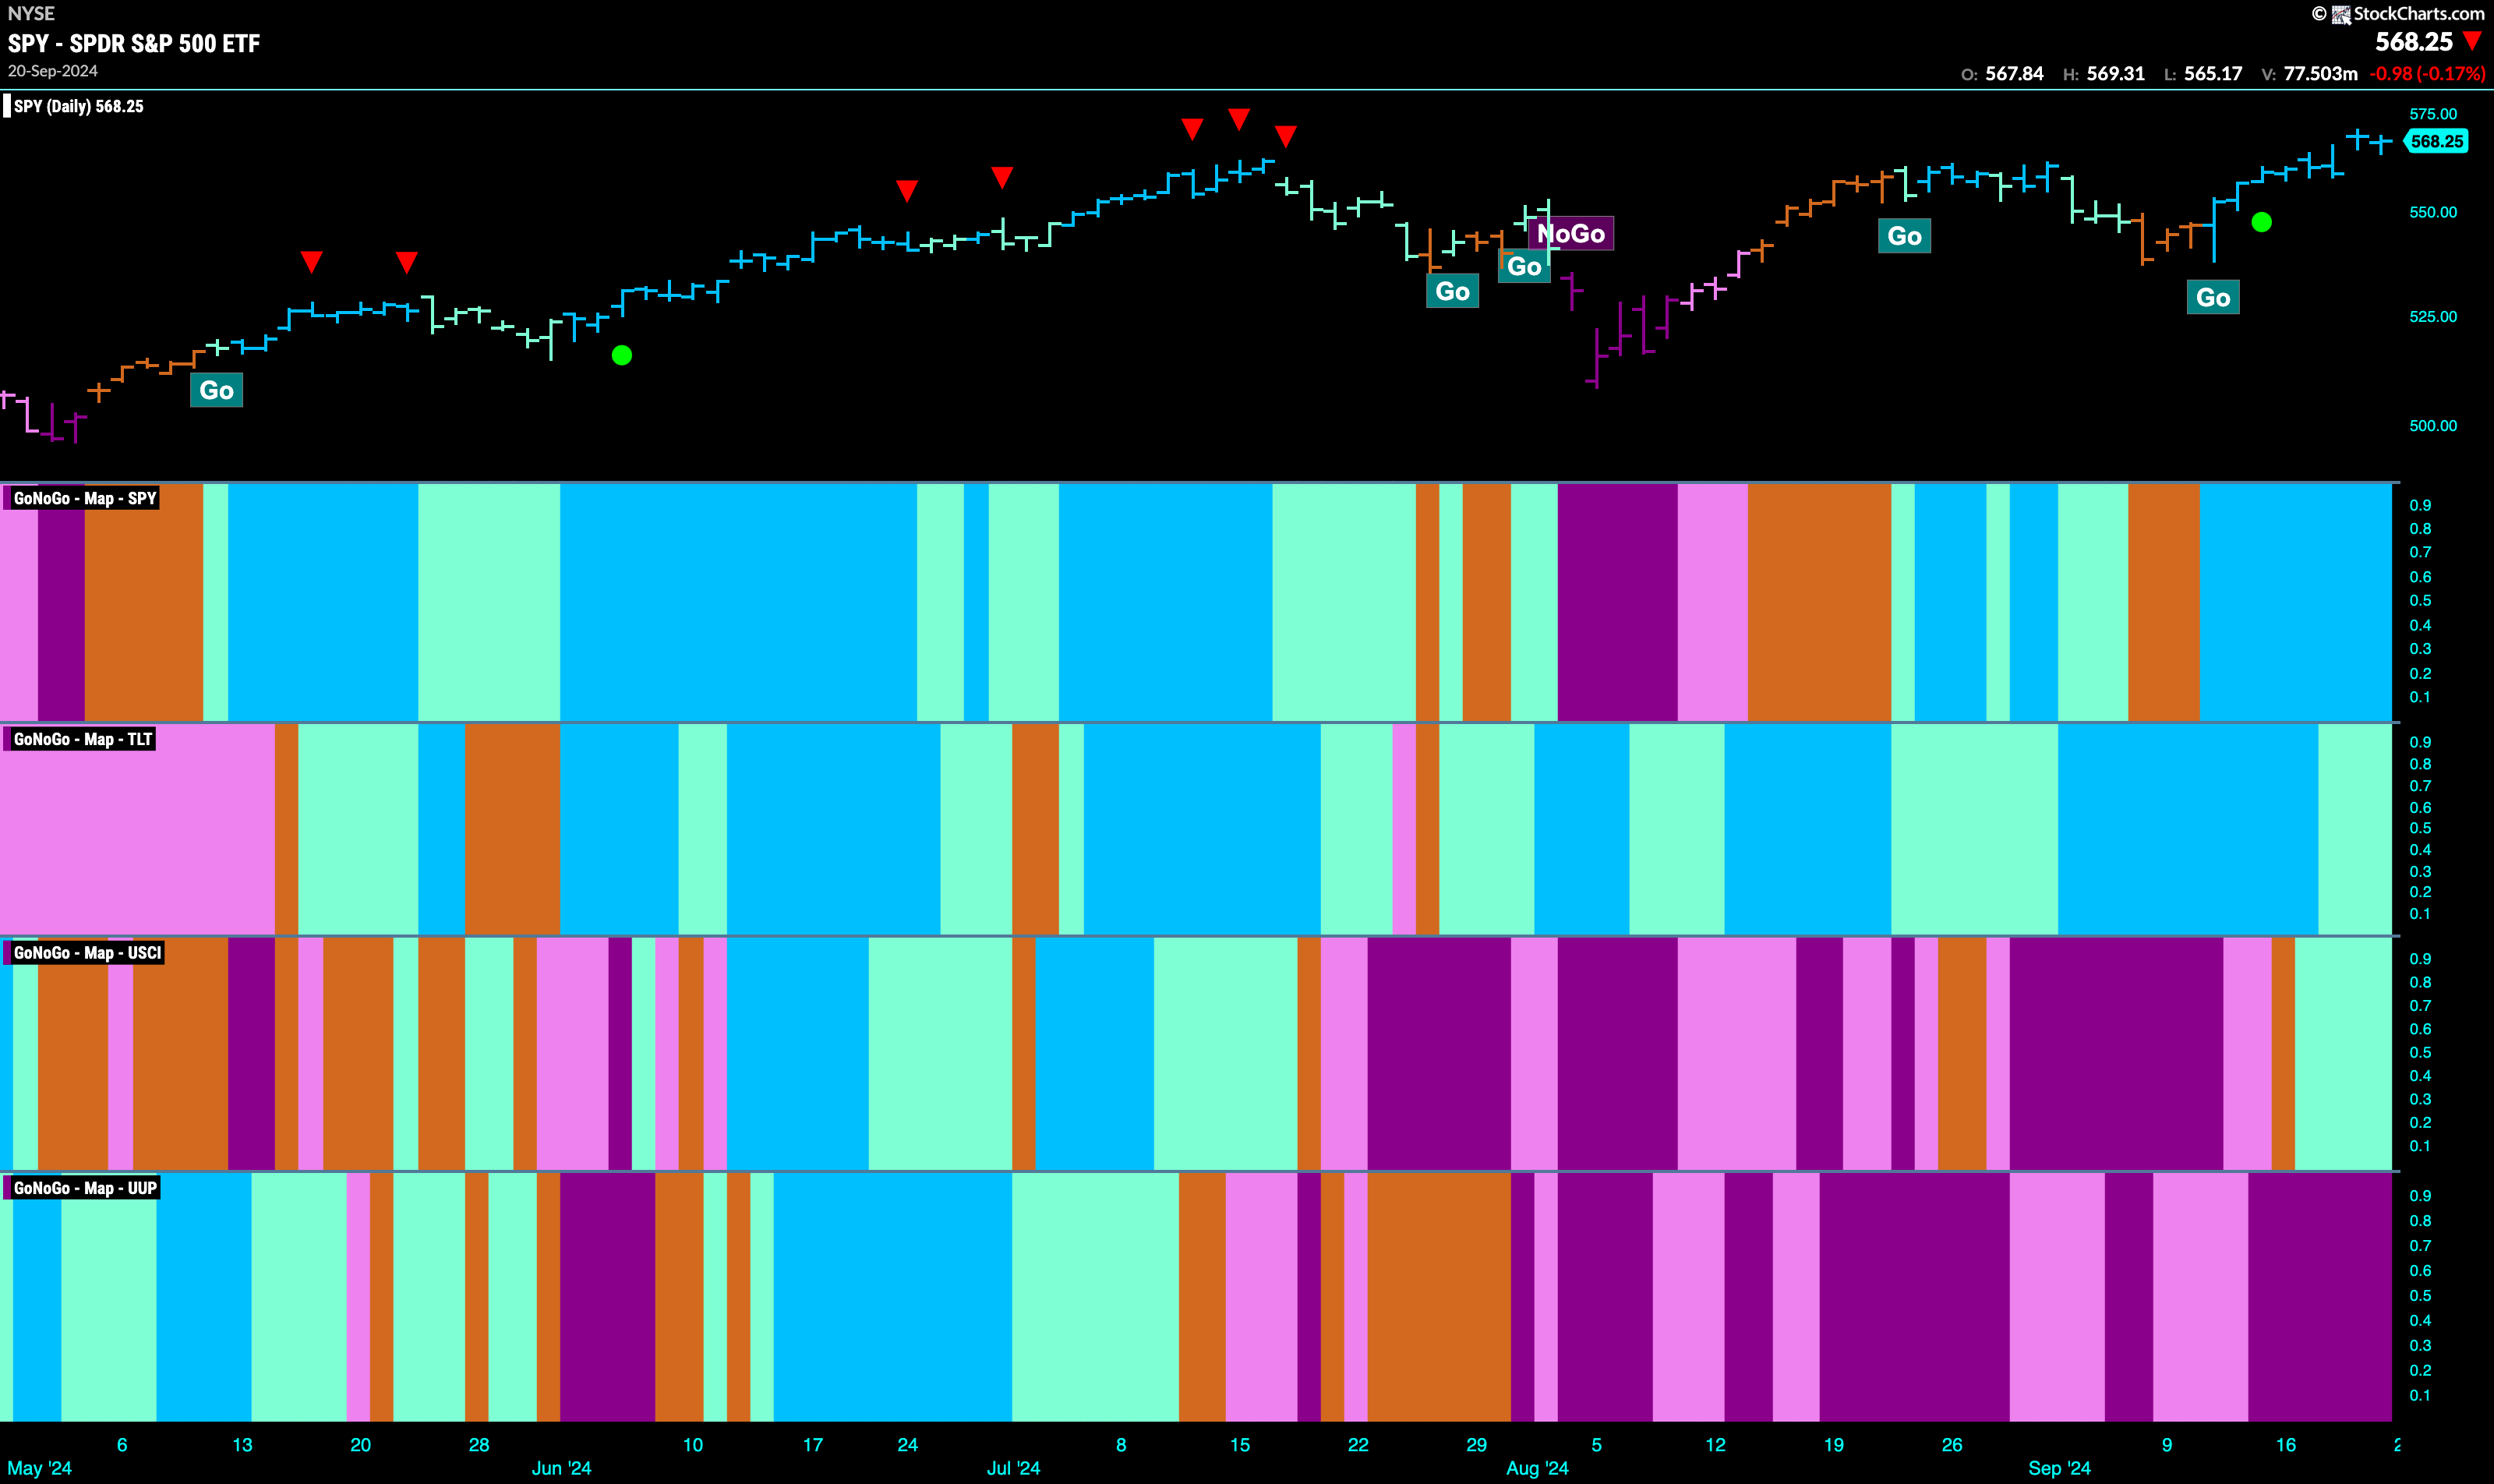
$SPY Hits New Highs in “Go” Trend
The GoNoGo chart below shows that this week the “Go” trend remained strong as we saw blue bars all week. Price rallied from the last low to set a new higher high which is a good sign for the bulls. GoNoGo Oscillator remained in positive territory and volume increased as we saw it climb further from the zero line. Now, with a “Go” trend in place and momentum in positive territory but not yet overbought, we will look to see if price continues higher.
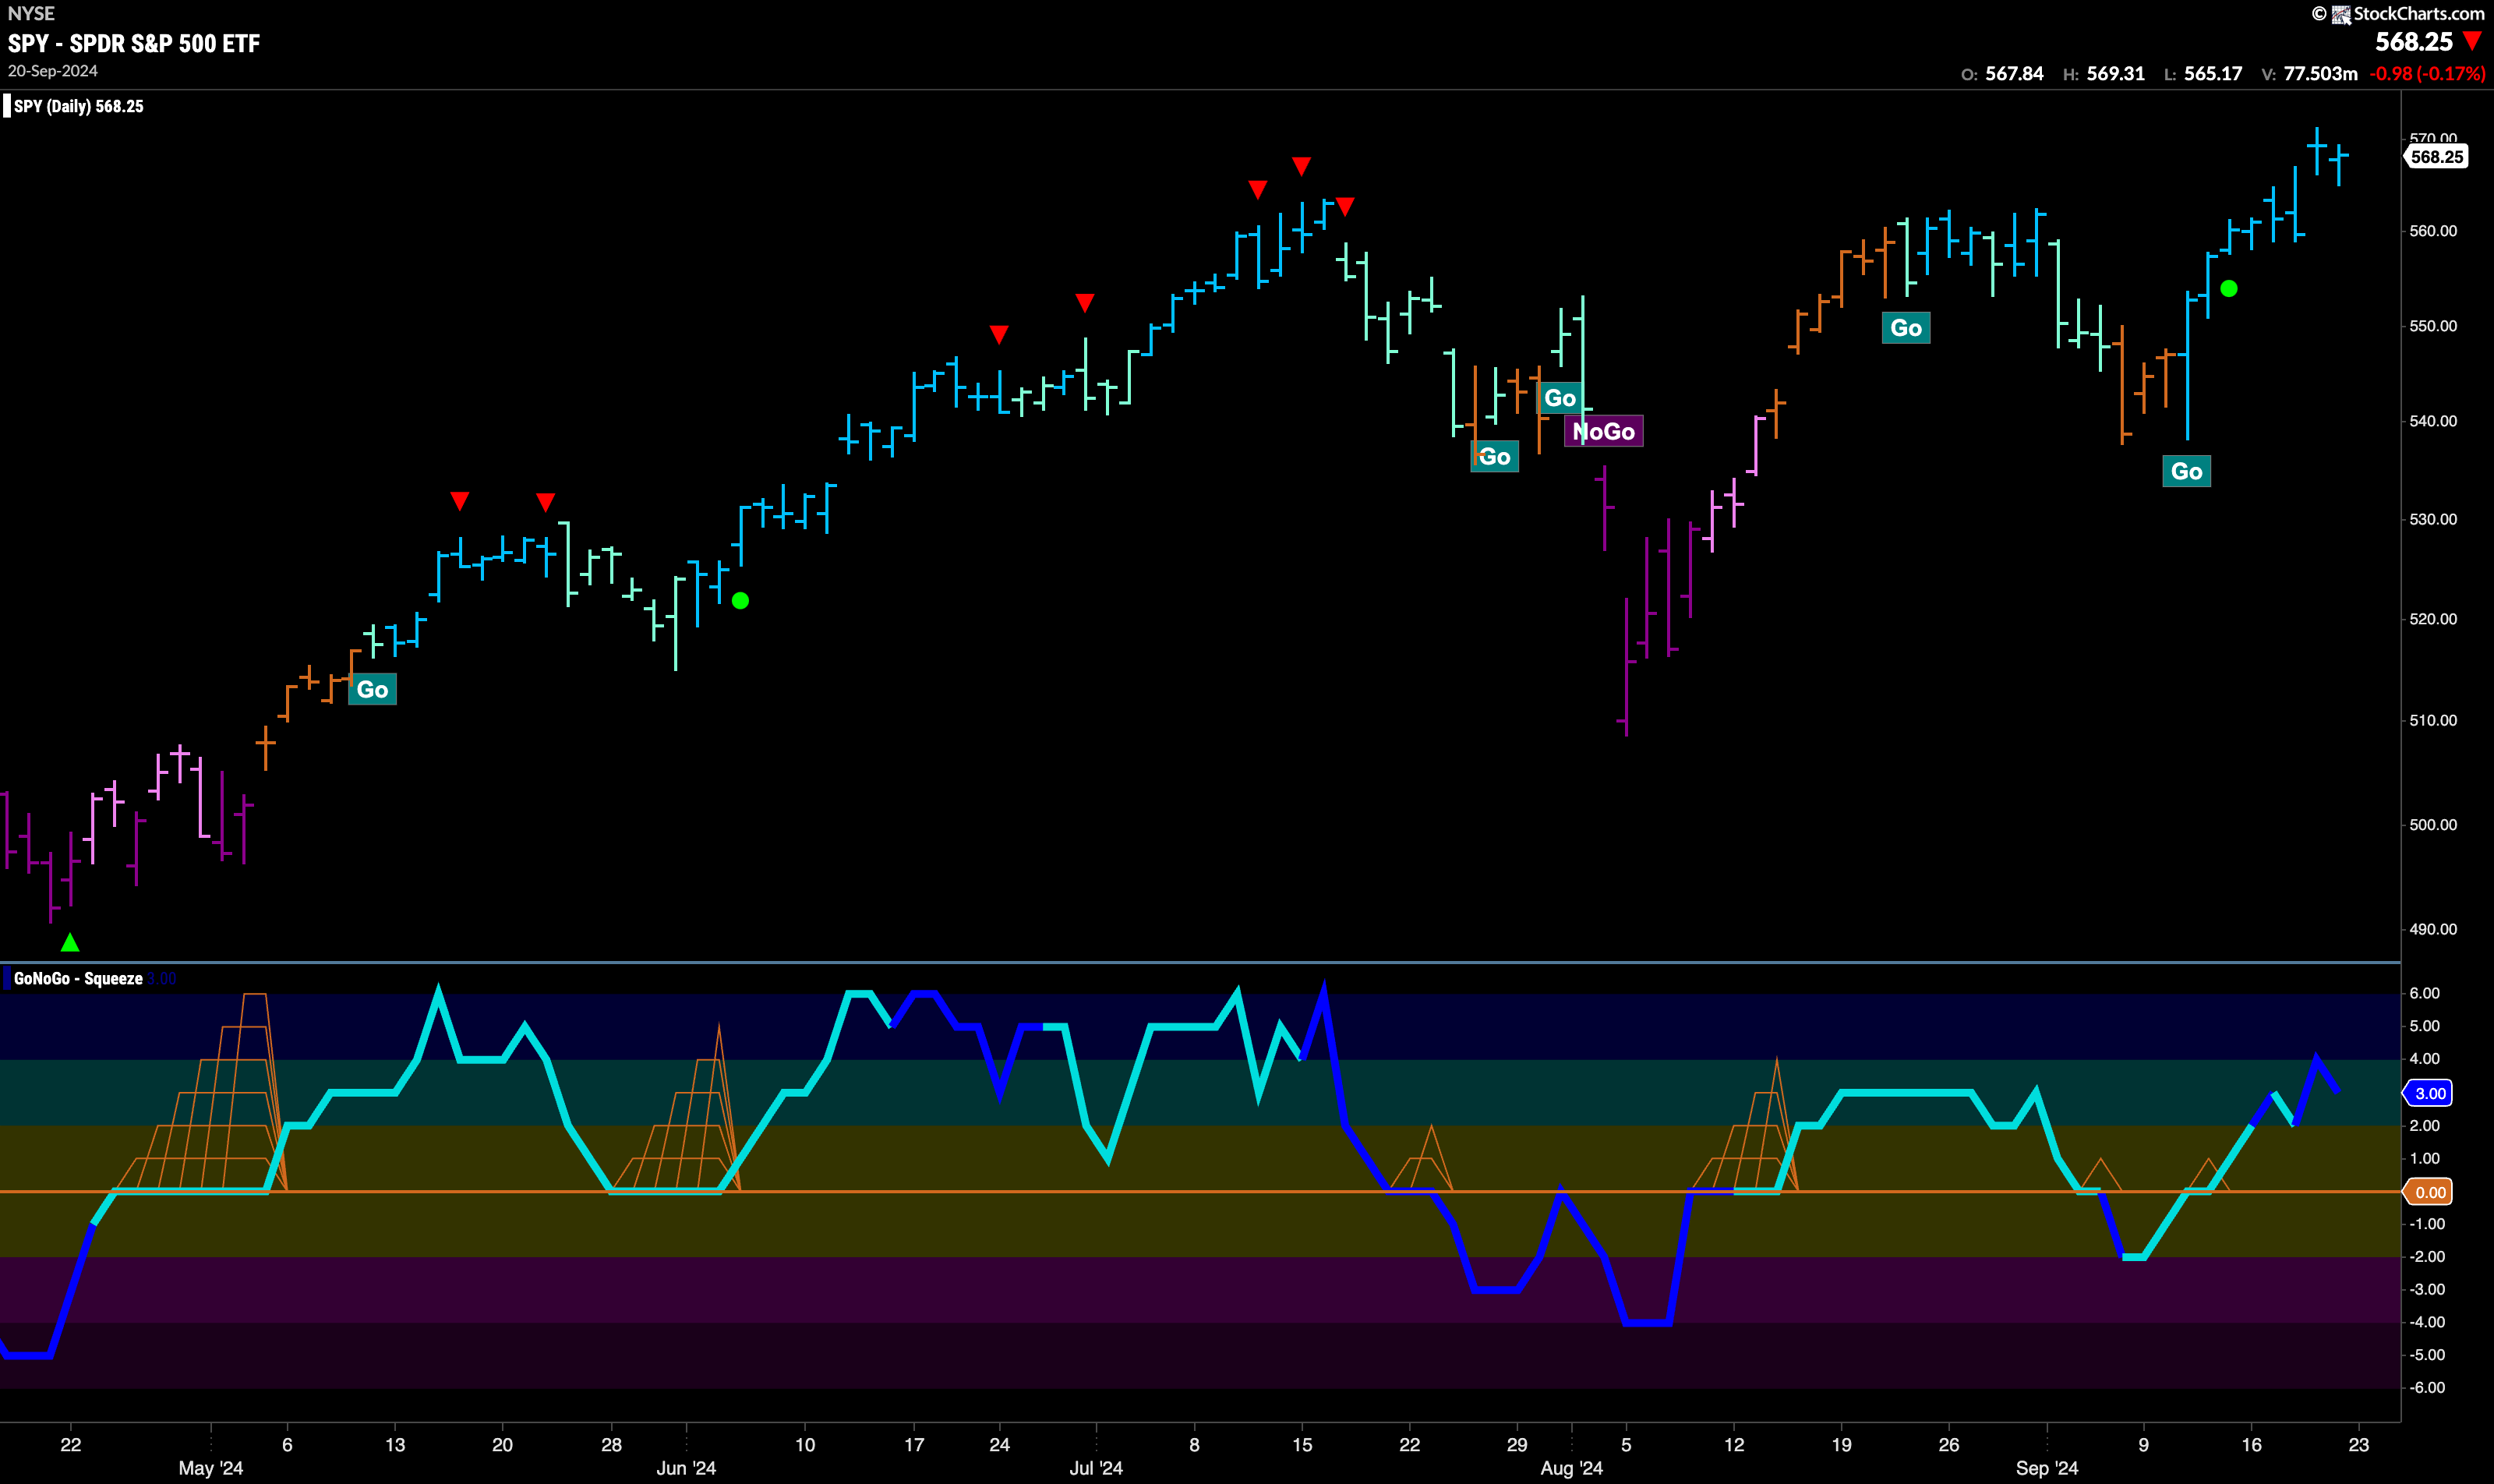
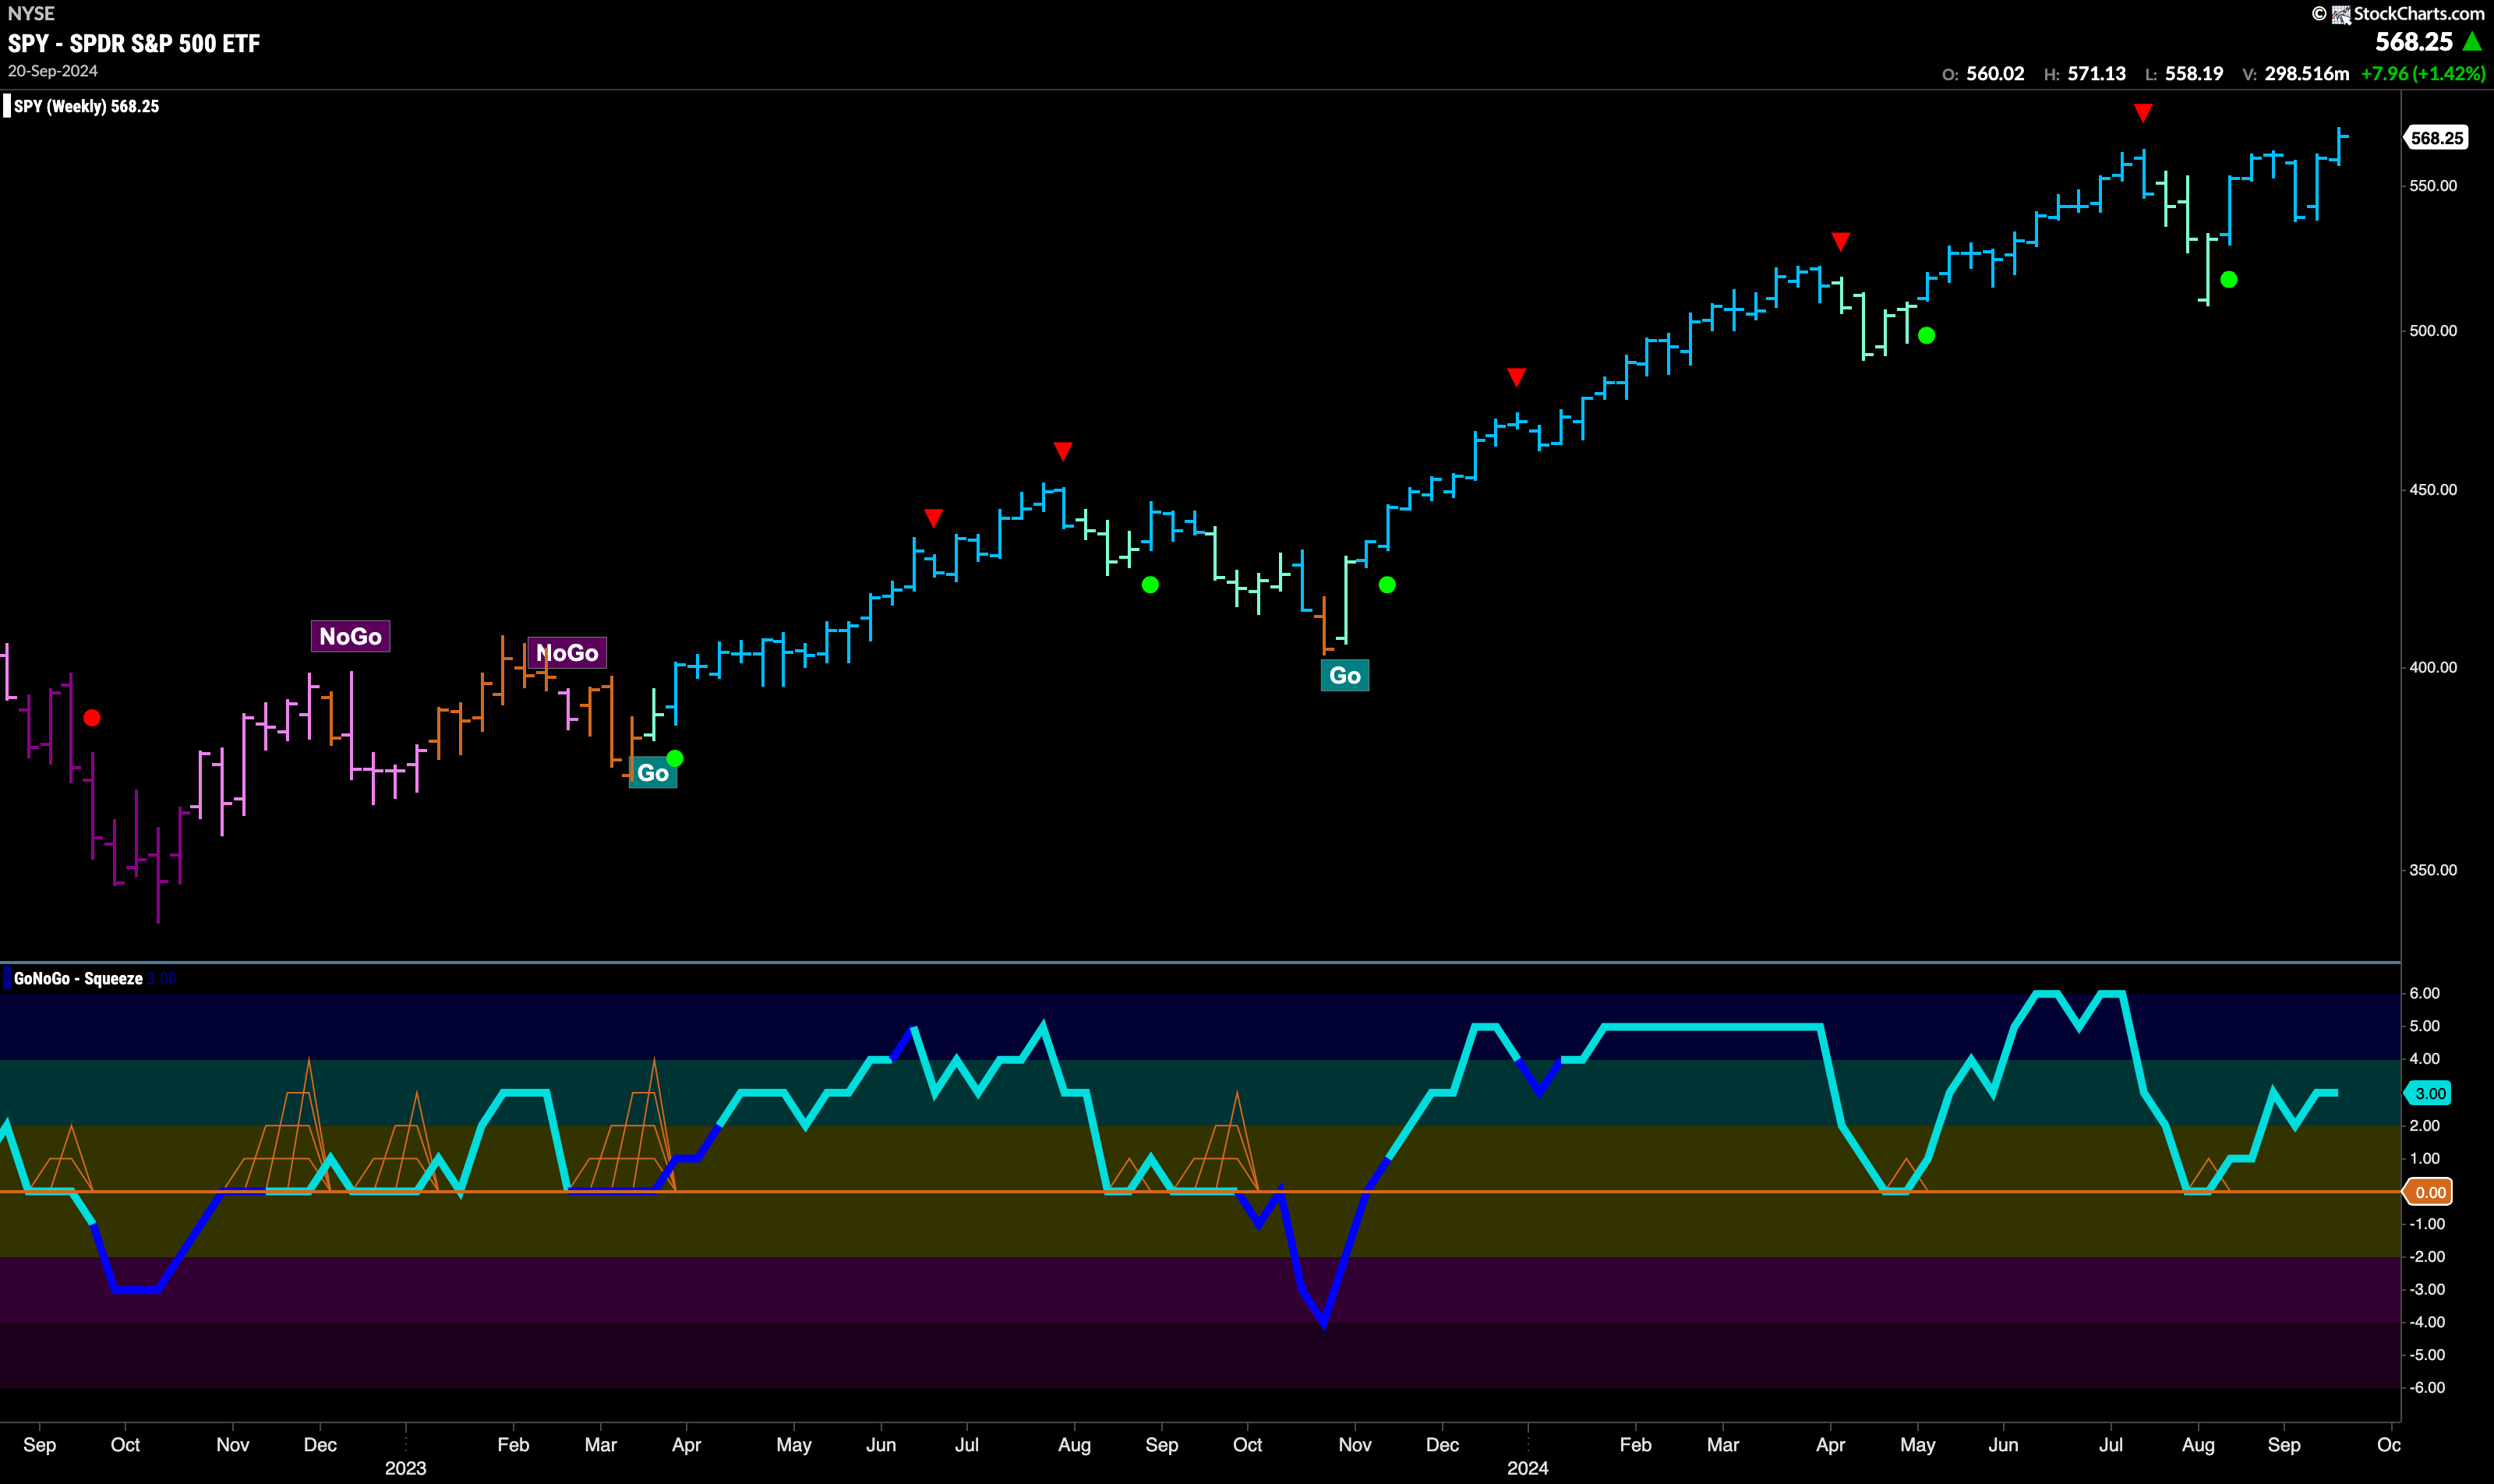
The longer time frame chart tells us that the “Go” trend is still very much in place. With another strong blue bar and a higher weekly close we can now see the drop in August as a higher low. GoNoGo Oscillator is in positive territory at a value of 3 so not yet overbought. We will look for price to consolidate at these highs and provide a base of support going forward.
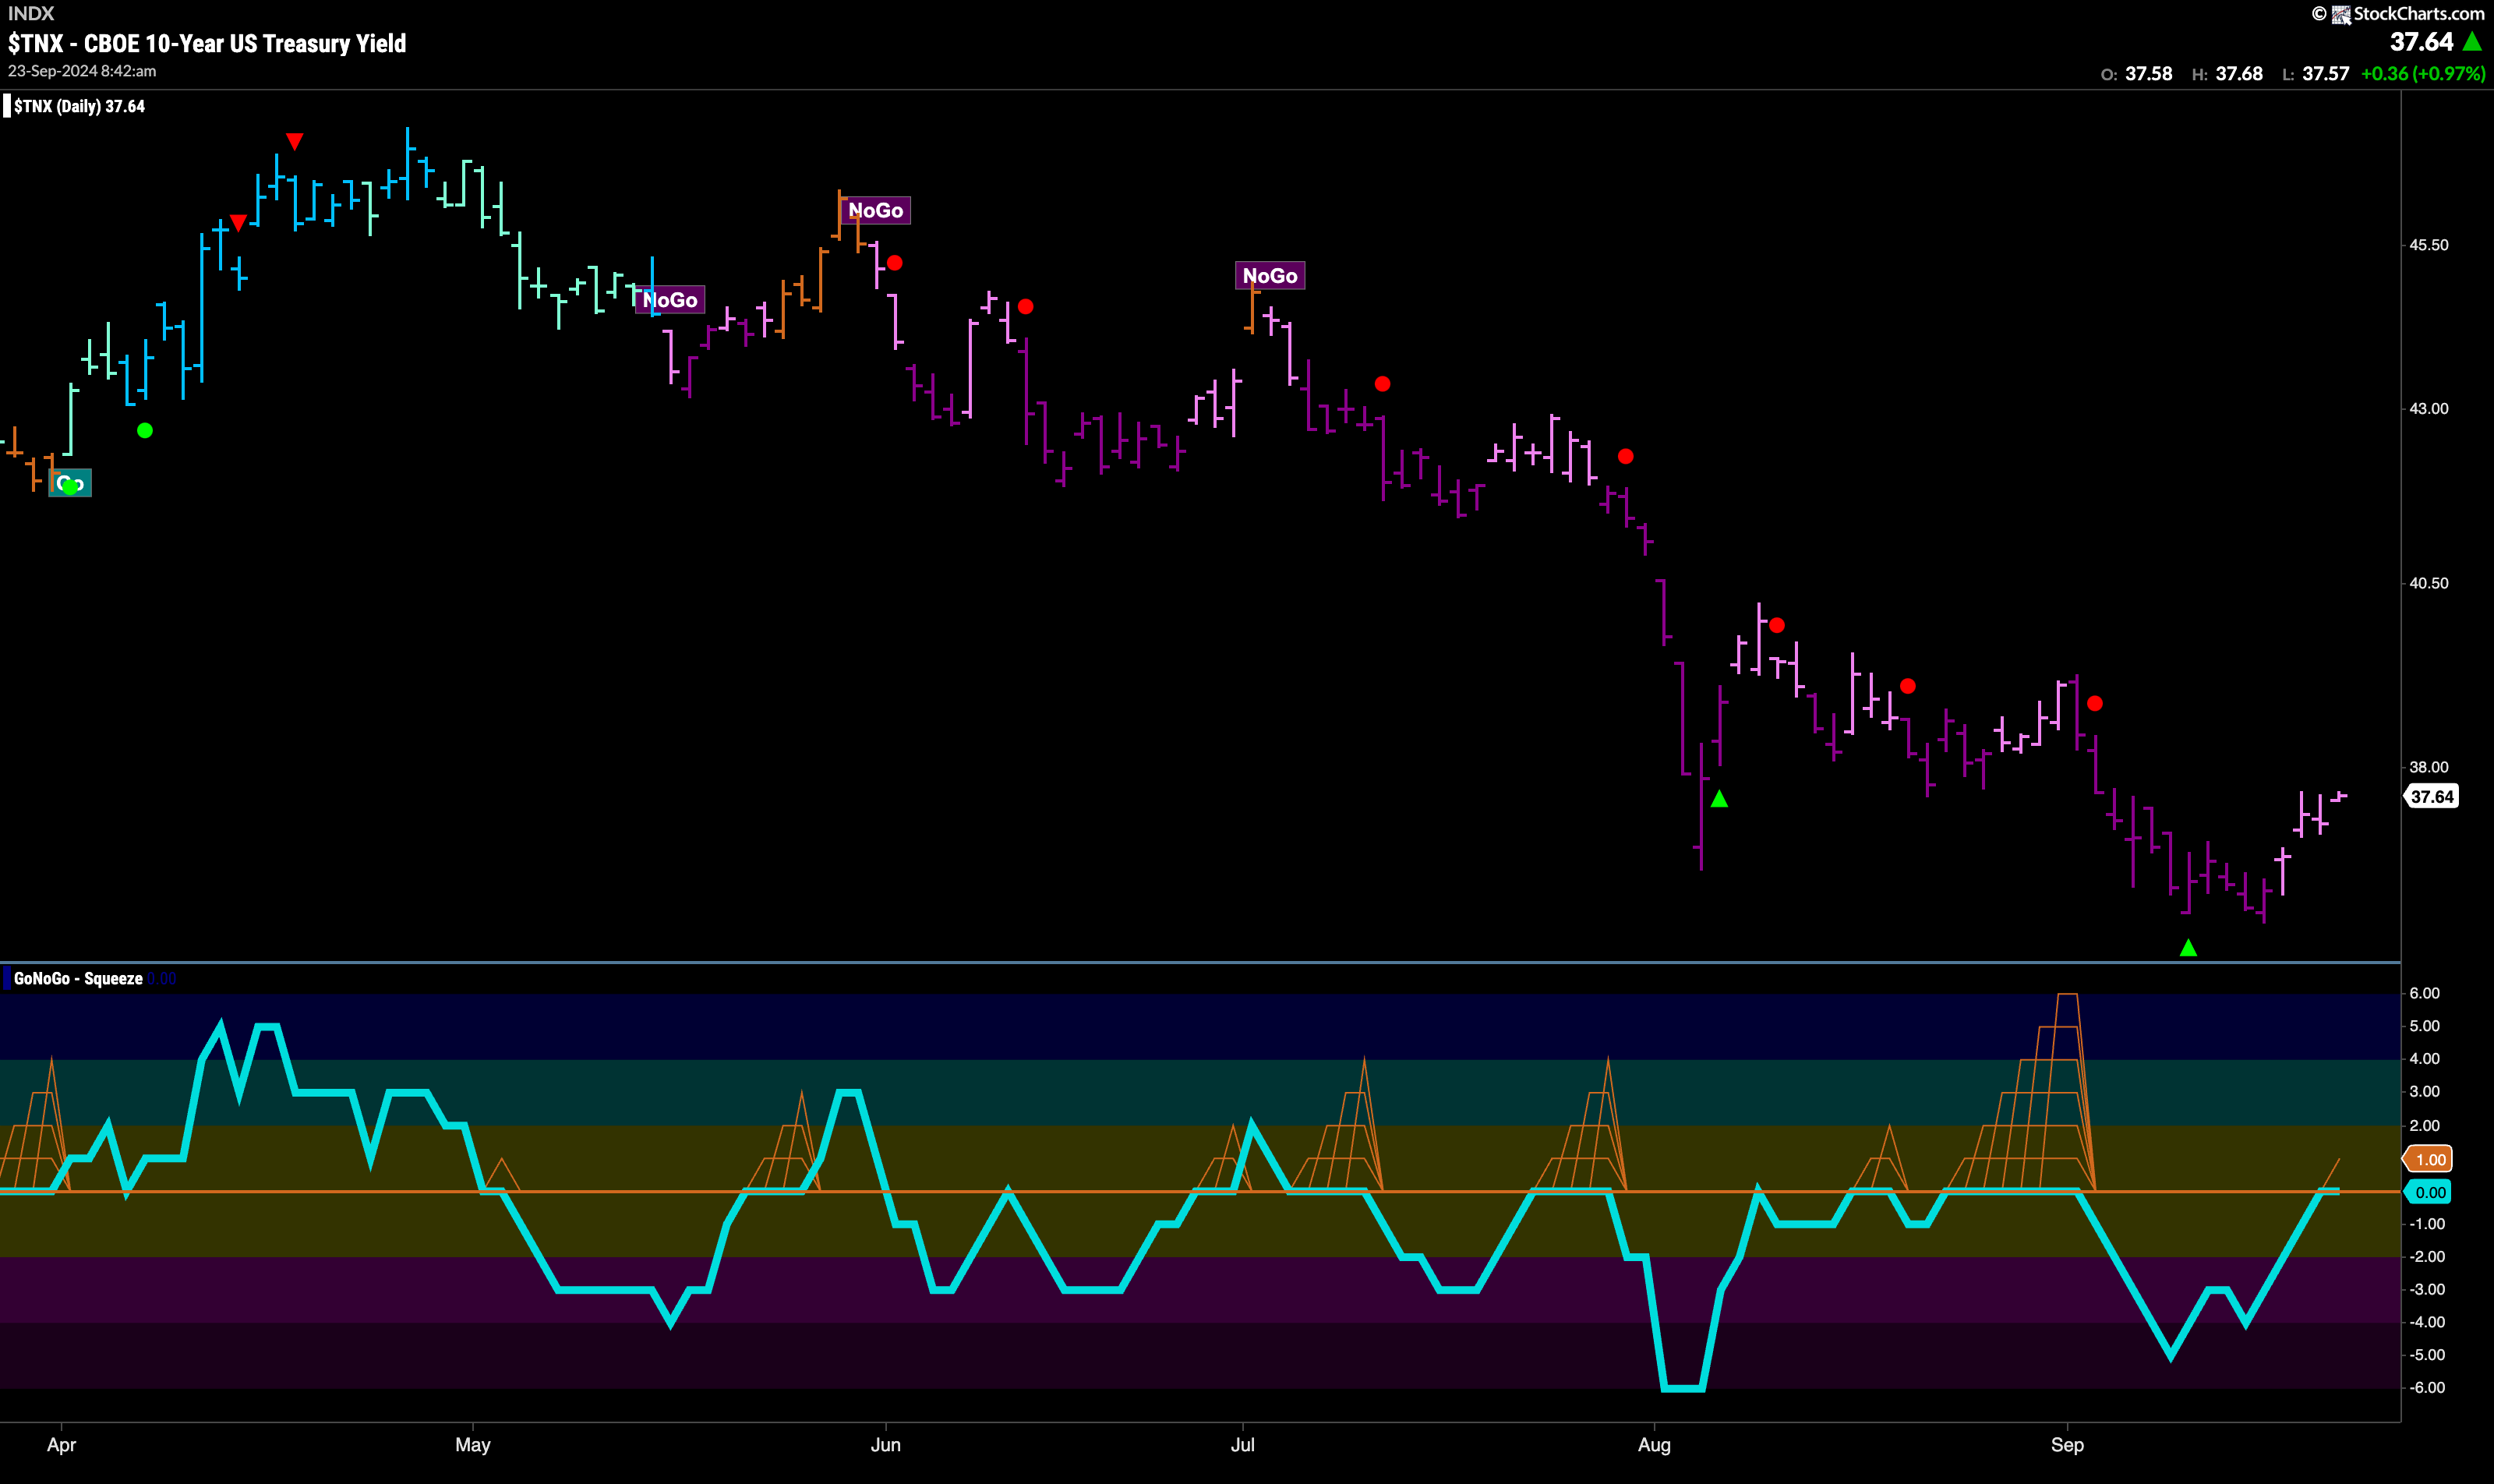
“NoGo” Trend Continues on Weaker Pink Bars
Treasury bond yields rose from a new low at the beginning of the week and painted a string of weaker pink “NoGo” bars as price rallied. After setting a new lower low, we will watch to see if price rolls over this week and we see a new lower high. GoNoGo Oscillator is testing the zero level from below and this will be helpful in informing us as to whether the discussed scenario will play out. If the oscillator gets rejected and falls back into negative territory, we will know that momentum is resurgent in the direction of the “NoGo” trend and we will look for trend continuation to the downside.
The Dollar Remains in Strong “NoGo”
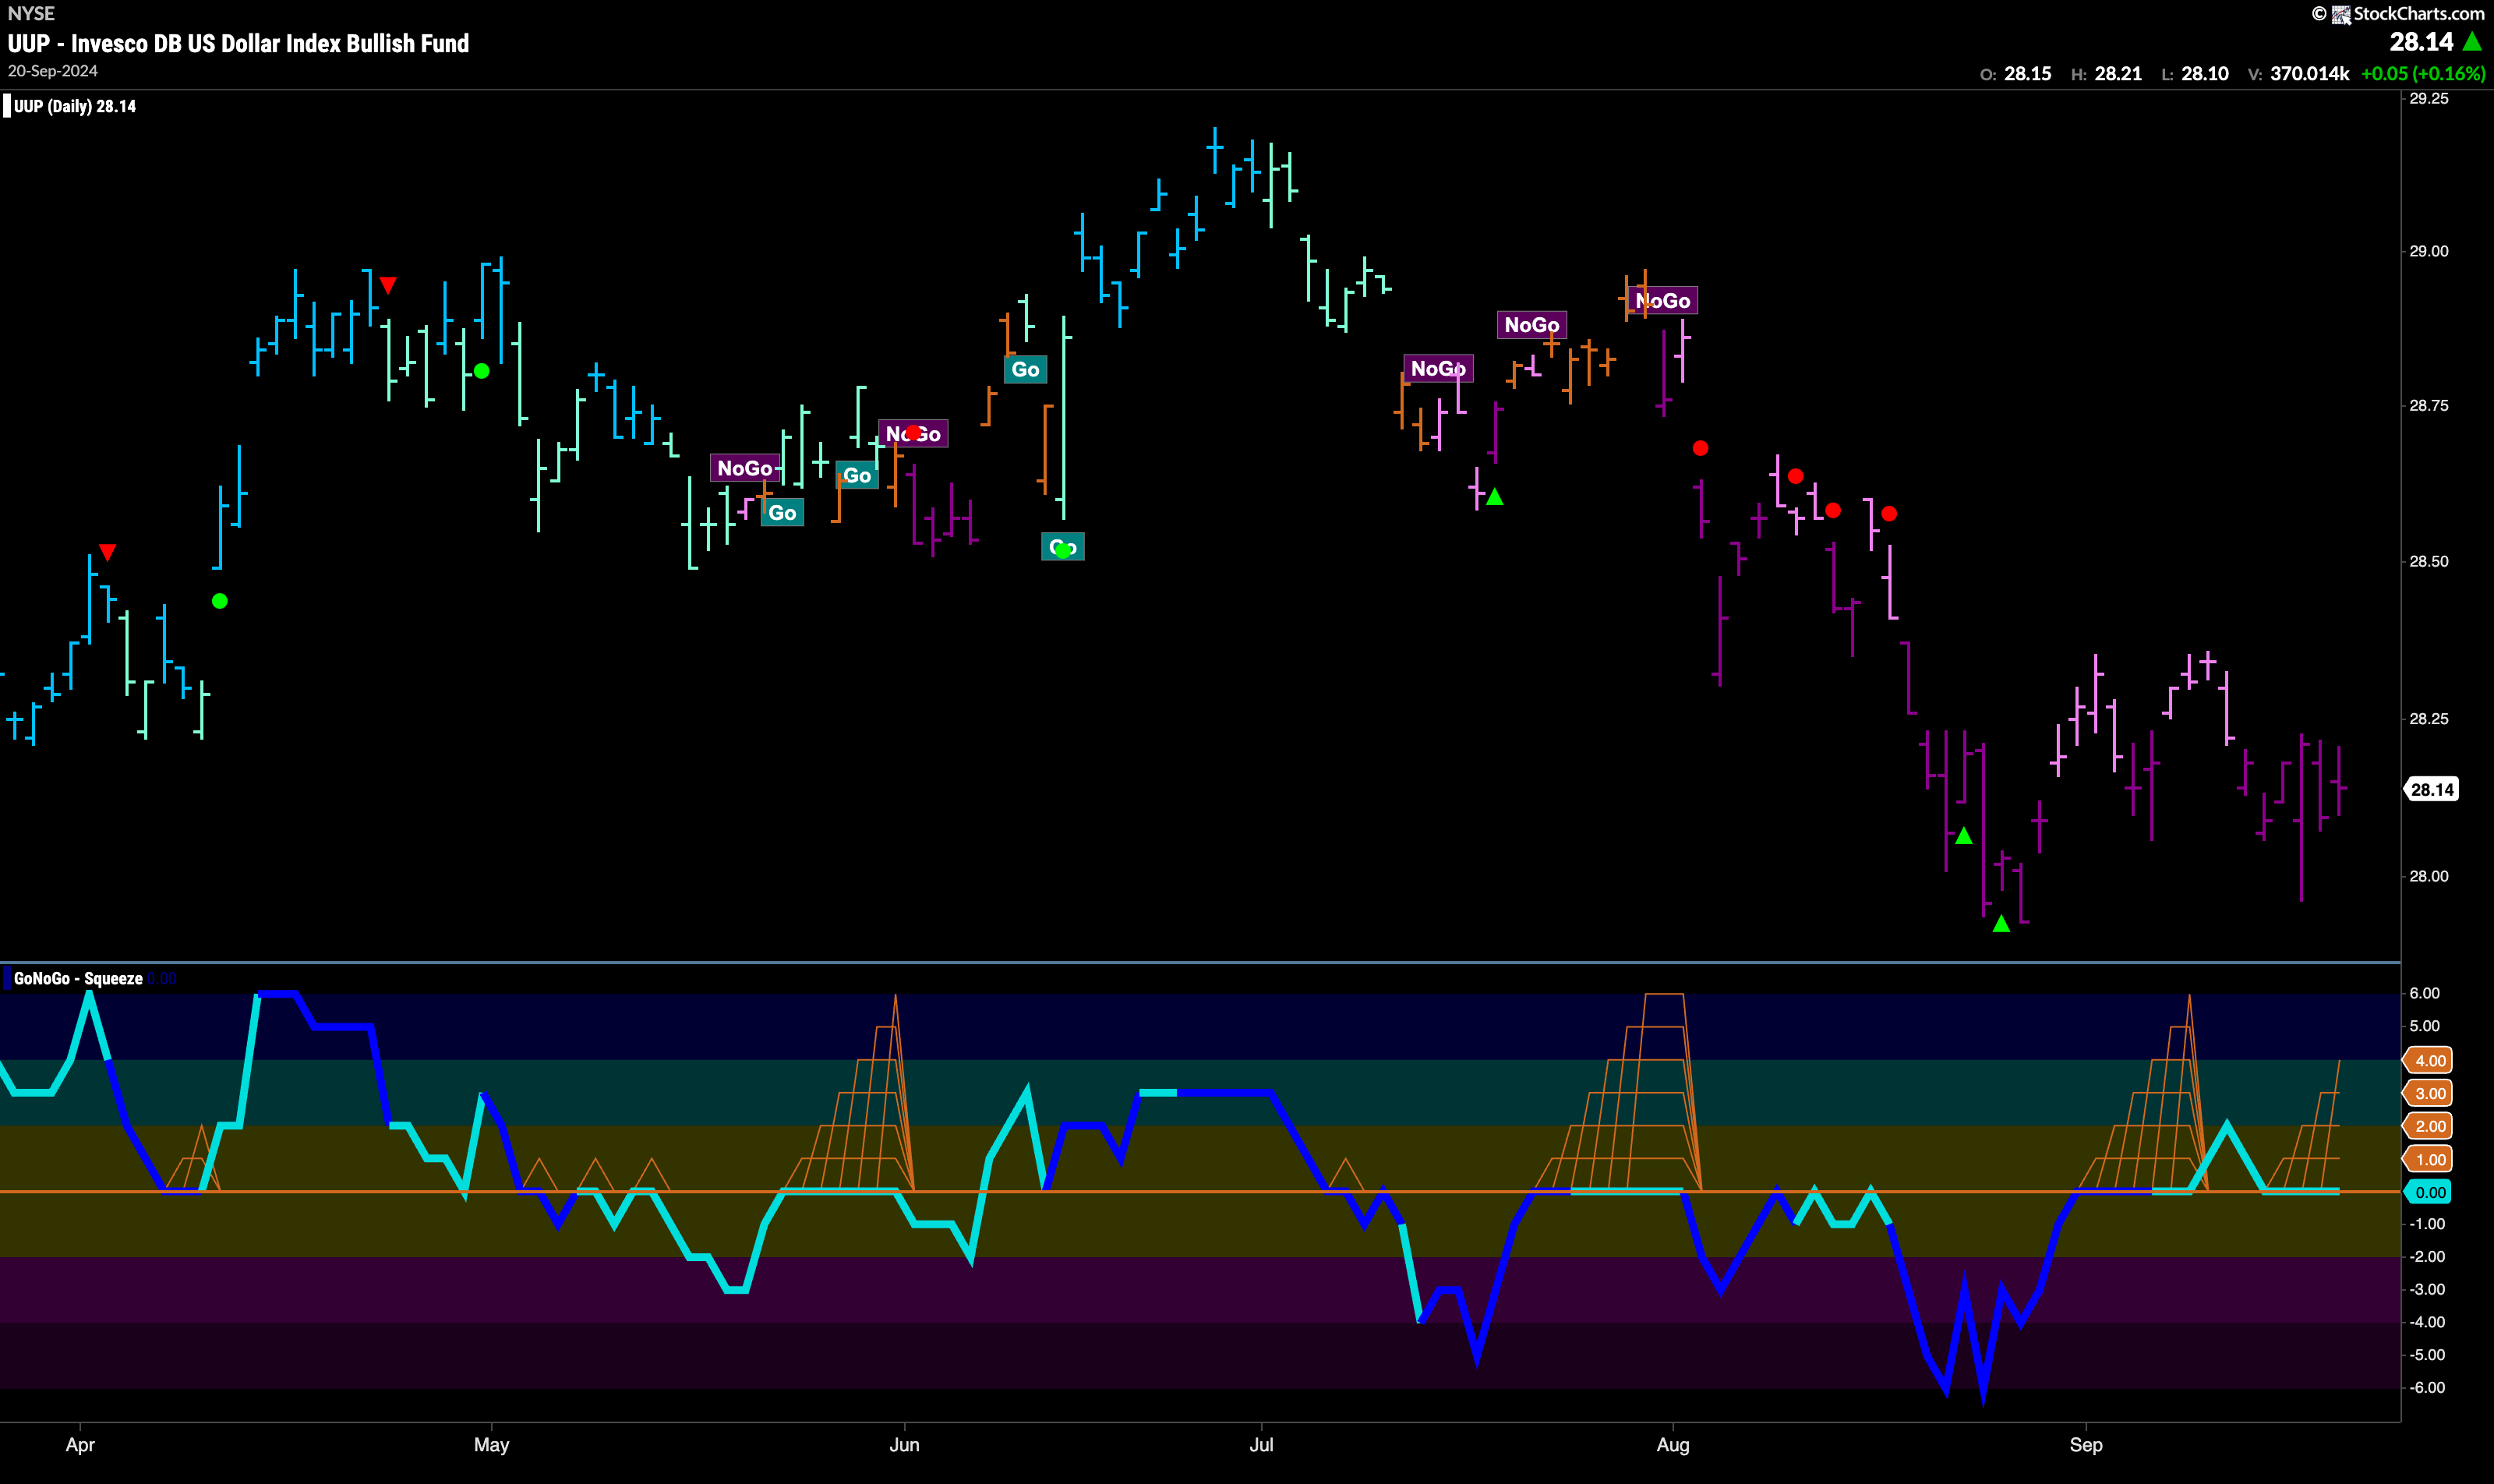
Although price has moved mostly sideways this past week staying in a longer trading range, GoNoGo Trend continues to paint strong purple “NoGo” bars. If we look at the GoNoGo Oscillator in the lower panel, we can see that it has struggled to move away from the zero level into positive territory, returning quickly to that level. Now, we see a new GoNoGo Squeeze beginning to build and we will watch to see in which direction it breaks. If it breaks back into negative territory then we will expect trend continuation to the downside.
USO Continues to Rally but Remains in “NoGo” Trend
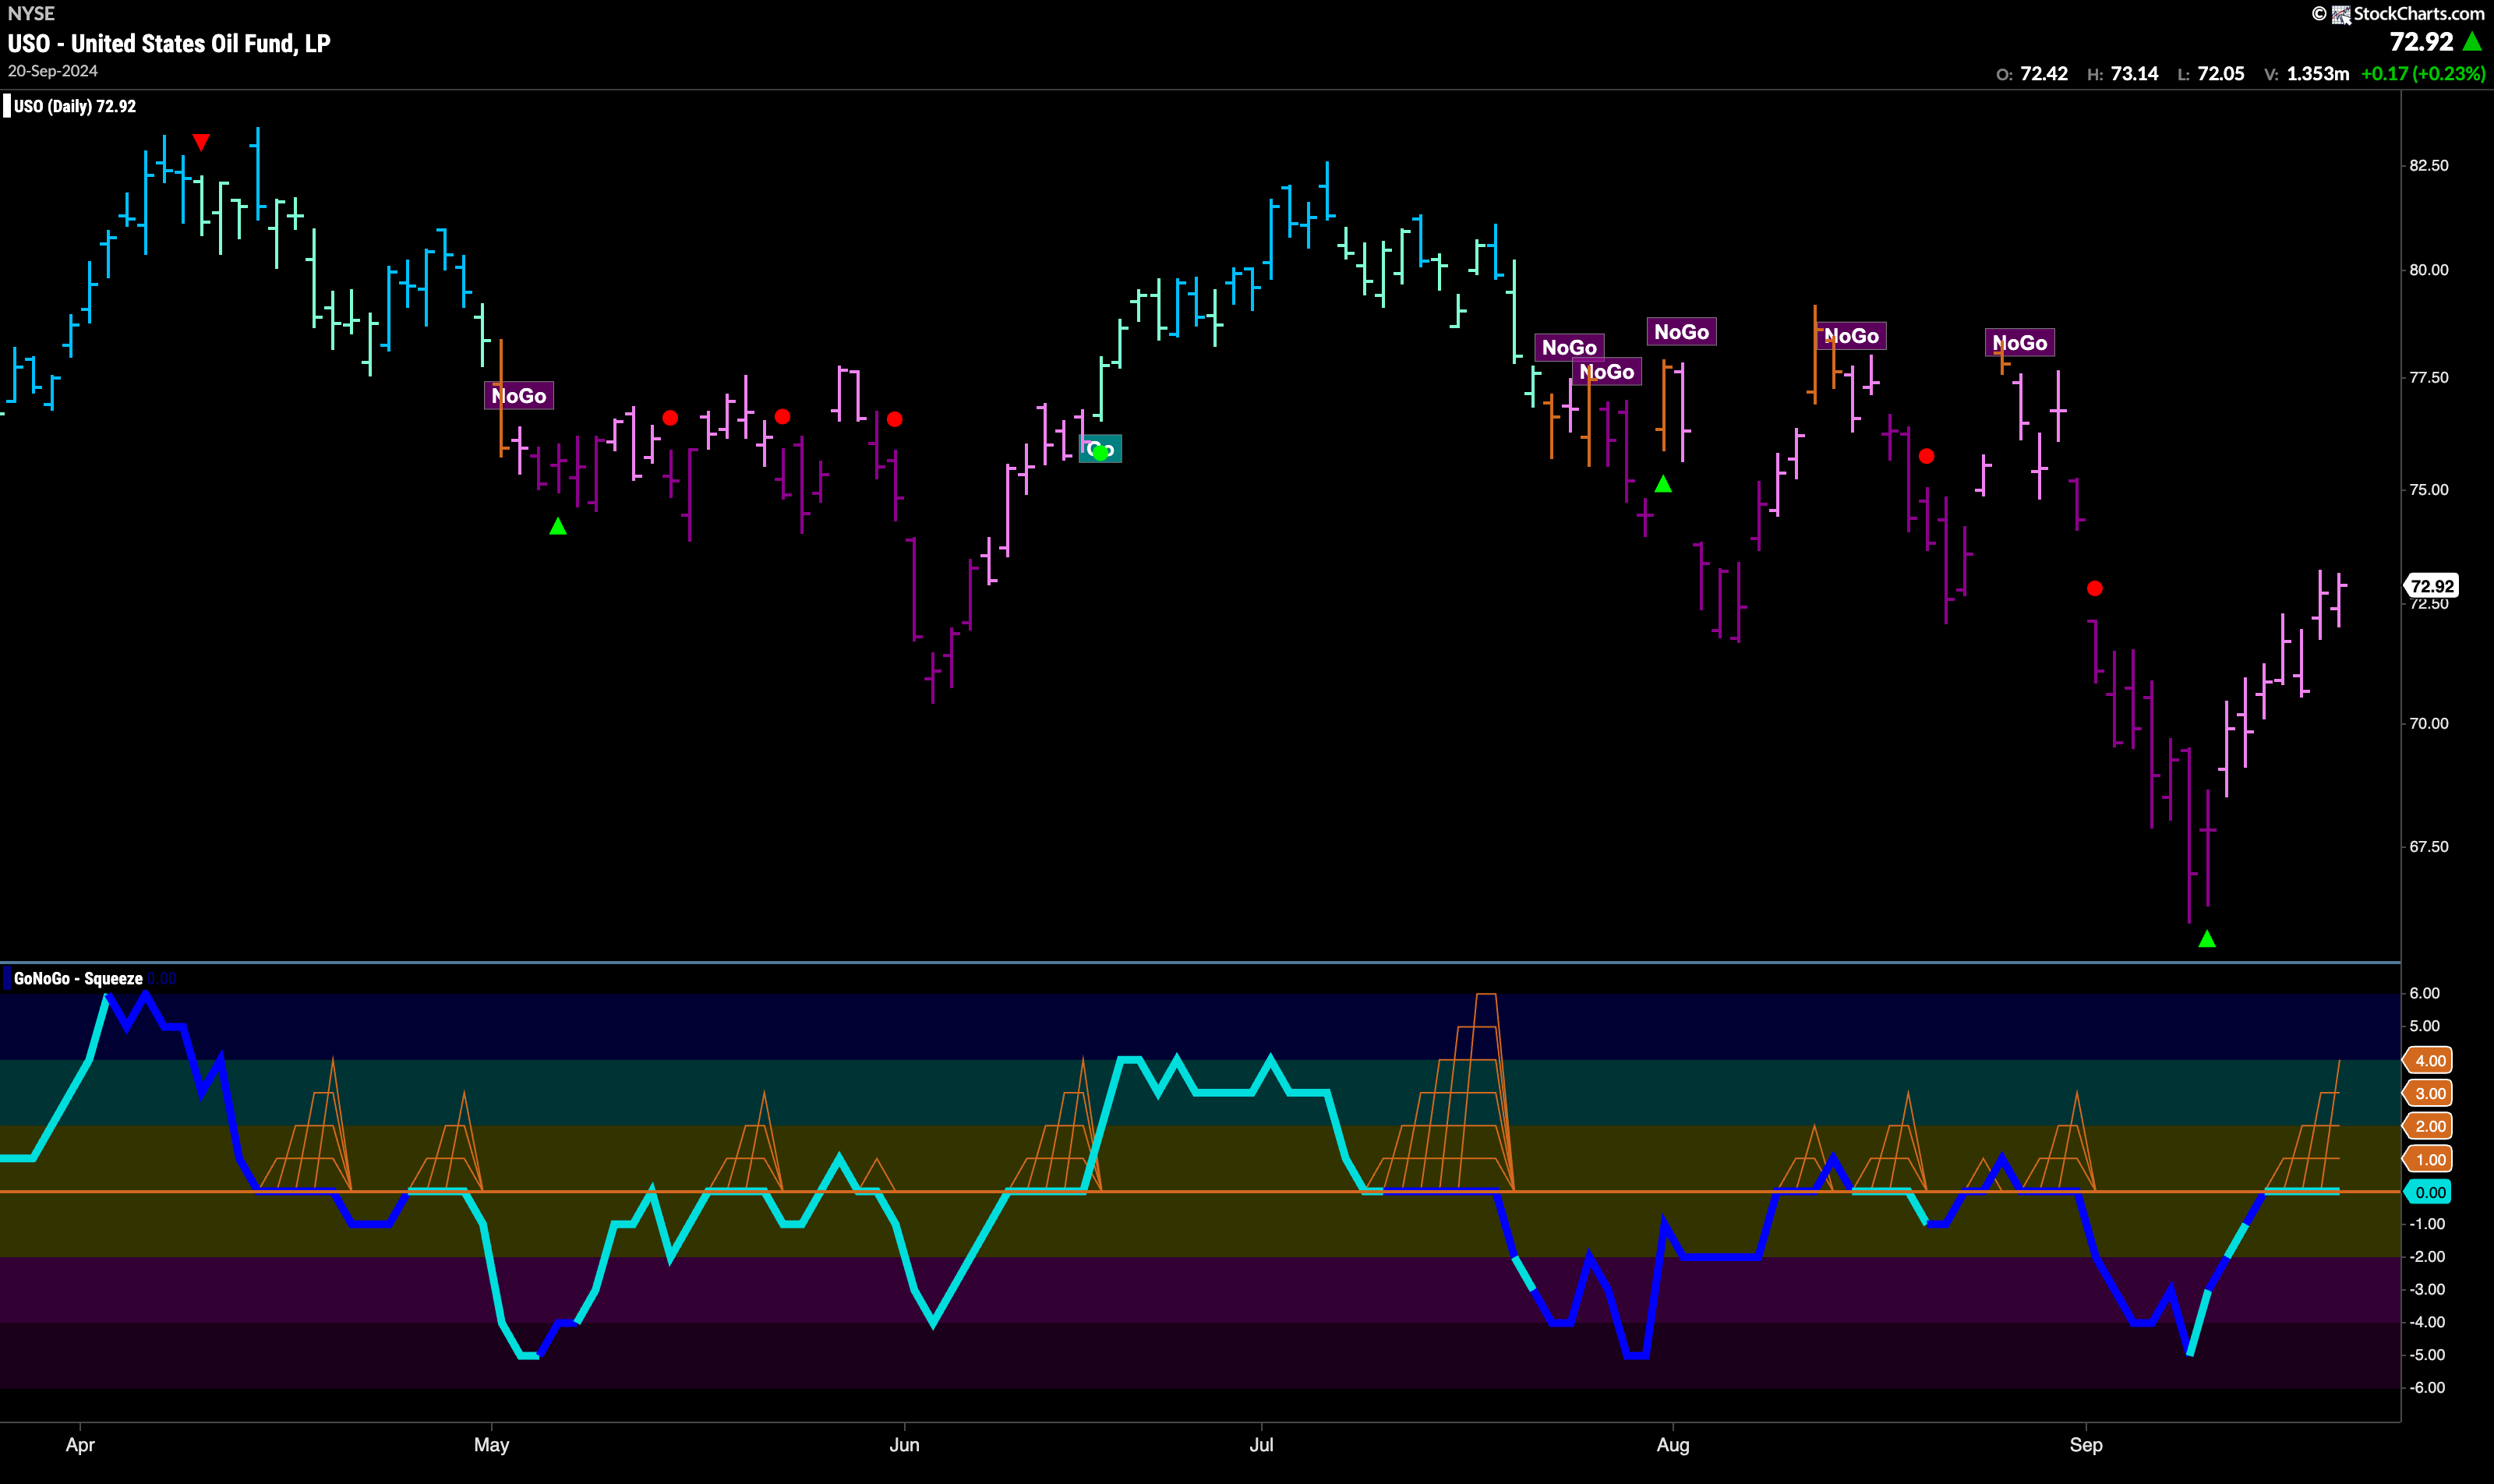
$USO saw prices climb for another week and a string of uninterrupted pink “NoGo” bars. However, the trend has not changed, and the weight of the evidence tells us pressure is still in favor of lower prices. We see that price has run up against possible resistance from prior August lows and that GoNoGo Oscillator has run up against the zero line from below. As we see the beginning of a GoNoGo Squeeze, it will be important to watch in which direction the oscillator breaks next.
Gold Moves Higher Again
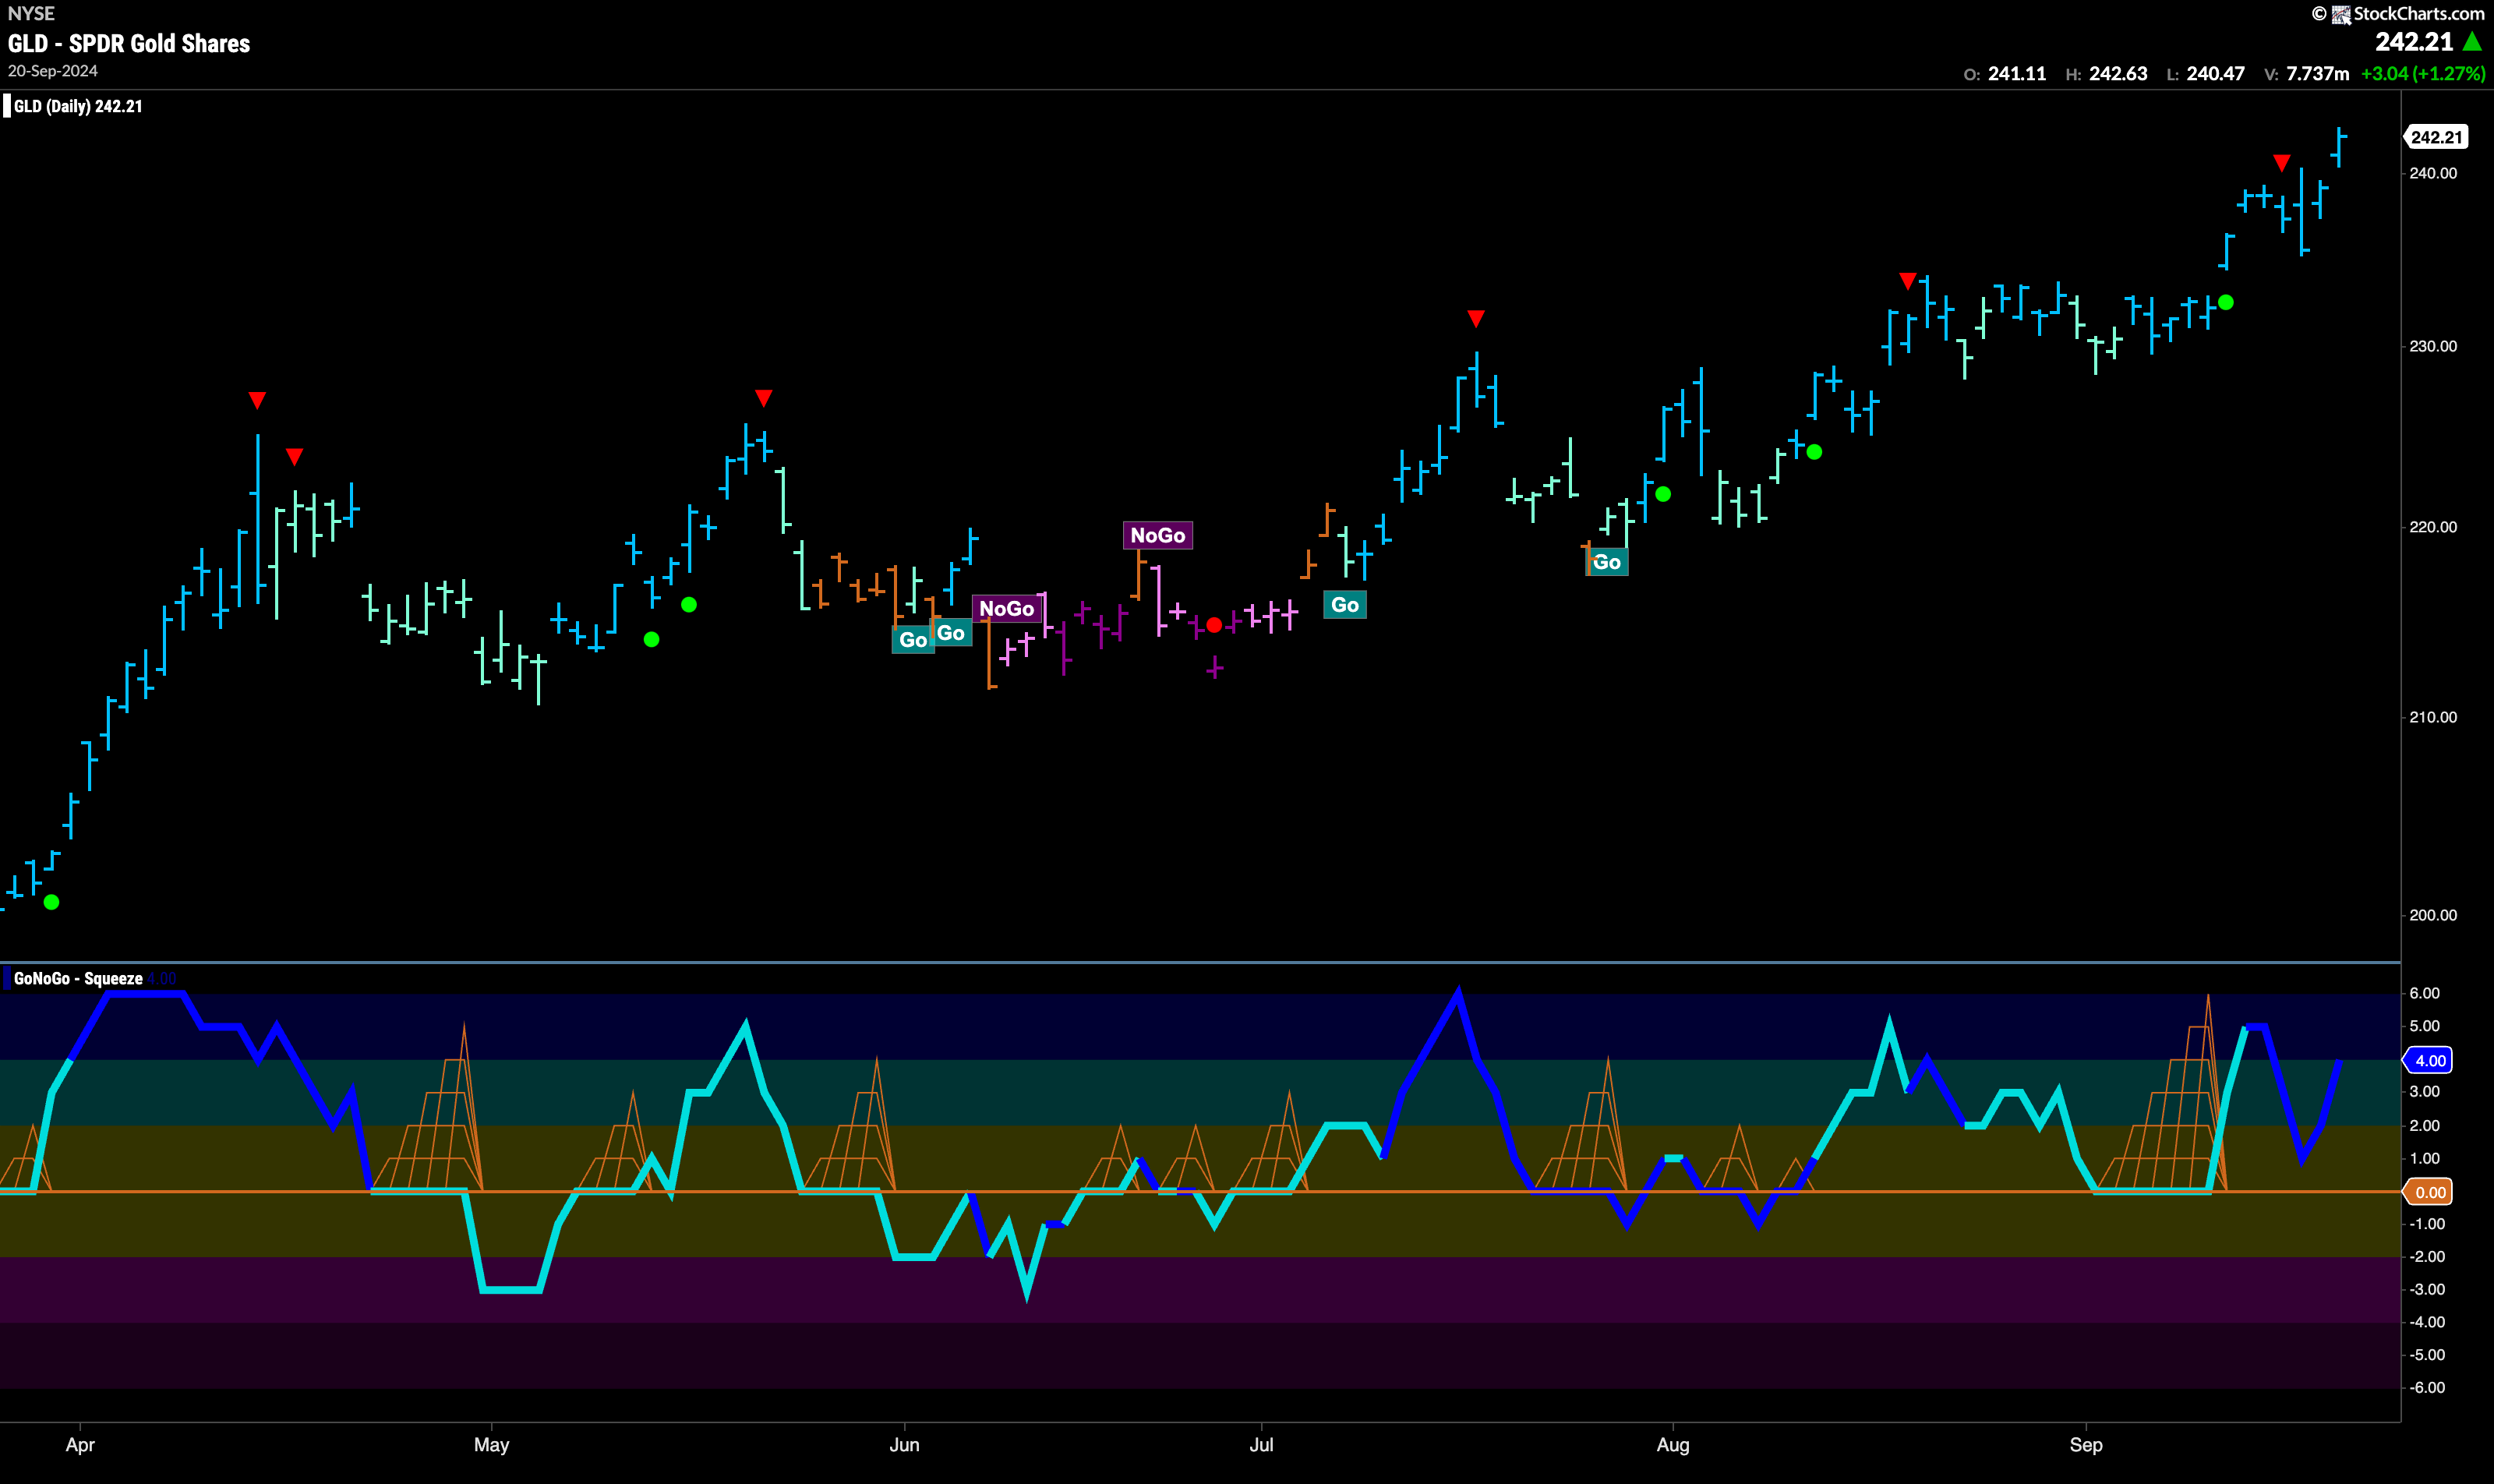
Gold finished the week strongly with another high on a strong blue “Go” bar. We see now a series of higher highs and higher lows as this “Go” trend has progressed nicely. GoNoGo Oscillator since breaking out of the Max GoNoGo Squeeze into positive territory has remained above that level and we have seen volume increase of late. Now, the oscillator is at a value of 4, confirming the “Go” trend we see in price. We will look for price to consolidate at these new higher levels.
Sector RelMap
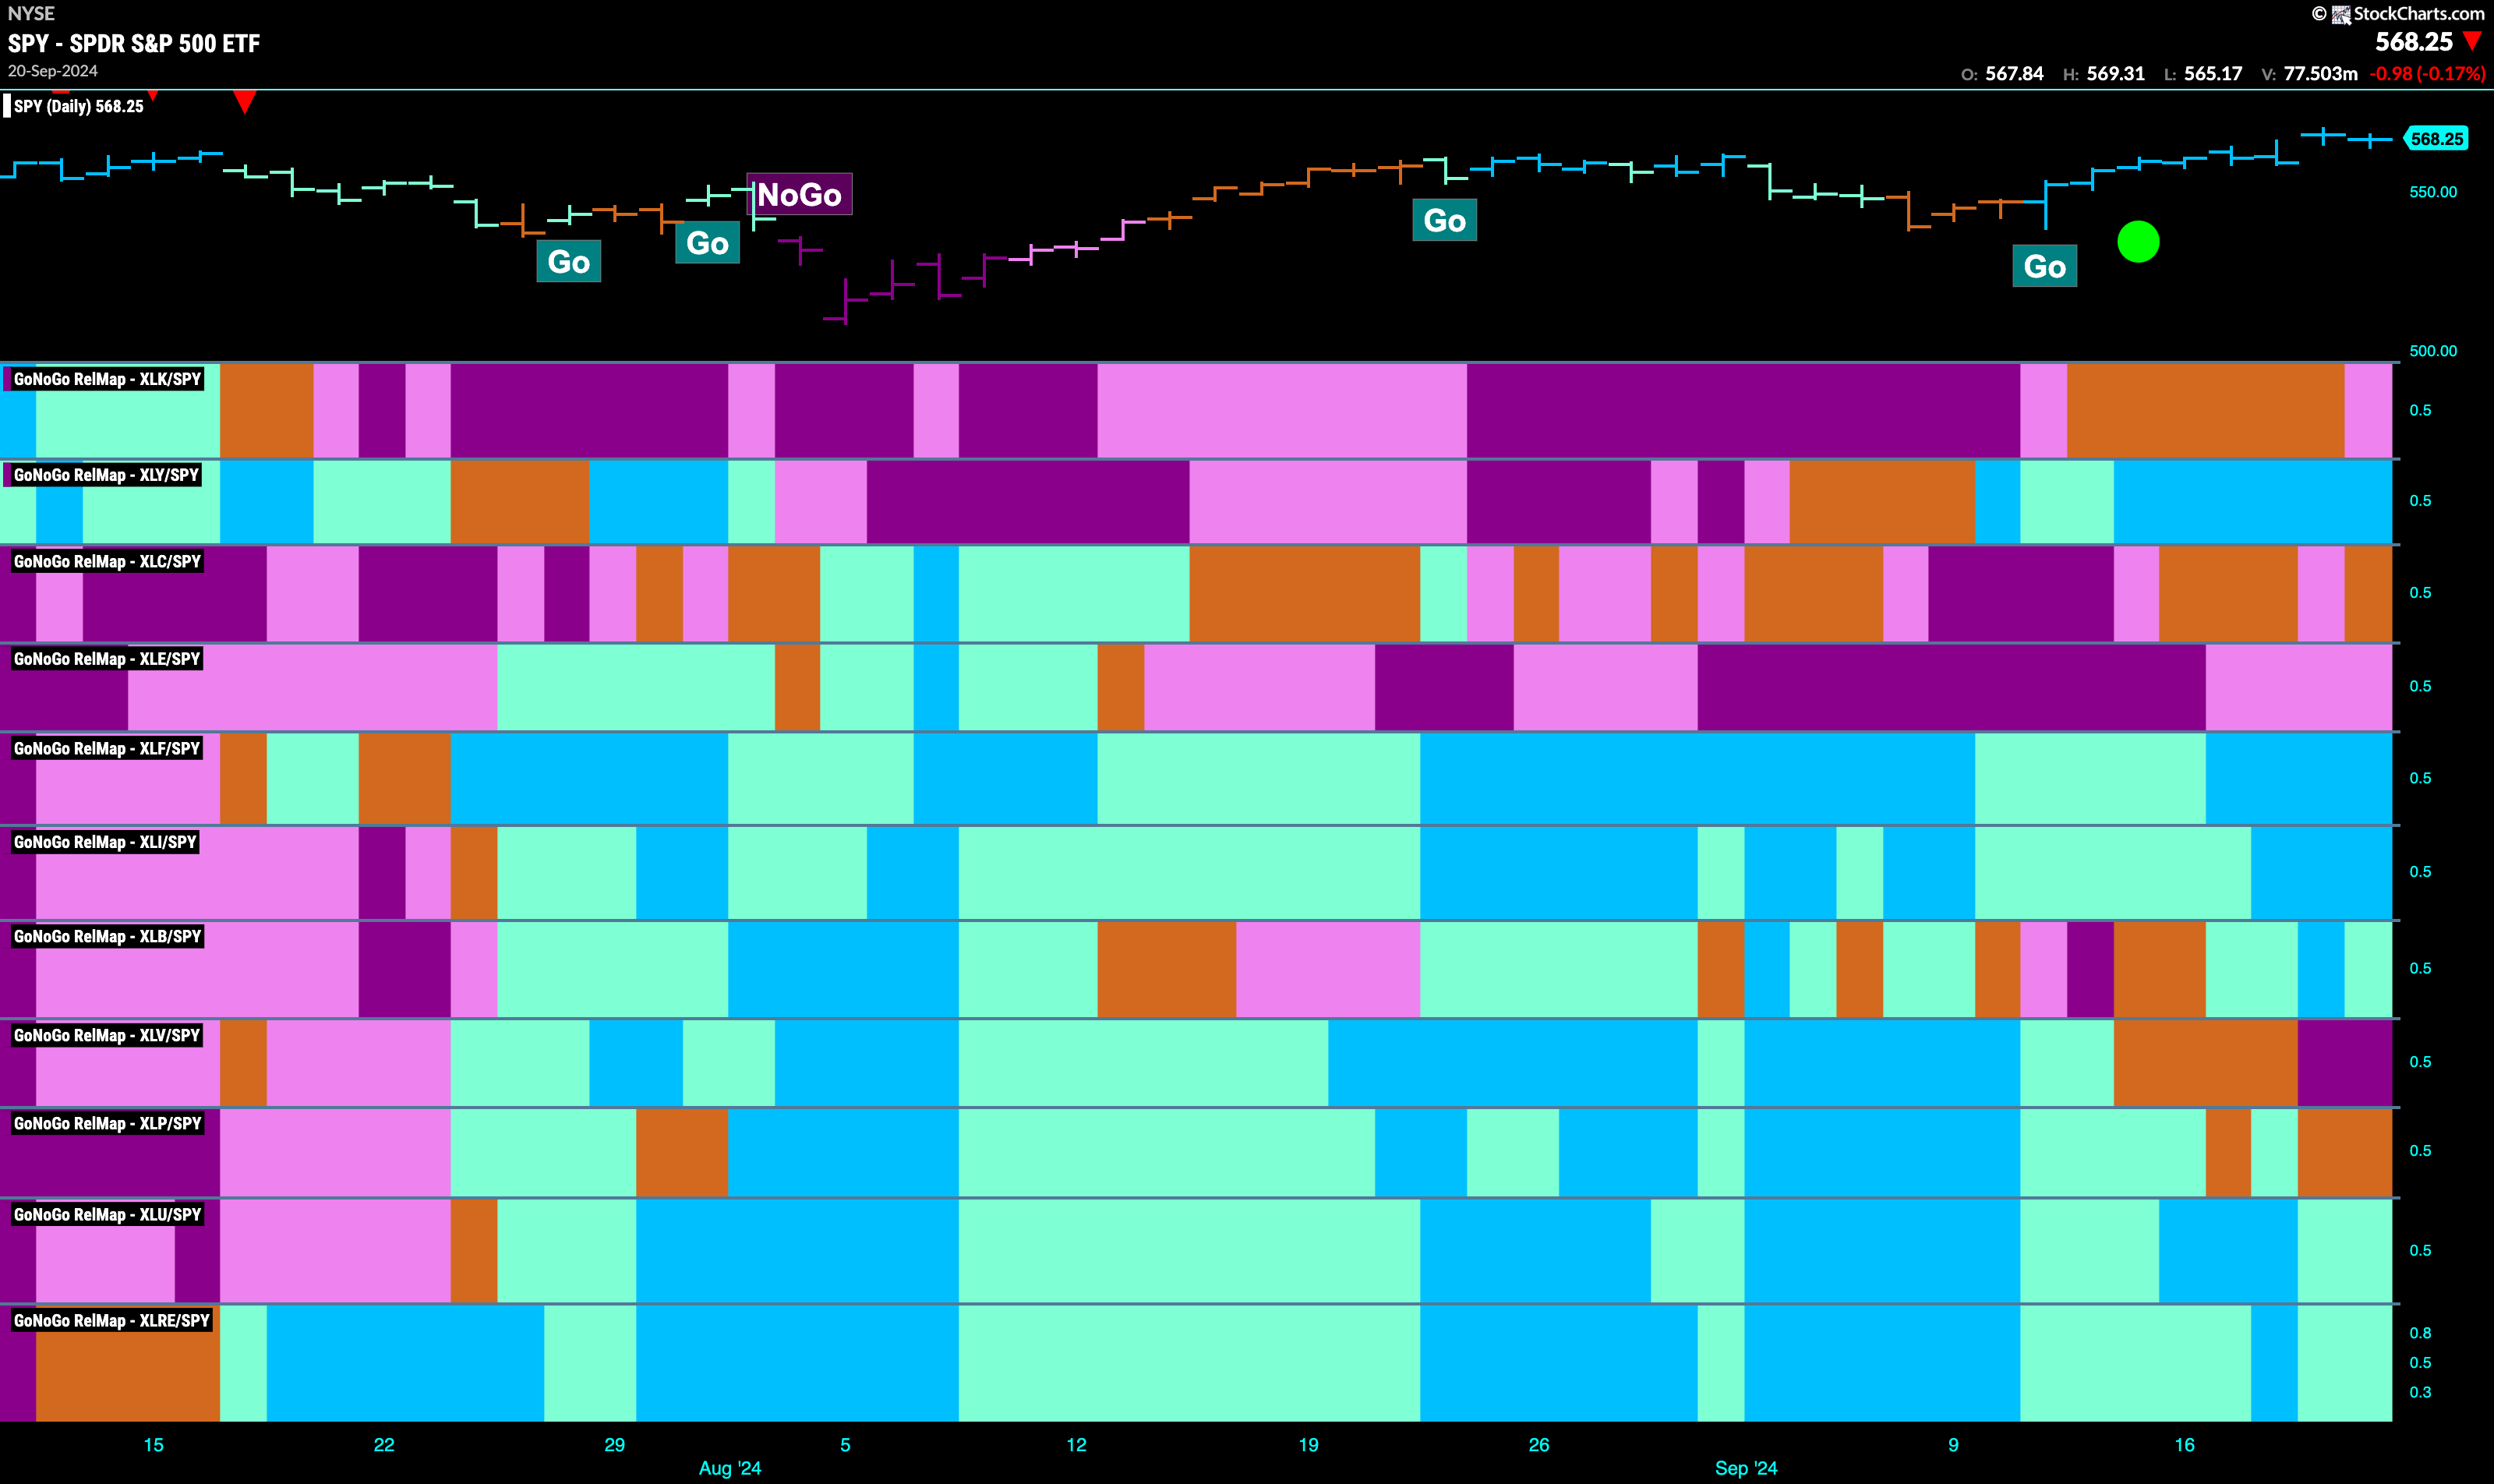
Below is the GoNoGo Sector RelMap. This GoNoGo RelMap applies the GoNoGo Trend to the relative strength ratios of the sectors to the base index. With this view we can get a sense of the relative out performance and relative underperformance of the sectors. 6 sectors are in relative “Go” trends. $XLY, $XLF, $XLI, $XLB, $XLU, $XLRE are painting strong blue bars.
Finacials Sub-Group RelMap
The chart below shows a relative trend breakdown of the sub groups within the Financials sector. The Sub-Group RelMap plots the GoNoGo Trend of each sub index to the $XLF. We saw in the above GoNoGo Sector RelMap that $XLF was one of the out-performers, performing strongly relative to the larger index and painting bright blue bars. If we look at the breakdown of the groups in the map below we can see where that outperformance is coming from. Painting strong blue bars, in the 3rd panel, the financial administration index is in a strong relative “Go” trend. 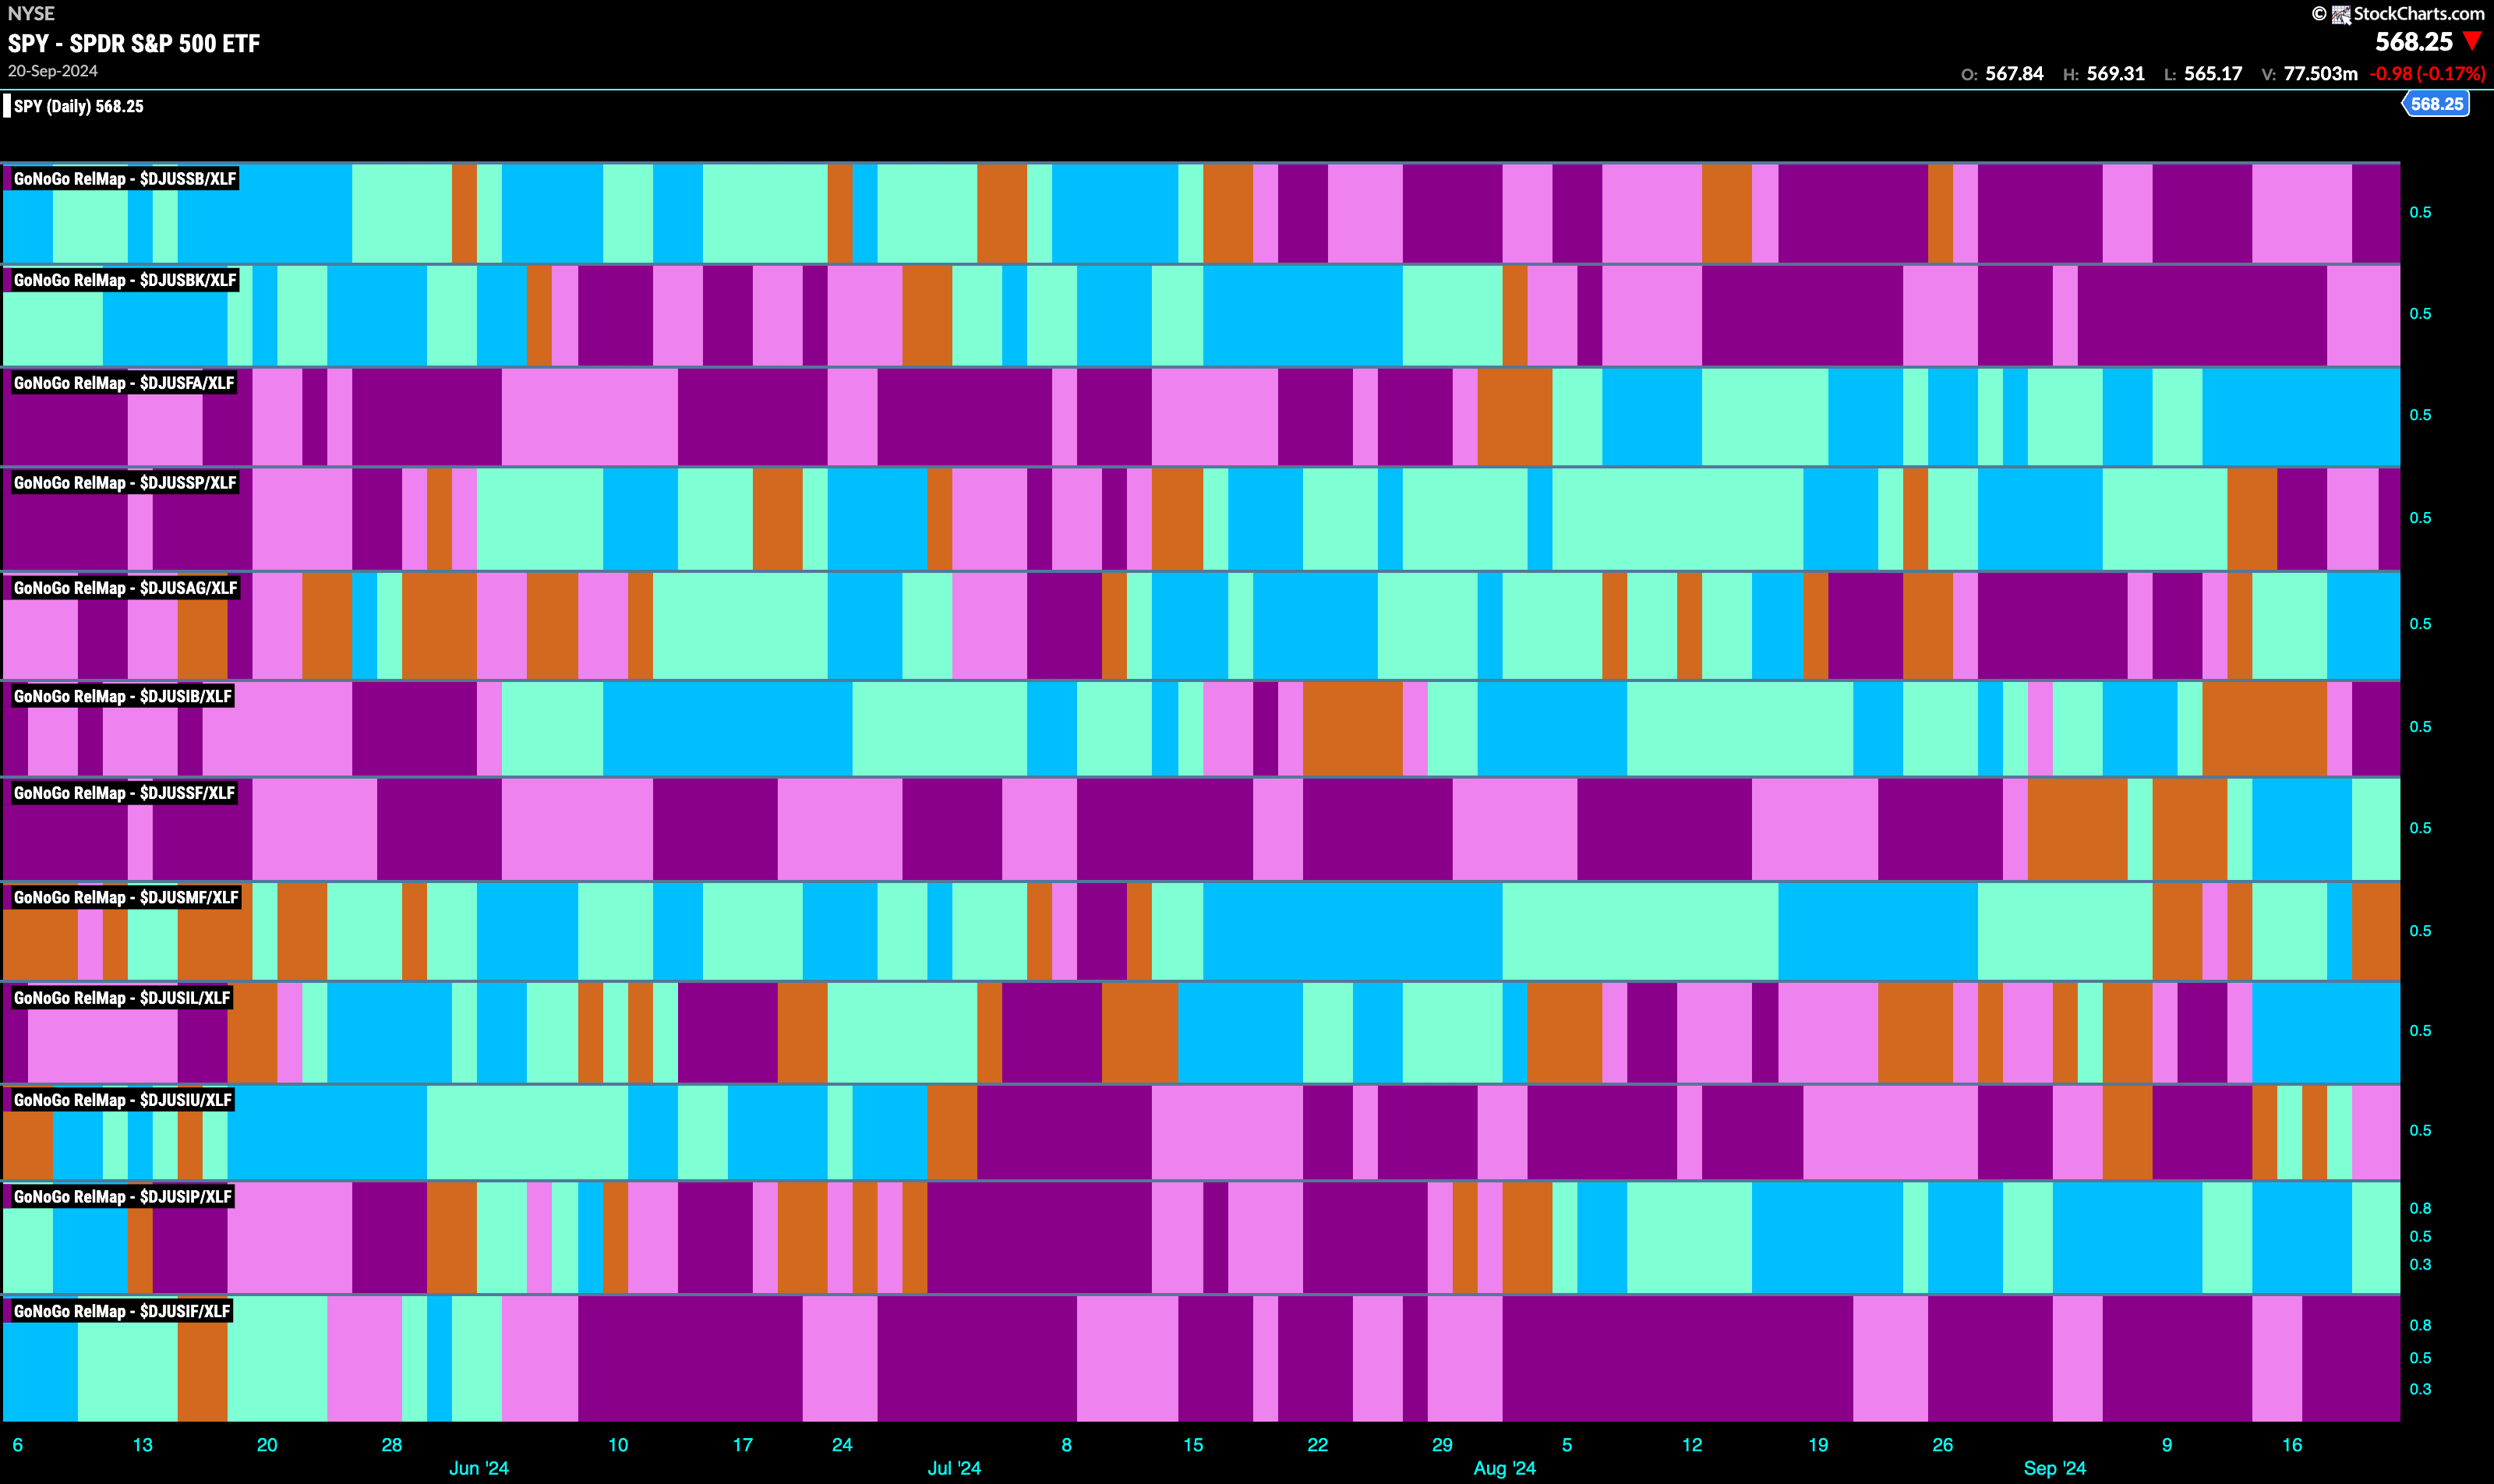
$NATL Shows Uncertainty with “Go Fish” Bar
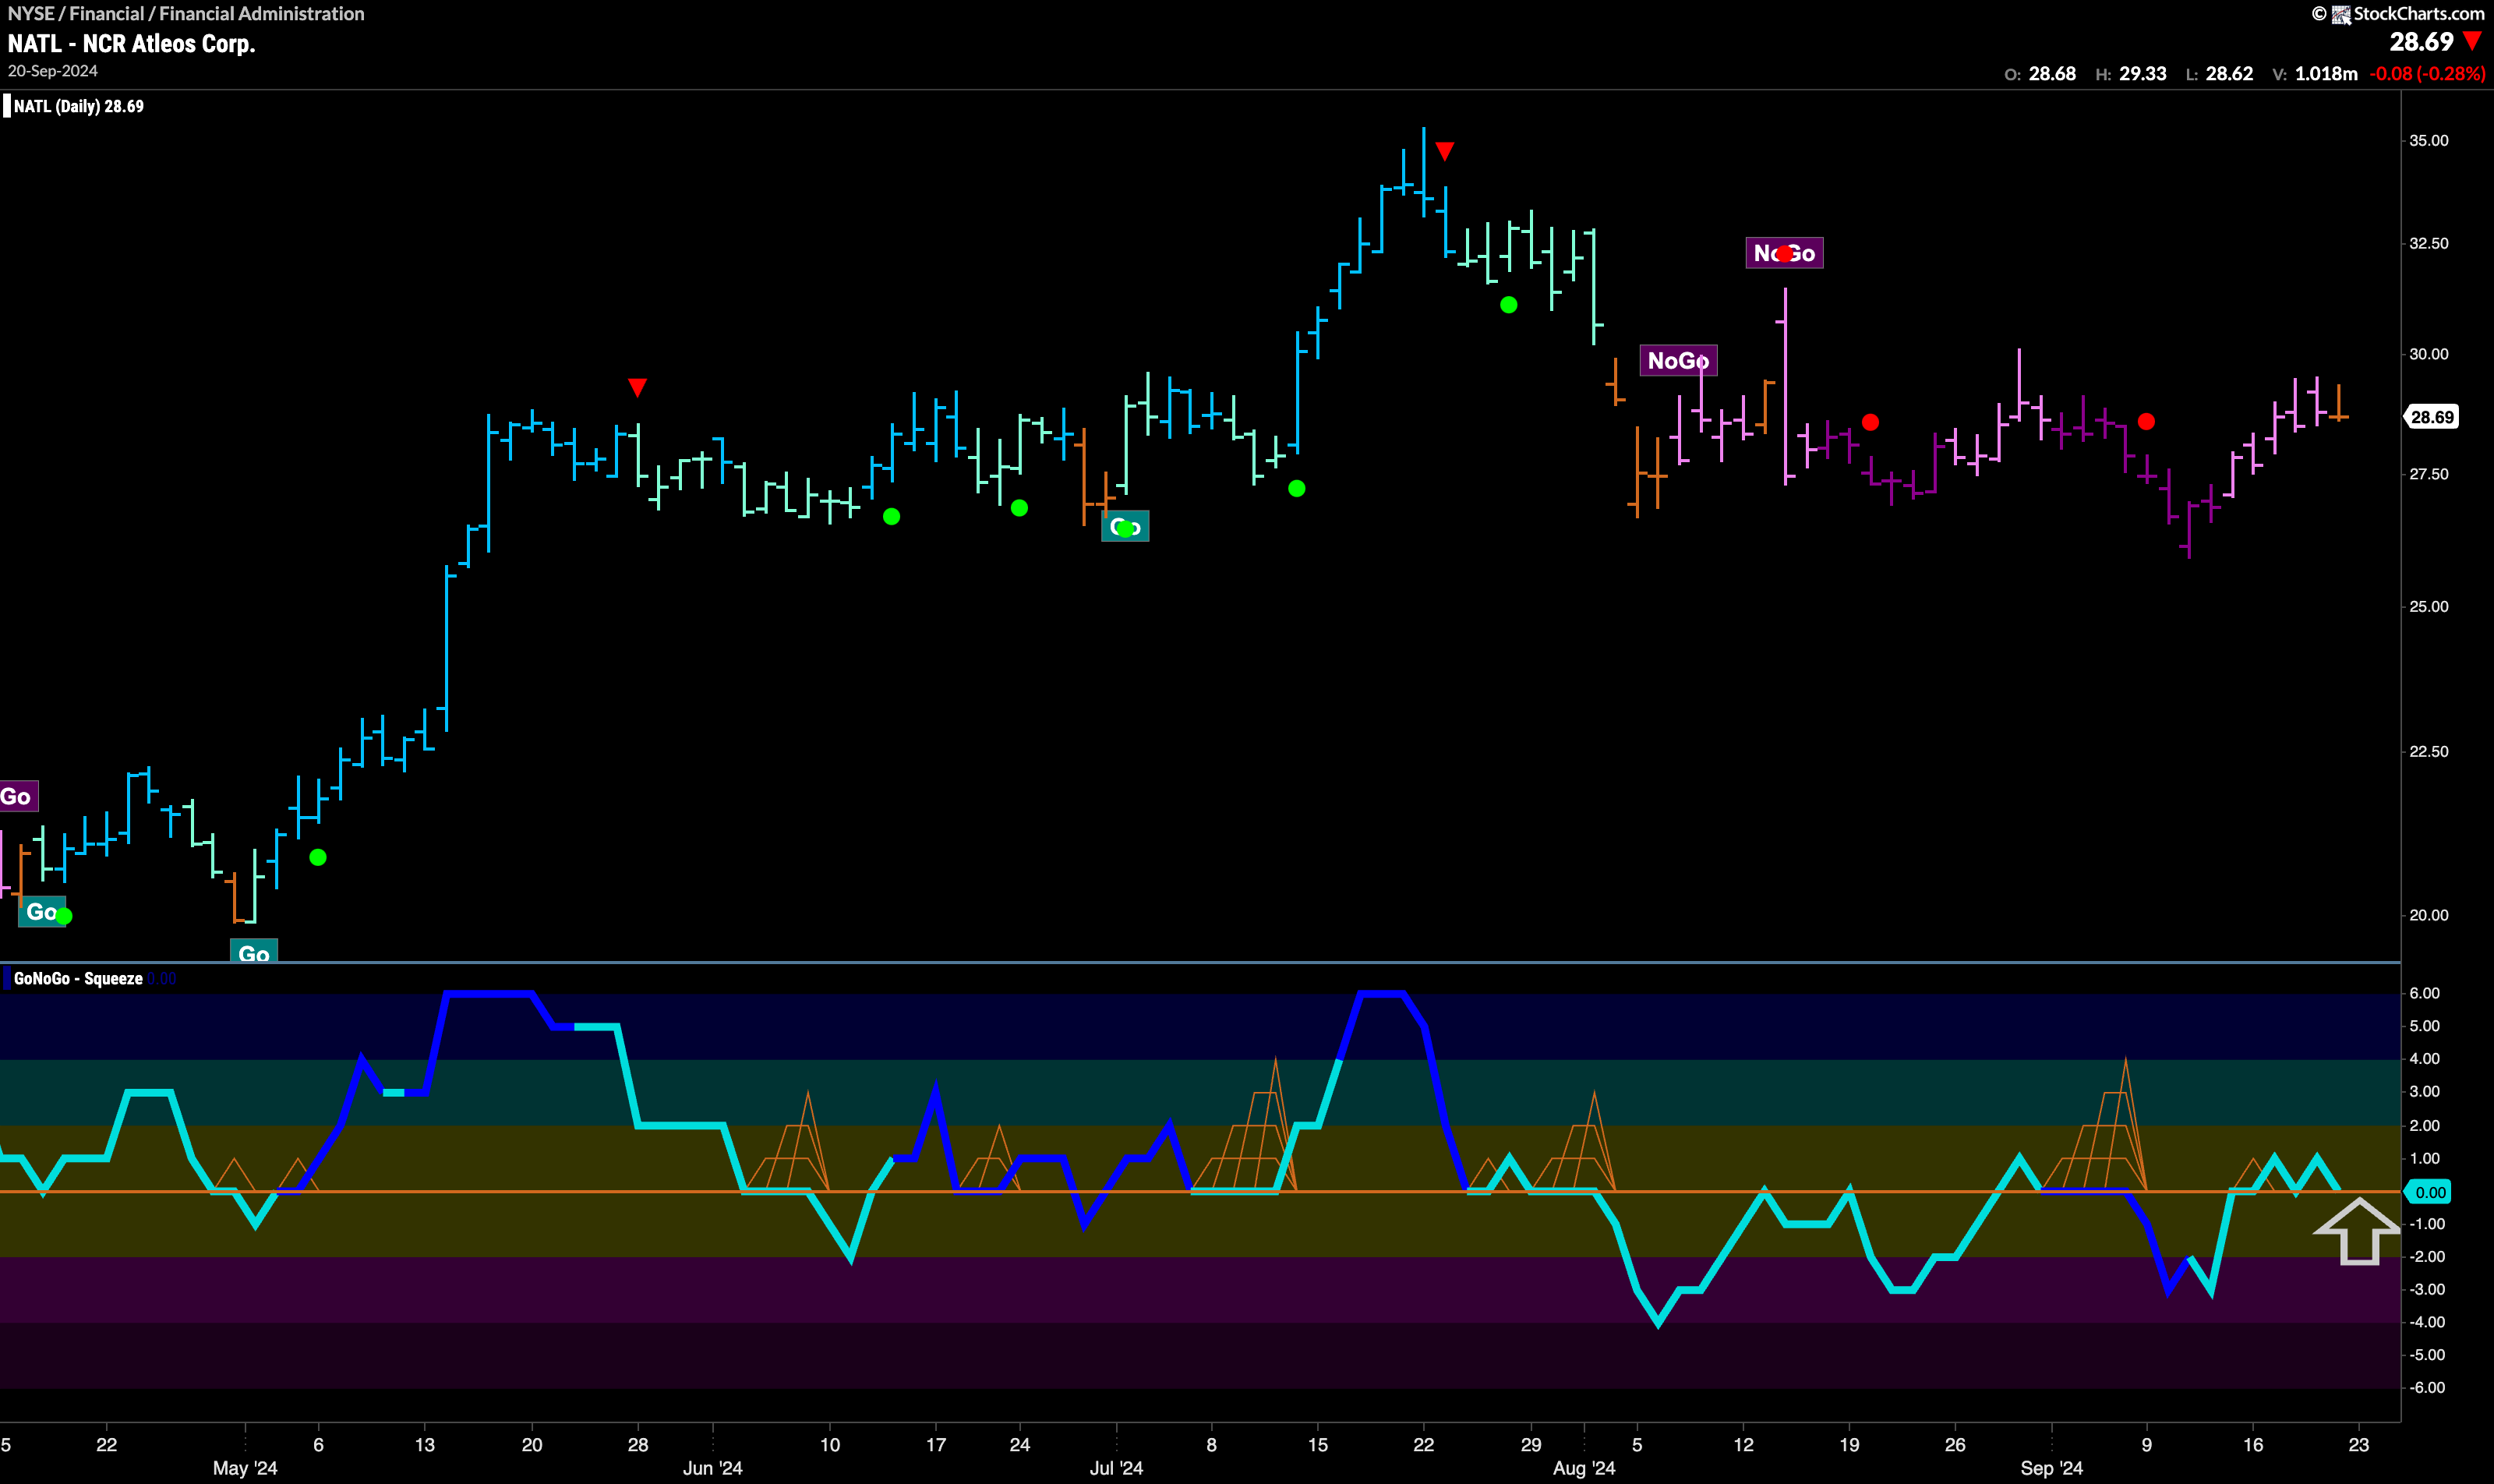
The chart below shows that the market is uncertain as to the health of the “NoGo” trend we have been in. As GoNoGo Trend paints an amber “Go Fish” bar, we see that GoNoGo Oscillator has been able to dip its nose into positive territory and find support at that level. Now, as we see the oscillator drop to zero again, it will be important to see if it finds support. If it does, we may well see a trend change in the price panel above.
$BW Enters New “Go” Trend
$BW has emerged out of its “NoGo” move. After a few bars of amber “Go Fish” uncertainty, we have seen two aqua “Go” bars in a row. This comes after GoNoGo Oscillator broke out of a Max GoNoGo Squeeze a week ago and then quickly retested zero and found support. This tells us that momentum is now on the side of the new “Go” trend. We will look for price to consolidate at these new levels and for the “Go” trend to continue in the coming days/weeks. 


