Good morning and welcome to this week’s Flight Path. We saw some weakness this week in the equity market as price was unable to surpass last week’s highs. GoNoGo Trend painted uninterrupted aqua “Go” bars, reflecting that weakness. Treasury bond prices returned to a “NoGo” as rates rose, and we see pink bars. GoNoGo Trend painted a solid week of strong blue “Go” bars as the U.S. commodity index showed strength. The dollar continued to demonstrate market uncertainty as the indicator returned to paint an amber “Go Fish” bars after one bar of a “NoGo”.
U.S. Equities Show Some Weakness
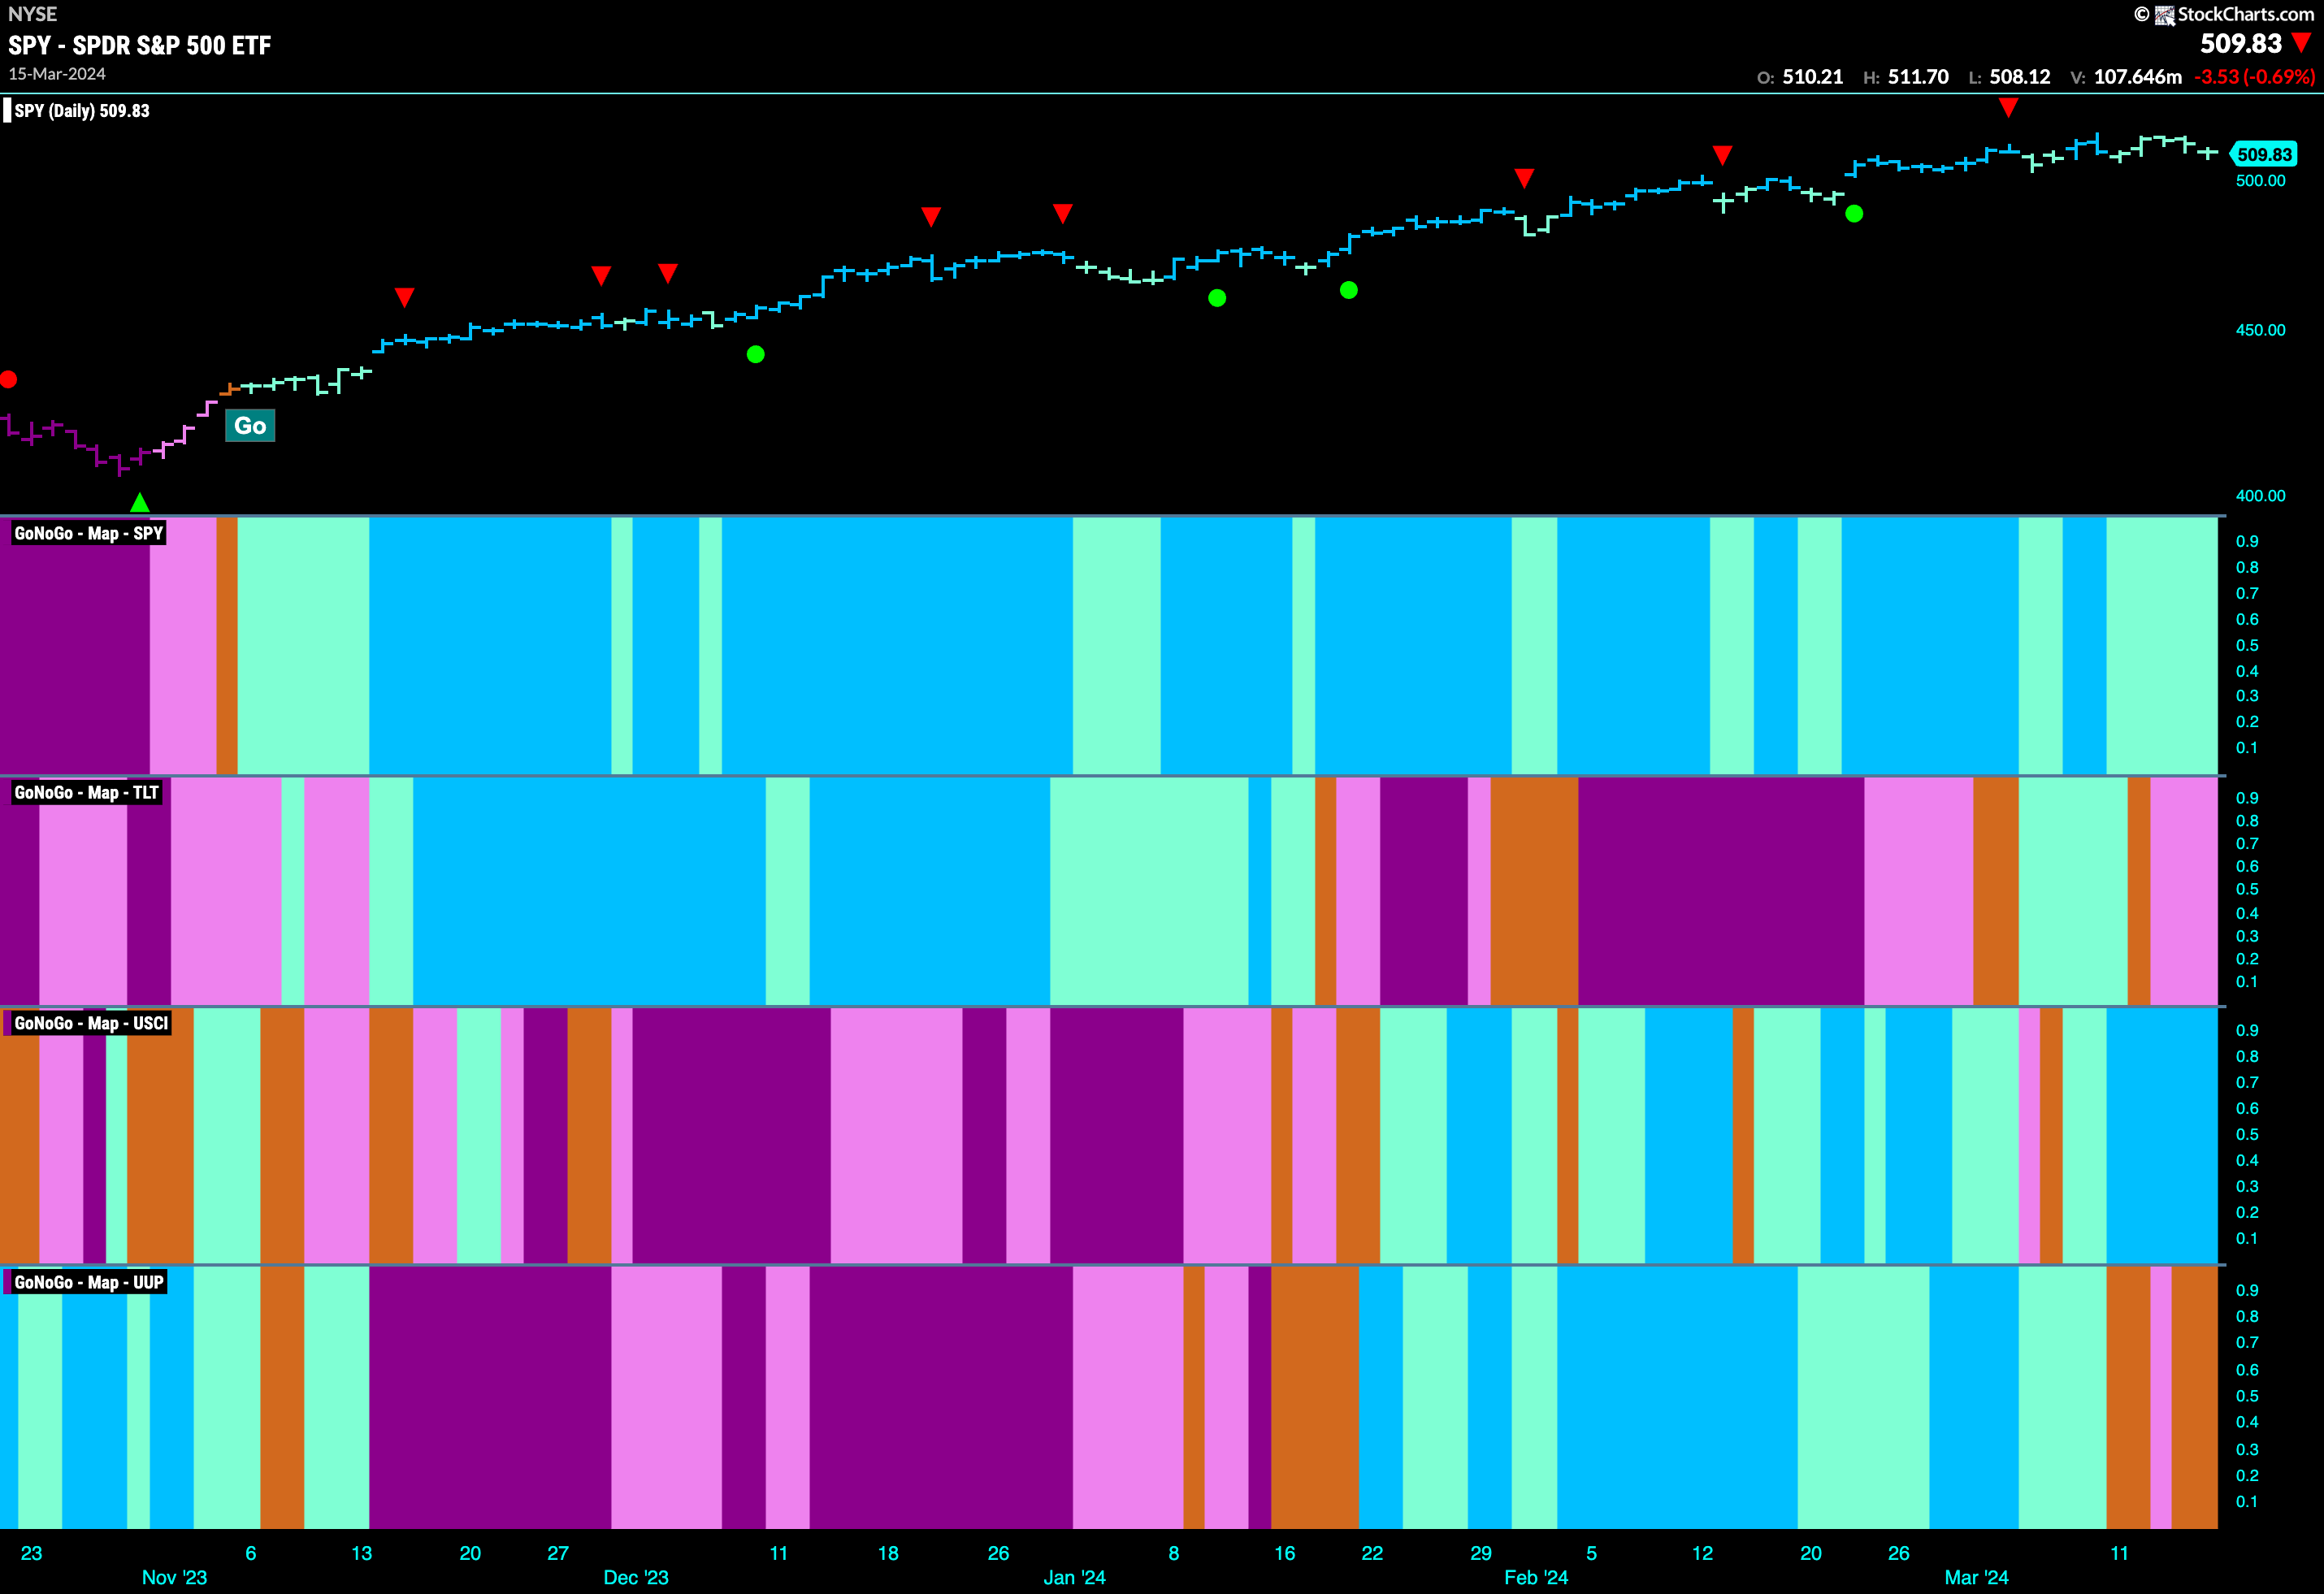
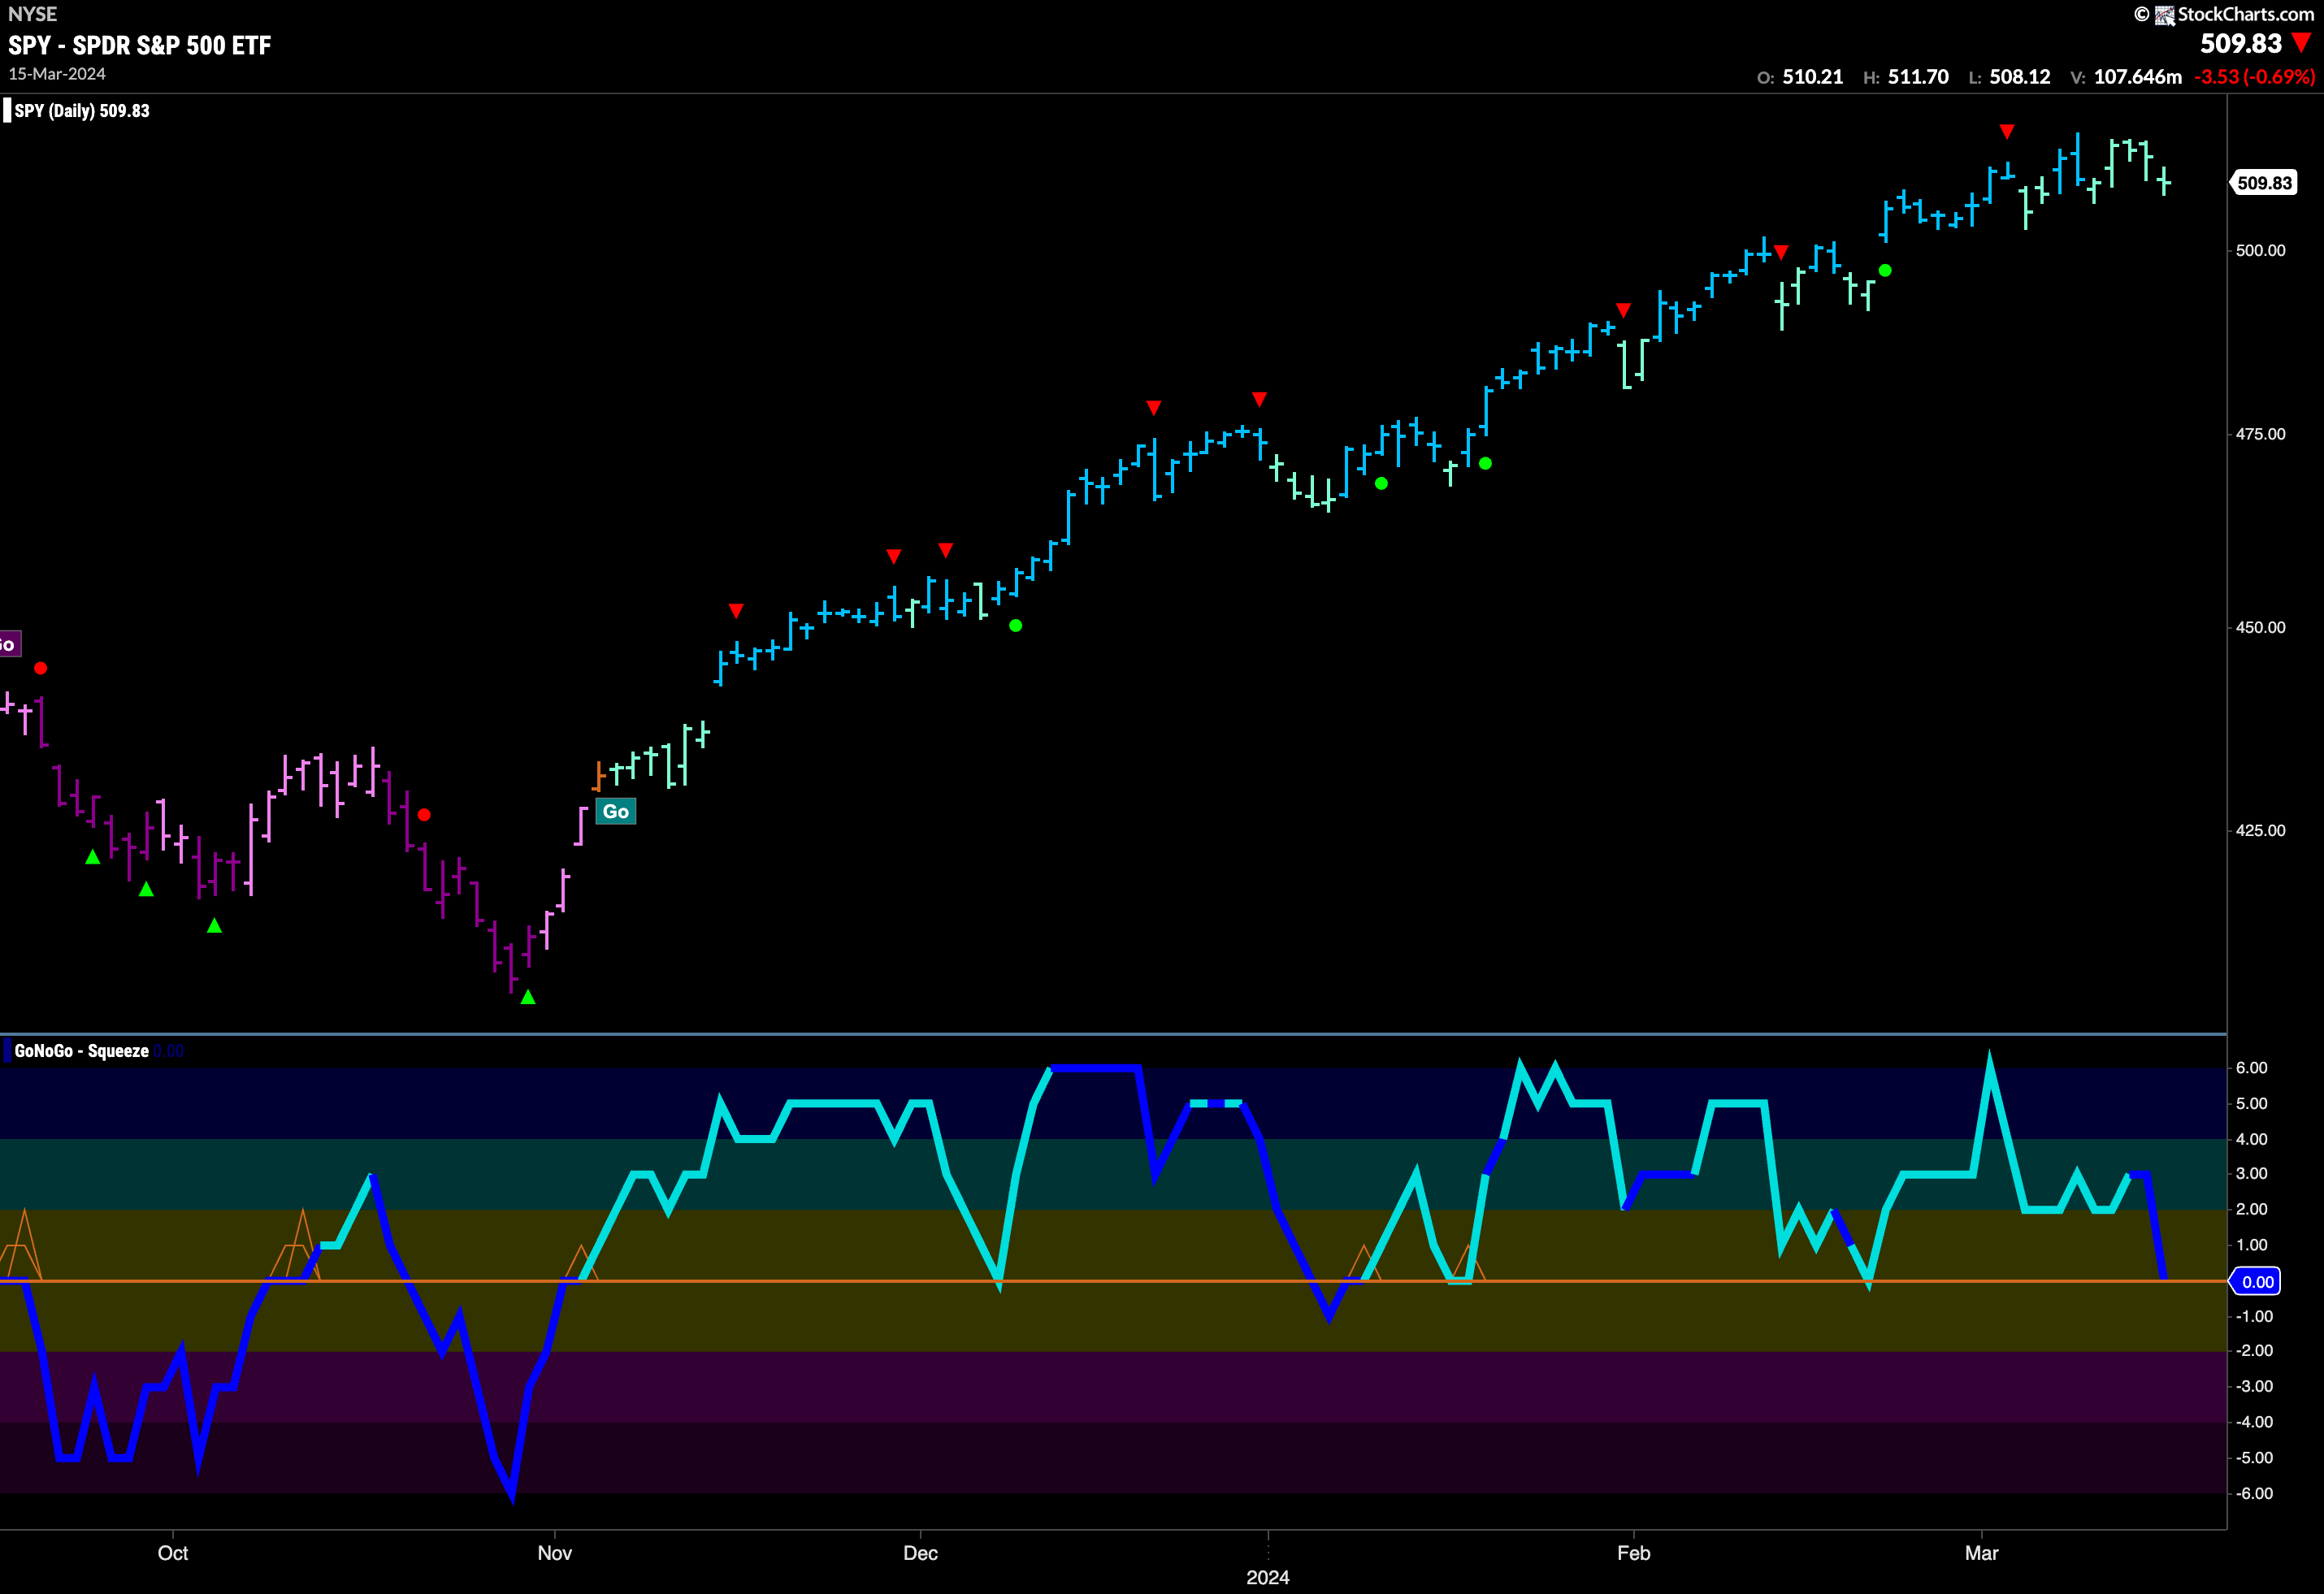
This “Go” trend continues for another week but we are seeing some signs of weakness. Price failed to make a higher high this week and GoNoGo Trend painted a string of weaker aqua bars. This waning price action sent GoNoGo Oscillator to zero by the end of the week where we know it will look for support. If this “Go” trend is to remain healthy we would like to see the oscillator find support at this level and rally back into positive territory. This would indicate likely trend continuation. Of course, if the oscillator fails to find support at zero and drops into negative territory that would be a concern for the “Go” trend.
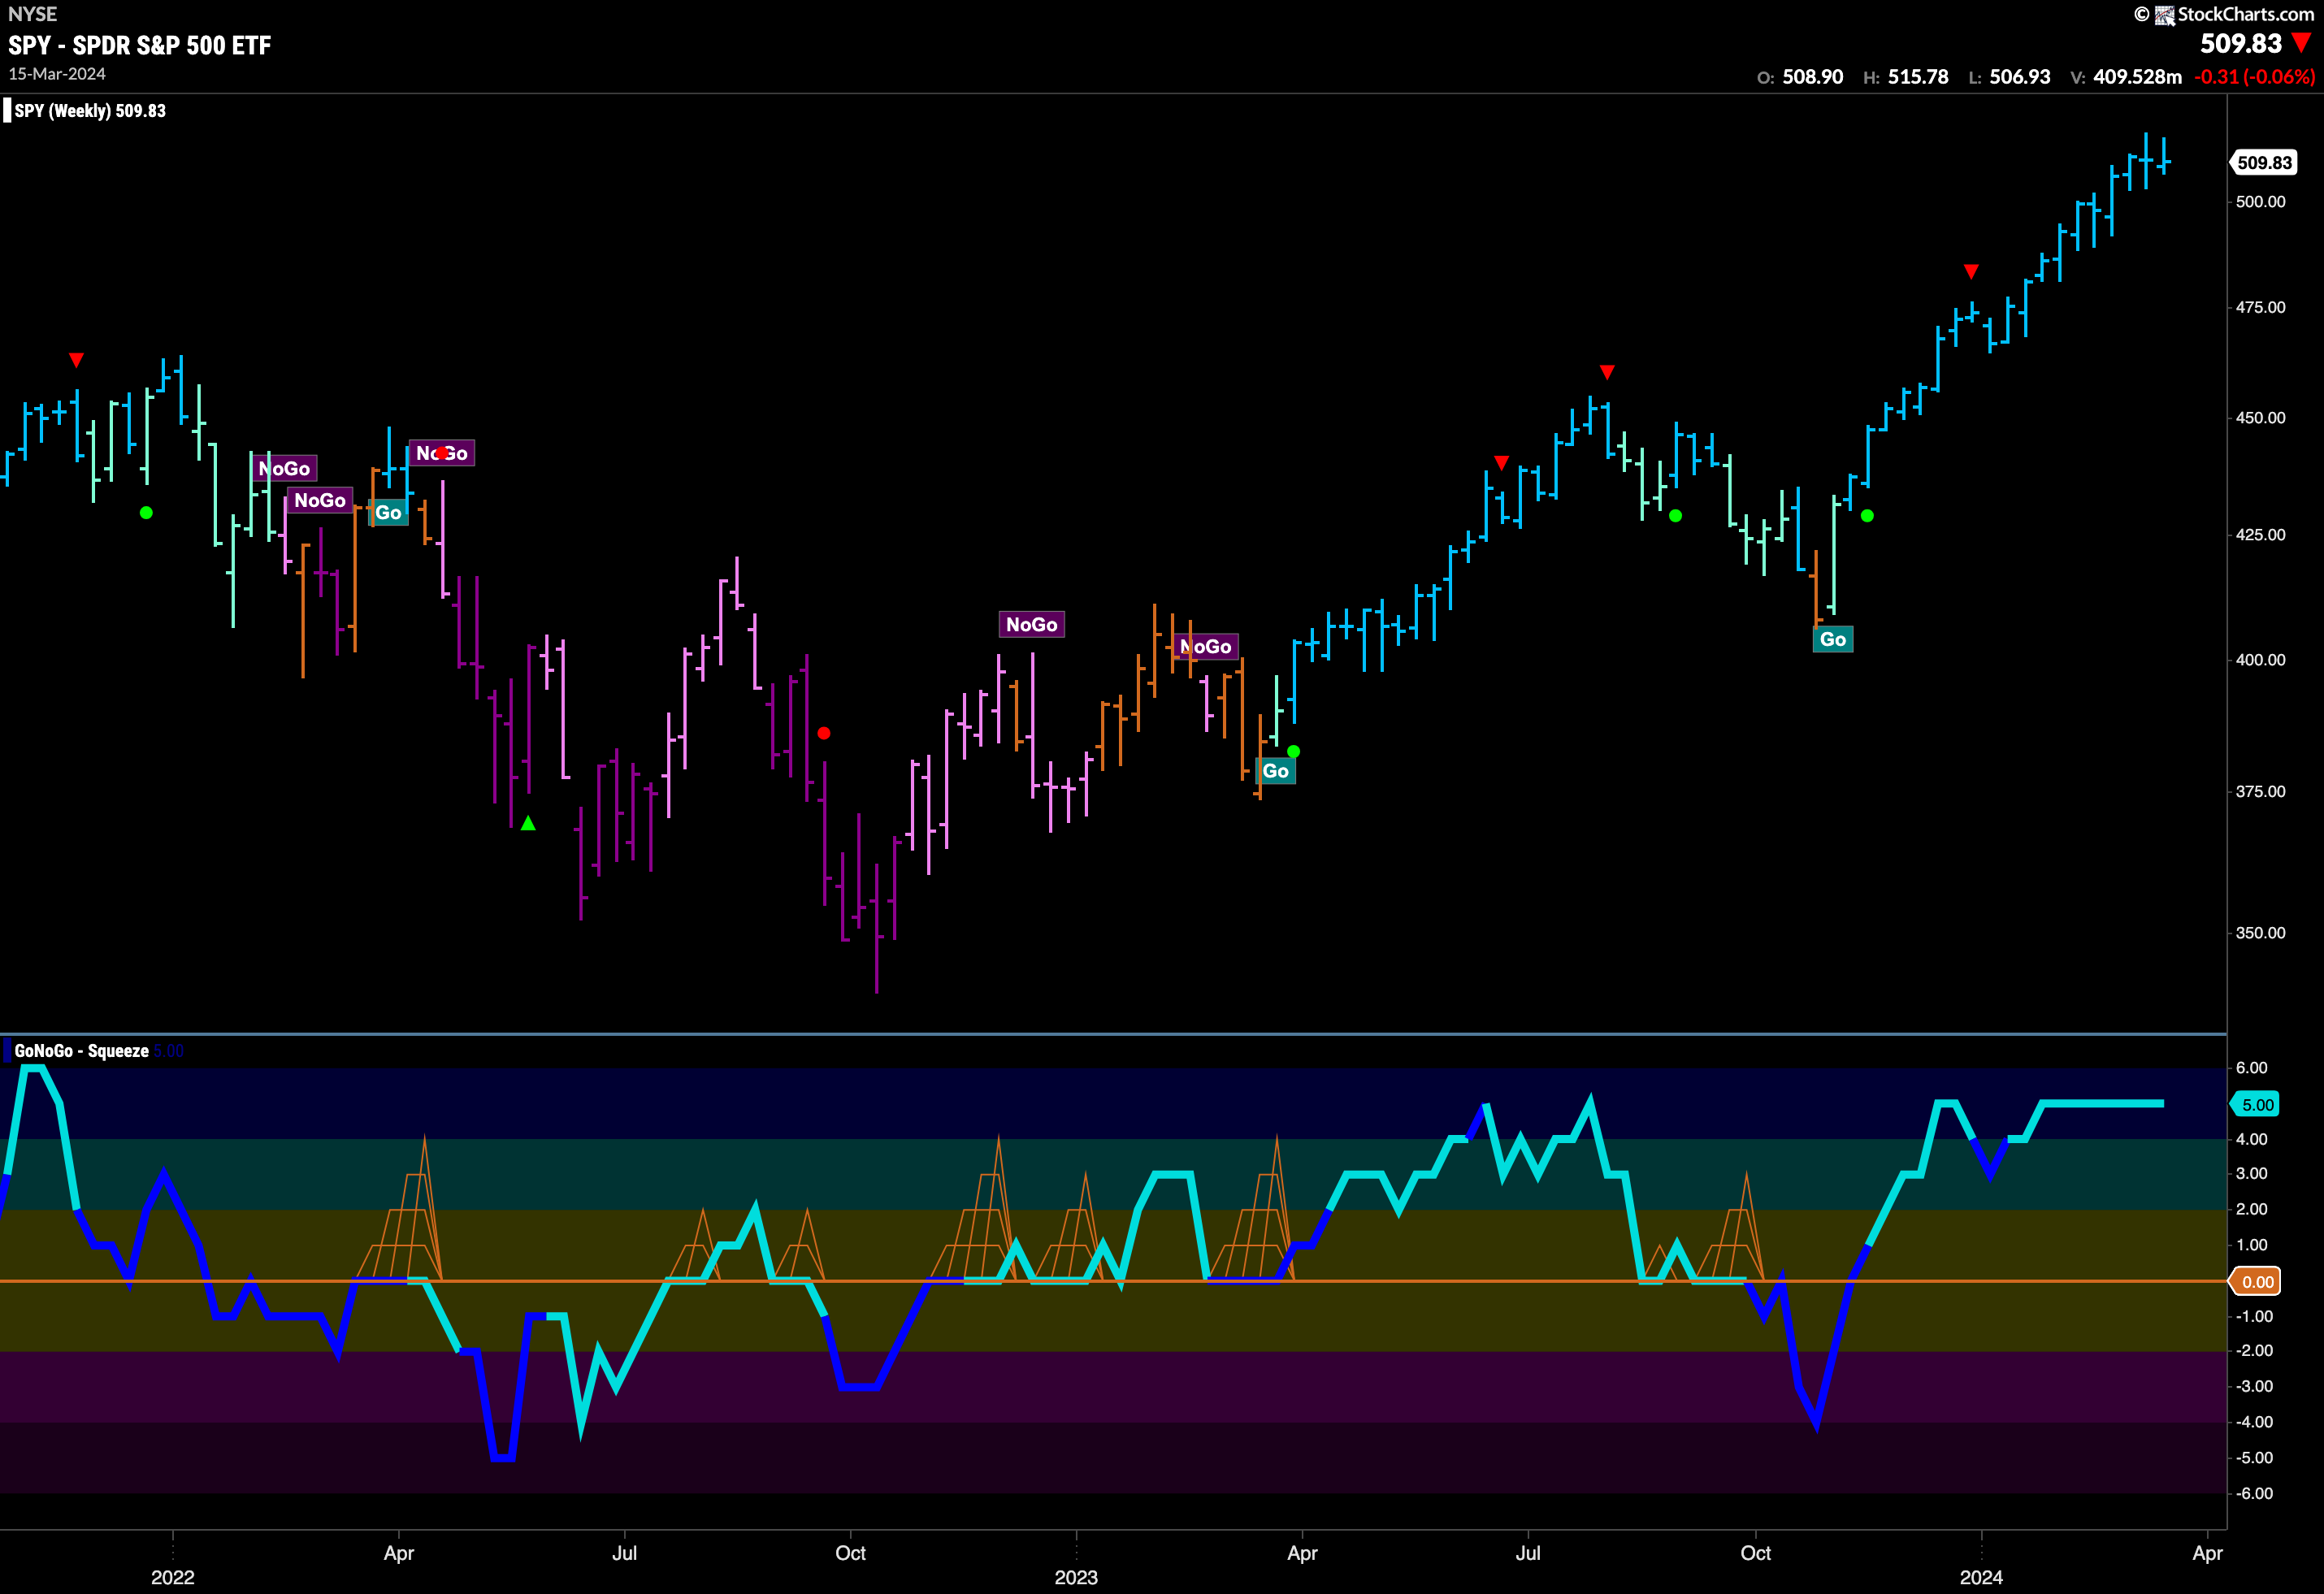
The weekly chart shows that although the trend remains strong, we had a second consecutive lower weekly close. Momentum is still overbought and we will watch to see if momentum cools. If GoNoGo Oscillator falls below a value of 5 we will see a Go Countertrend Correction Icon (red arrow) above the price bar telling us that in the short term price may struggle to go higher. This could line up with a larger correction on the daily chart.
Rates Recover Rapidly
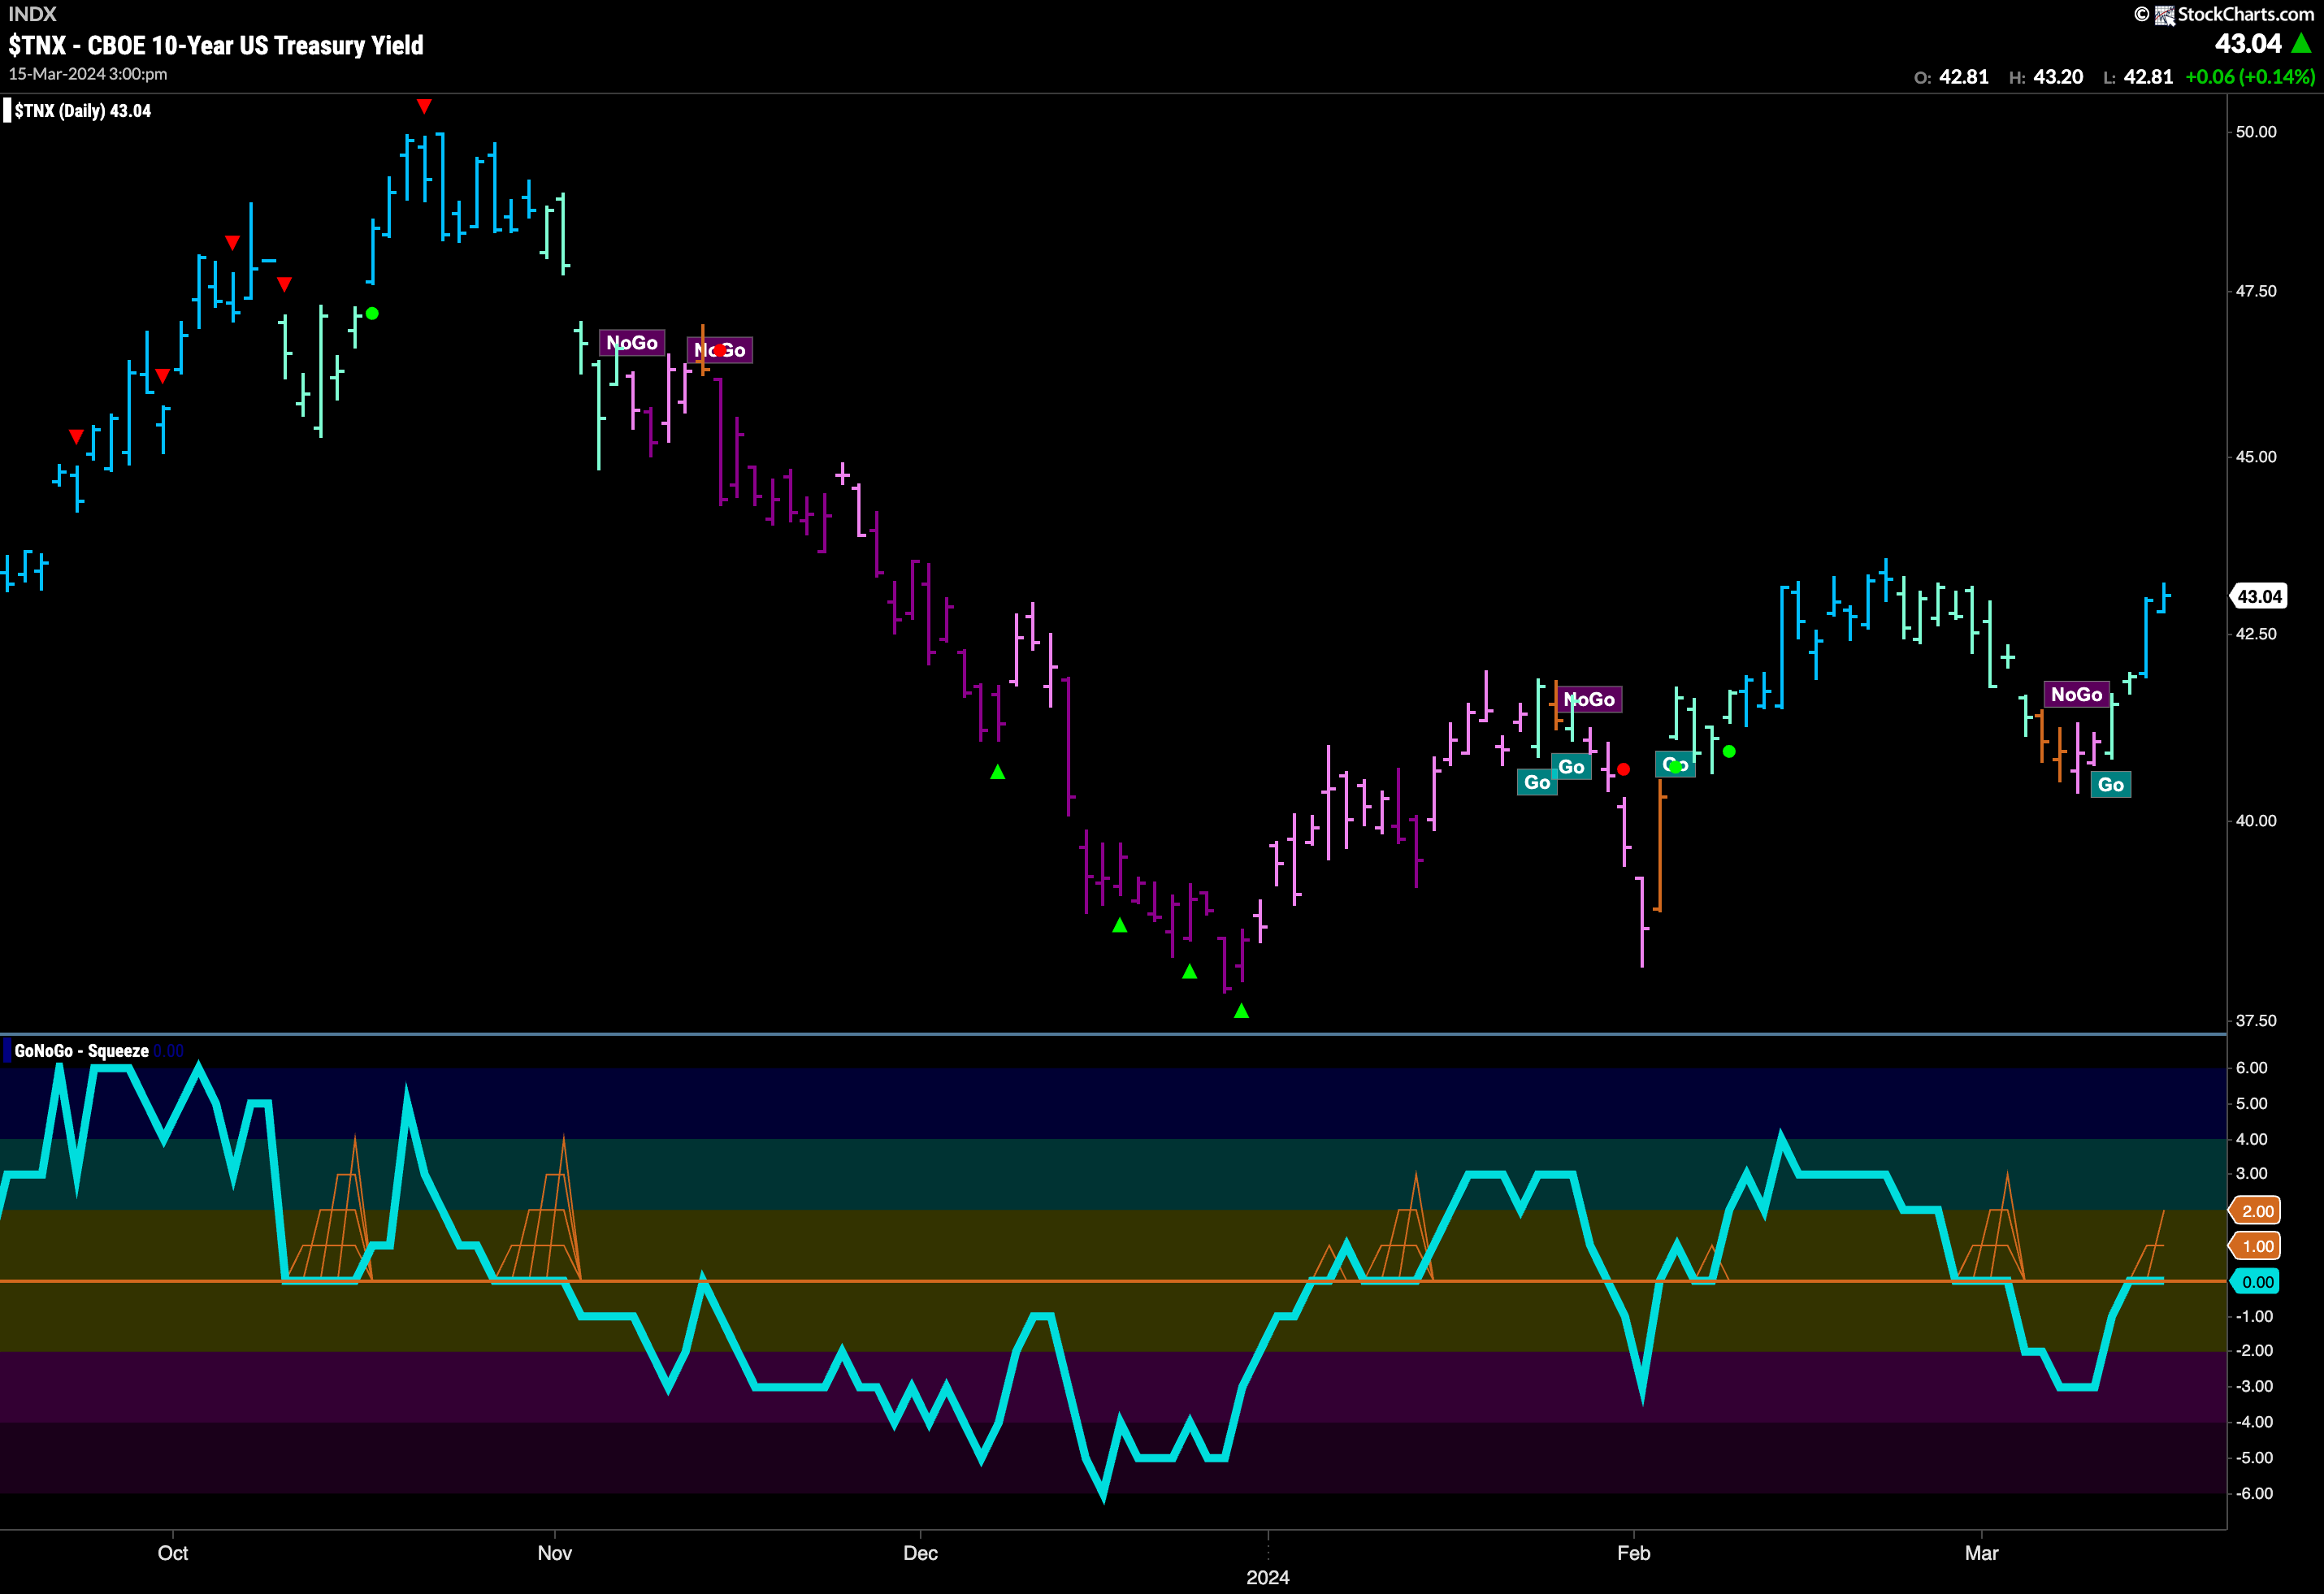
Treasury rates rebounded from a rough week and rallied off what now look to be higher lows. We see GoNoGo Trend paint a couple of strong blue “Go” bars after two aqua bars. As price tests resistance in the form of recent prior high, we will watch GoNoGo Oscillator as it struggles with the zero line. If GoNoGo Oscillator breaks above zero then we will be able to say that momentum is in line with the new “Go” trend and we would expect price to make an attempt at a new higher high. If the oscillator gets rejected by the zero line then that will pose a problem for price.
Uncertainty Surrounds the Dollar
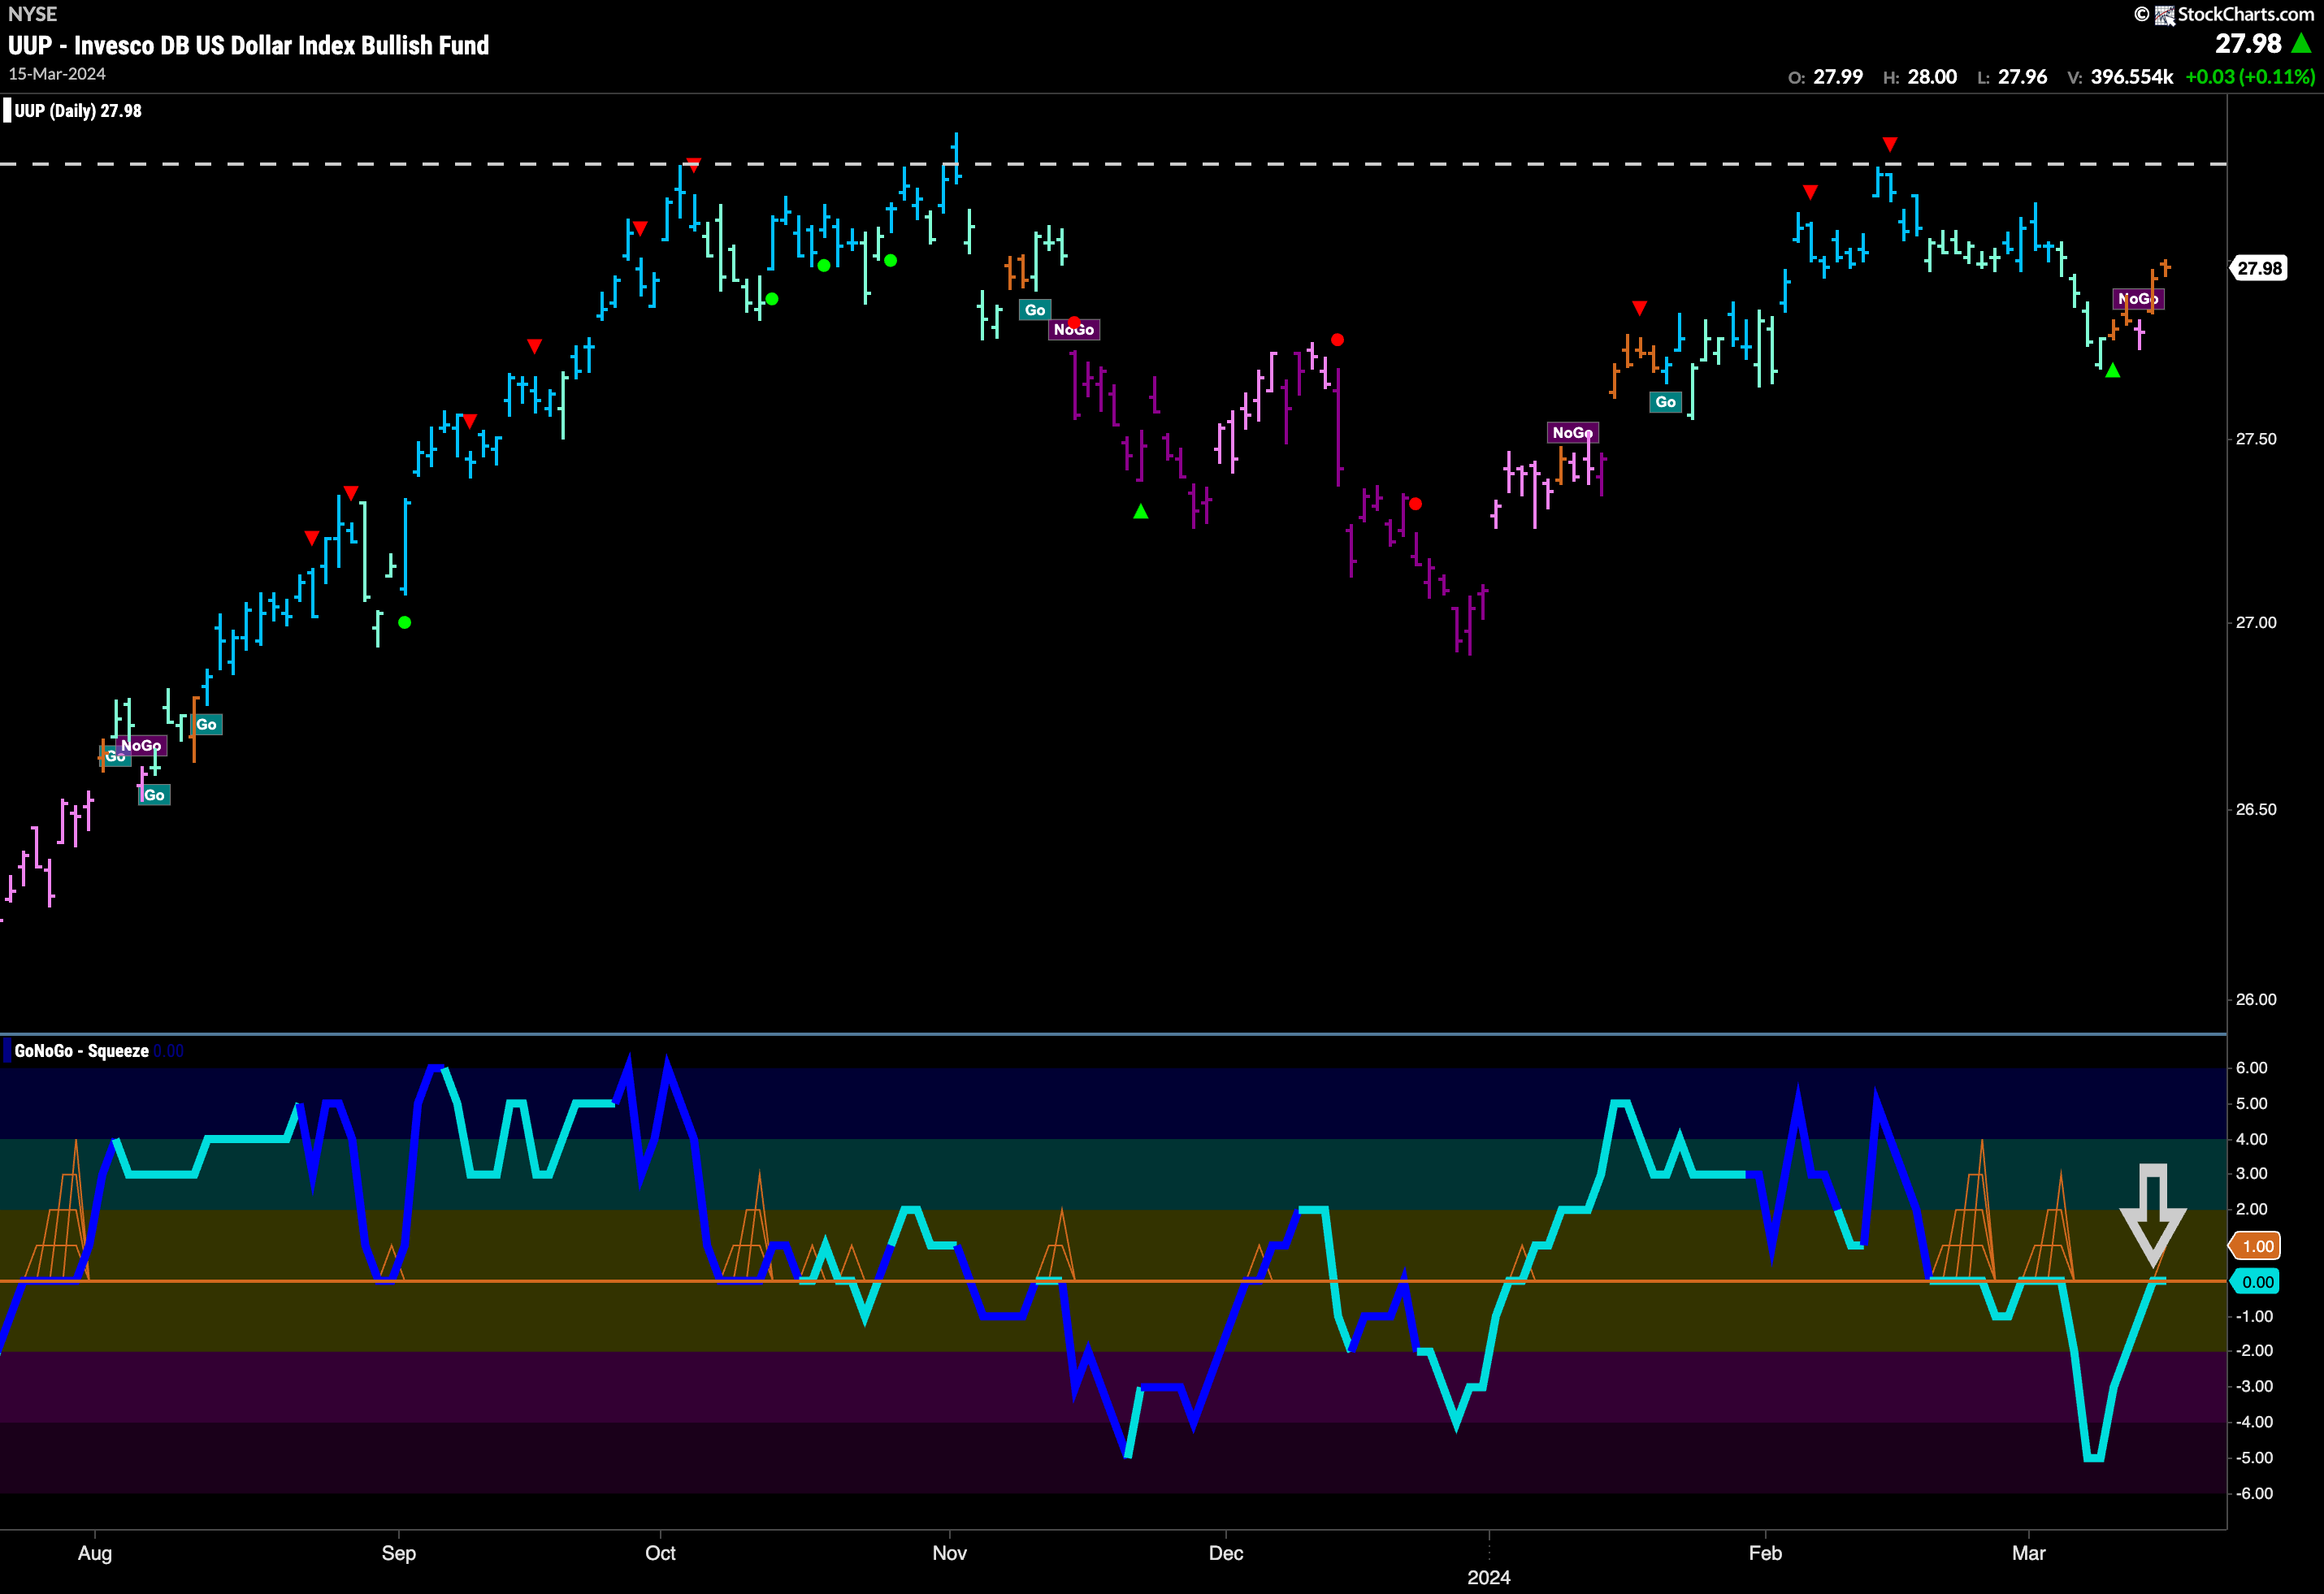
Like rates, the dollar rallied this week but has not yet been able to flag a new “Go” trend. 4 “Go Fish” bars were painted this week bookending a pink “NoGo” bar in the middle of the week. We can see the overhead resistance that remains above price and we will see what the market decides this week. GoNoGo Oscillator is at the zero line testing it from below. If it is rejected here, then we would expect a return to a “NoGo” trend. If the oscillator is able to break into positive territory that might give price the push it needs to enter a “Go” trend and test new highs.
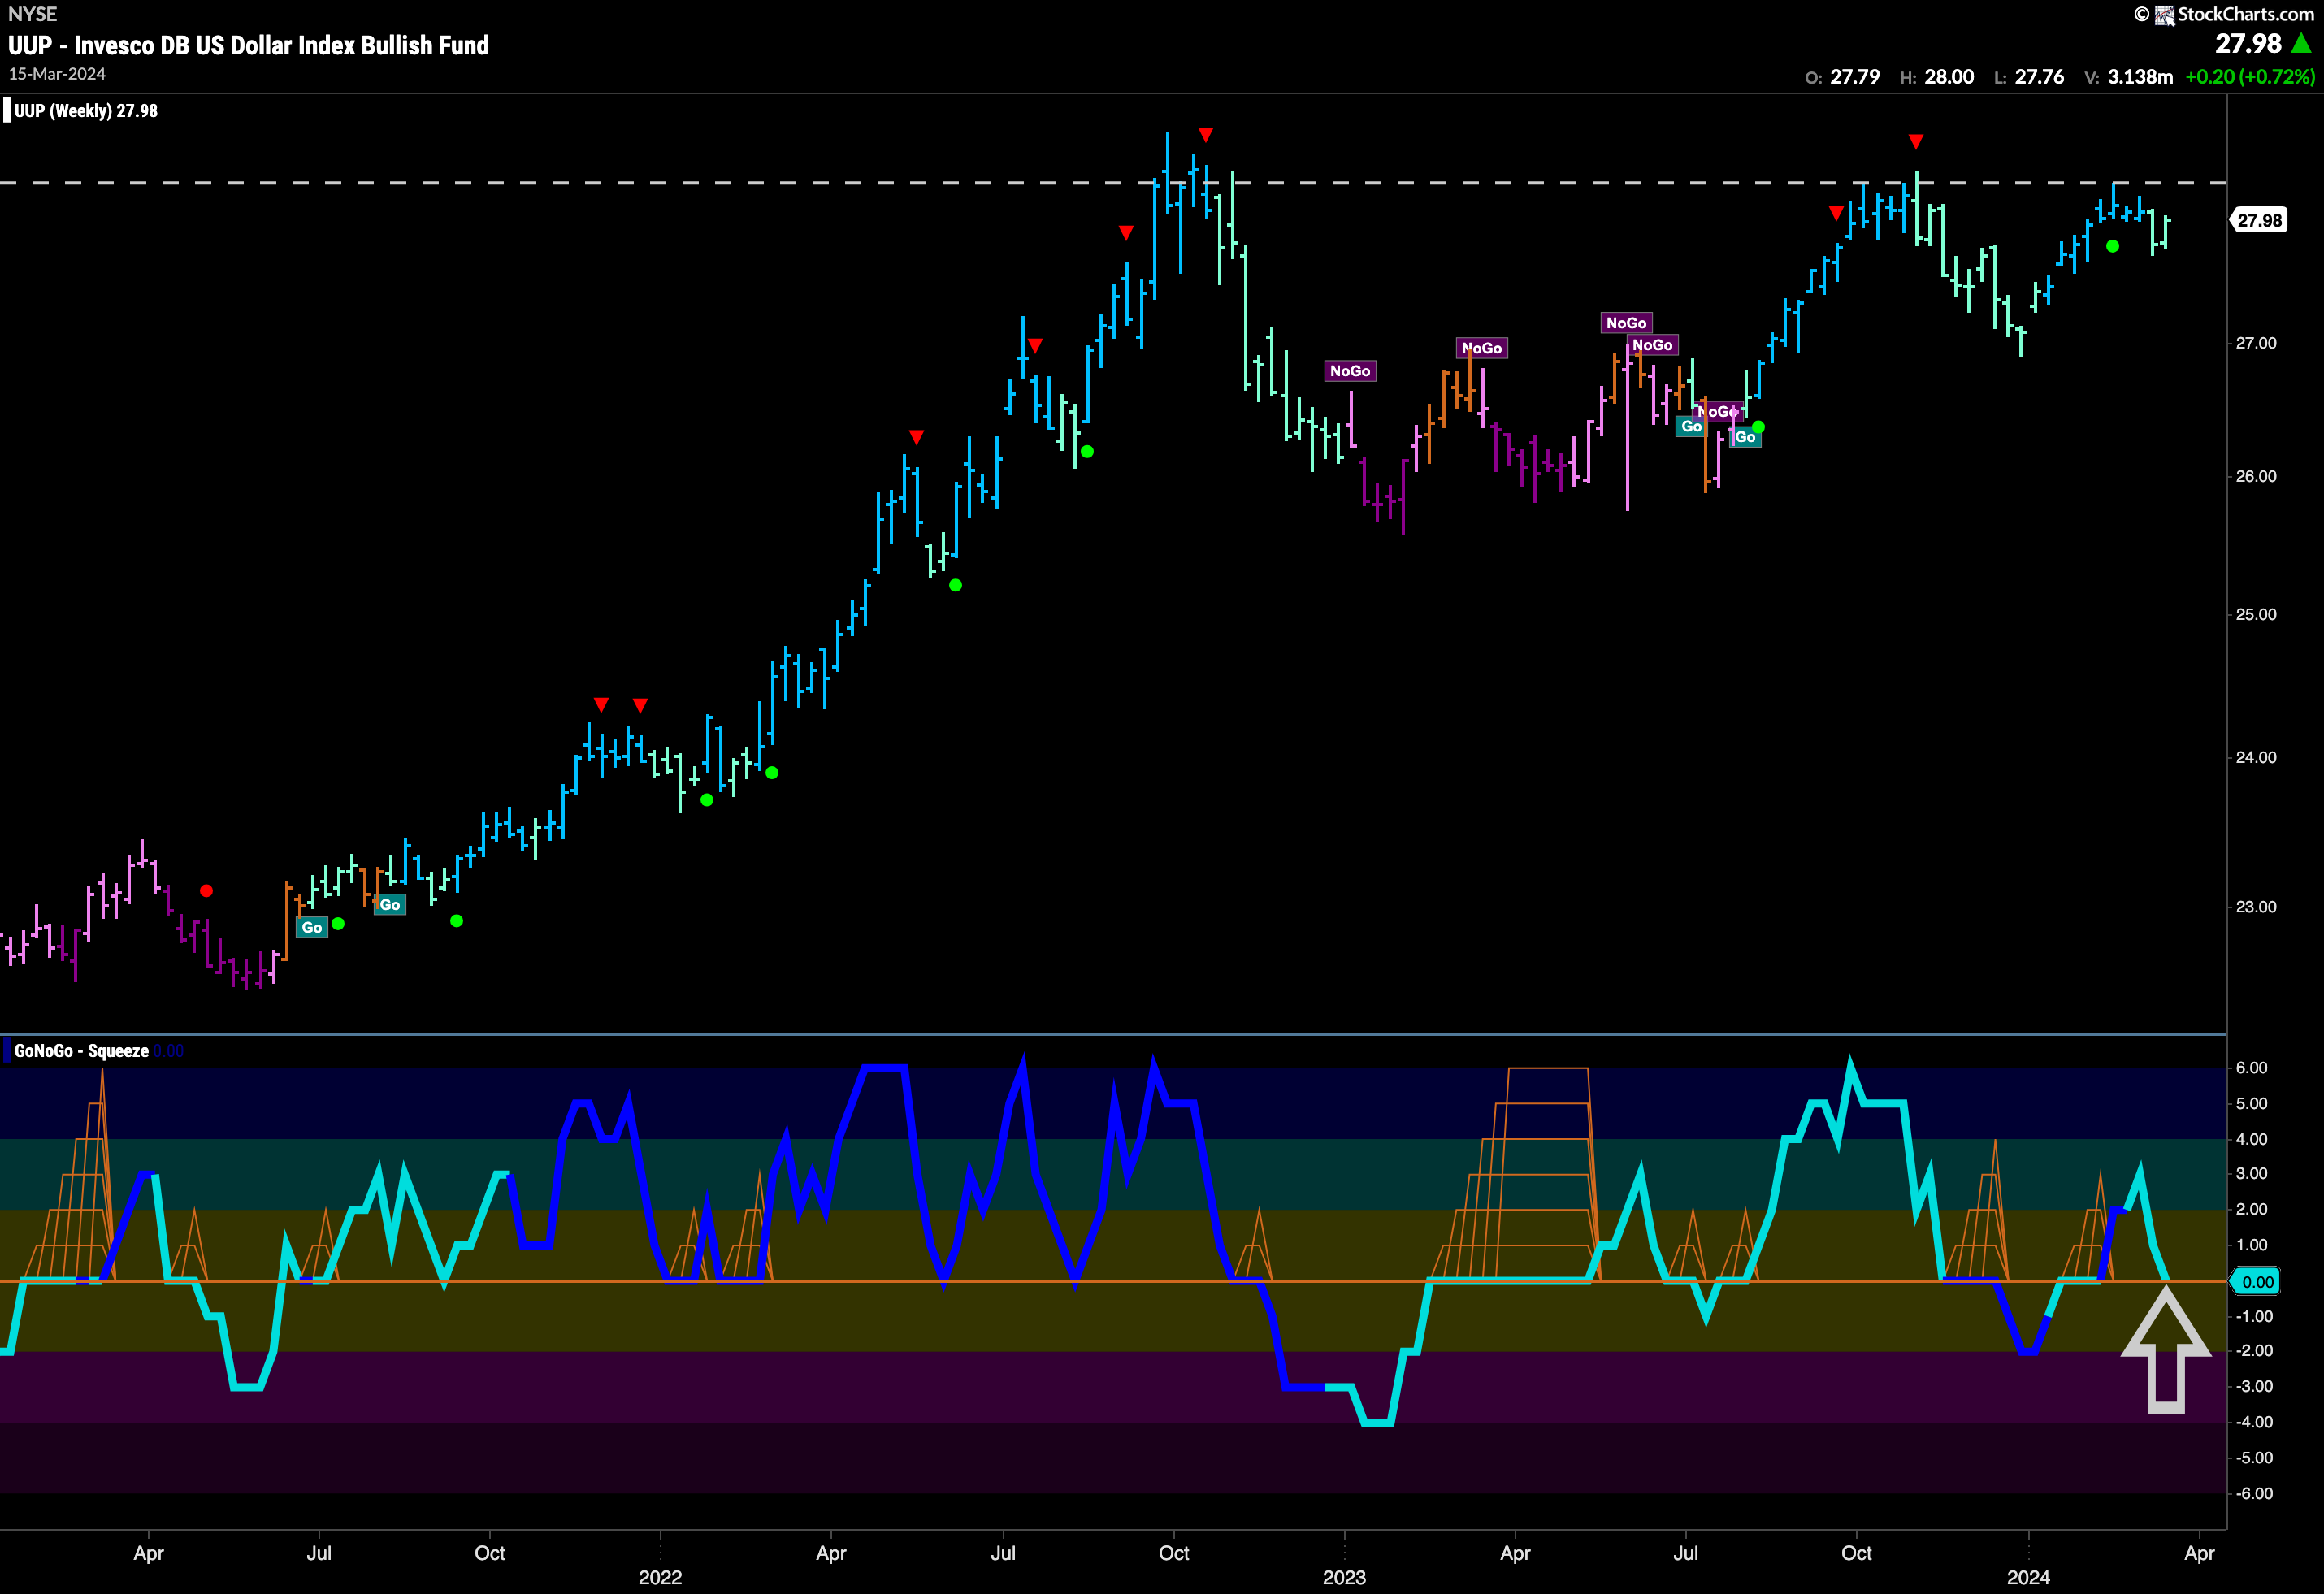
The longer term chart shows that a “Go” trend remains in place and that we are at an inflection point on this chart as well. With price painting a second weaker aqua bar, having fallen from resistance, the oscillator has dropped to test the zero line from above. We will watch to see if it finds support here. If it does, then we will likely see another run at that resistance level. We see a series of rising lows as price tries to build the momentum needed for a break higher. If the oscillator fails to find support at zero then it will likely not be soon.
Oil Makes a Break Higher
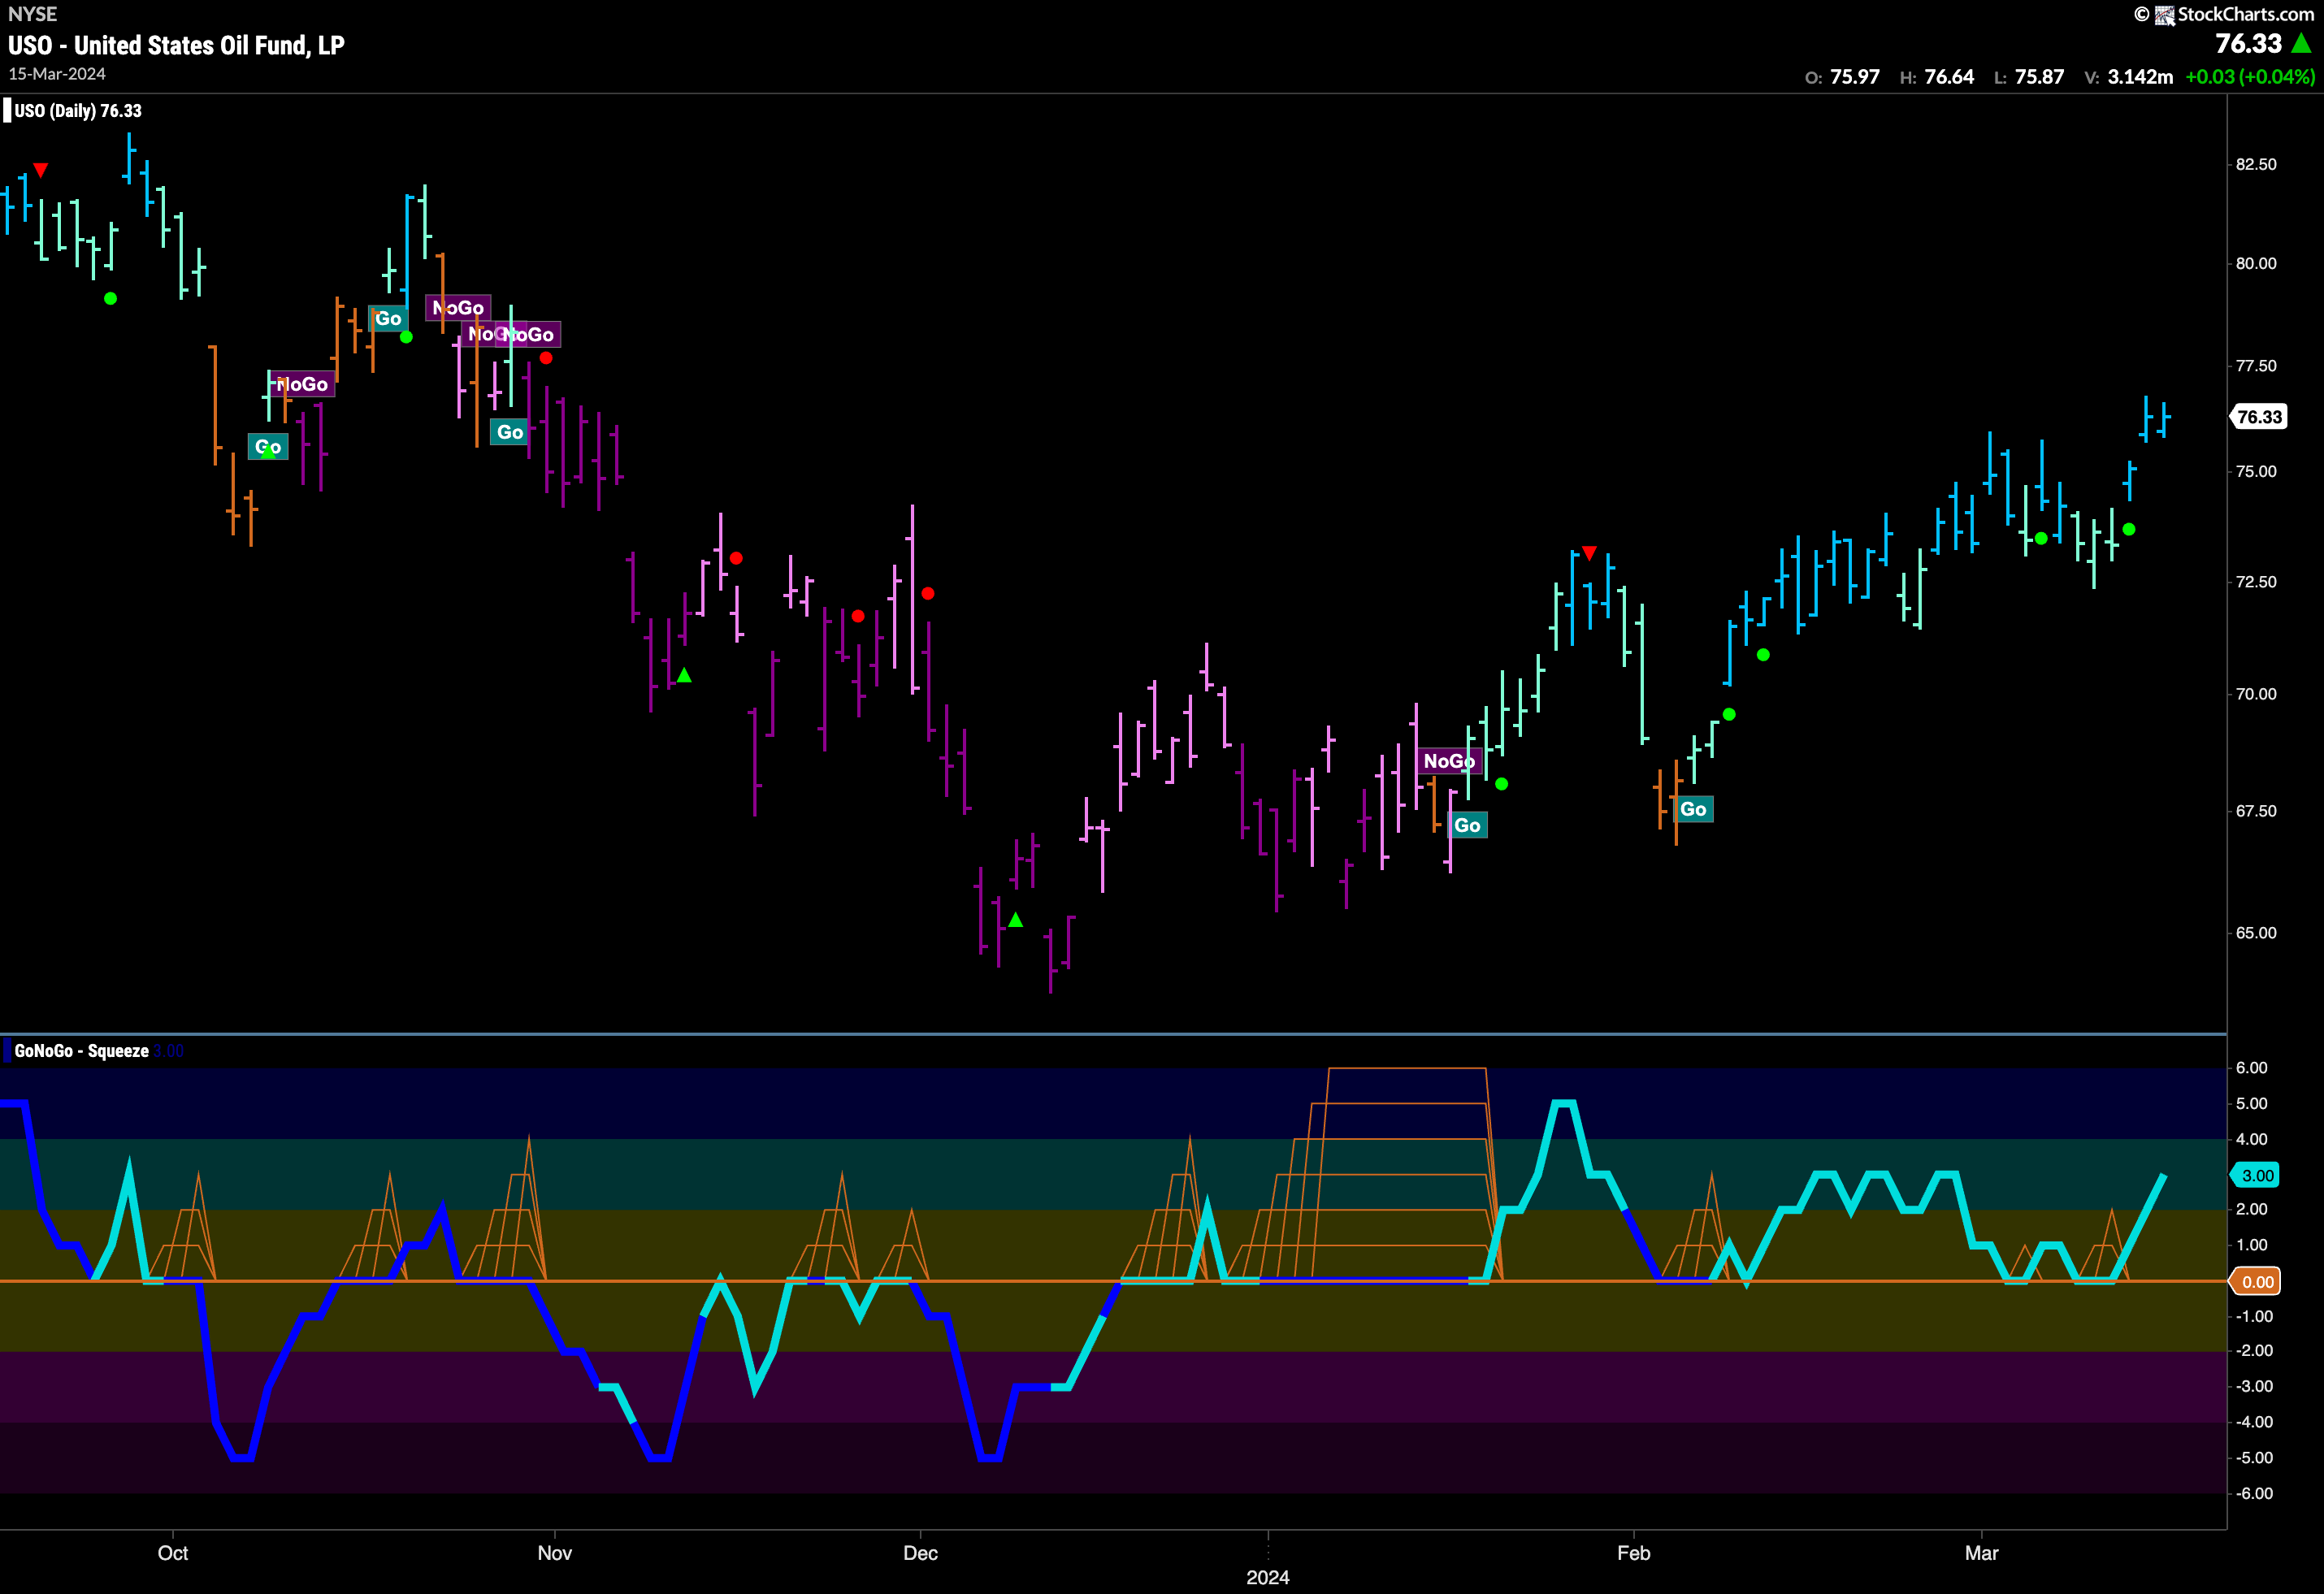
We saw trend continuation this week in oil. Last week we talked of how price was consolidating mostly sideways and that we were looking for GoNoGo Oscillator to find support at zero to confirm the trend. We got exactly that this week. GoNoGo Trend painted strong blue “Go” bars as price hit new highs. GoNoGo Oscillator had suggested just this outcome as it continued to find support at the zero level triggering another Go Trend Continuation Icon (green circle) under the price bar.
Gold Takes a Pause
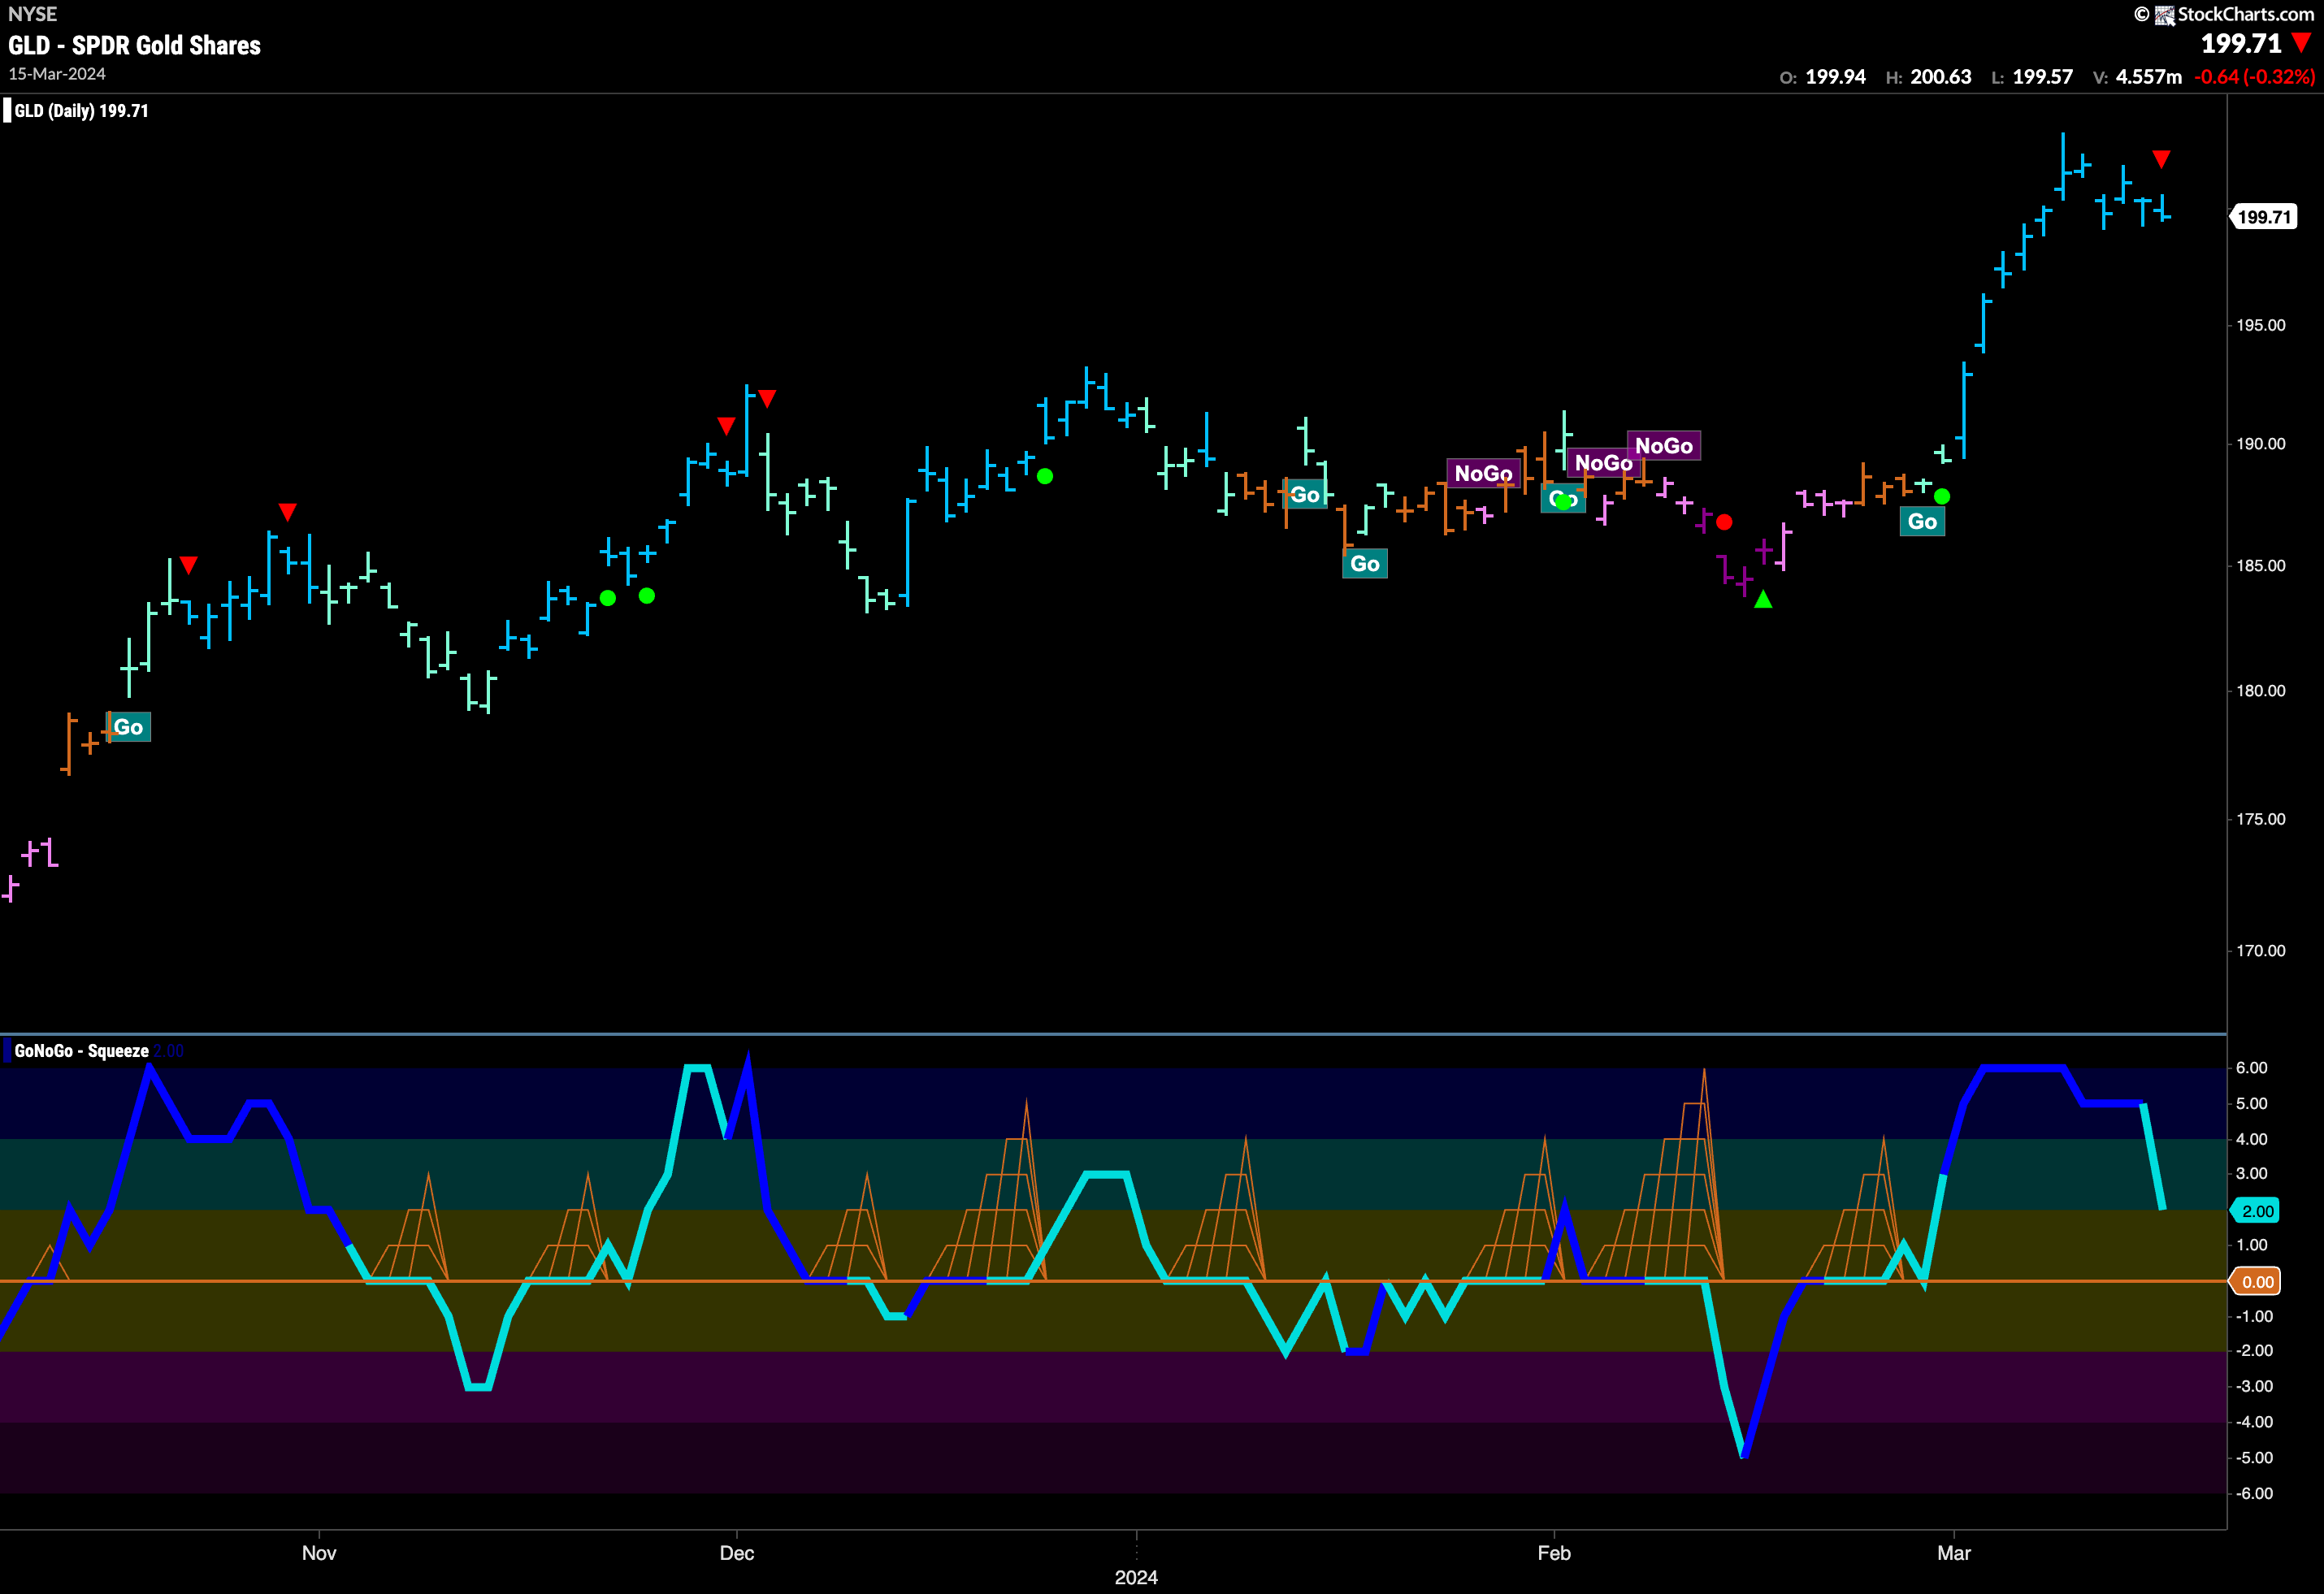
After an incredible run the week before, it was likely that Gold would need to rest. Indeed we saw price come back slightly from its recent high this week. Now, we see a Go Countertrend Correction Icon (red arrow) as GoNoGo Oscillator has fallen out of overbought territory. This tells us that price will continue to struggle to move higher in the short term. We will watch GoNoGo Oscillator to see if it finds support should it fall to the zero line. For this “Go” trend to make another leg higher we would need to see GoNoGo Oscillator remain at or above zero.
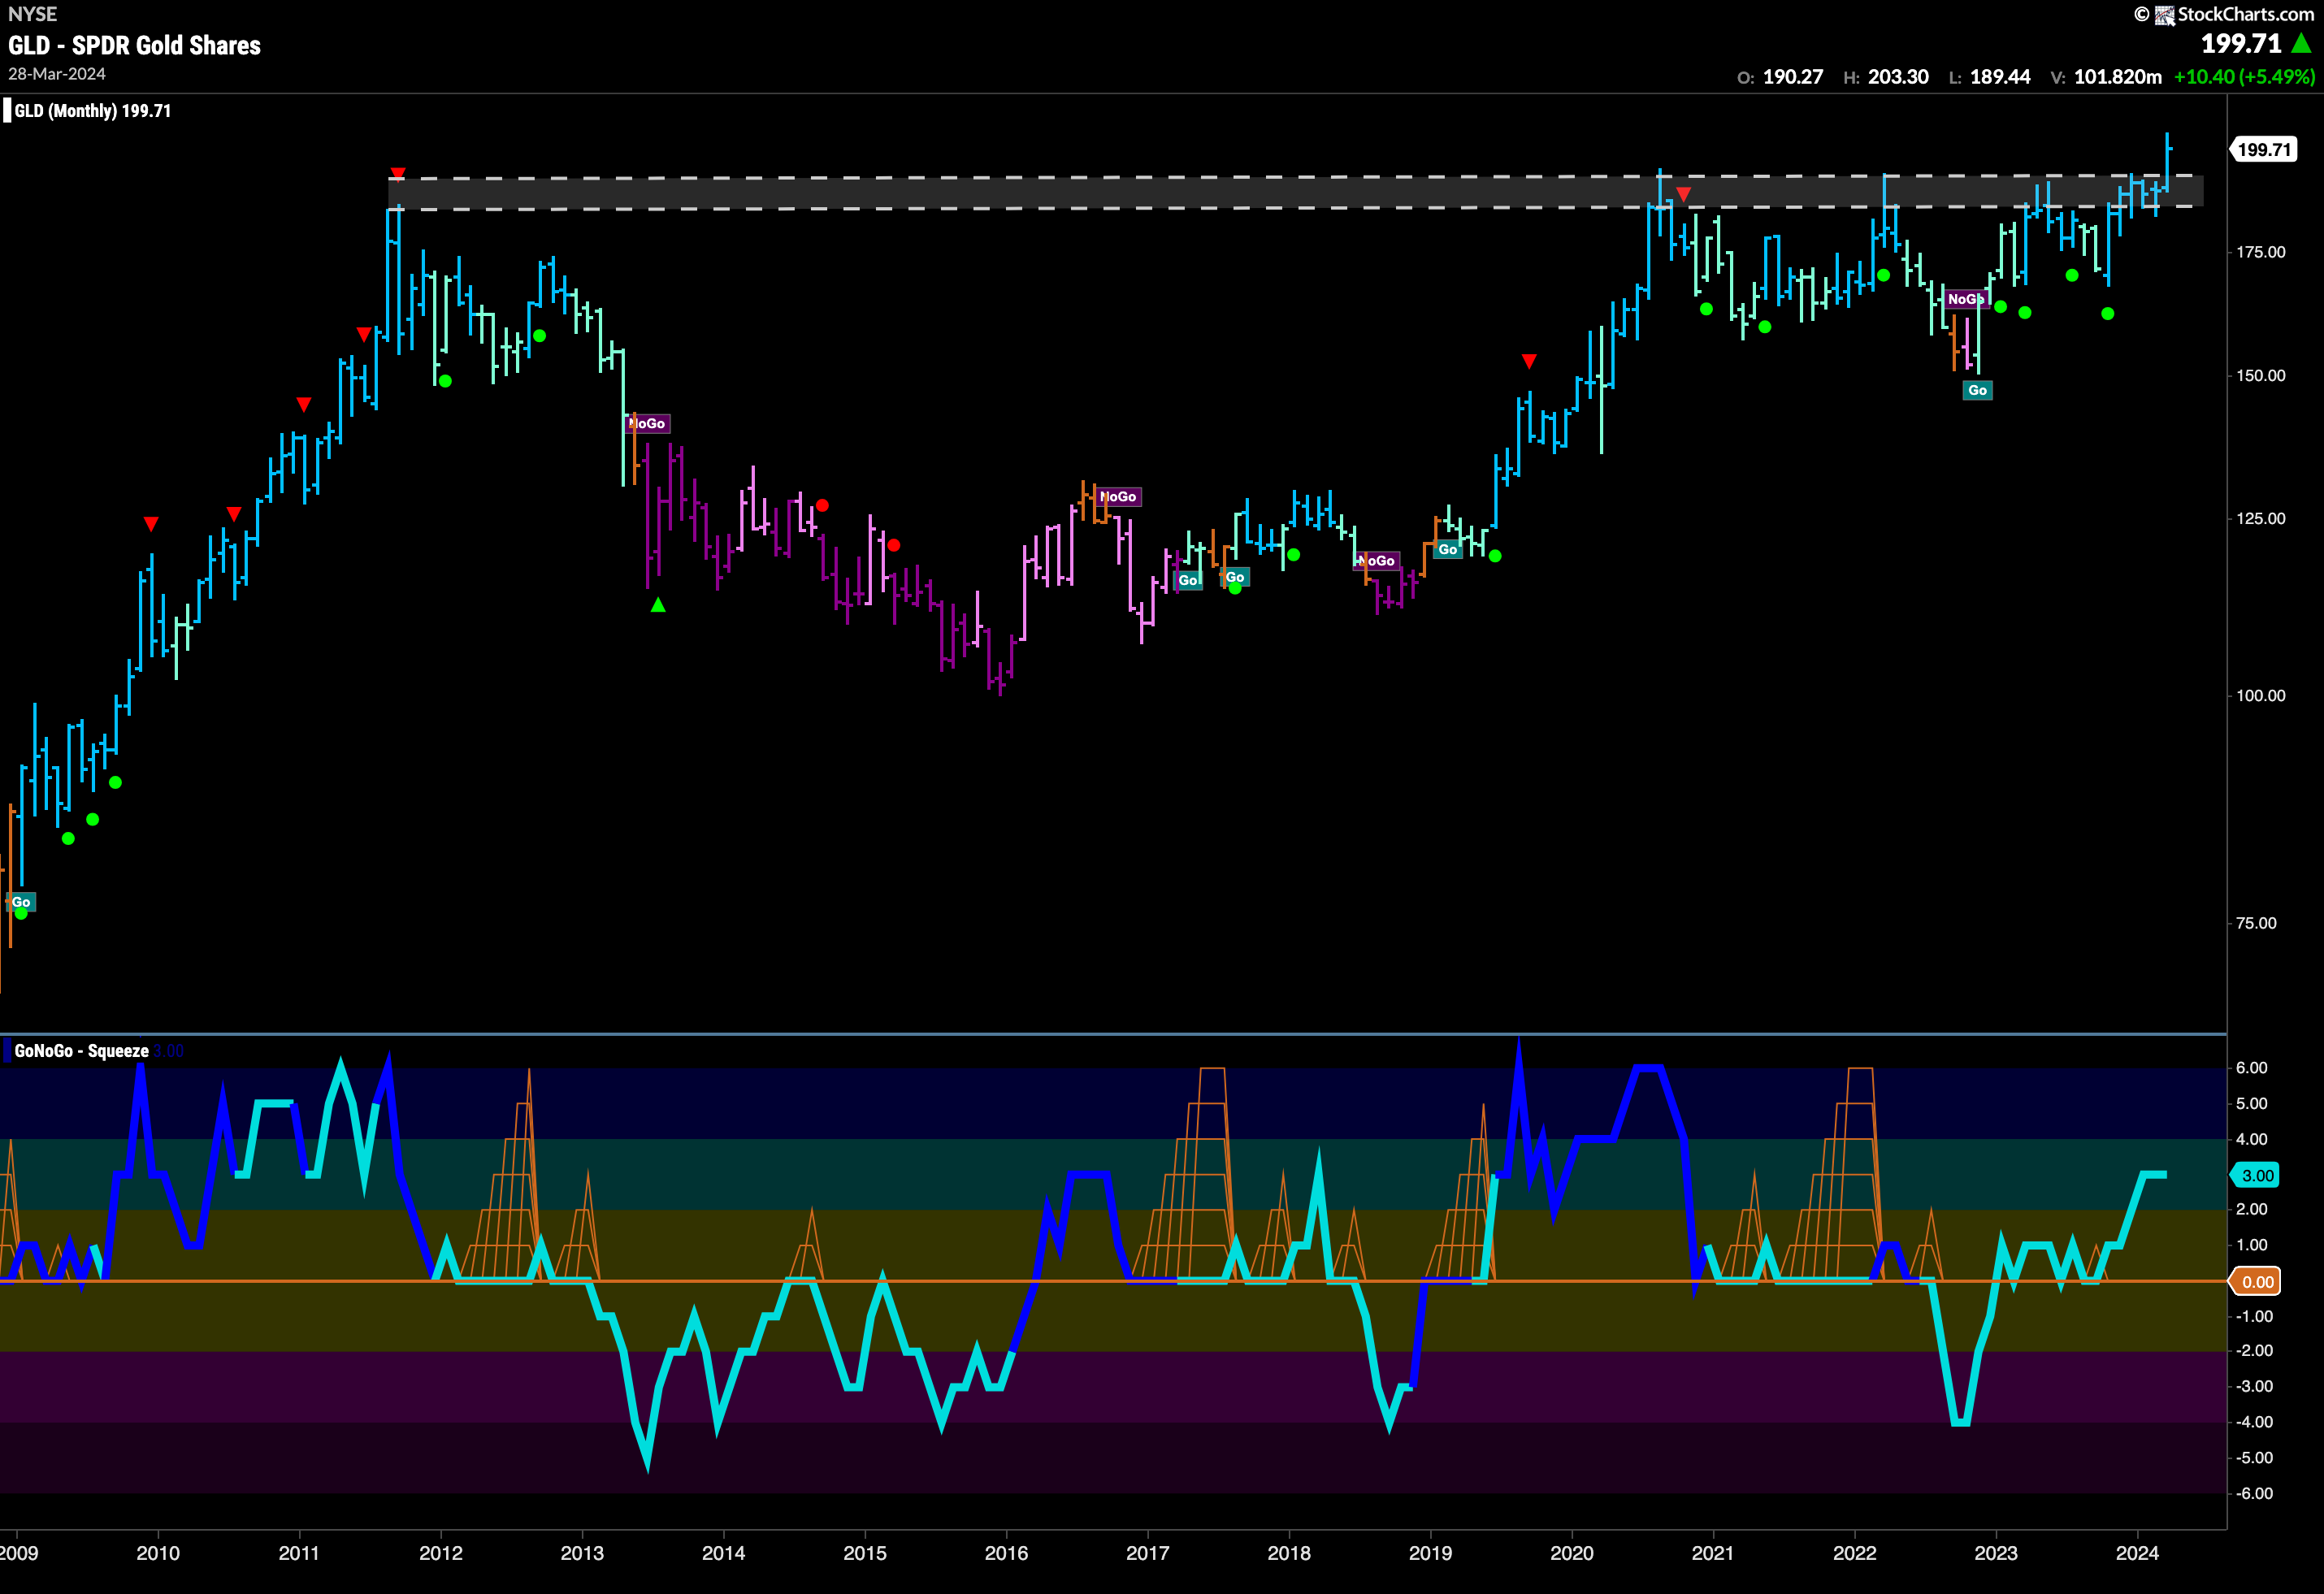
Having said that, the monthly chart still looks very strong. We will continue to watch to see if the end of the month sees price close above the congestion area we have highlighted on the chart. We still have two weeks to go but it is looking good for the long term gold bulls. GoNoGo Oscillator is confirming the “Go” trend as it is in positive territory but not yet overbought at a value of 3.
Sector RelMap
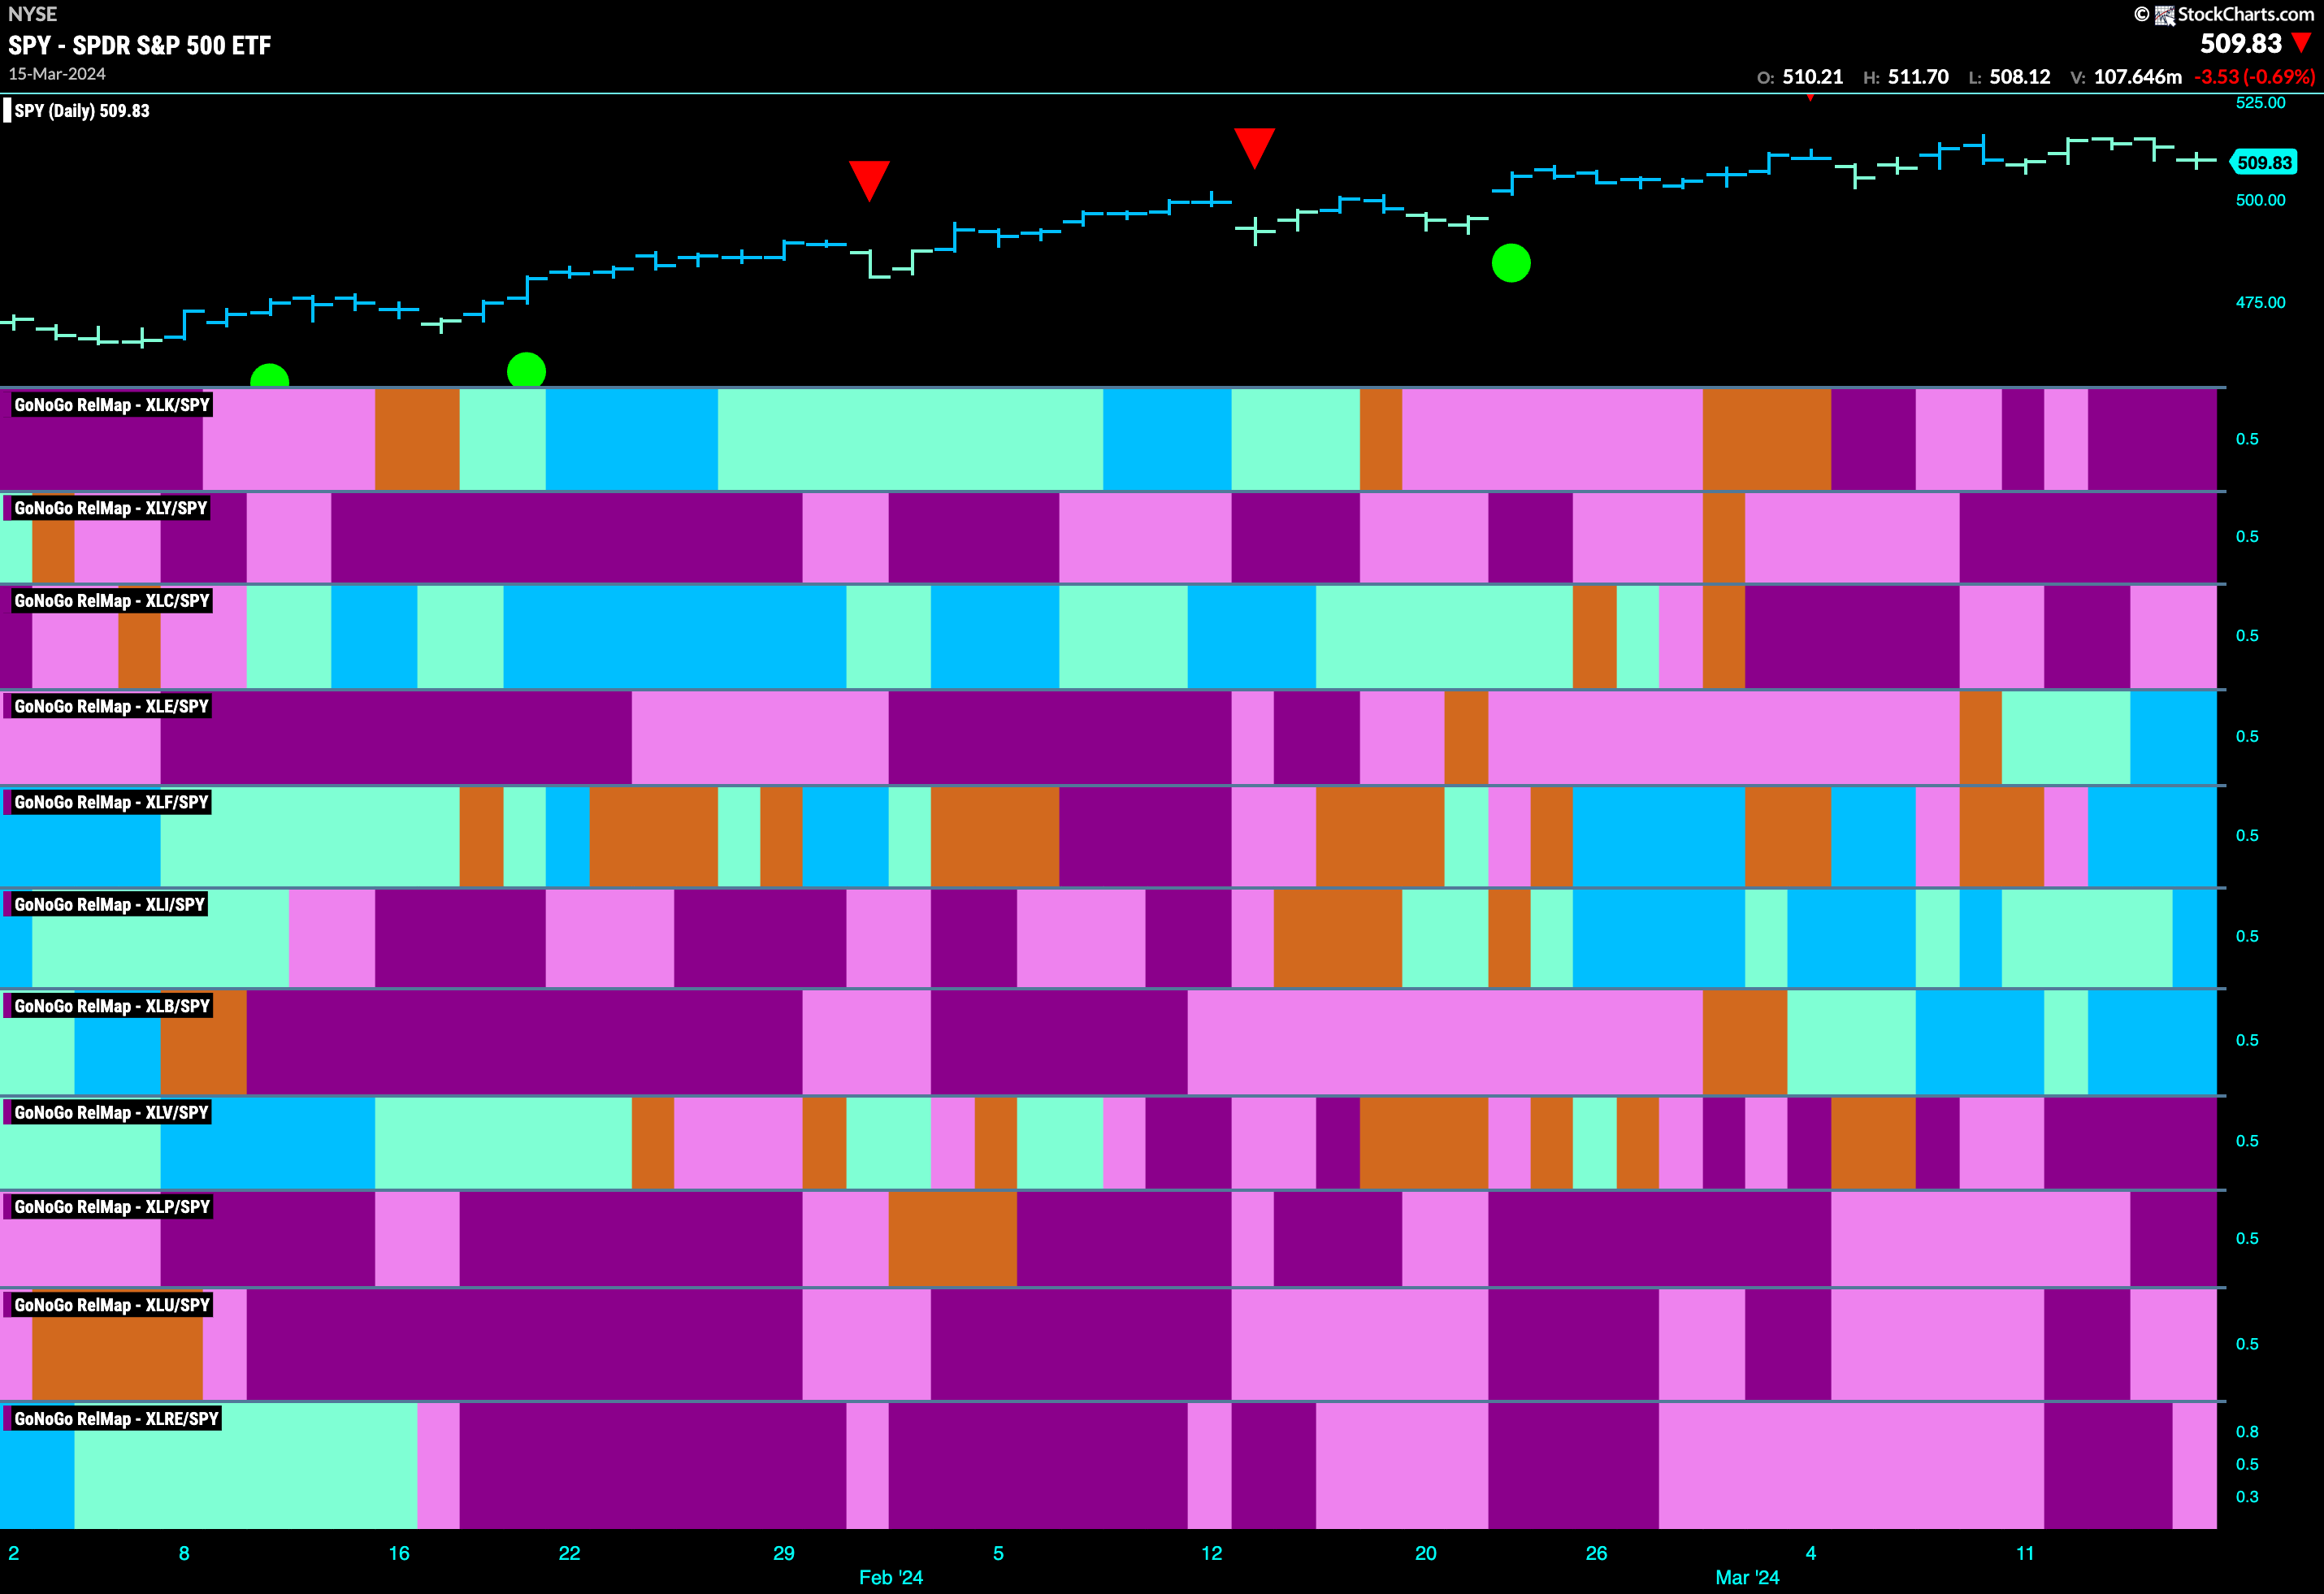
Below is the GoNoGo Sector RelMap. This GoNoGo RelMap applies the GoNoGo Trend to the relative strength ratios of the sectors to the base index. Looking at this map, we can quickly see where the relative outperformance is coming from as well as which sectors are lagging on a relative basis. 4 sectors are outperforming the base index this week. $XLE, $XLF, $XLI, and $XLB are painting relative “Go” bars.
Energy Sub-Group RelMap
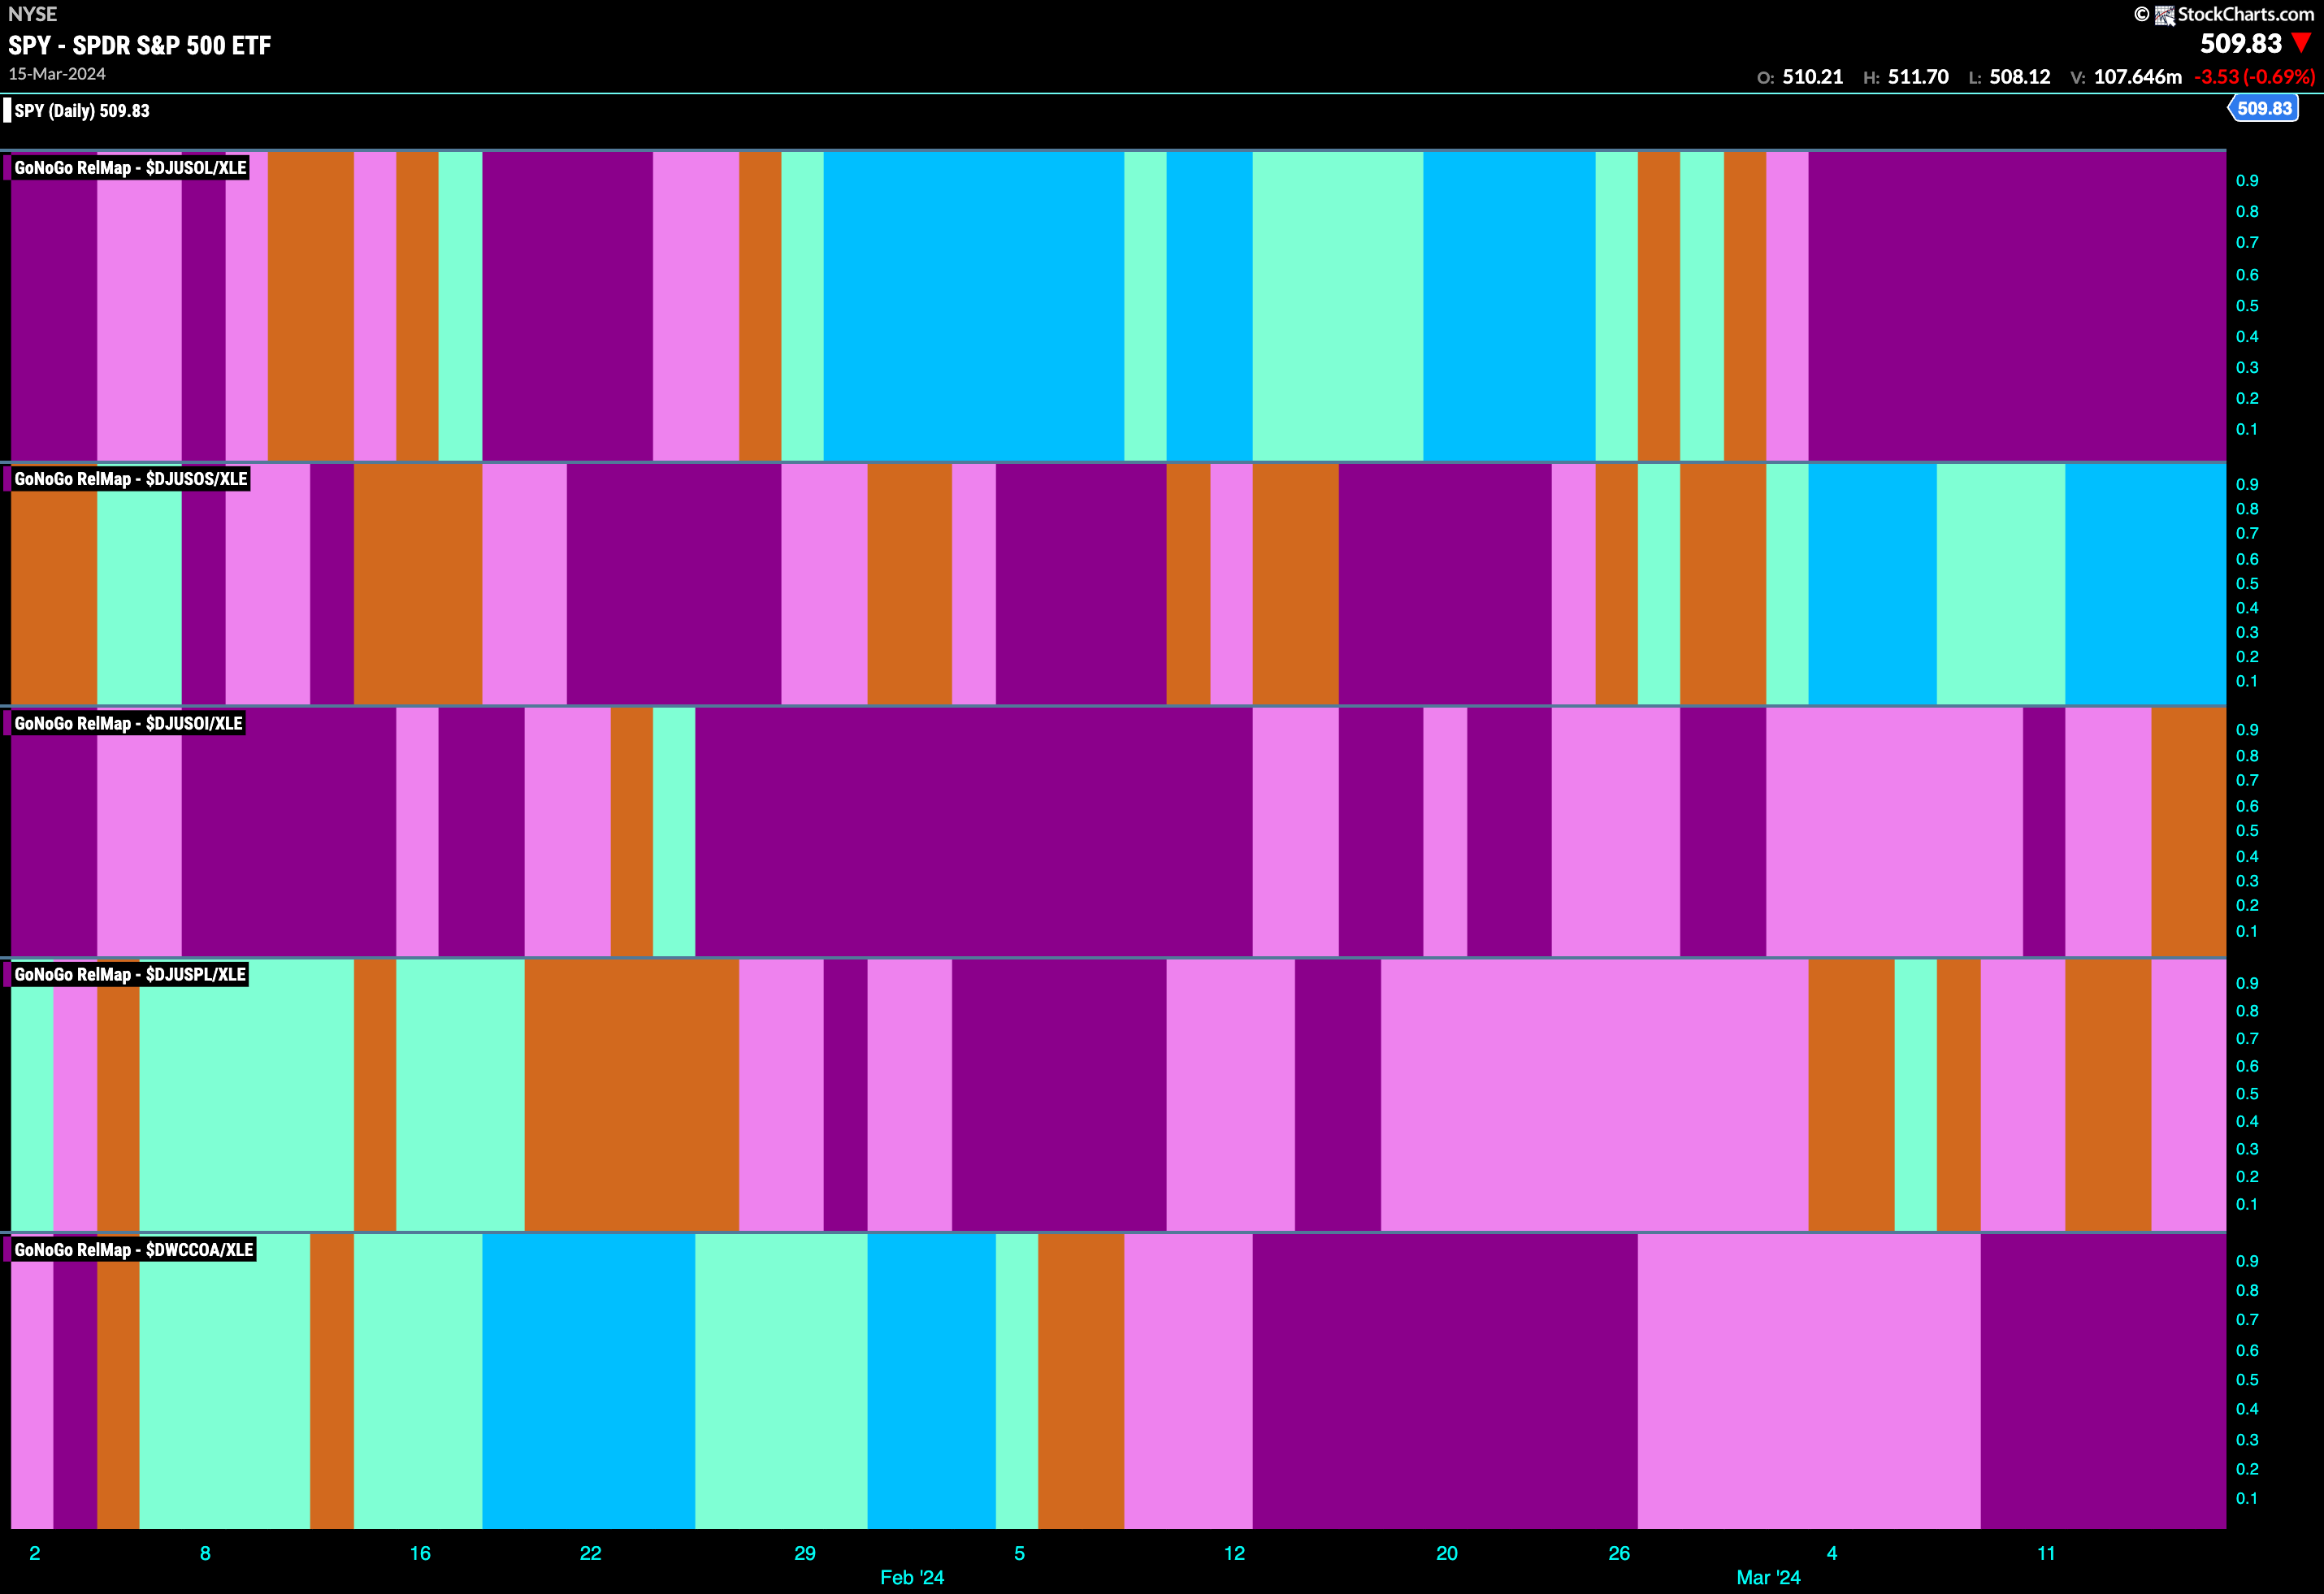
The GoNoGo Sector RelMap above shows that the energy sector has started to outperform the index as a whole. We are seeing a rotation emerge here as it is the middle of the map that is leading. Energy has joined financials, industrials, and materials in relative “Go” trends. Below, we see the individual groups of the energy sector relative to the sector itself. We apply the GoNoGo Trend to those ratios to understand where the relative outperformance is coming from within a sector. We see that it is thin leadership in this sector as only one subgroup is outperforming. The exploration and production index is painting strong blue “Go” bars.
$DJUSOS in Long Term Pattern
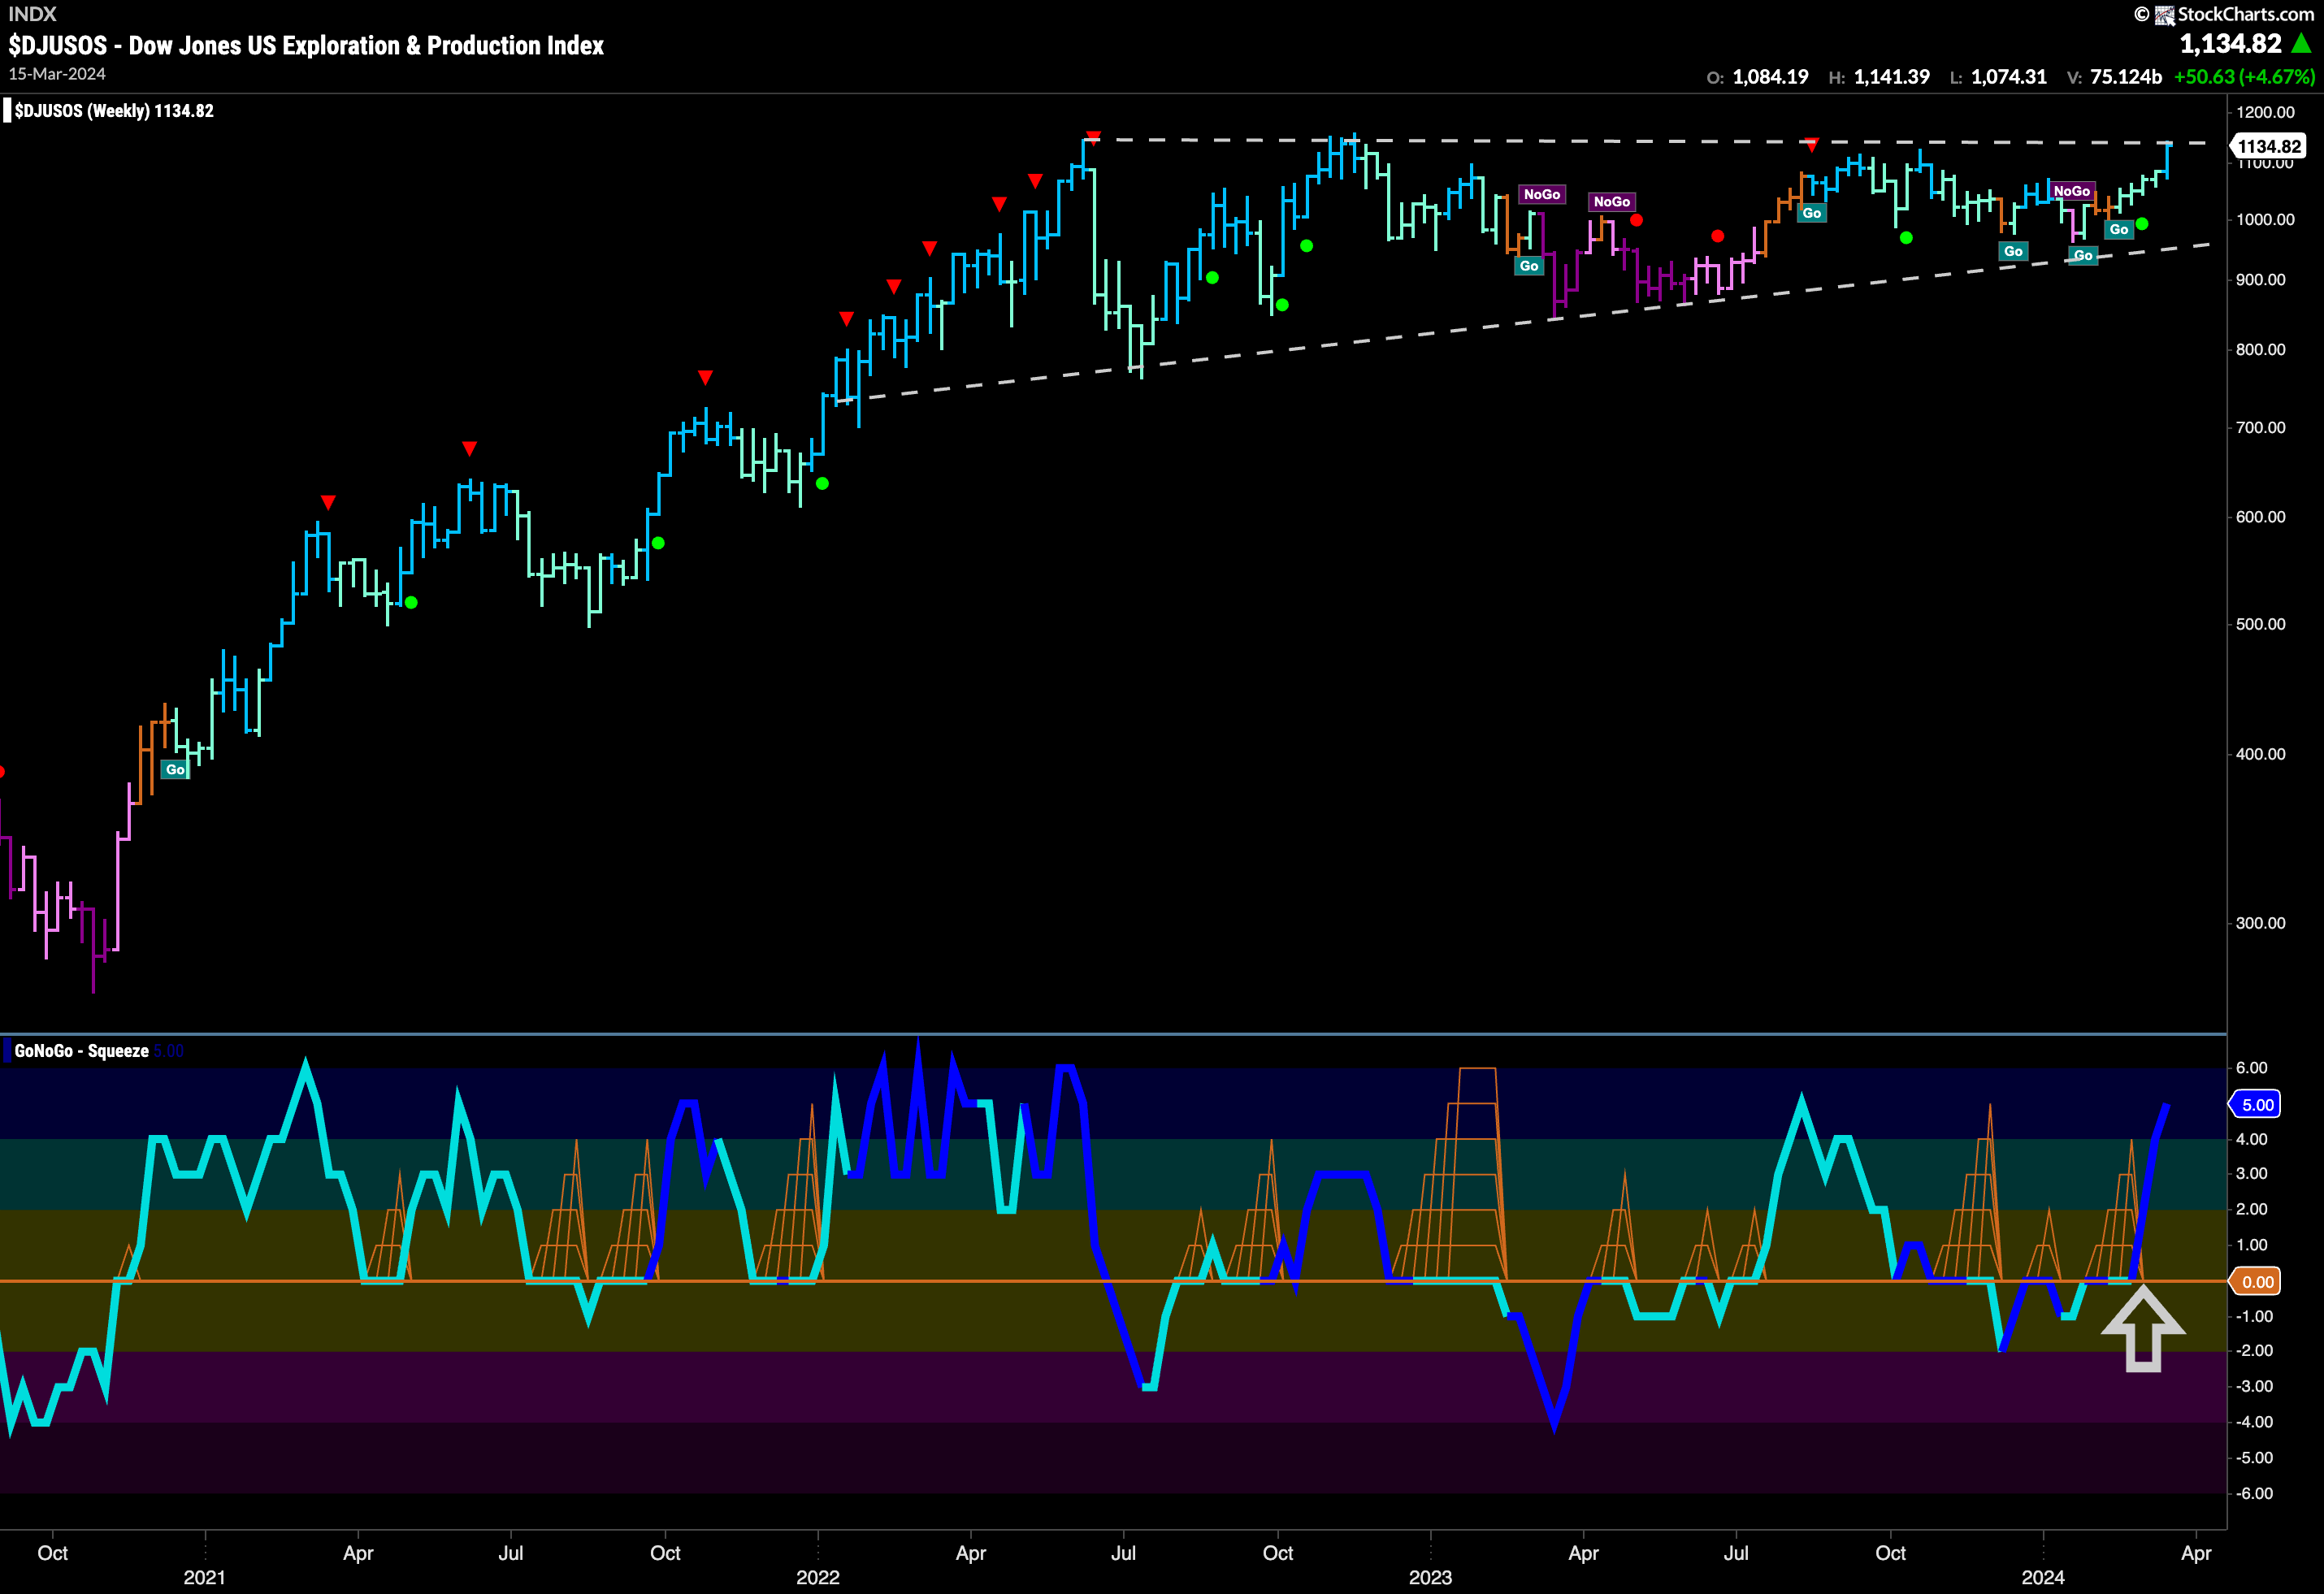
The exploration and production index is setting up to test a long term level of resistance. The weekly chart below shows that price is running up agains horizontal resistance that stretches back to early summer of last year. With a series of rising lows an ascending triangle pattern has emerged. Momentum has recently found support at the zero line and is rising fast on heavy volume. We will watch to see if this gives price the kick it needs to move to new highs. This would be a significant break of a level that has been resistance for such a while.
Ring Energy Races Higher
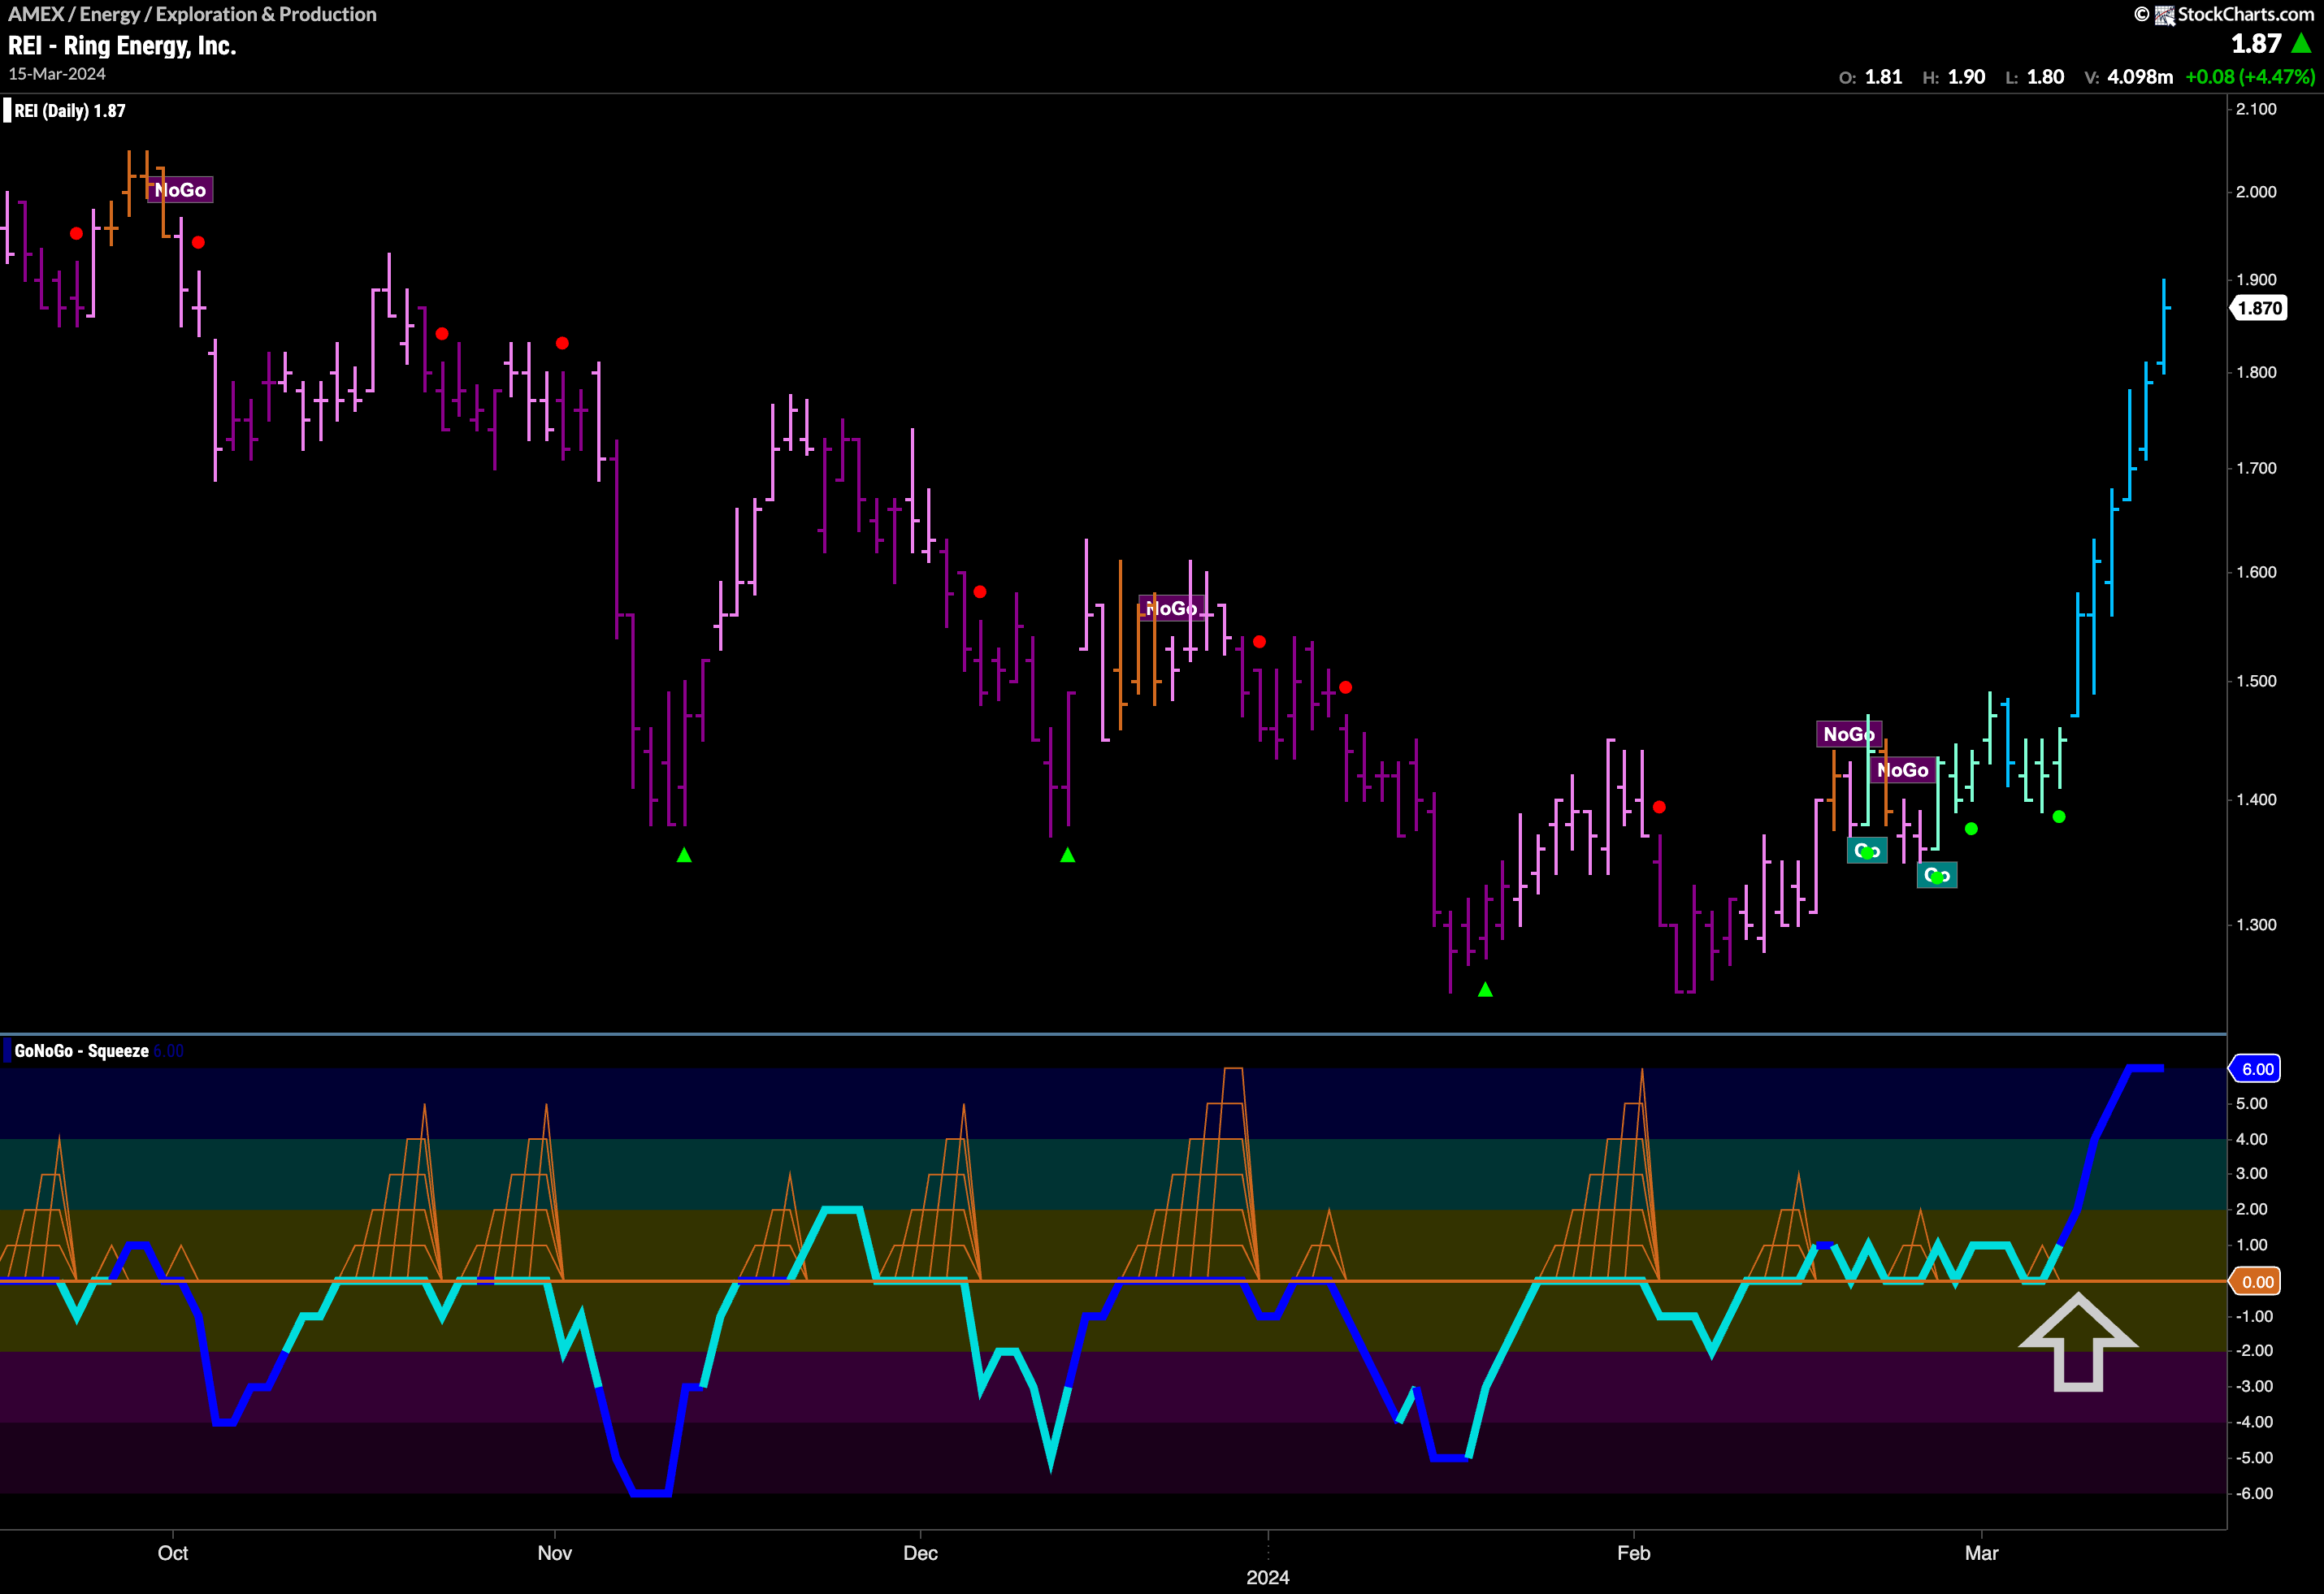
The chart below of $REI shows that this latest move has been fast and powerful. GoNoGo Trend has painted a string of strong blue “Go” bars since the tools triggered the last Go Trend Continuation Icon (green circle). As price emerged from a long and destructive “NoGo” trend we saw GoNoGo Oscillator work hard to find support at zero several times and this provided a base of trampoline like support for price to surge.
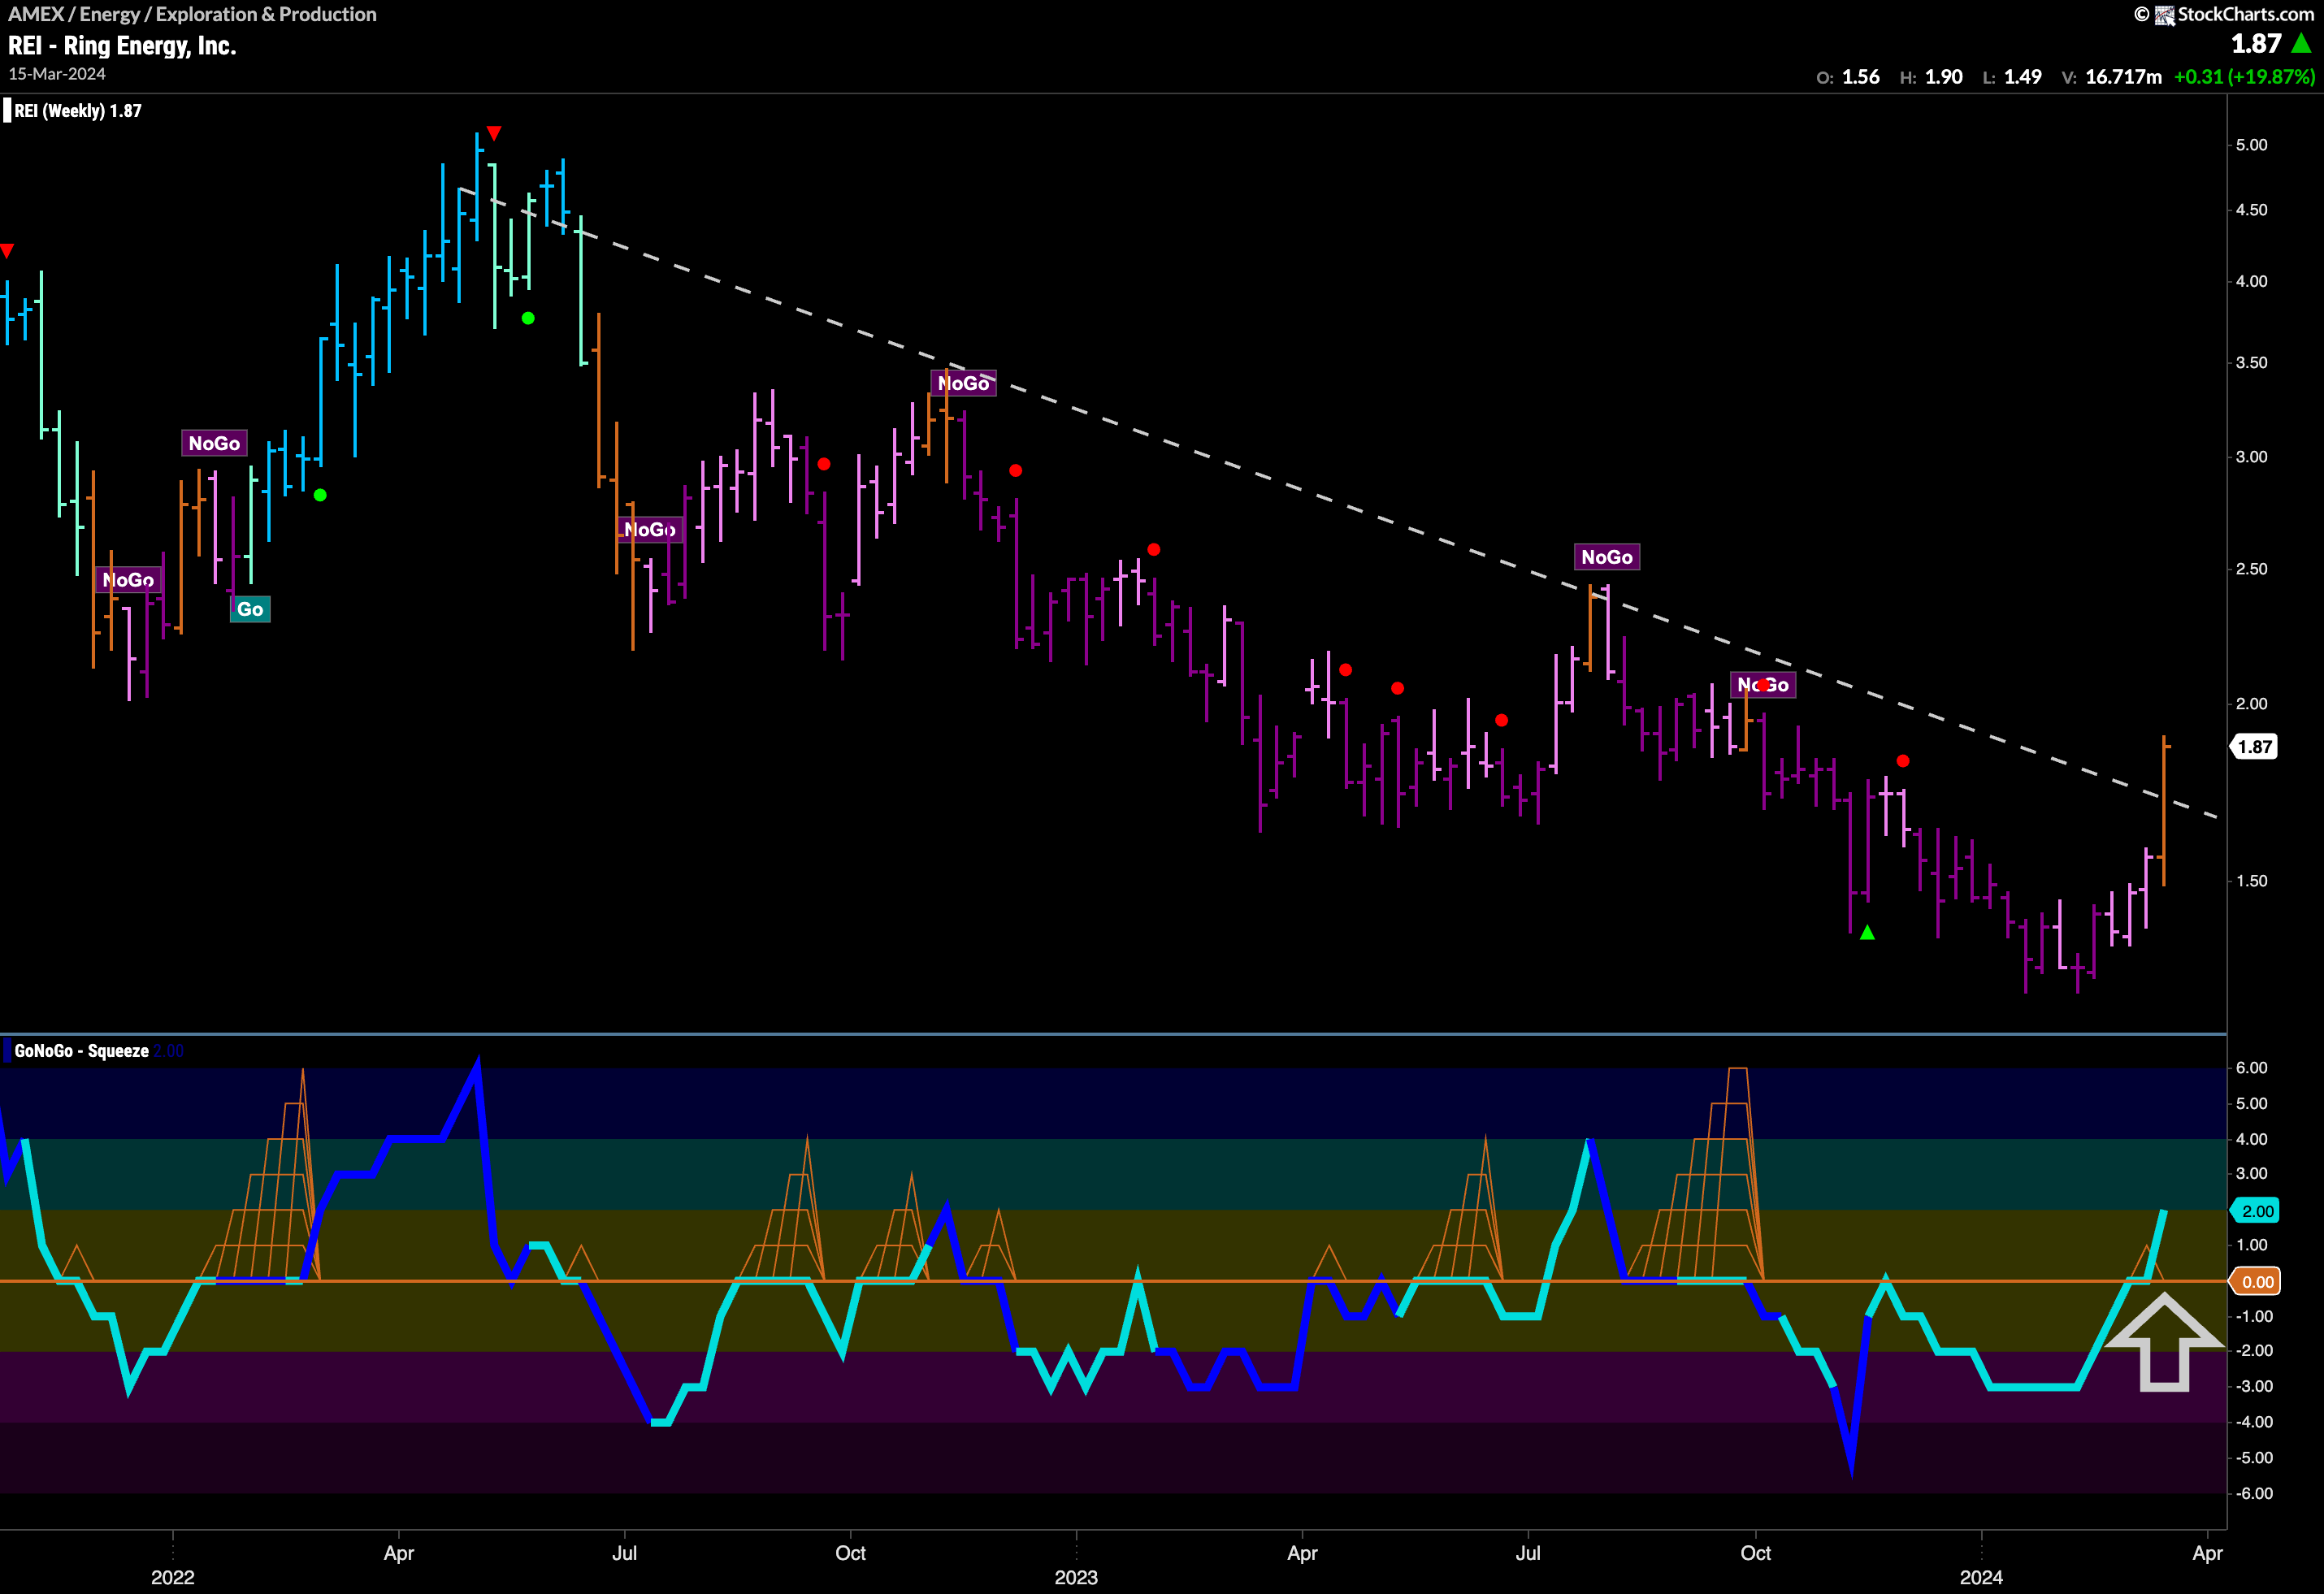
If we are wondering whether it is too late to look for opportunities, we need only look to the weekly chart of $REI. This recent price action has been strong enough to push price above downward sloping resistance and GoNoGo Trend paints an amber “Go Fish” bar. GoNoGo oscillator has burst into positive territory as well and we will watch to see if it continues to hold above that level. If the weekly chart can identify a “Go” trend then we would look at the daily chart for continued strength.
