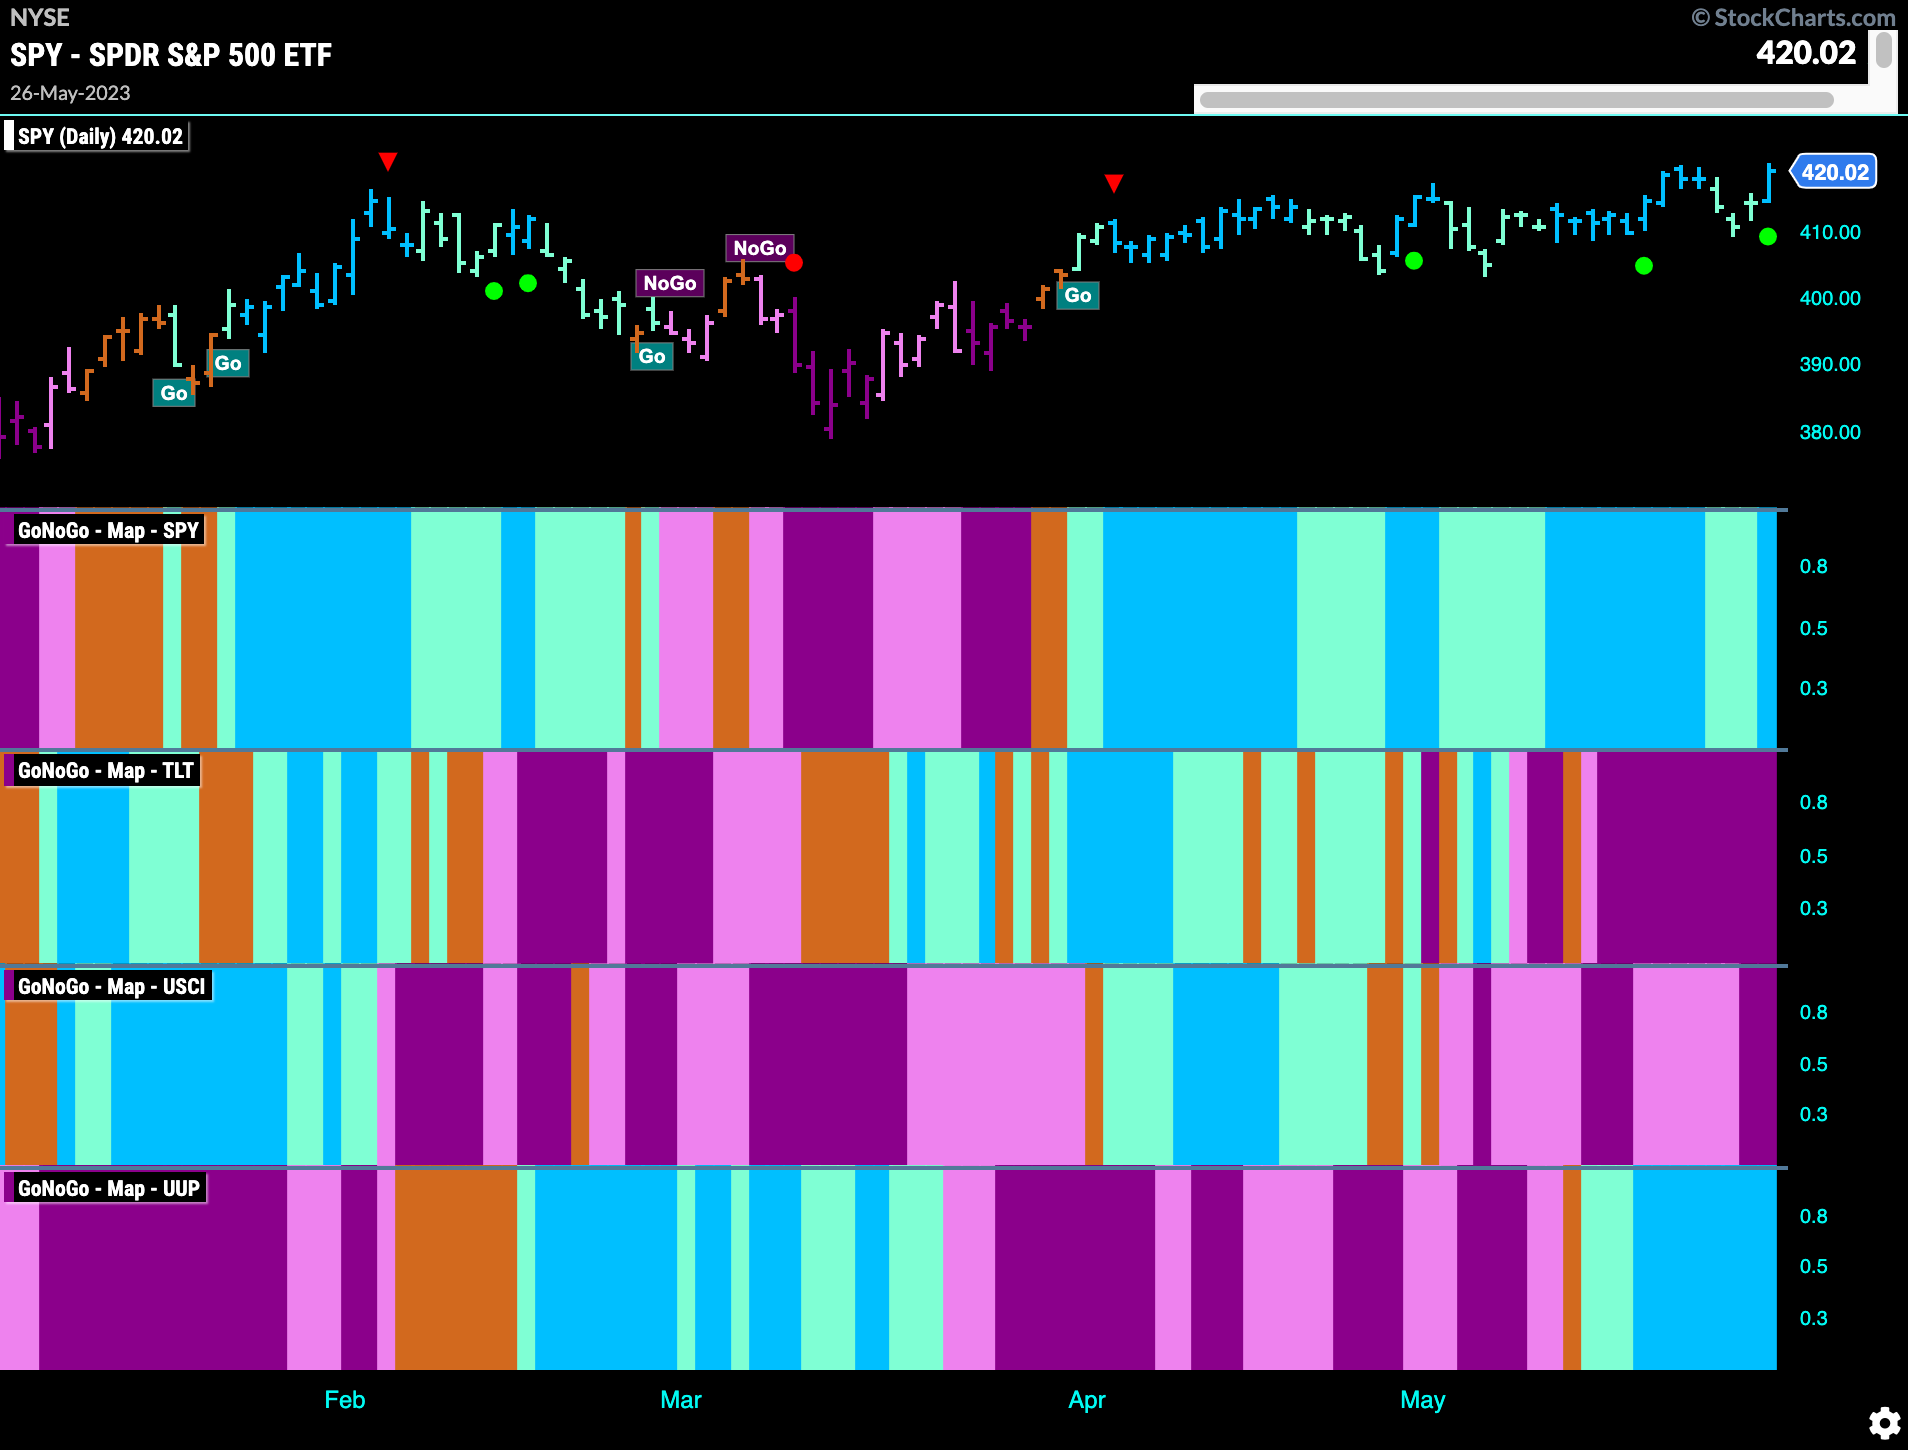
Good morning and welcome to this week’s Flight Path. For those who enjoyed a holiday weekend around the world as well as here in the U.S. I hope you are feeling refreshed and ready to go this week! Equities maintained the “Go” trend last week and even strengthened to paint a blue bar to end the week. Treasury bond prices and commodities stayed put in “NoGo” trends while the dollar saw continued strength.
Momentum Supports “Go” Trend in U.S. equities
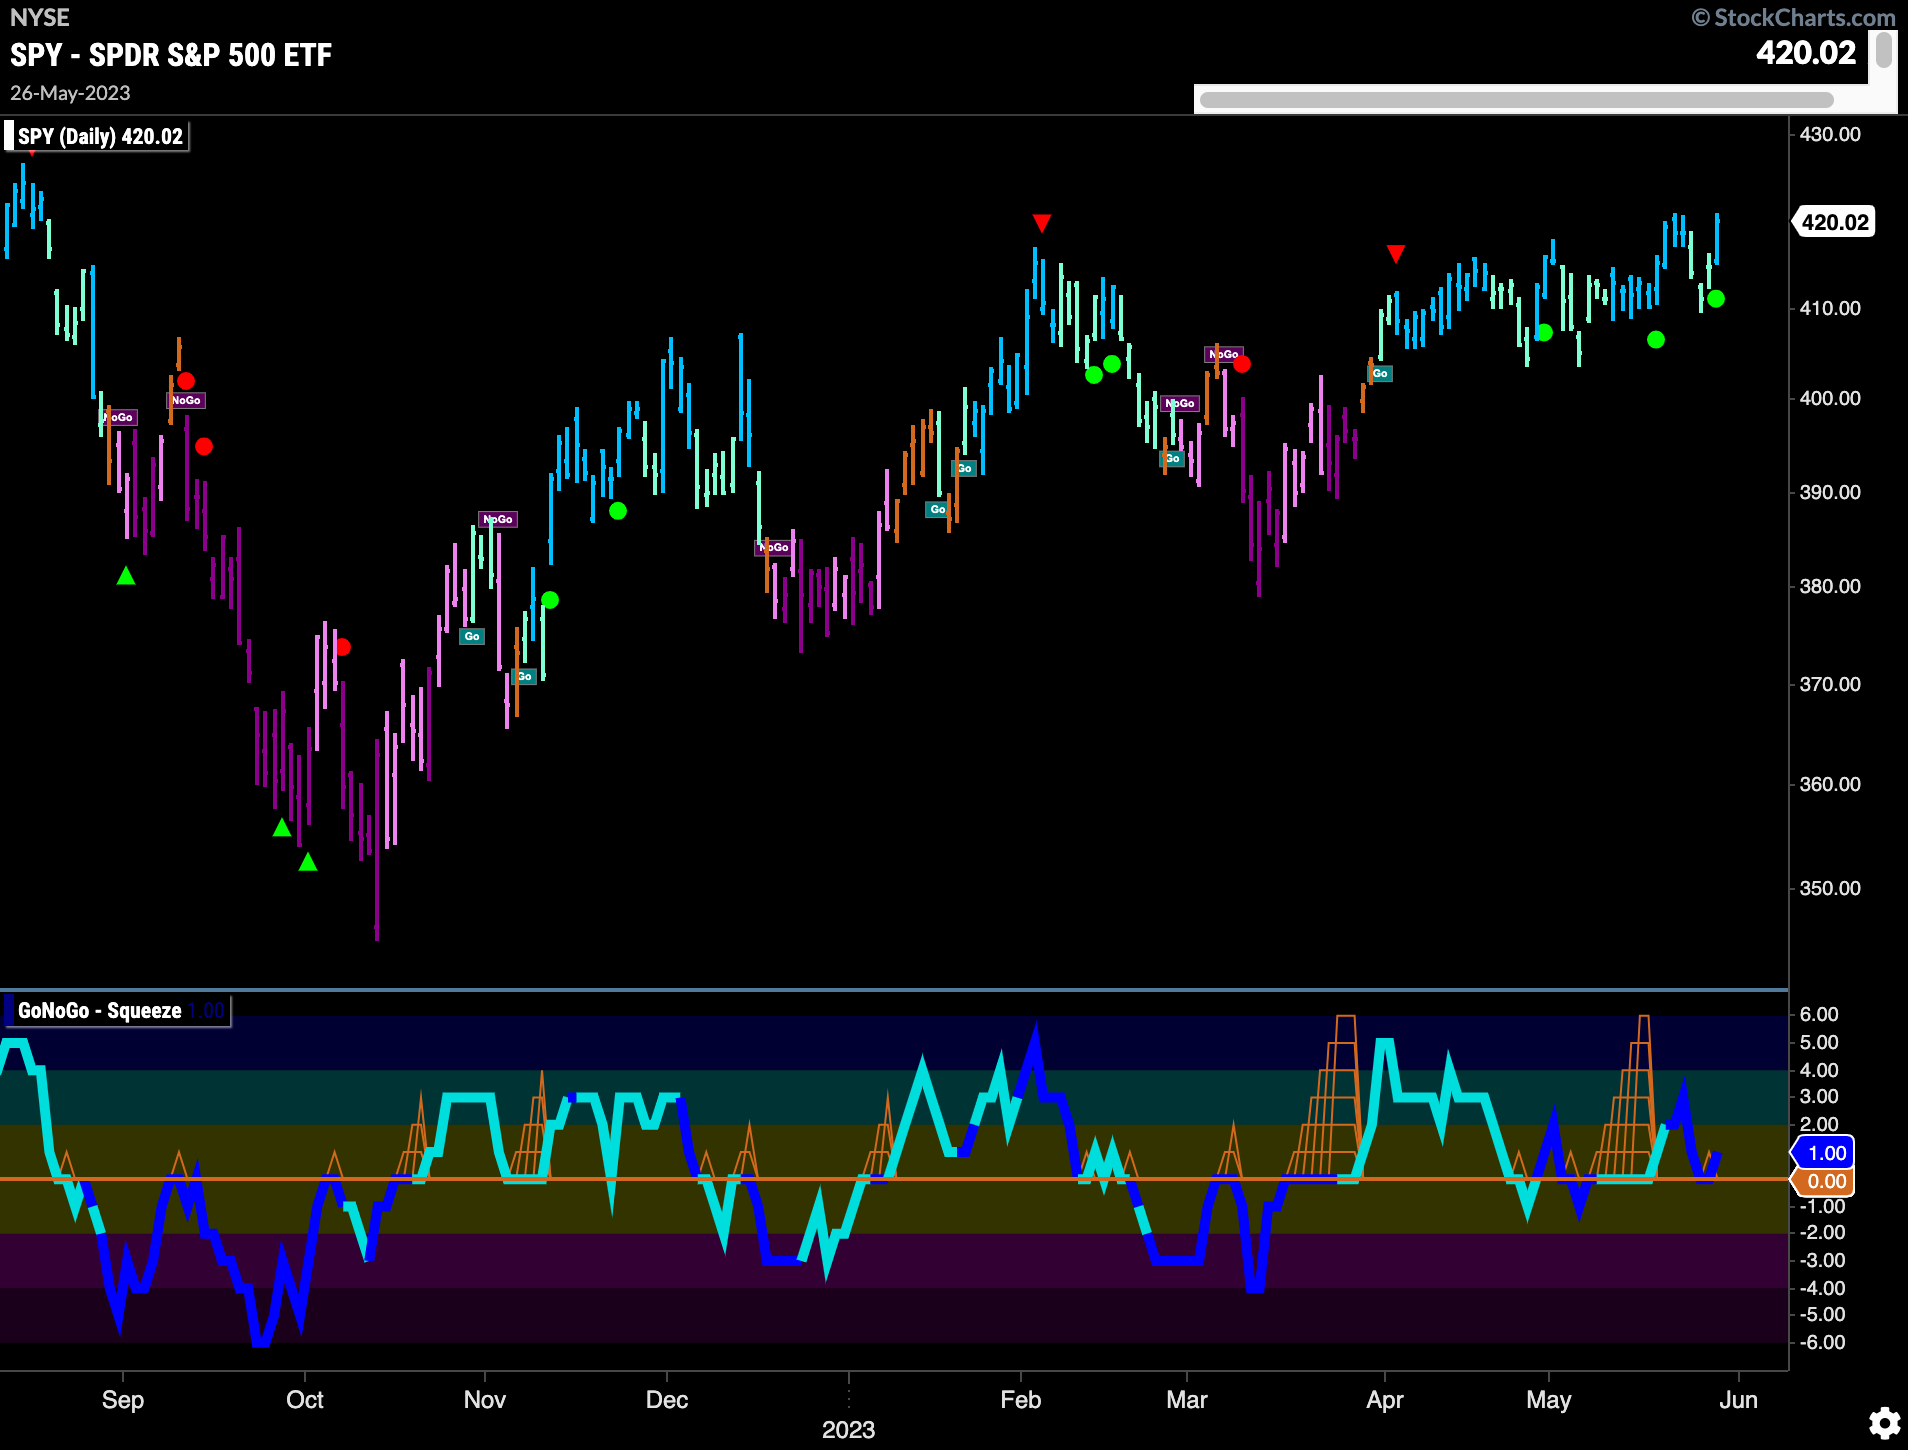
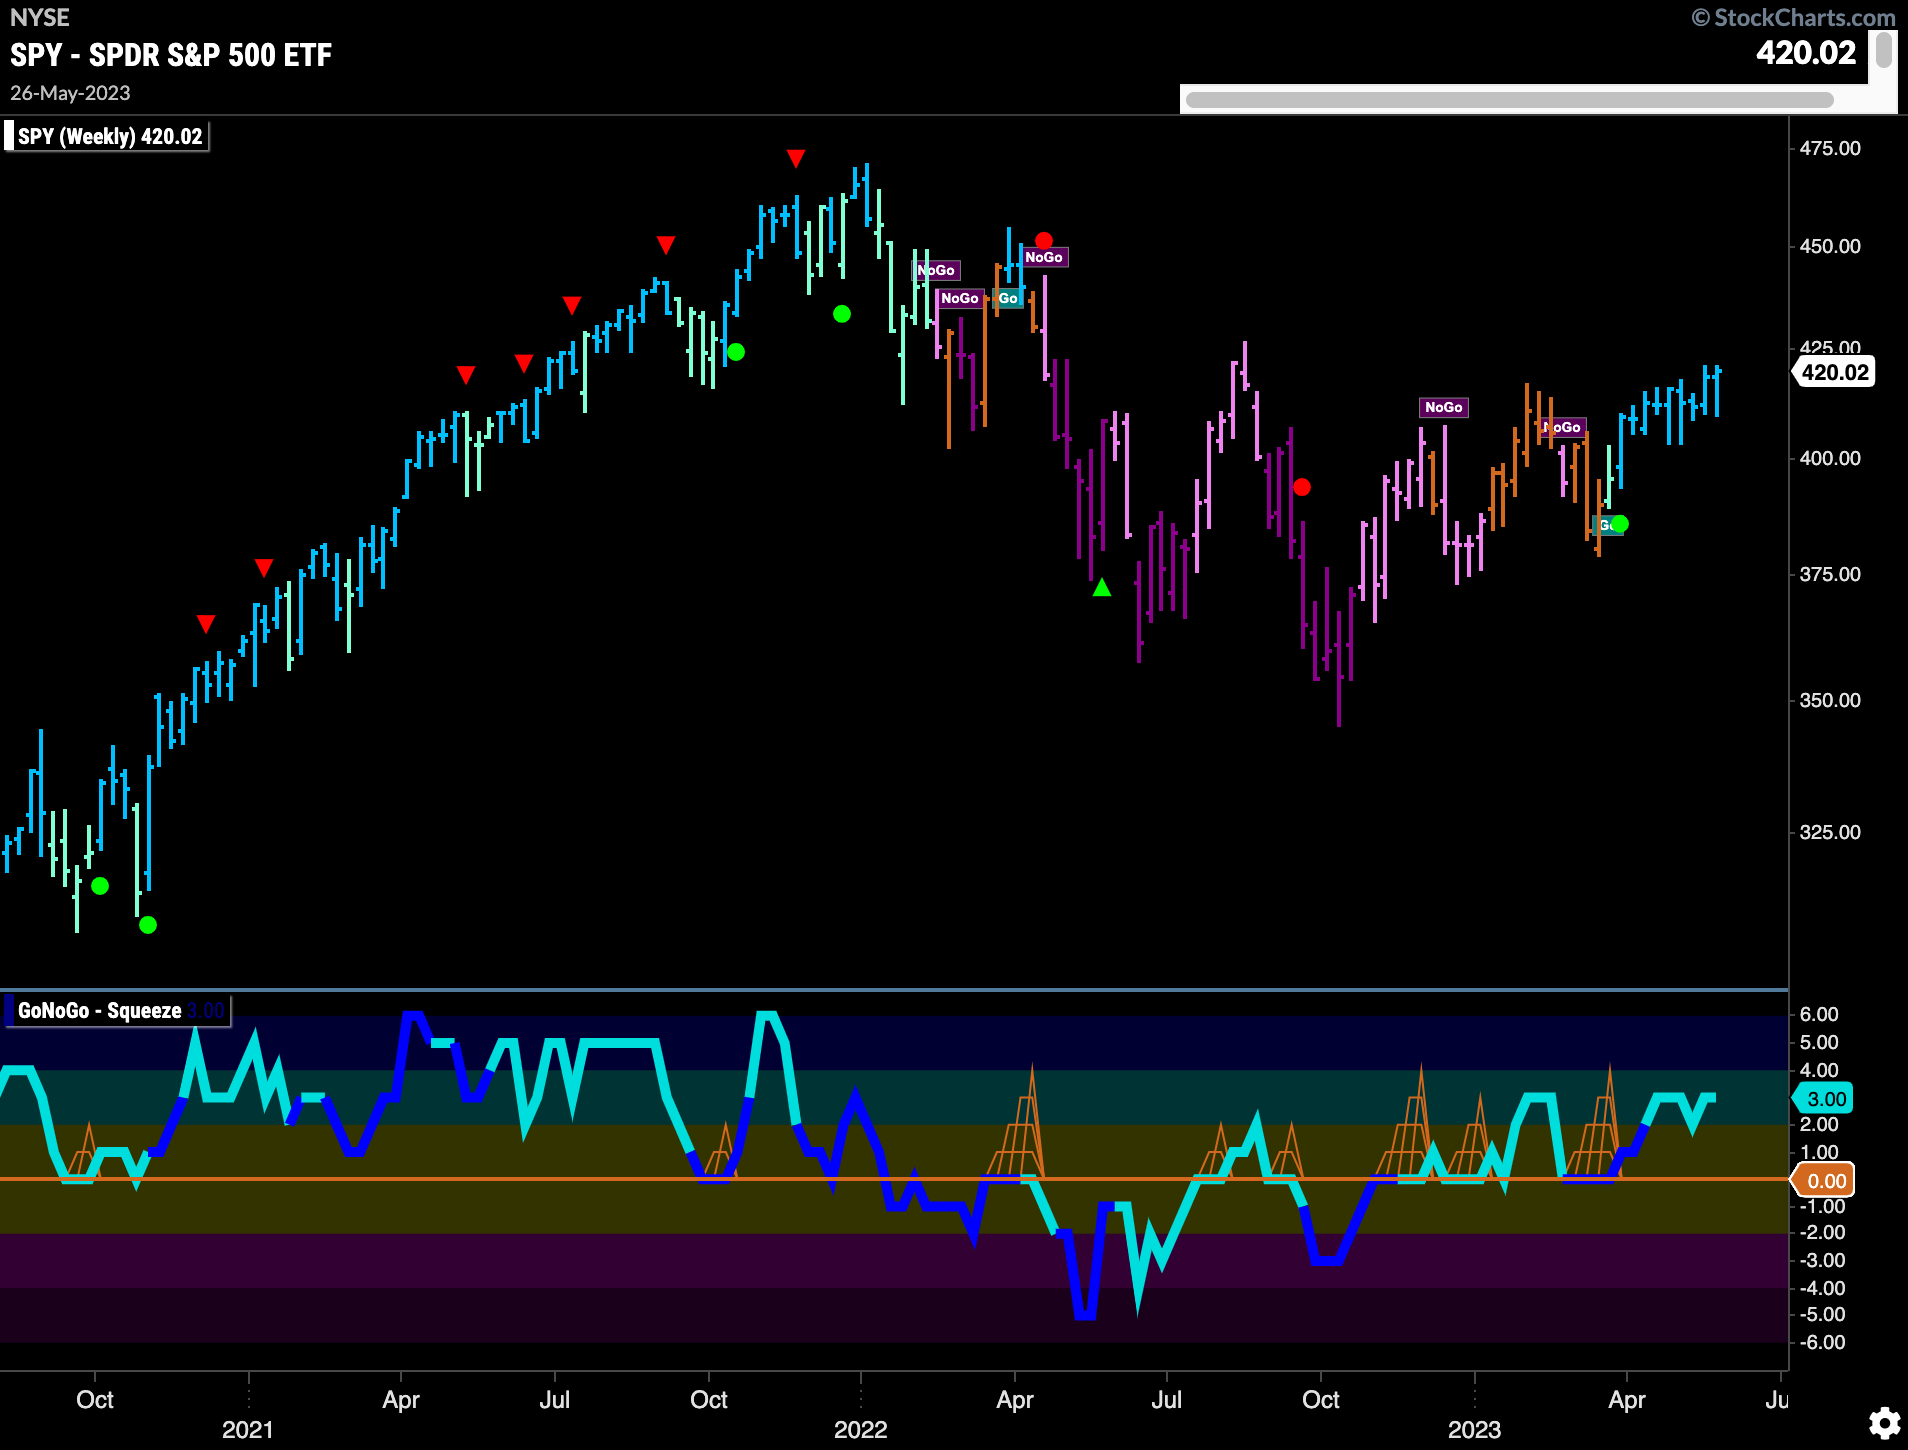
$SPY continues to try to move higher and set a new high. We can see that after a wobble mid week, price rallied again and GoNoGo Trend paints another strong blue bar. GoNoGo Oscillator found support this week at the zero line and volume is heavy. We will watch to see if this renewed positive momentum is enough to push price higher.
The longer term weekly chart shows that the strength seen on the daily chart is no surprise. GoNoGo Trend is painting strong blue “Go” bars and GoNoGo Oscillator is in positive territory but not yet overbought. Price is close to making a new high and then will test the high from summer ’22.
Treasury Rates Forge Ahead
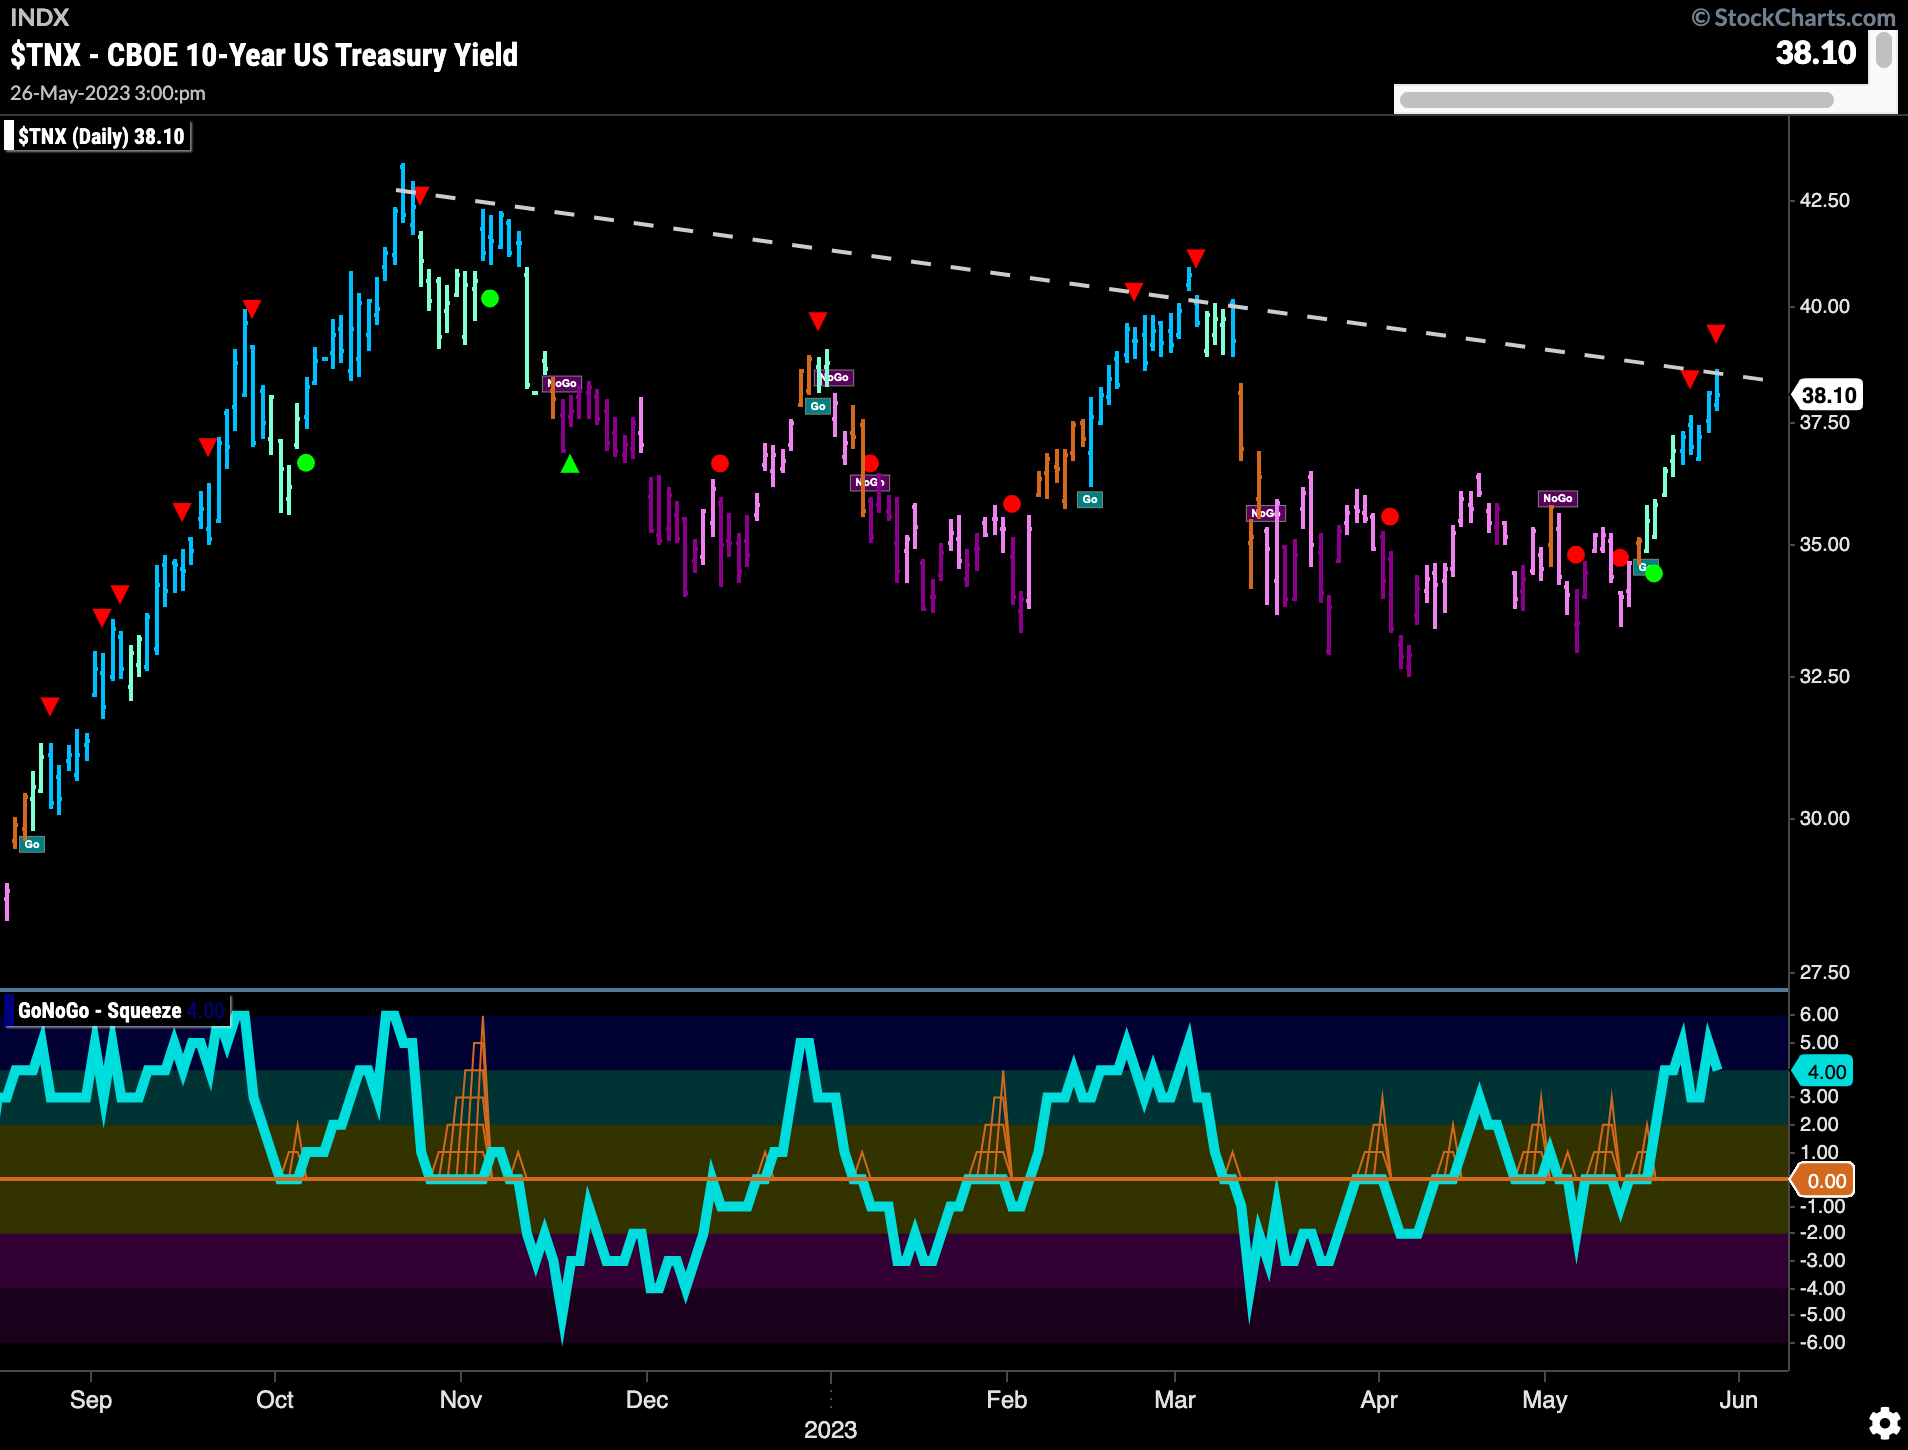
Another strong week for rates. Price moved higher as GoNoGo Trend painted a string of strong blue “Go” bars. GoNoGo Oscillator has stayed elevated after breaking through the zero line last week. We will watch to see if this positive momentum is enough to push price above the resistance that we see on the chart in the form of the downward sloping trend line.
Dollar’s Tests Important Level
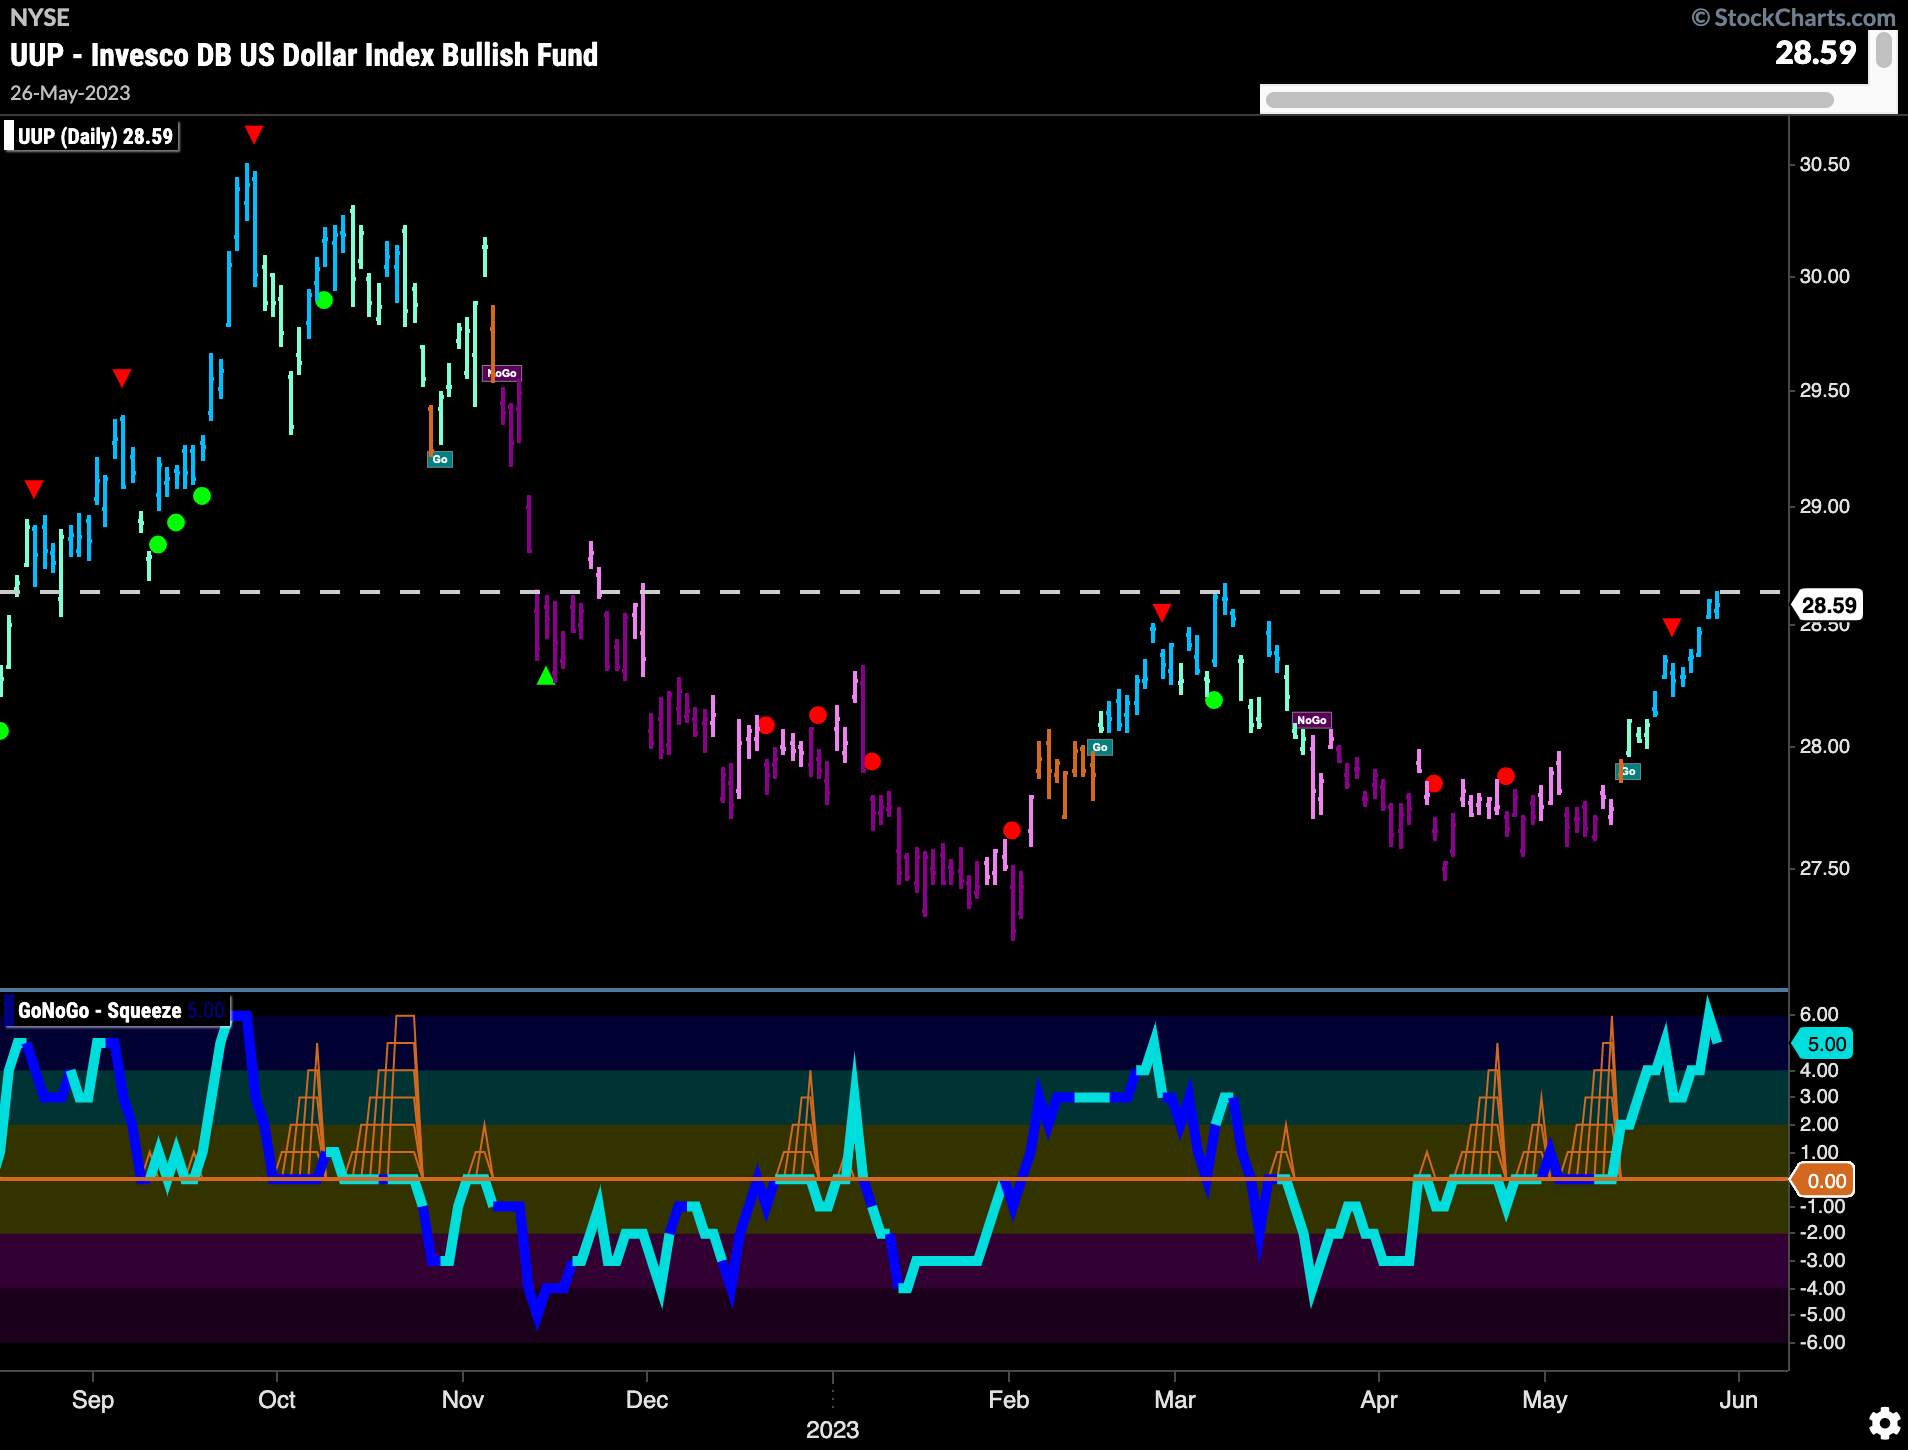
GoNoGo Trend painted a string of strong blue “Go” bars this week as price raced higher. GoNoGo Oscillator has moved into overbought territory as momentum has been strong since breaking out of the Max GoNoGo Squeeze. We will watch to see if price can break above the overhead supply we see on the chart in the form of prior highs.
Oil Going Nowhere in “NoGo” Channel
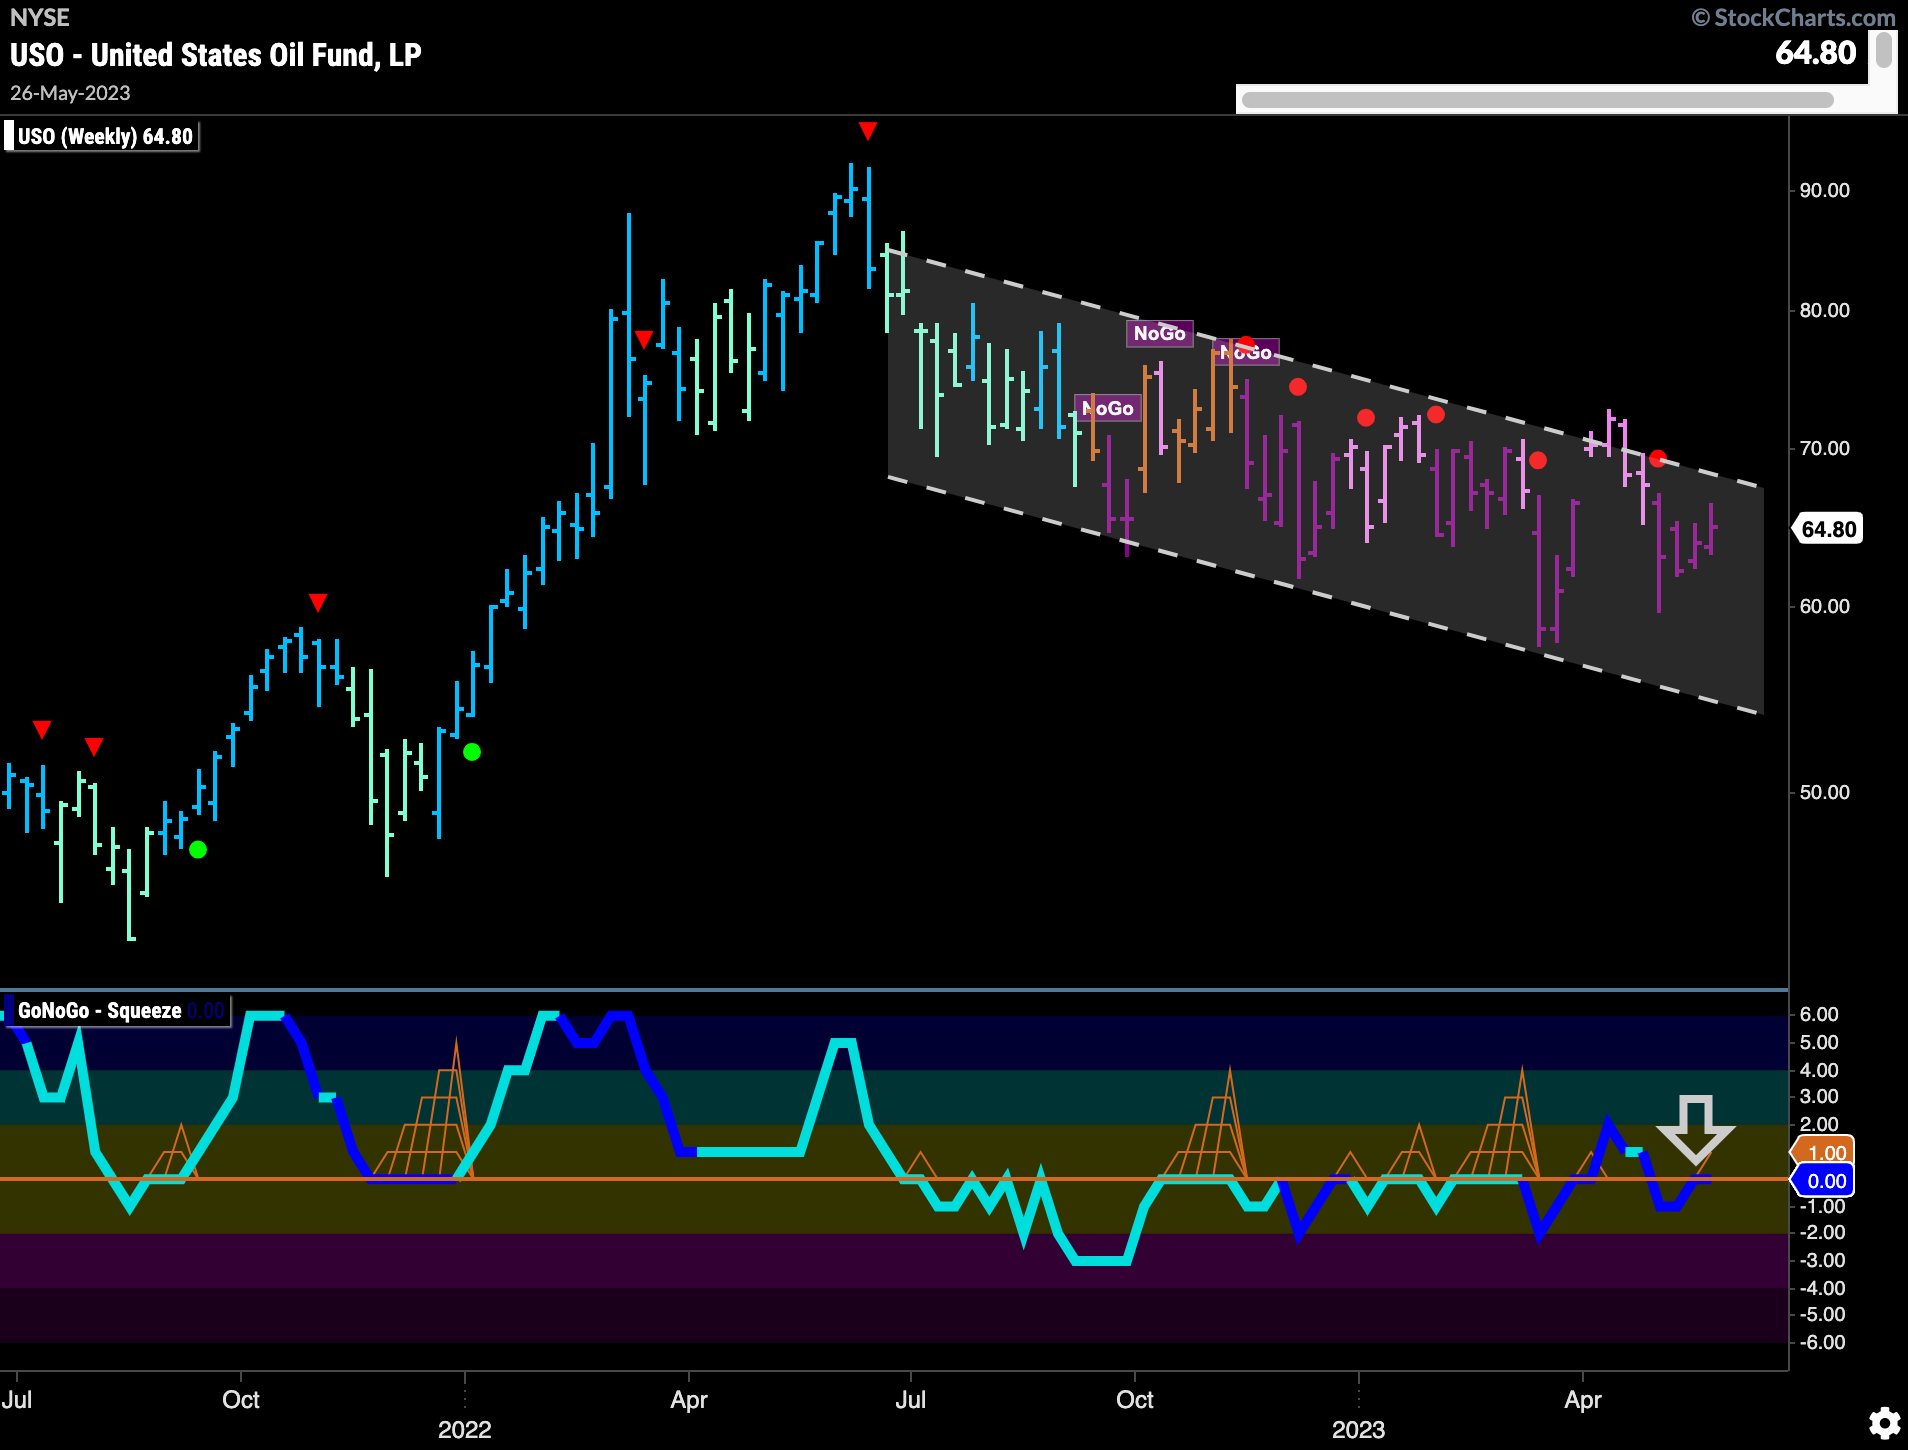
Price has moved higher within the downward sloping trend channel that has seen GoNoGo Trend paint “NoGo” pink and purple bars for several months now. GoNoGo Oscillator is back at the zero line testing it from below and volume is heavy. We will watch to see if this level holds as resistance, in which case we may see price test the lower bound of the channel again. A break of the oscillator into positive territory would likely see price put pressure on the upper bound of the channel.
Gold’s Sheen Worn Off
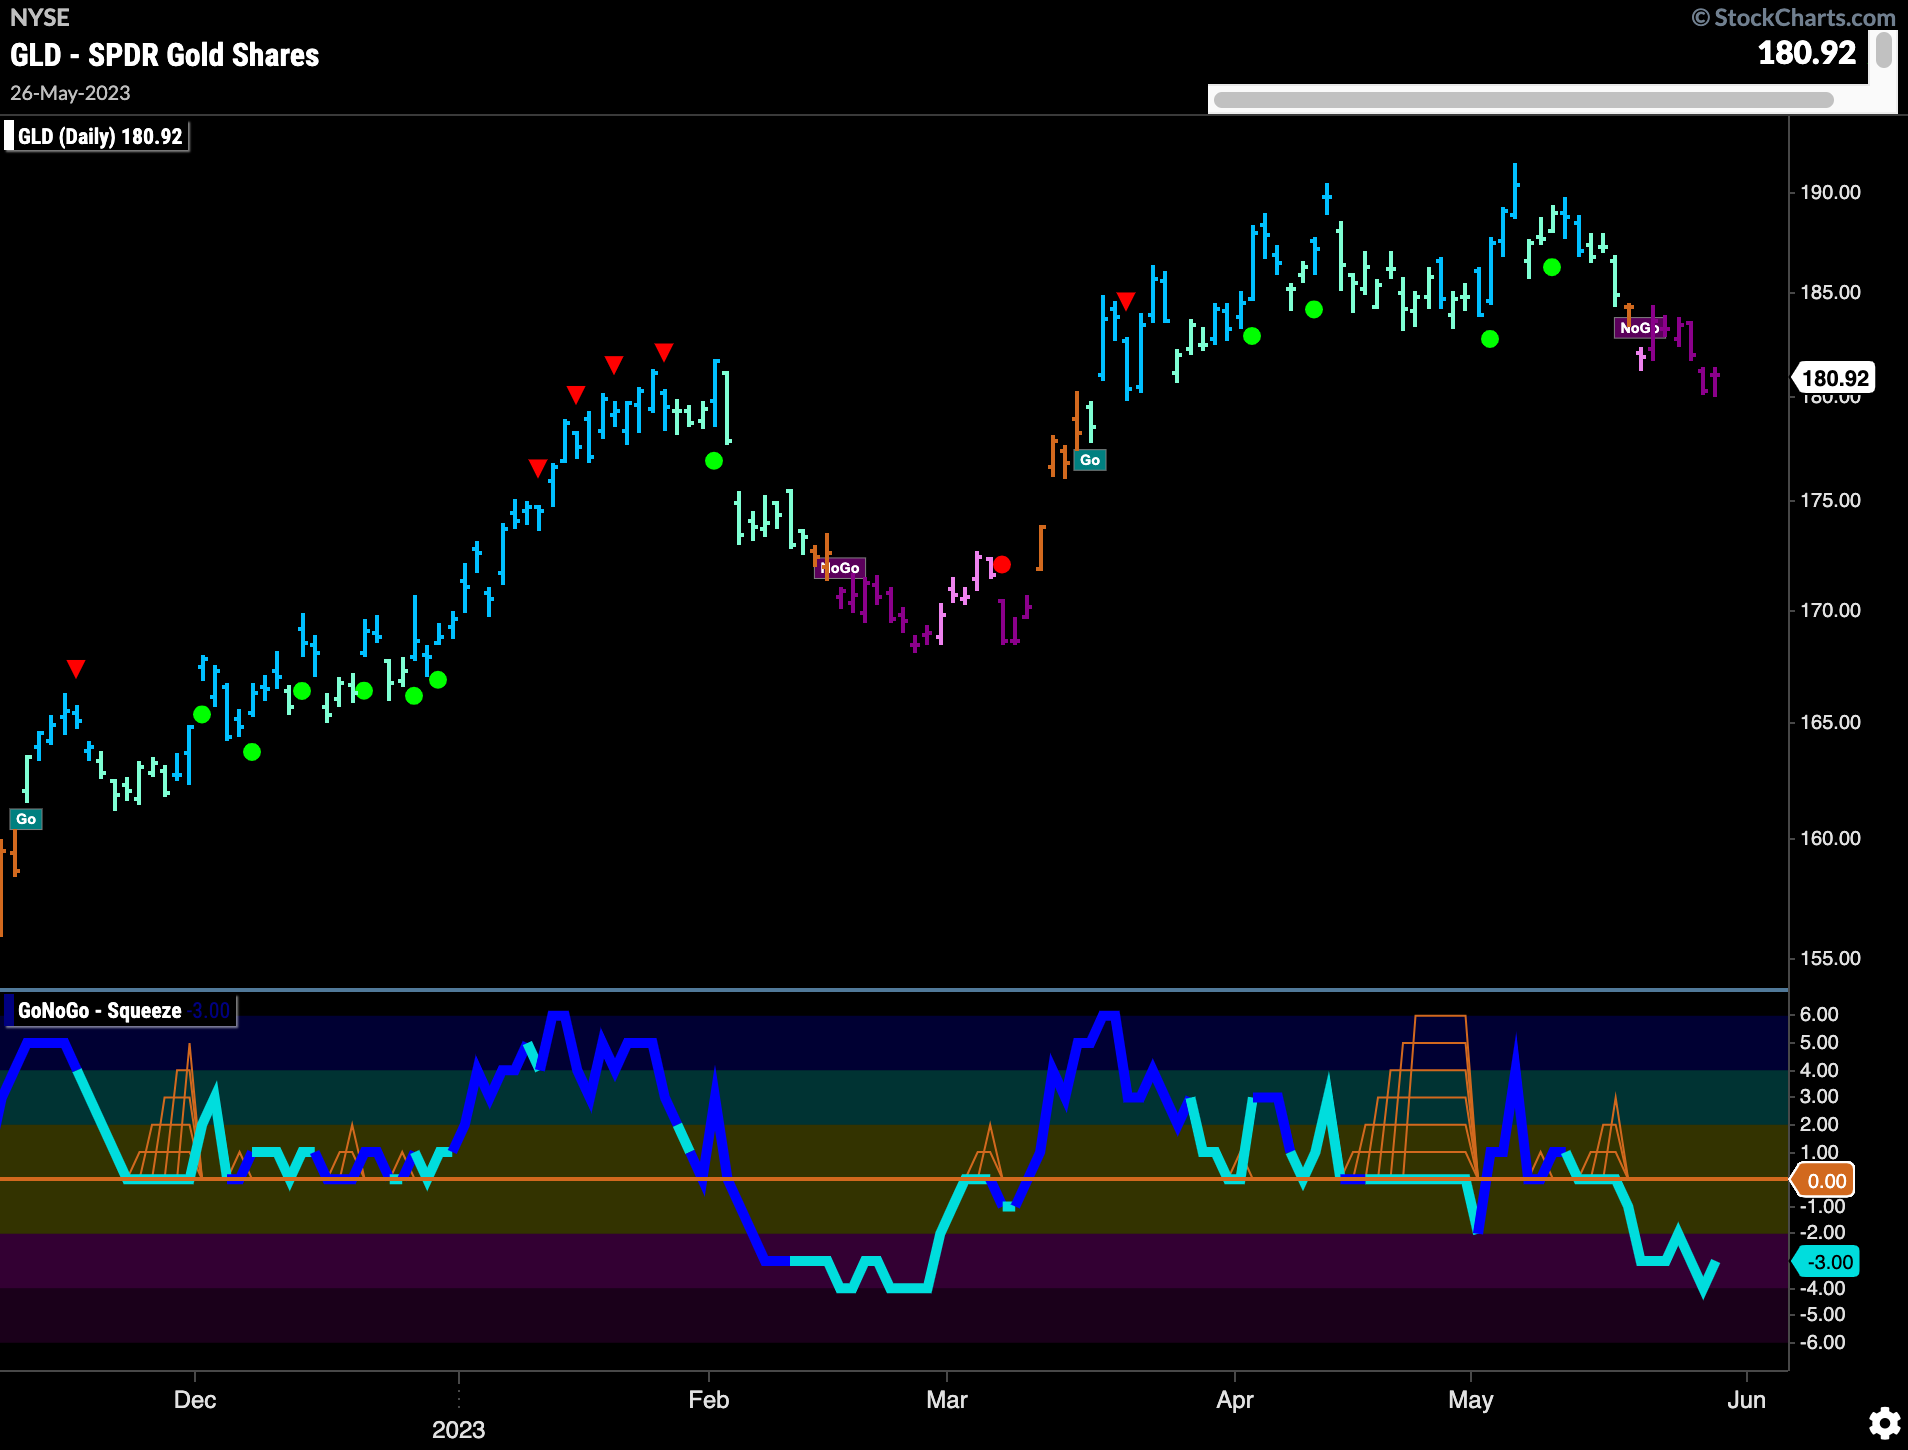
The price chart below shows that price has struggled since failing to make a new higher high. GoNoGo Trend painted uninterrupted strong purple “NoGo” bars last week as price fell lower. GoNoGo Oscillator after breaking below the zero line has continued to move further into negative territory although is not yet oversold.
Sector RelMap
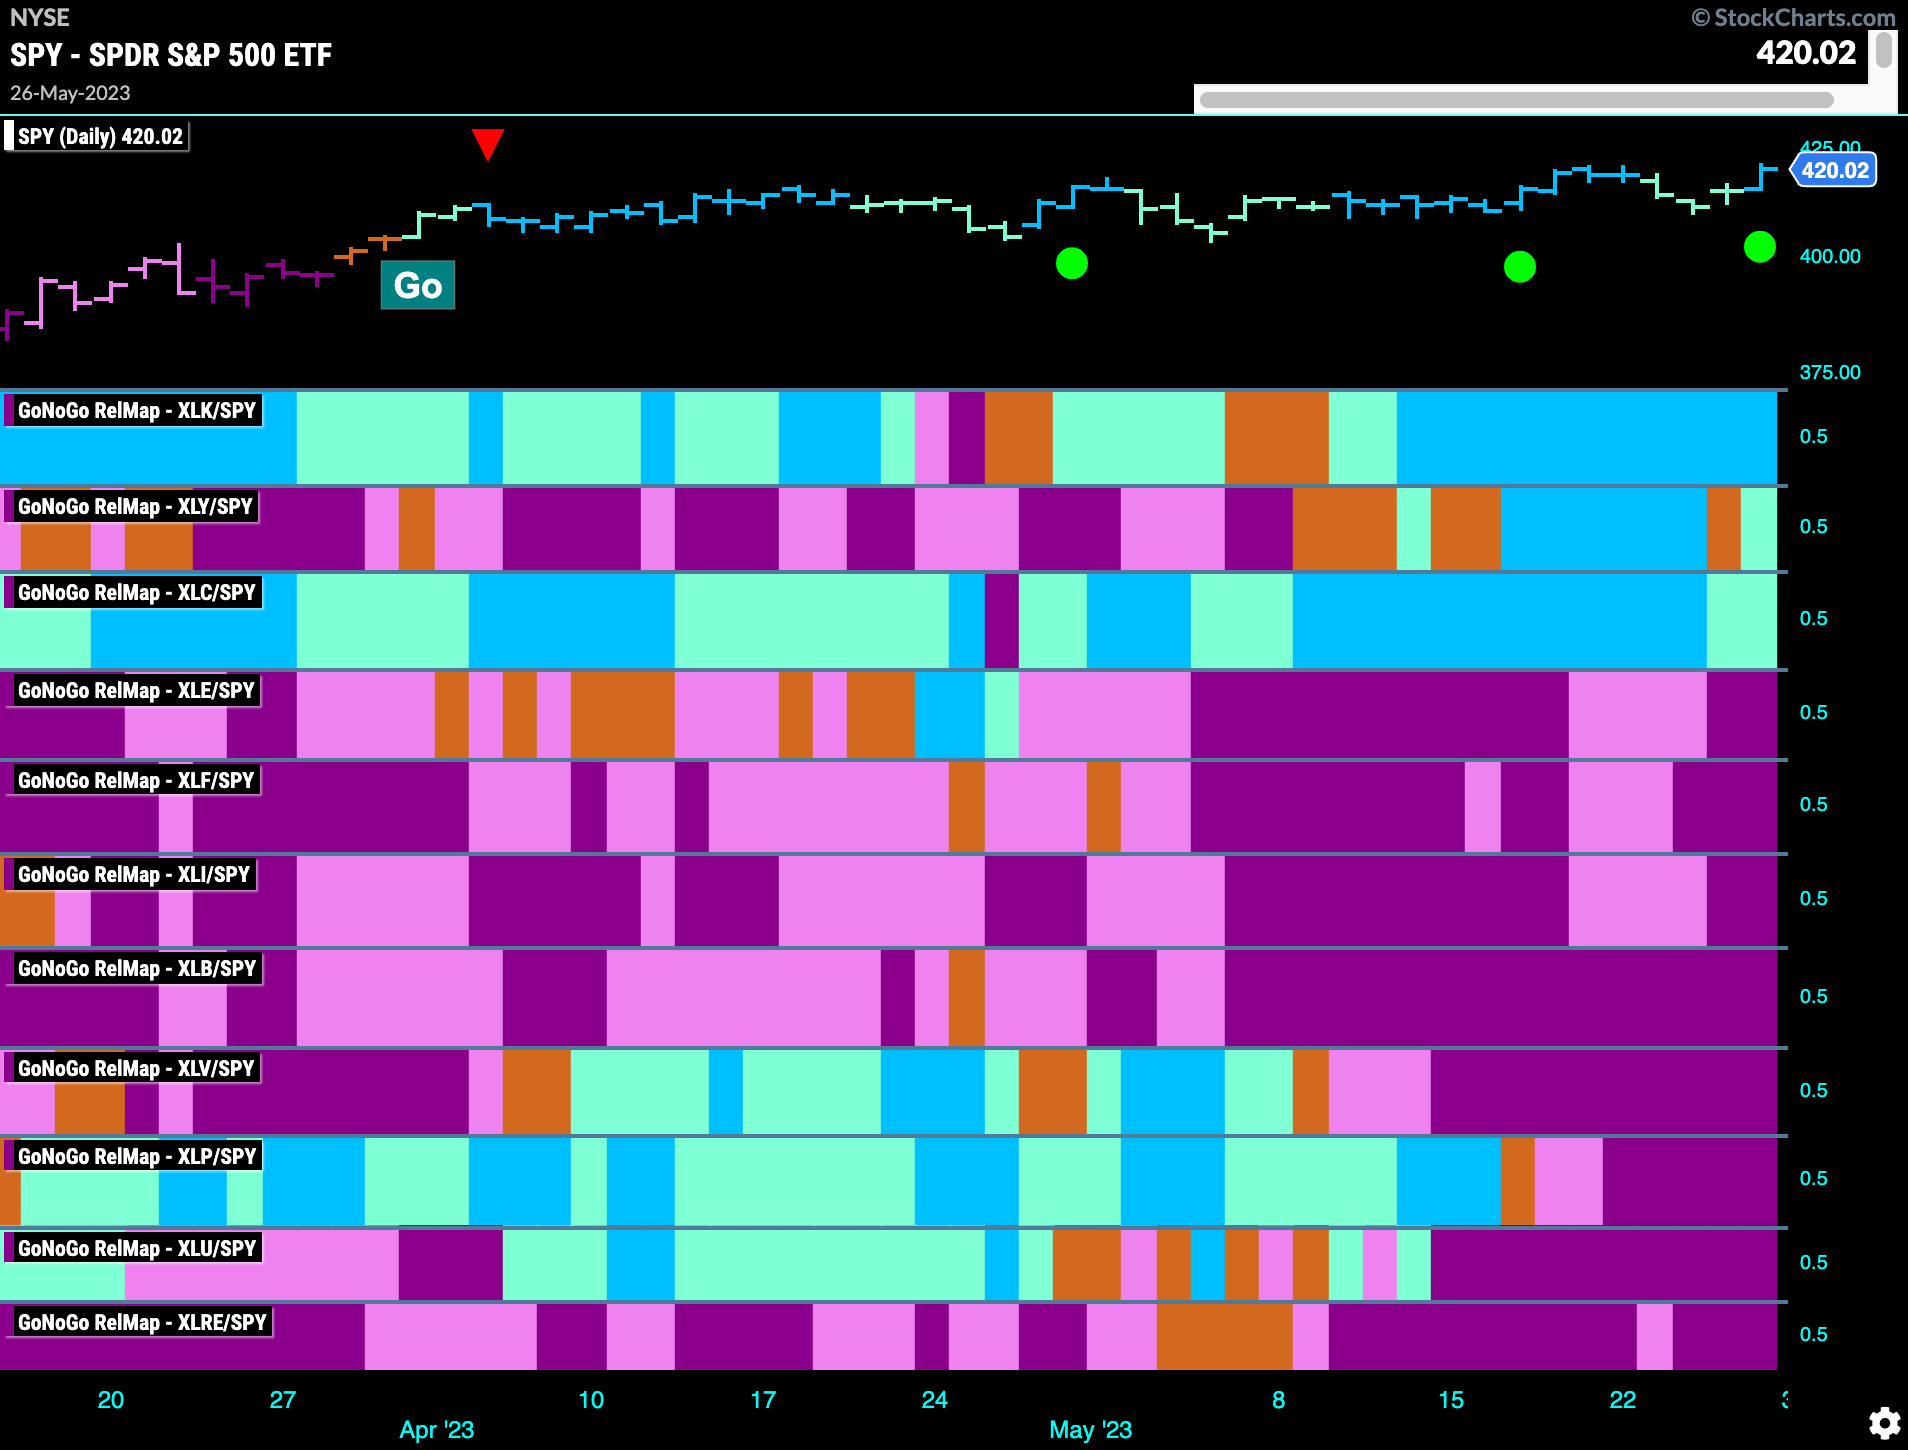
Below is the GoNoGo Sector RelMap. This GoNoGo RelMap applies the GoNoGo Trend to the relative strength ratios of the sectors to the base index. Looking at this map, we can quickly see where the relative outperformance is coming from as well as which sectors are lagging on a relative basis. 3 sectors are outperforming the base index this week. $XLK, $XLY, and $XLC are painting “Go” bars.
Tech Sector RelMap
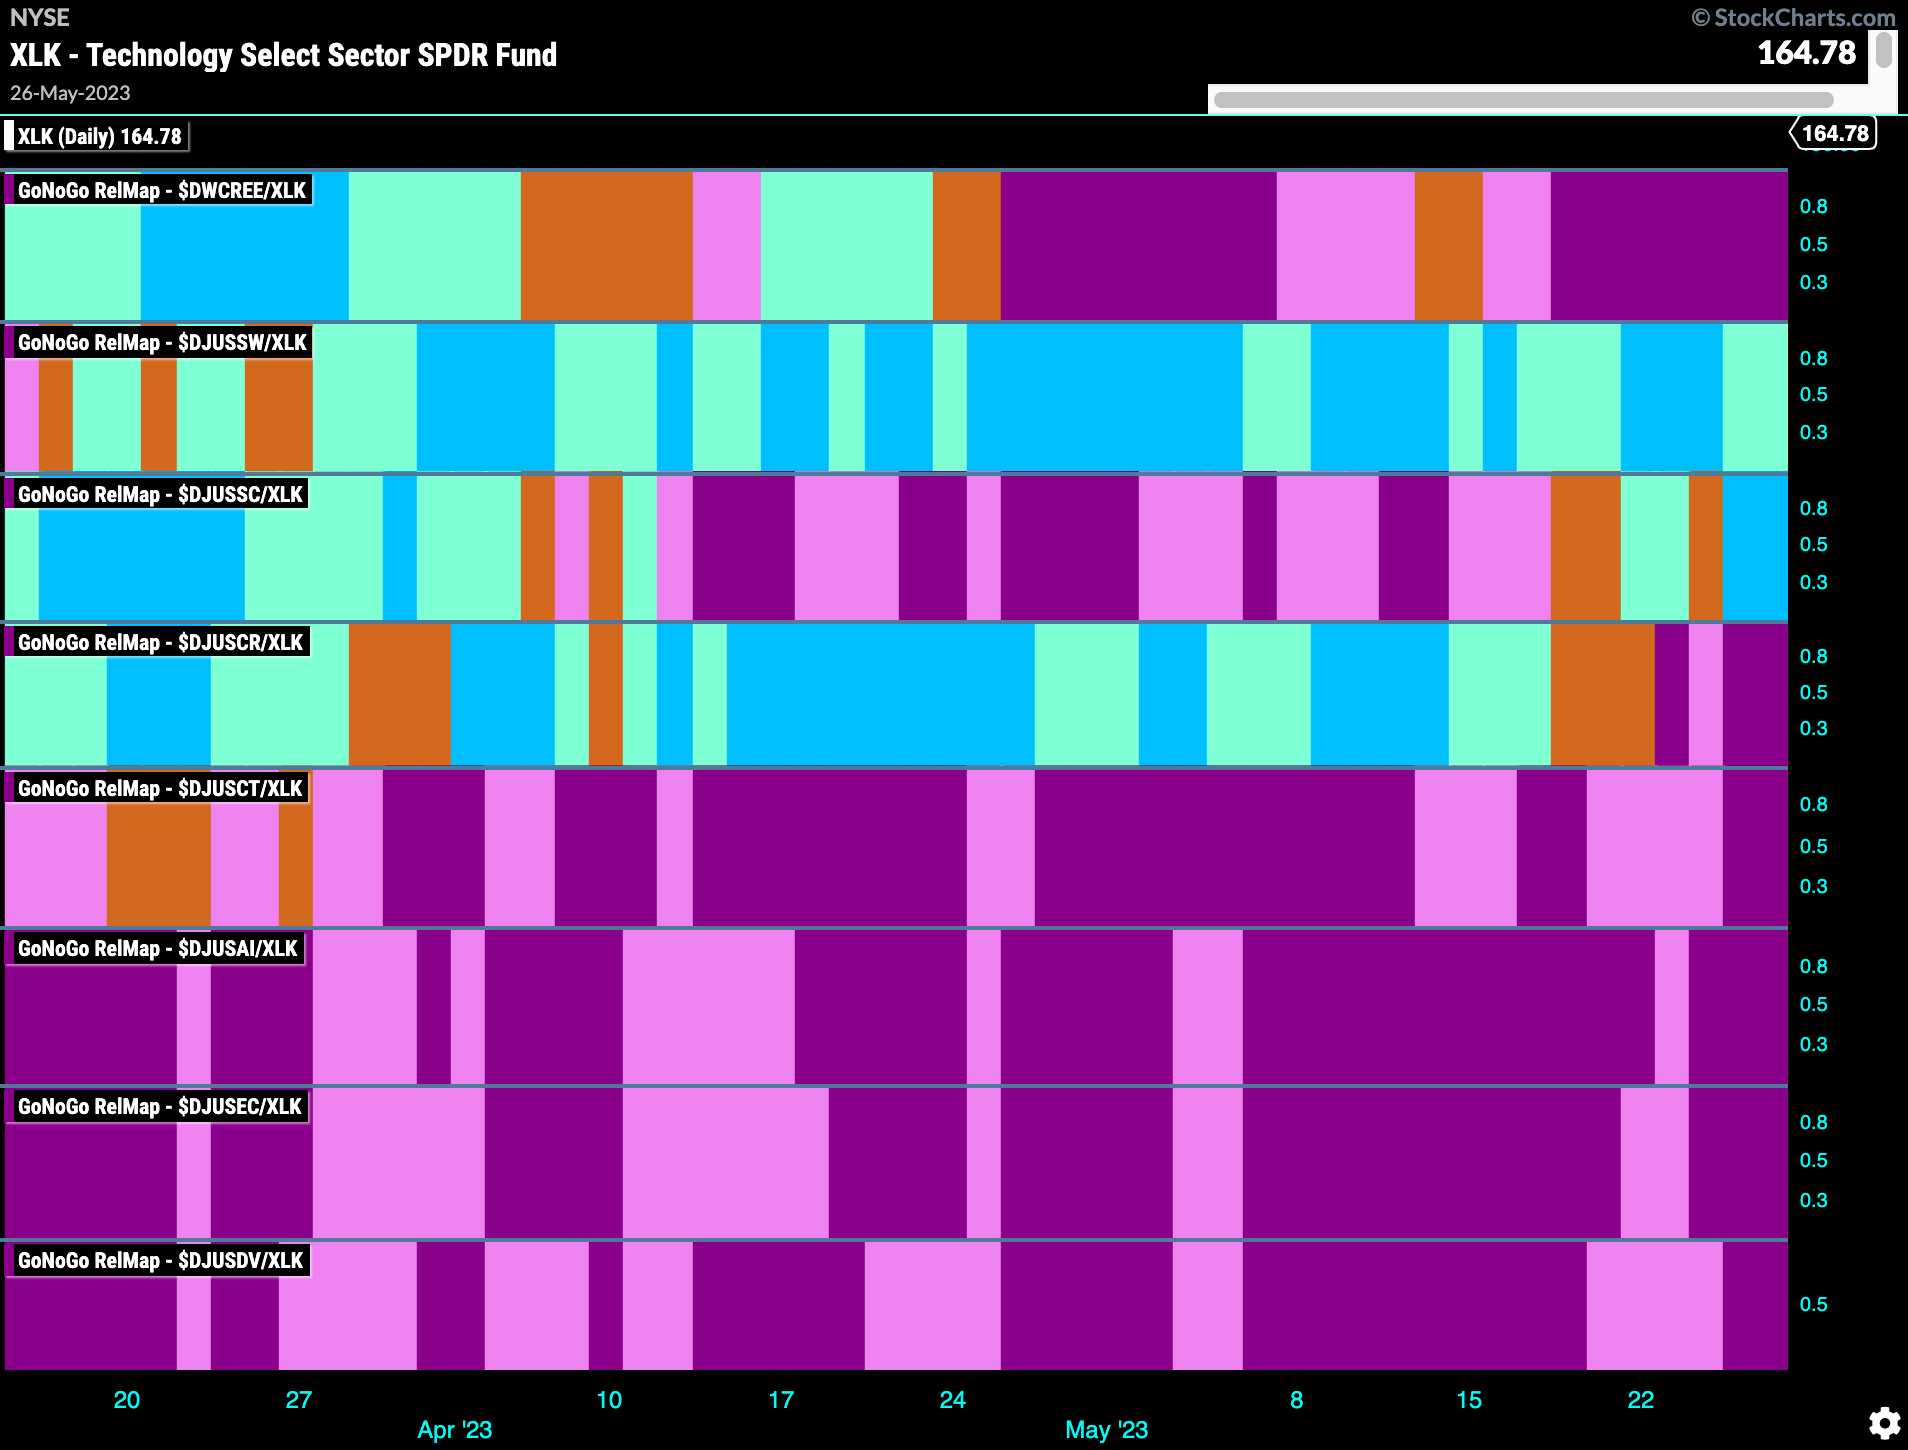
Below is the GoNoGo RelMap for the technology sector. We can see the relative trend of the sub industry groups in this map. Within the outperforming sector, we can see that the software index is leading. (2nd panel) This sub group has been in a relative “Go” trend for months now.
Software Index Shows Long Term Strength
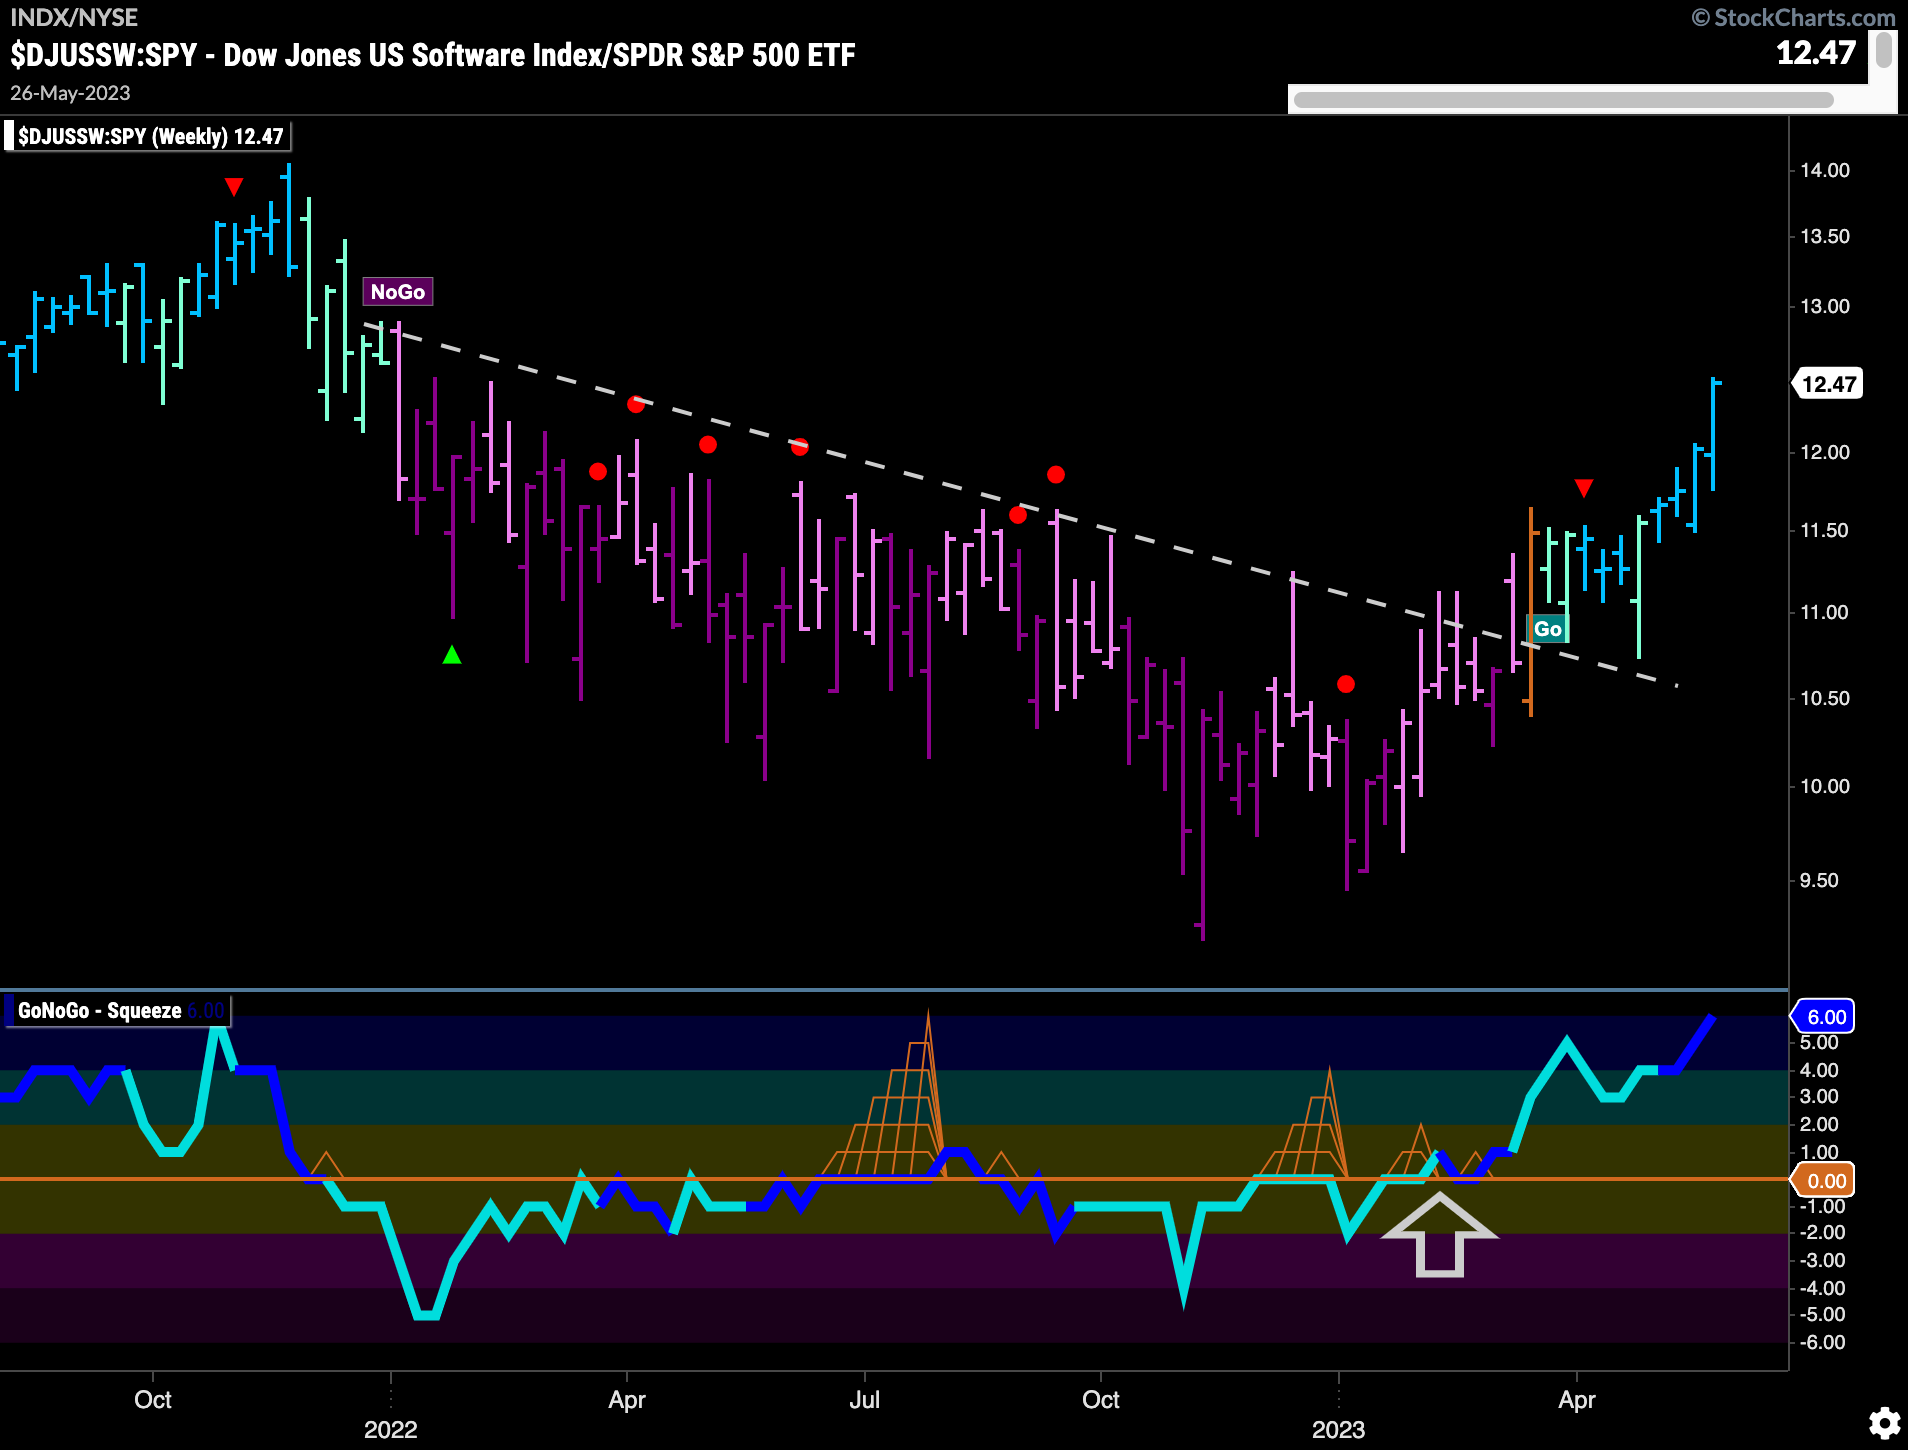
Below is a weekly ratio chart of $DJUSSW:SPY. Looking at the relative ratio of the software index to the S&P 500 gives us a view of just how strong that sub group is. We have applied the GoNoGo Chart to the ratio and can see that since March the ratio has been in a “Go” trend as the sub group broke out of its relative “NoGo” and into the “Go” trend of relative outperformance. This came after GoNoGo Oscillator broke into positive territory and so we know that momentum is on the side of the “Go” trend.
$UBER Ready For More Gains?
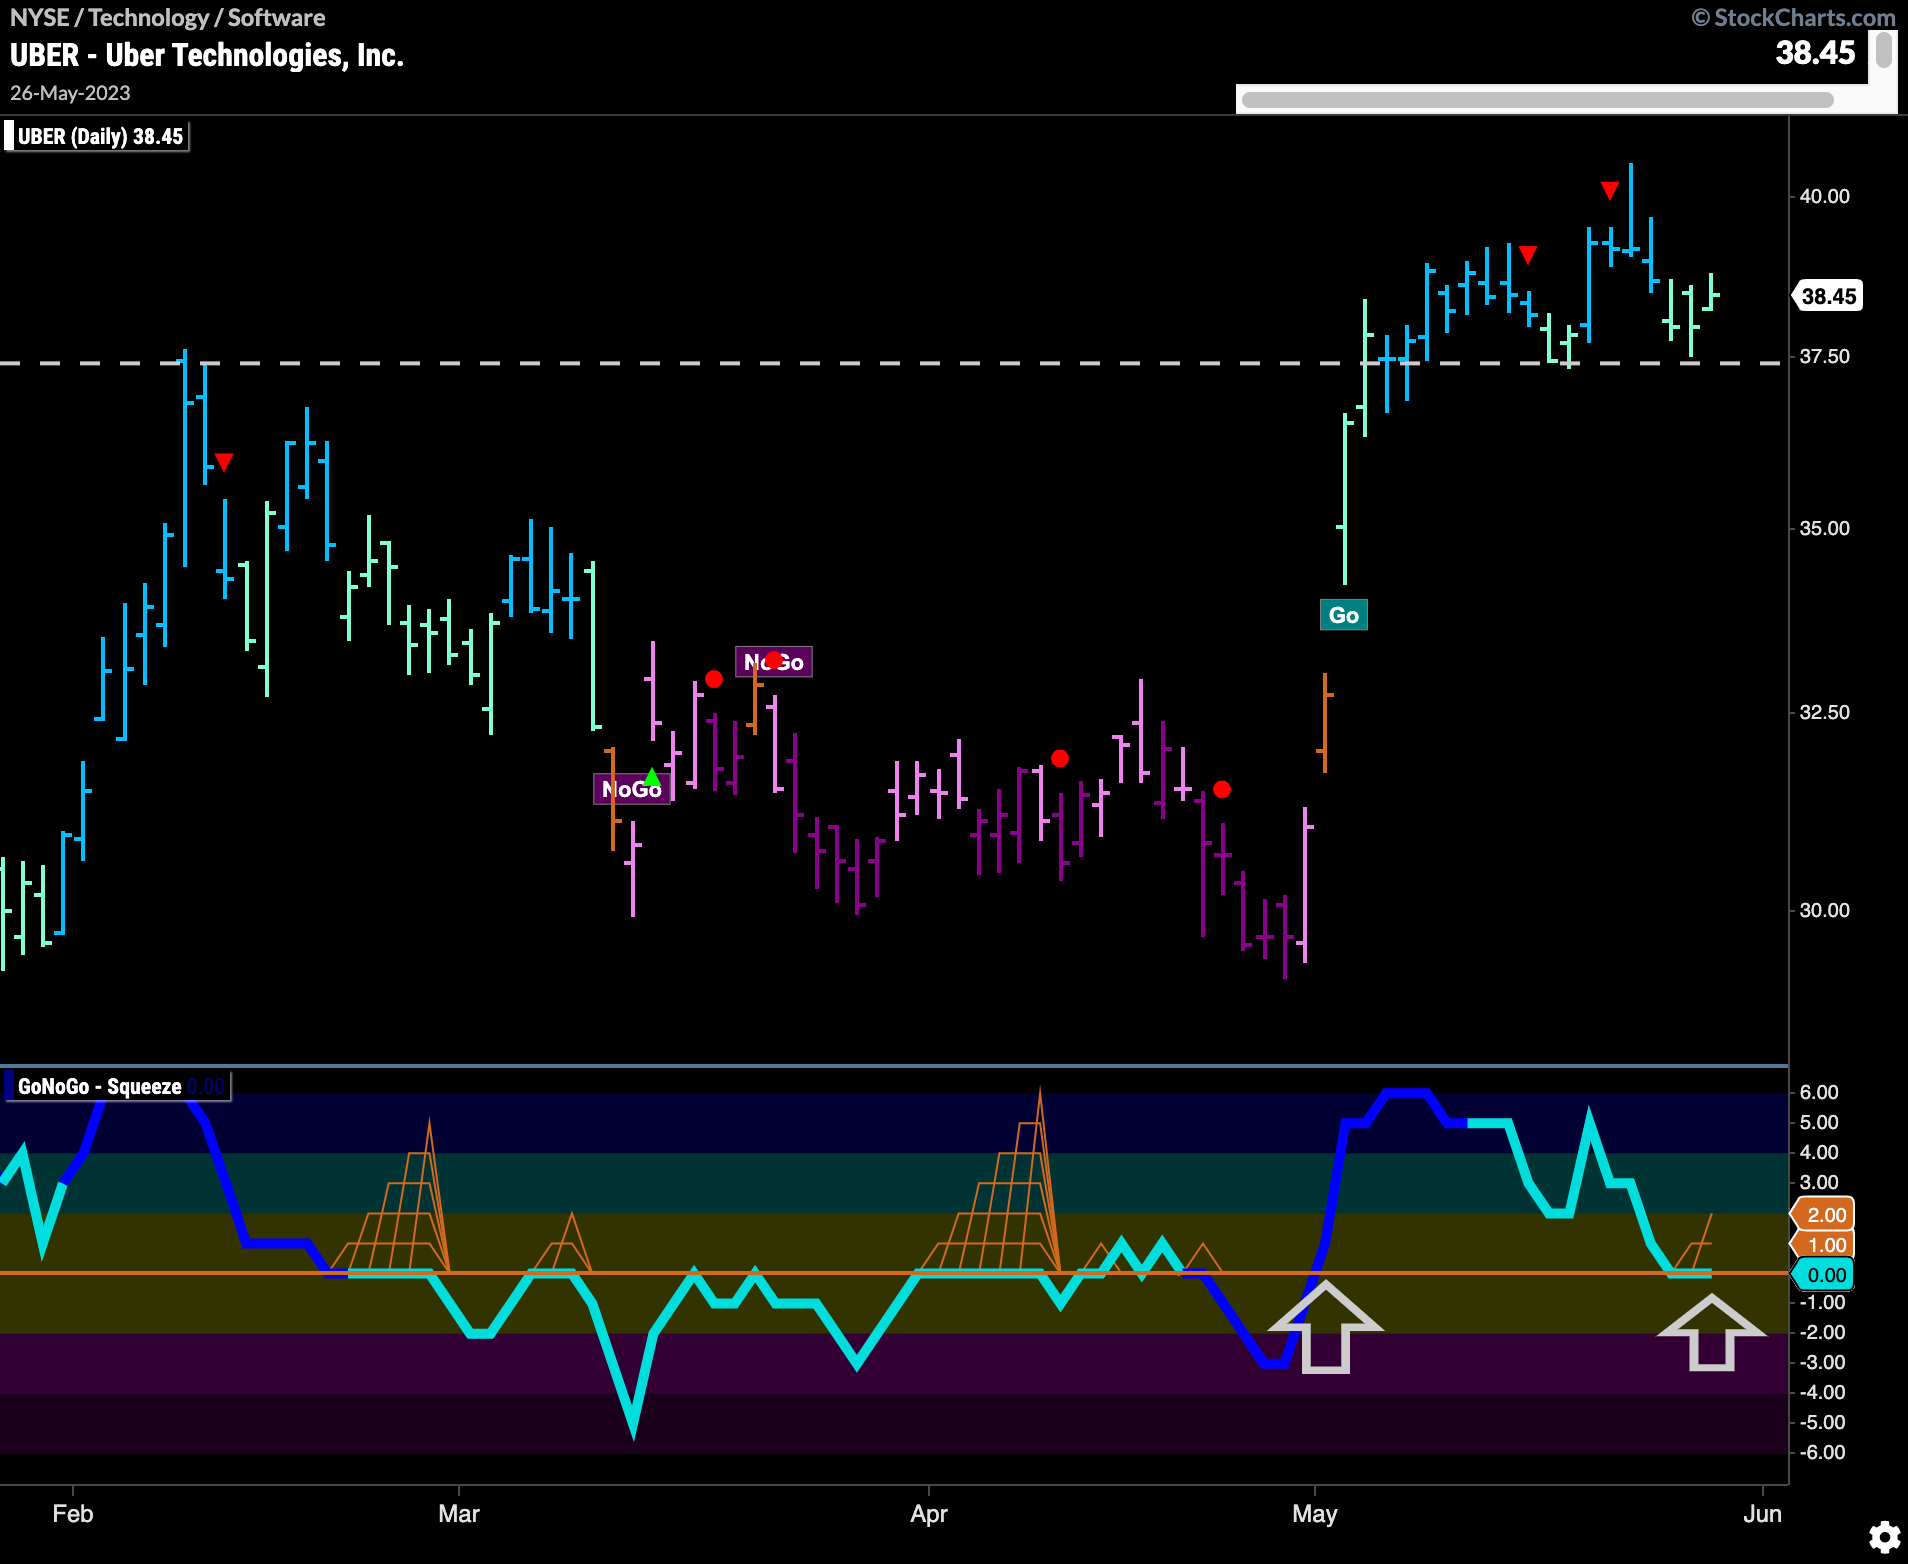
The chart below shows the daily prices of $UBER with the complete GoNoGo Chart. We can see that while $UBER has rallied strongly to make new highs it is consolidating mostly sideways after a couple of Go Countertrend Correction Icons (red arrows). Price has found support on multiple occasion at prior high levels. This is the concept of polarity playing out.. What once was resistance becomes support. GoNoGo Oscillator is testing the zero line from above and so we will watch to see if this level holds. If it does, we can expect price to make an attempt at a higher high, with momentum on its side.
$UBER Makes New High On Weekly Chart
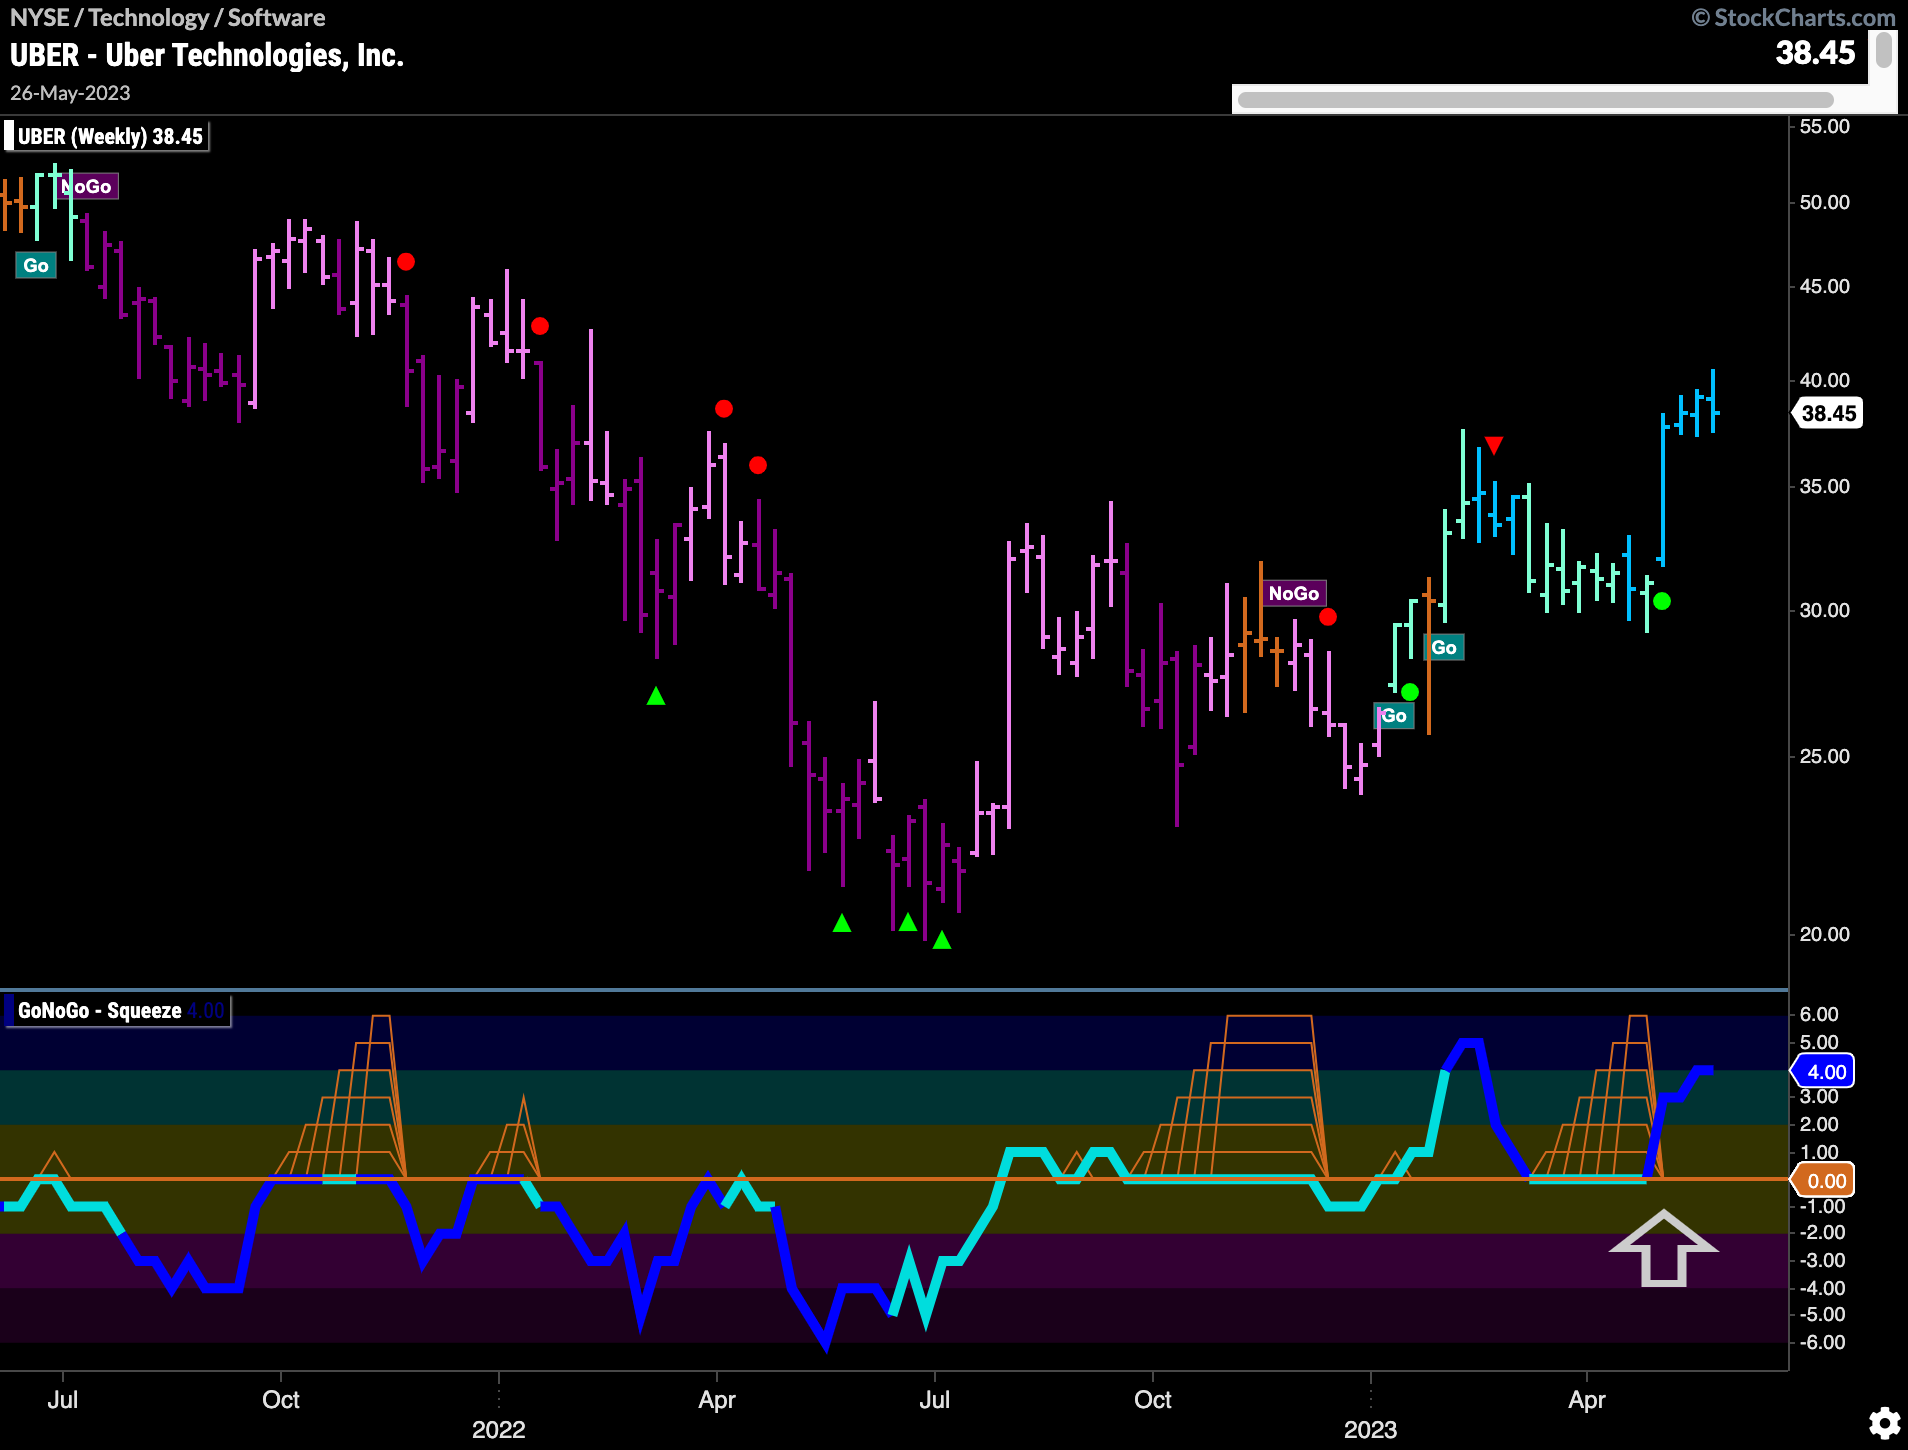
The weekly chart below shows that the trend looks strong. The “Go” trend was identified at the beginning of the year, and since then GoNoGo Oscillator has stayed in positive territory and found support at the zero line after breaking out of a Max GoNoGo Squeeze on heavy volume. The resurgent momentum allowed price to climb to a new higher high.
