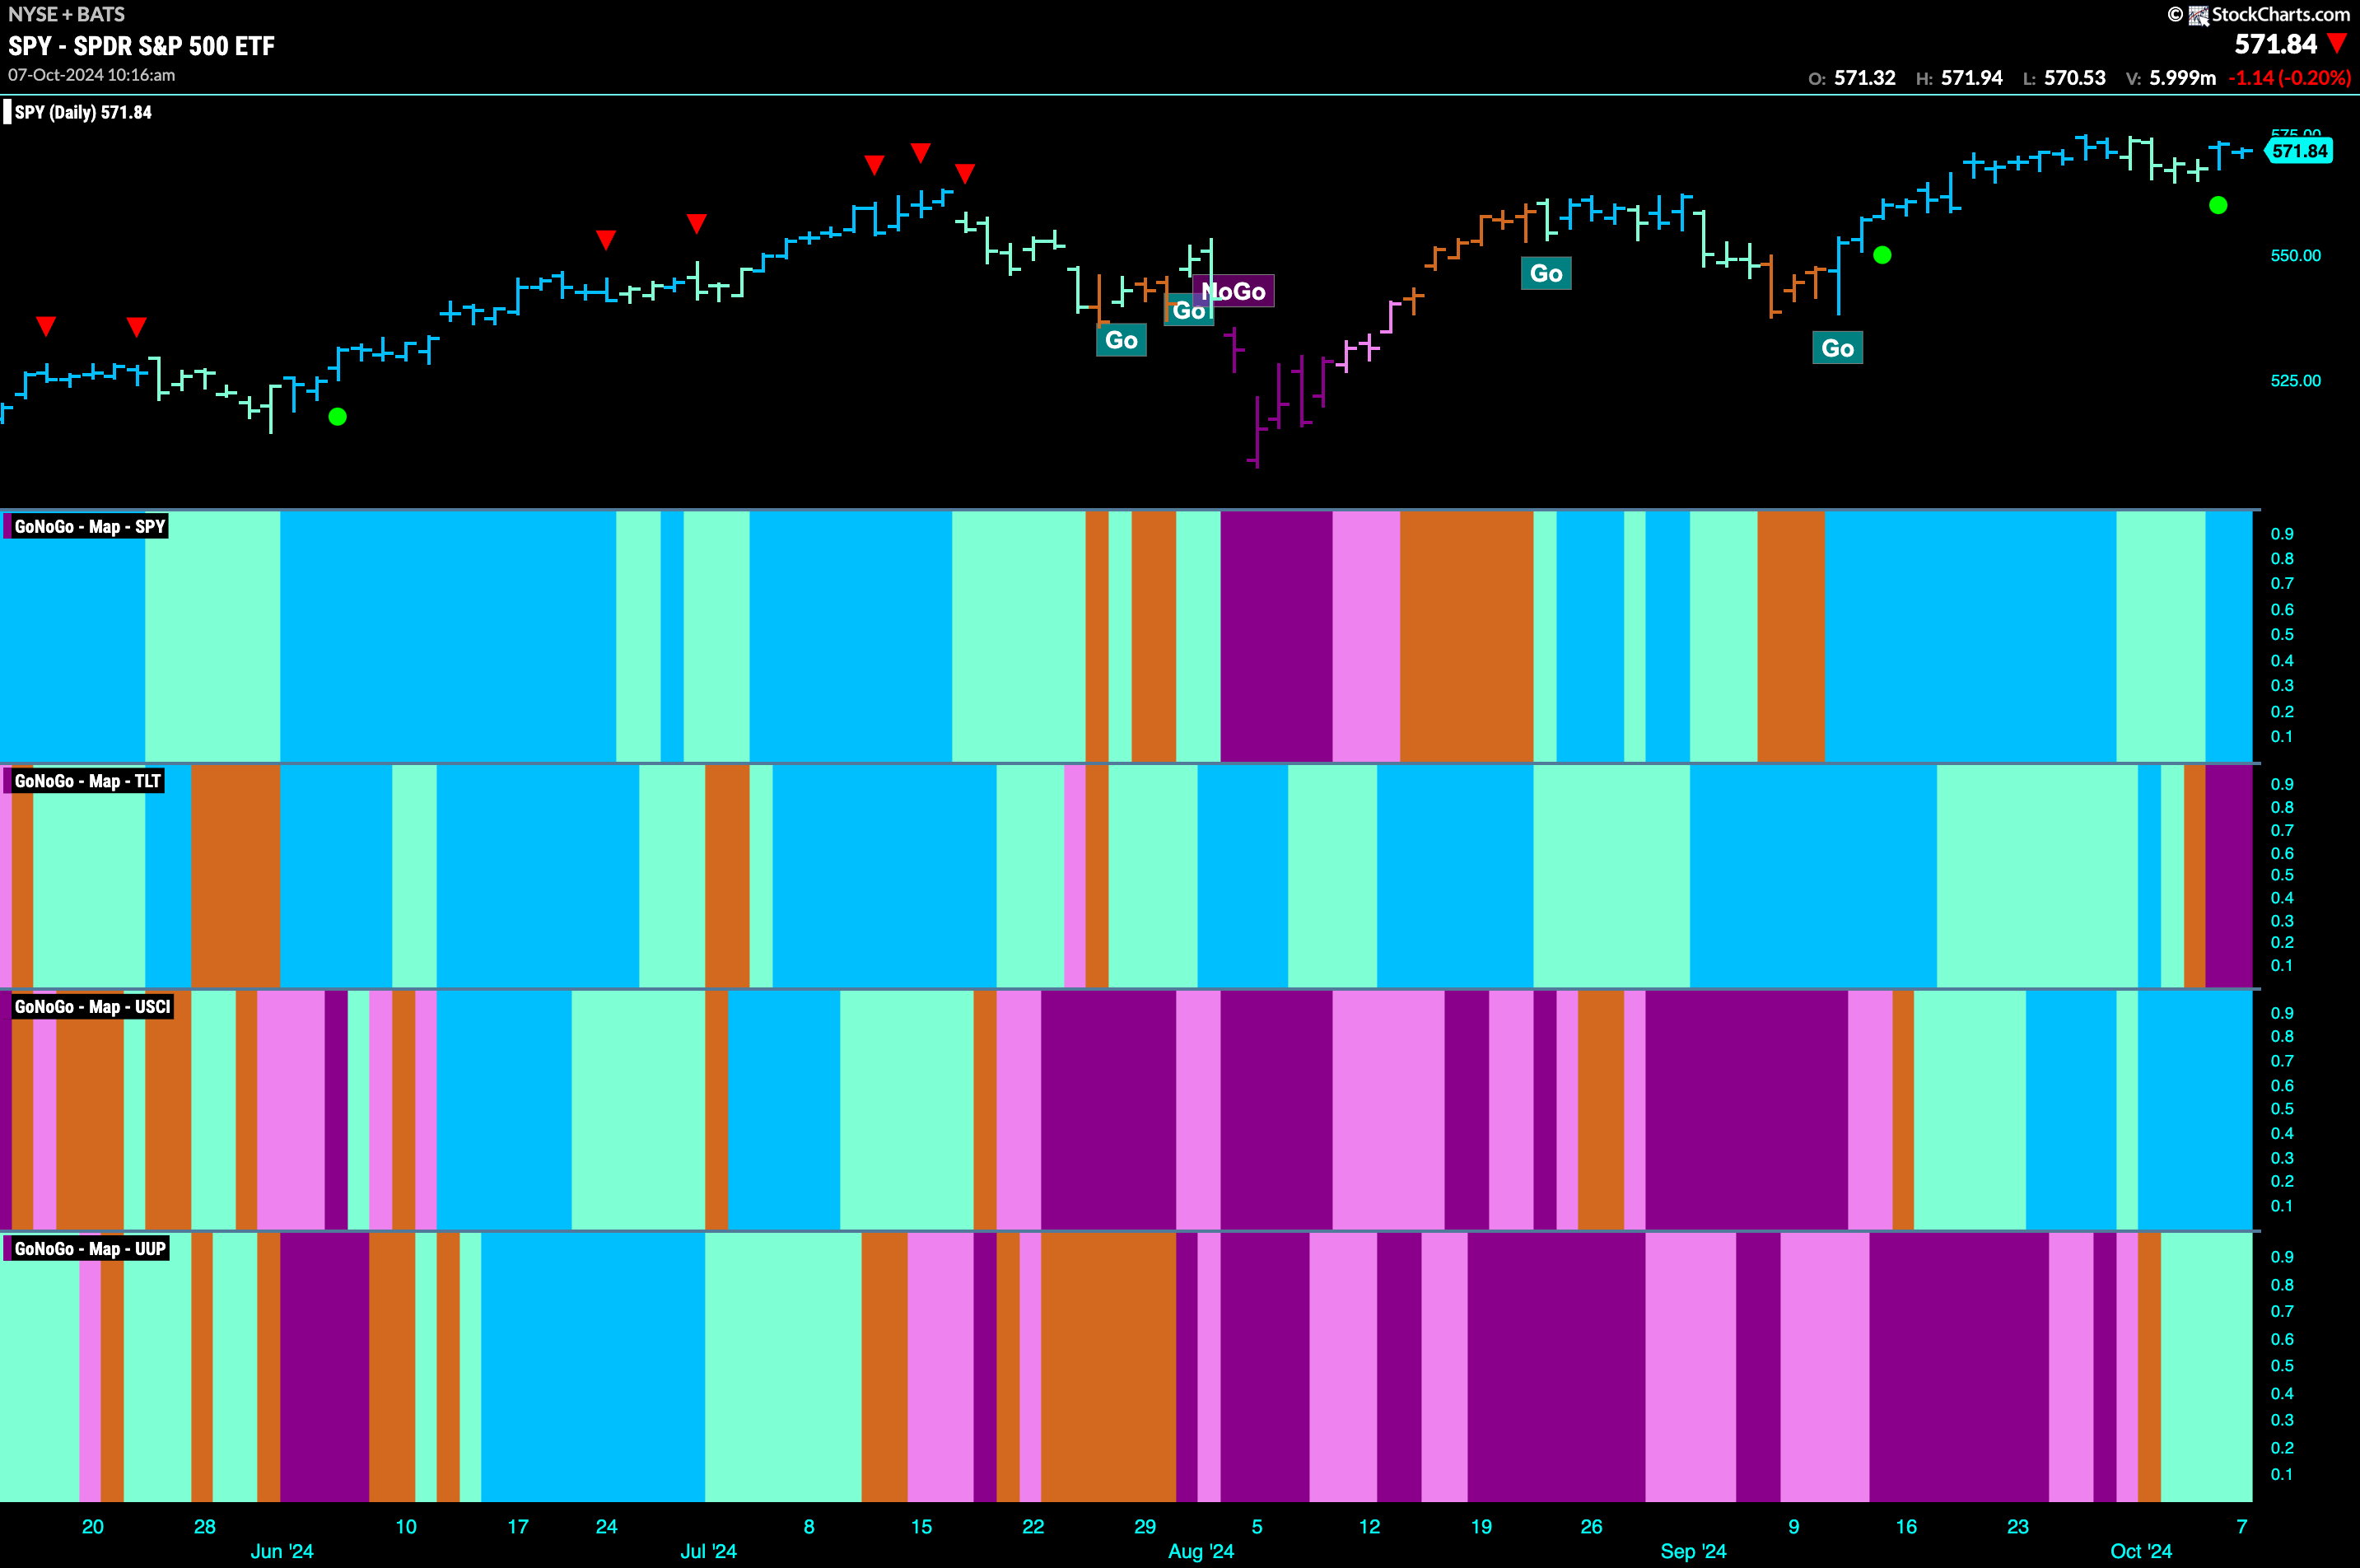
Good morning and welcome to this week’s Flight Path. Equities saw the trend remain and as the week came to a close we saw more strong blue “Go” bars as price rallied close to prior highs. GoNoGo Trend shows that there has been a change in trend from “Go” to “NoGo” for treasury bond prices. After an amber “Go Fish” bar we see strong purple “NoGo” bars. The U.S. commodity index remains in a strong “Go” trend this week while the dollar saw a “Go” take over albeit painting weaker aqua bars.
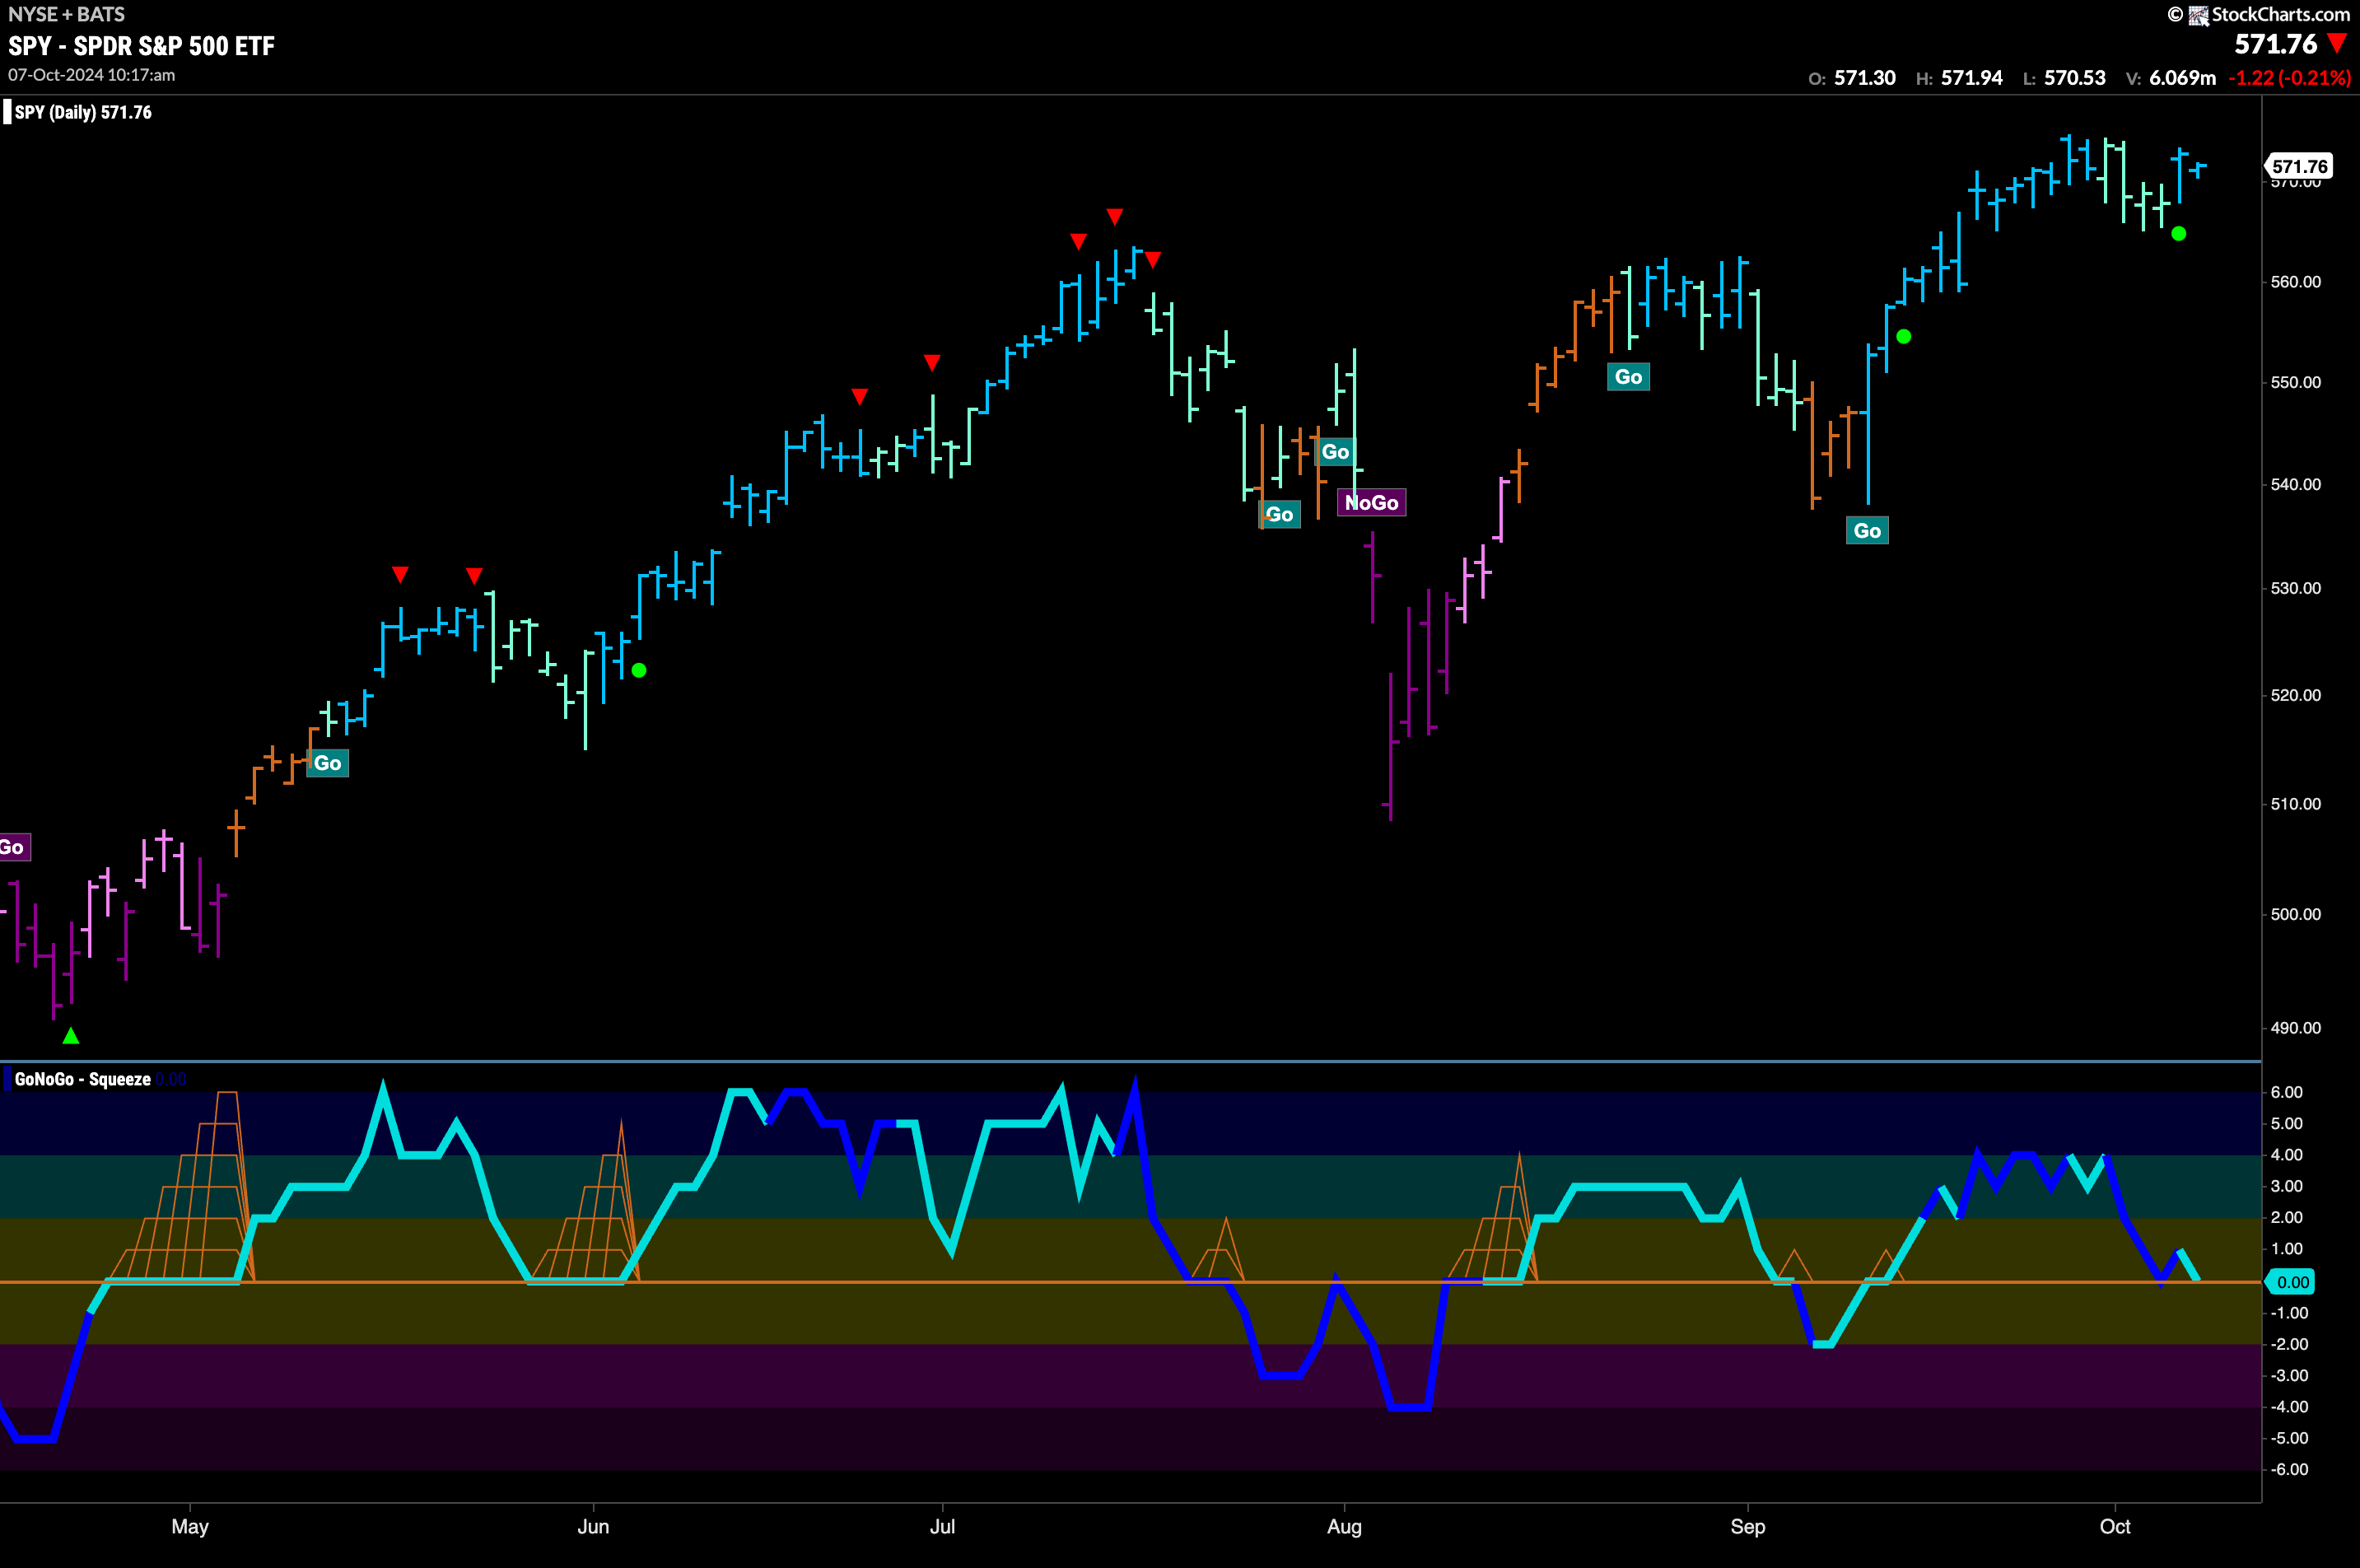
$SPY Fights to Stay Near Highs in “Go” Trend
The GoNoGo chart below shows that after several bars of weakness we see the bright blue bars of a stronger trend return. This may provide a new level of support as we move forward. We also see a Go Trend Continuation Icon (green circle) as GoNoGo Oscillator found support at the zero line. We see that after just one bar we are back testing that level again. It will be important for the oscillator to continue to find support at that level to provide a springboard for price to move higher from here.
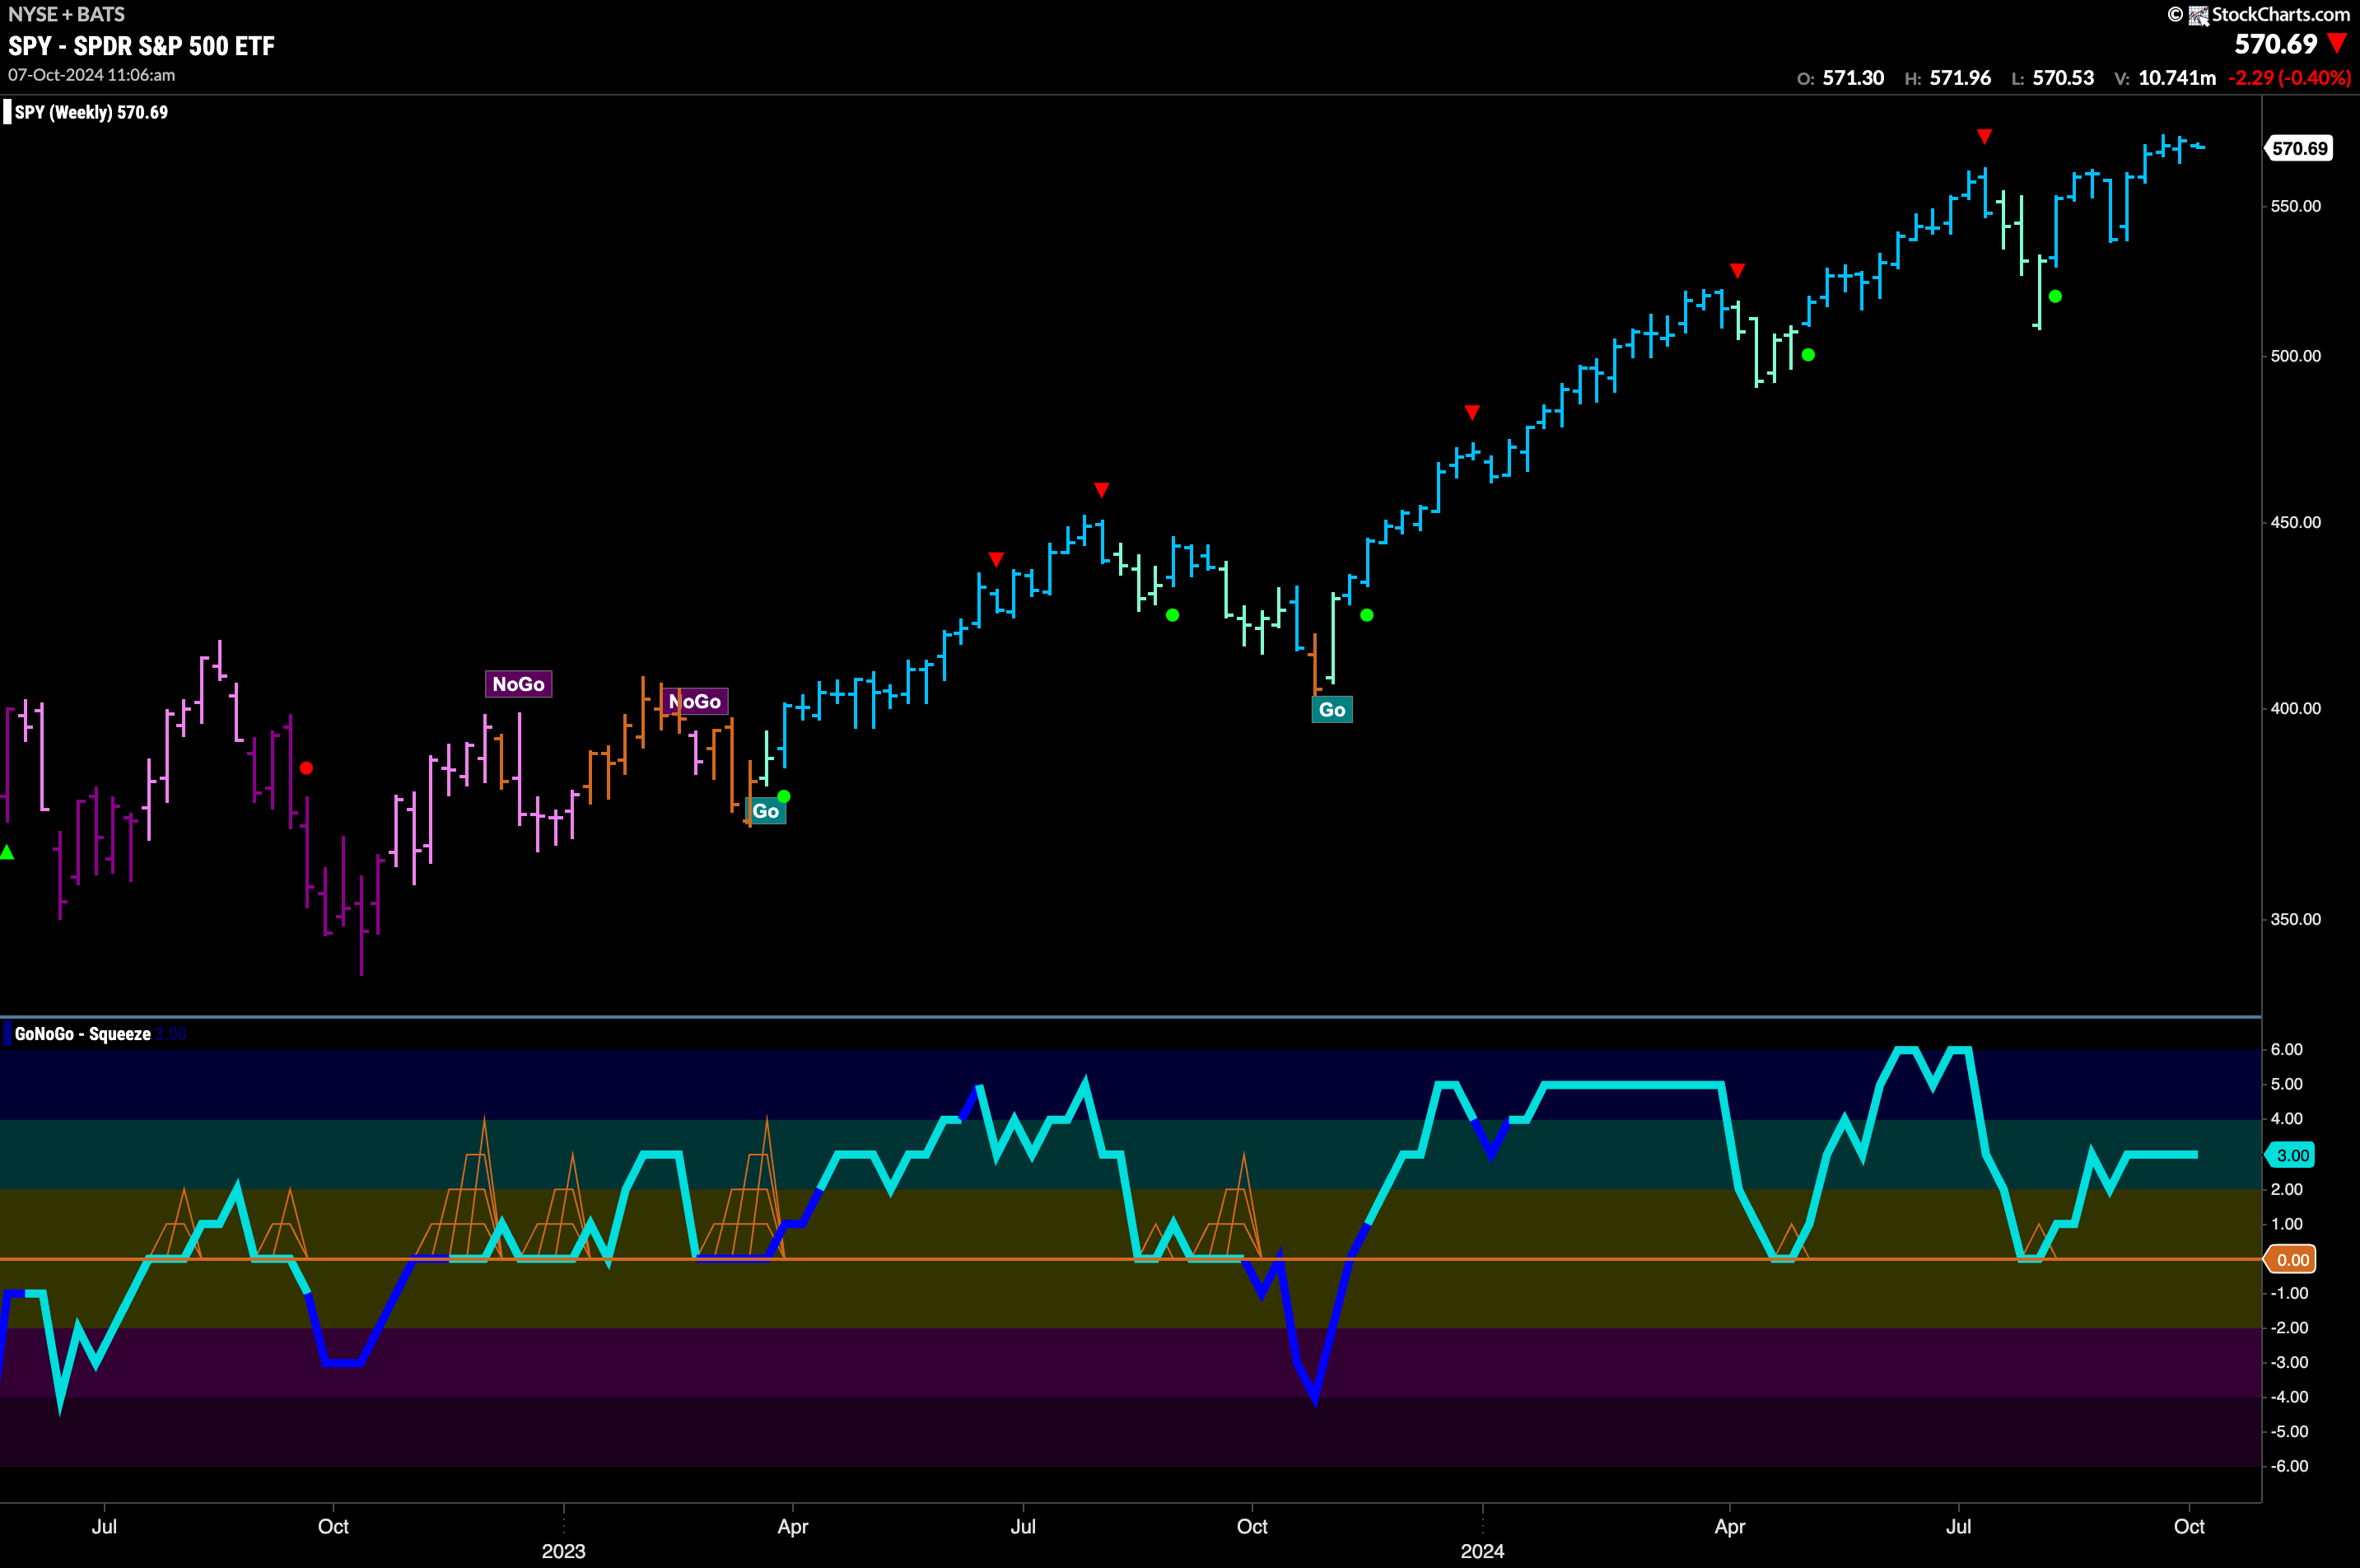
The longer time frame chart shows us that GoNoGo Trend painted another strong blue “Go” bar this past week and on a closing basis we made a new high. GoNoGo Oscillator shows that momentum is positive but not yet overbought. We will watch to see if momentum remains at or above the zero line as price challenges for more gains.
New “Go” Trend For Treasury Yields
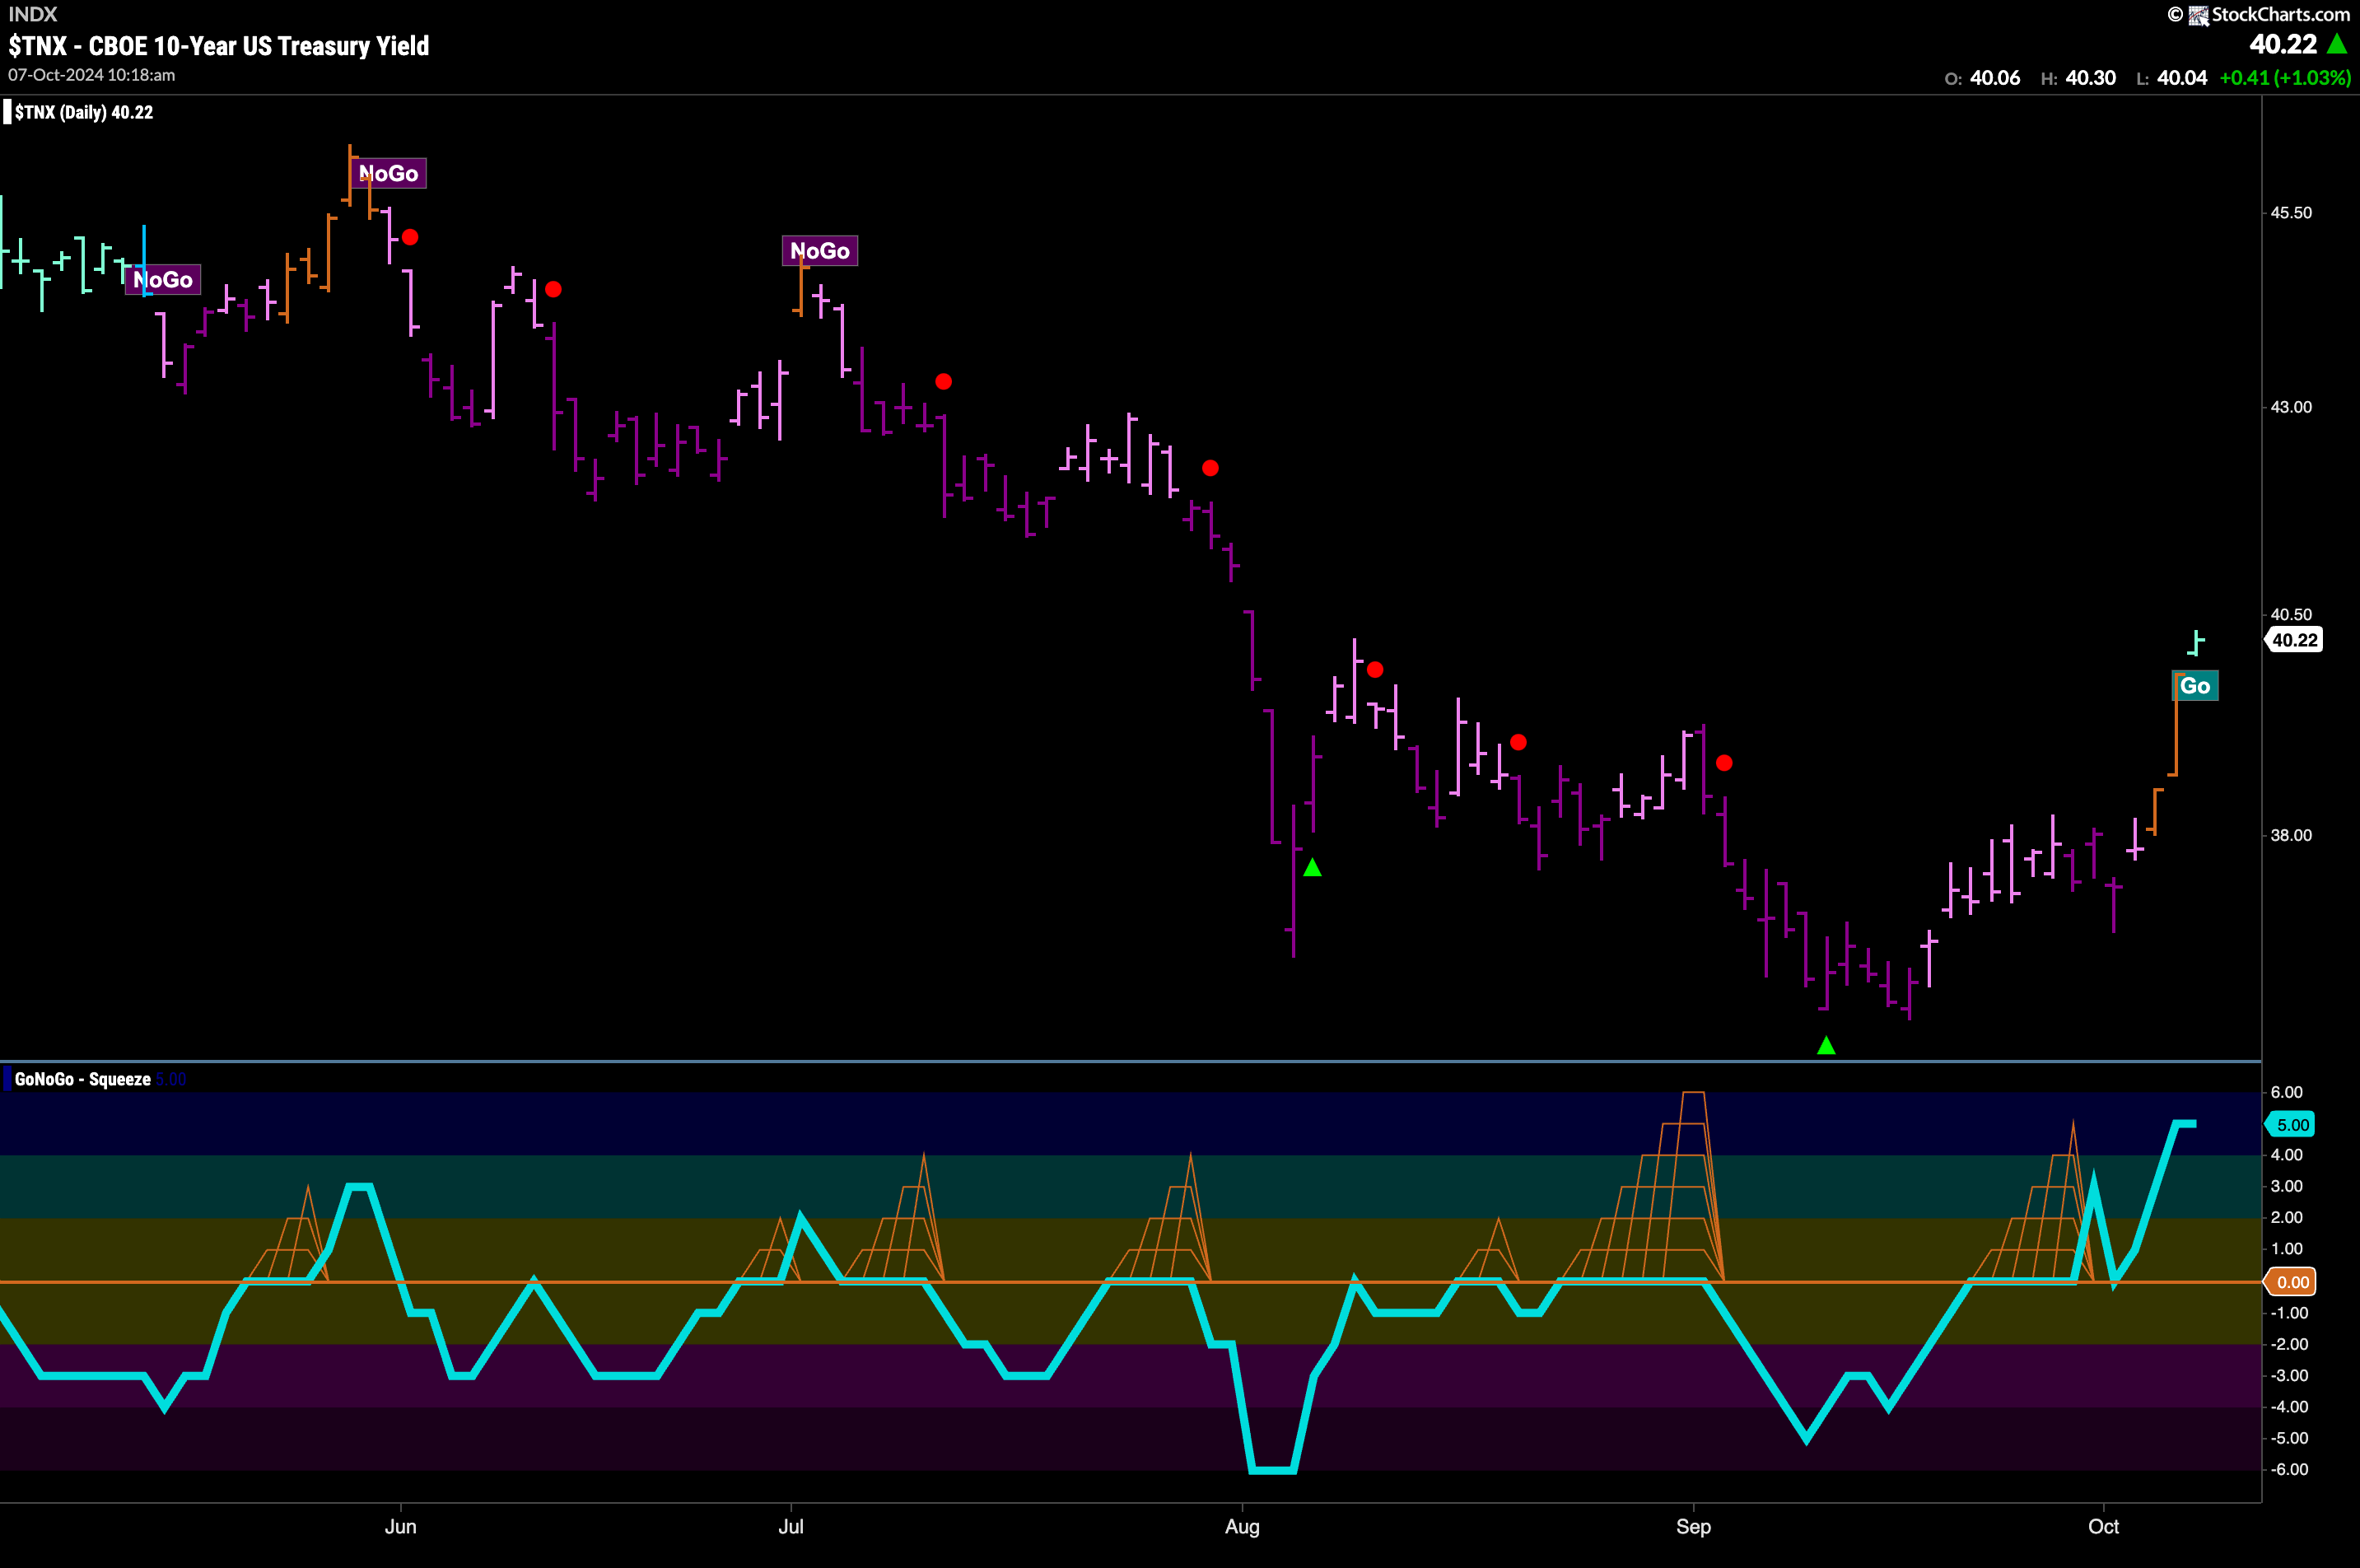
Treasury bond yields have climbed to new highs and we saw GoNoGo trend roll through the colors as a couple of amber “Go Fish” bars were followed by a first new “Go” bar for several months. GoNoGo Oscillator burst through the zero level last week and out of a GoNoGo Squeeze. Since then, it has retested and found support at zero and that tipped us off to the change in trend in the price panel above. We now see momentum at a value of 5 and so there is enthusiasm around this price move.
The Dollar Saw a “Go” Trend Emerge
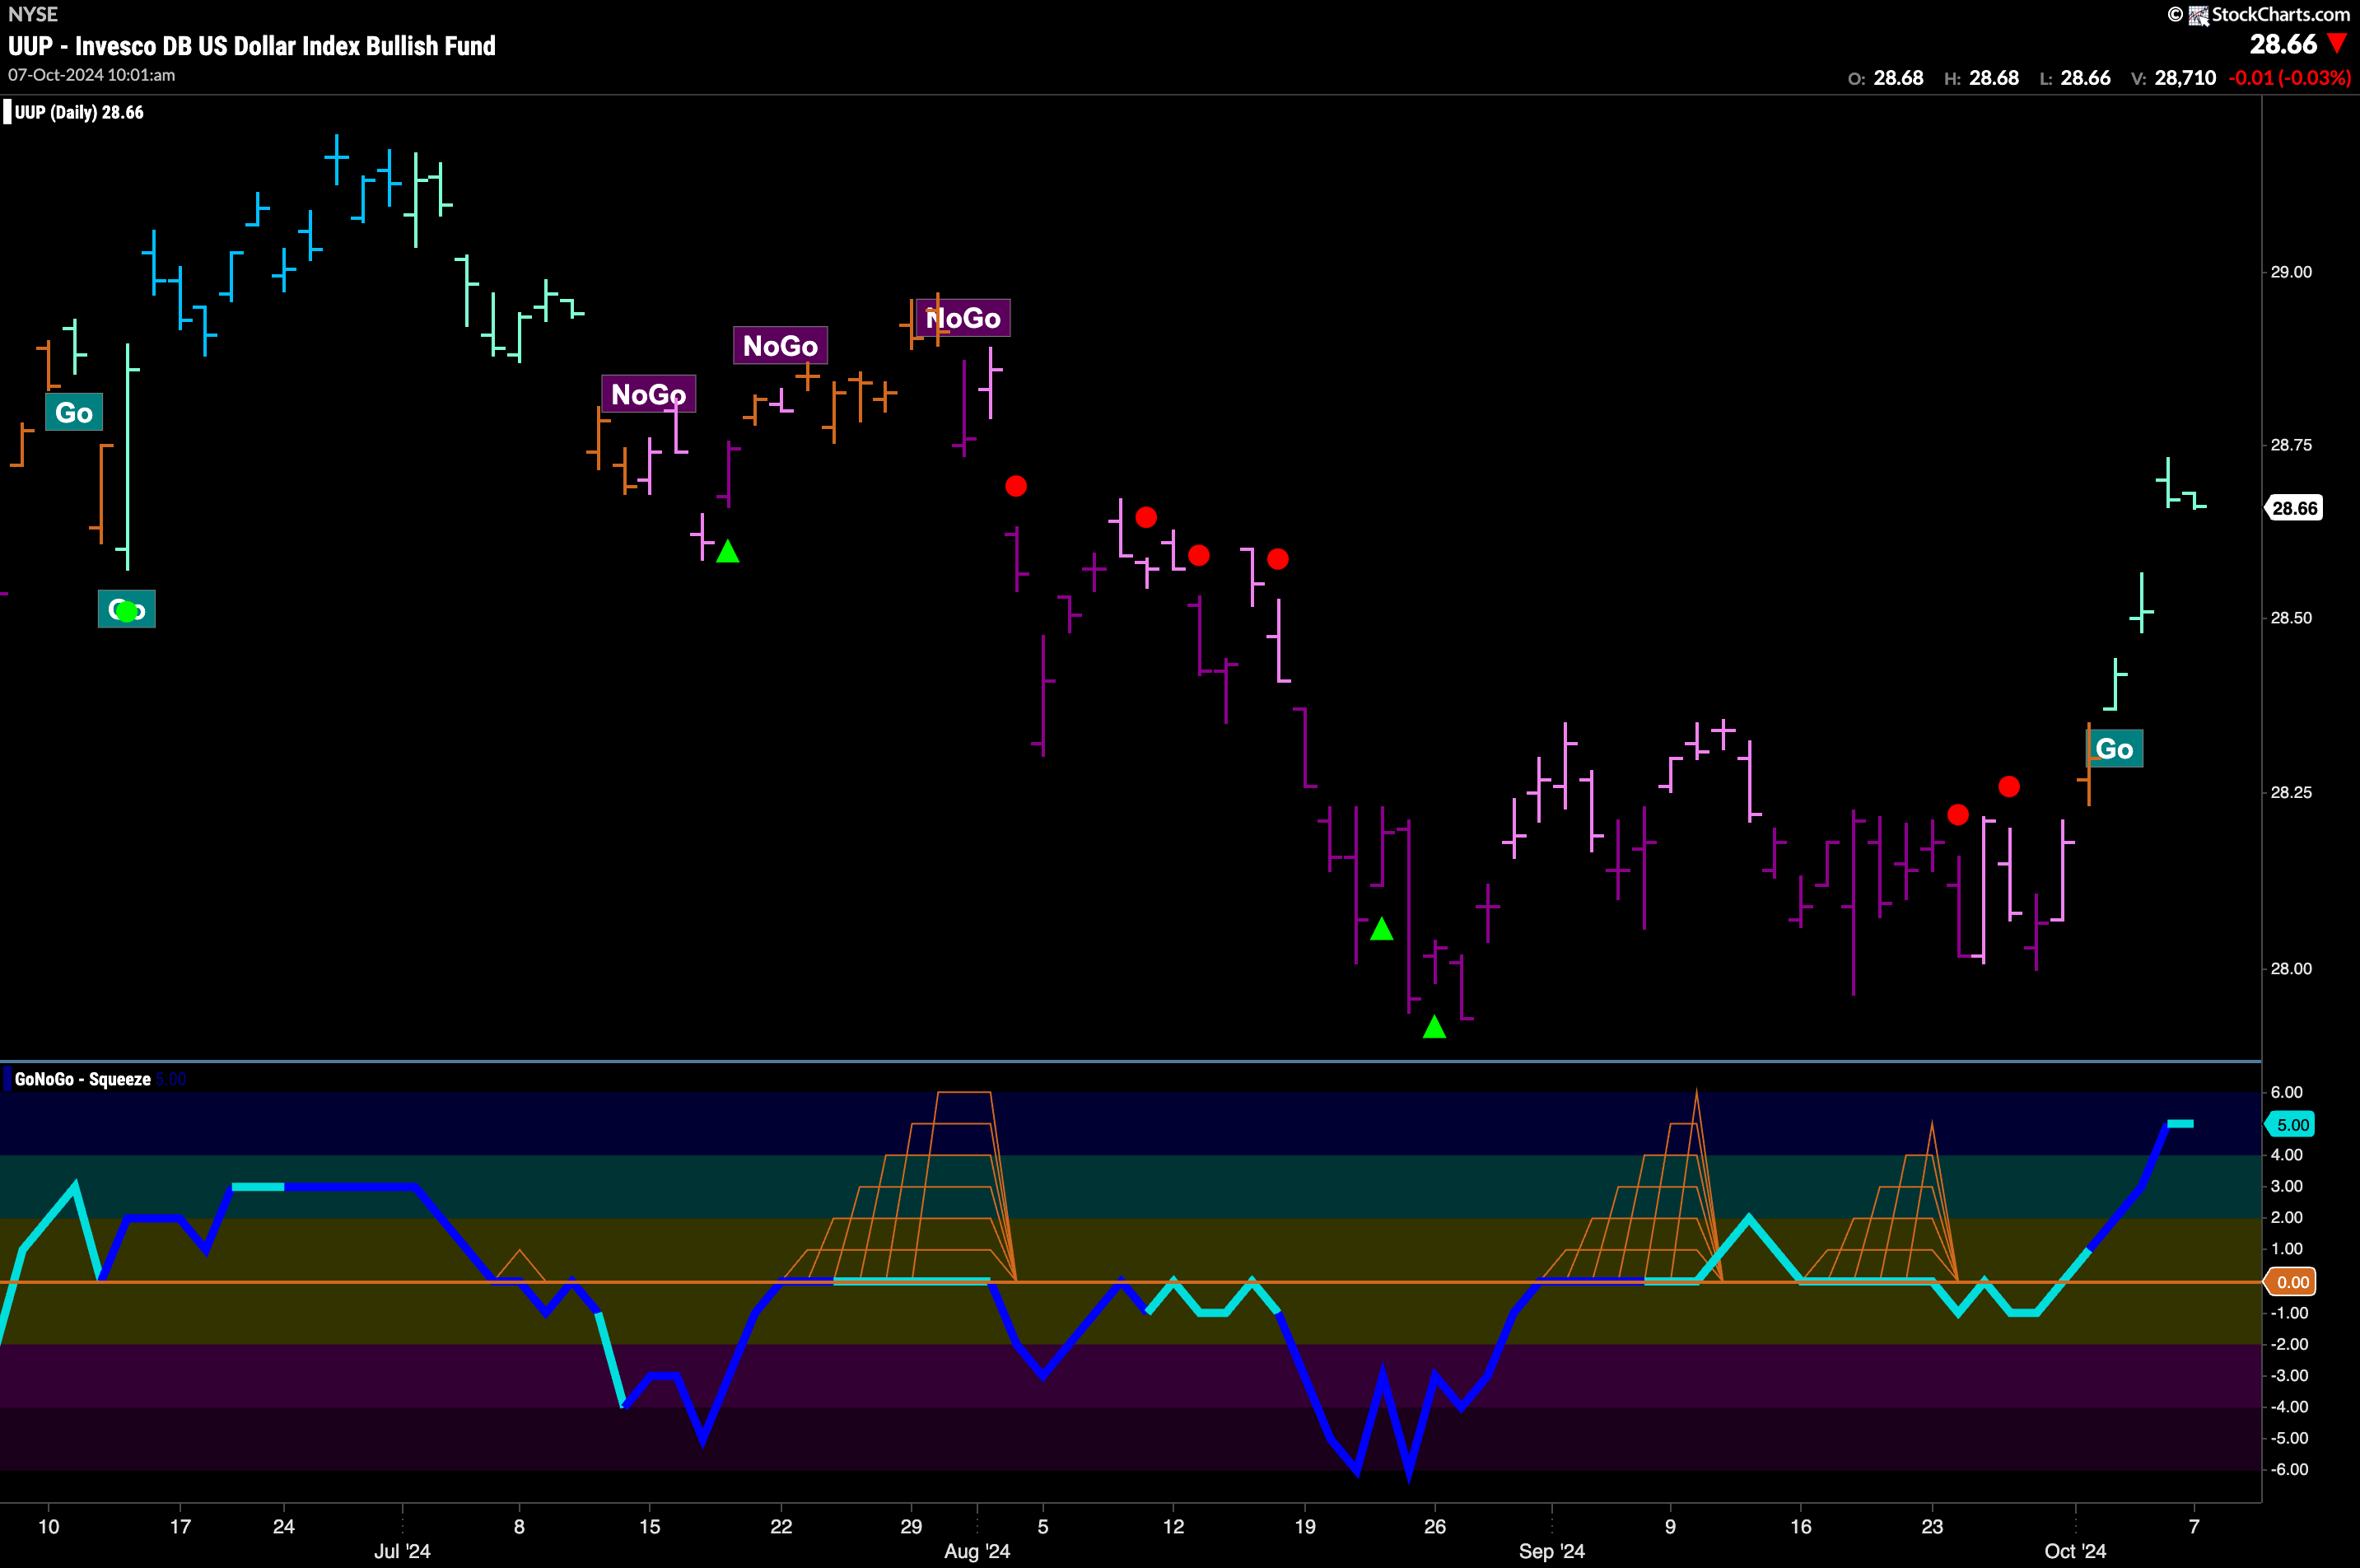
Price climbed quickly this week and followed an amber “Go Fish” bar with a string of aqua “Go” bars as price climbed to new highs. GoNoGo Oscillator having struggled with the zero level for several bars assertively broke through into positive territory and we saw an increase in volume as the oscillator rose to a value of 5. Now we can say that momentum is on the side of the new “Go” trend as it tries to consolidate at these new levels.
USO Rallies and We See Several “Go Fish” Bars
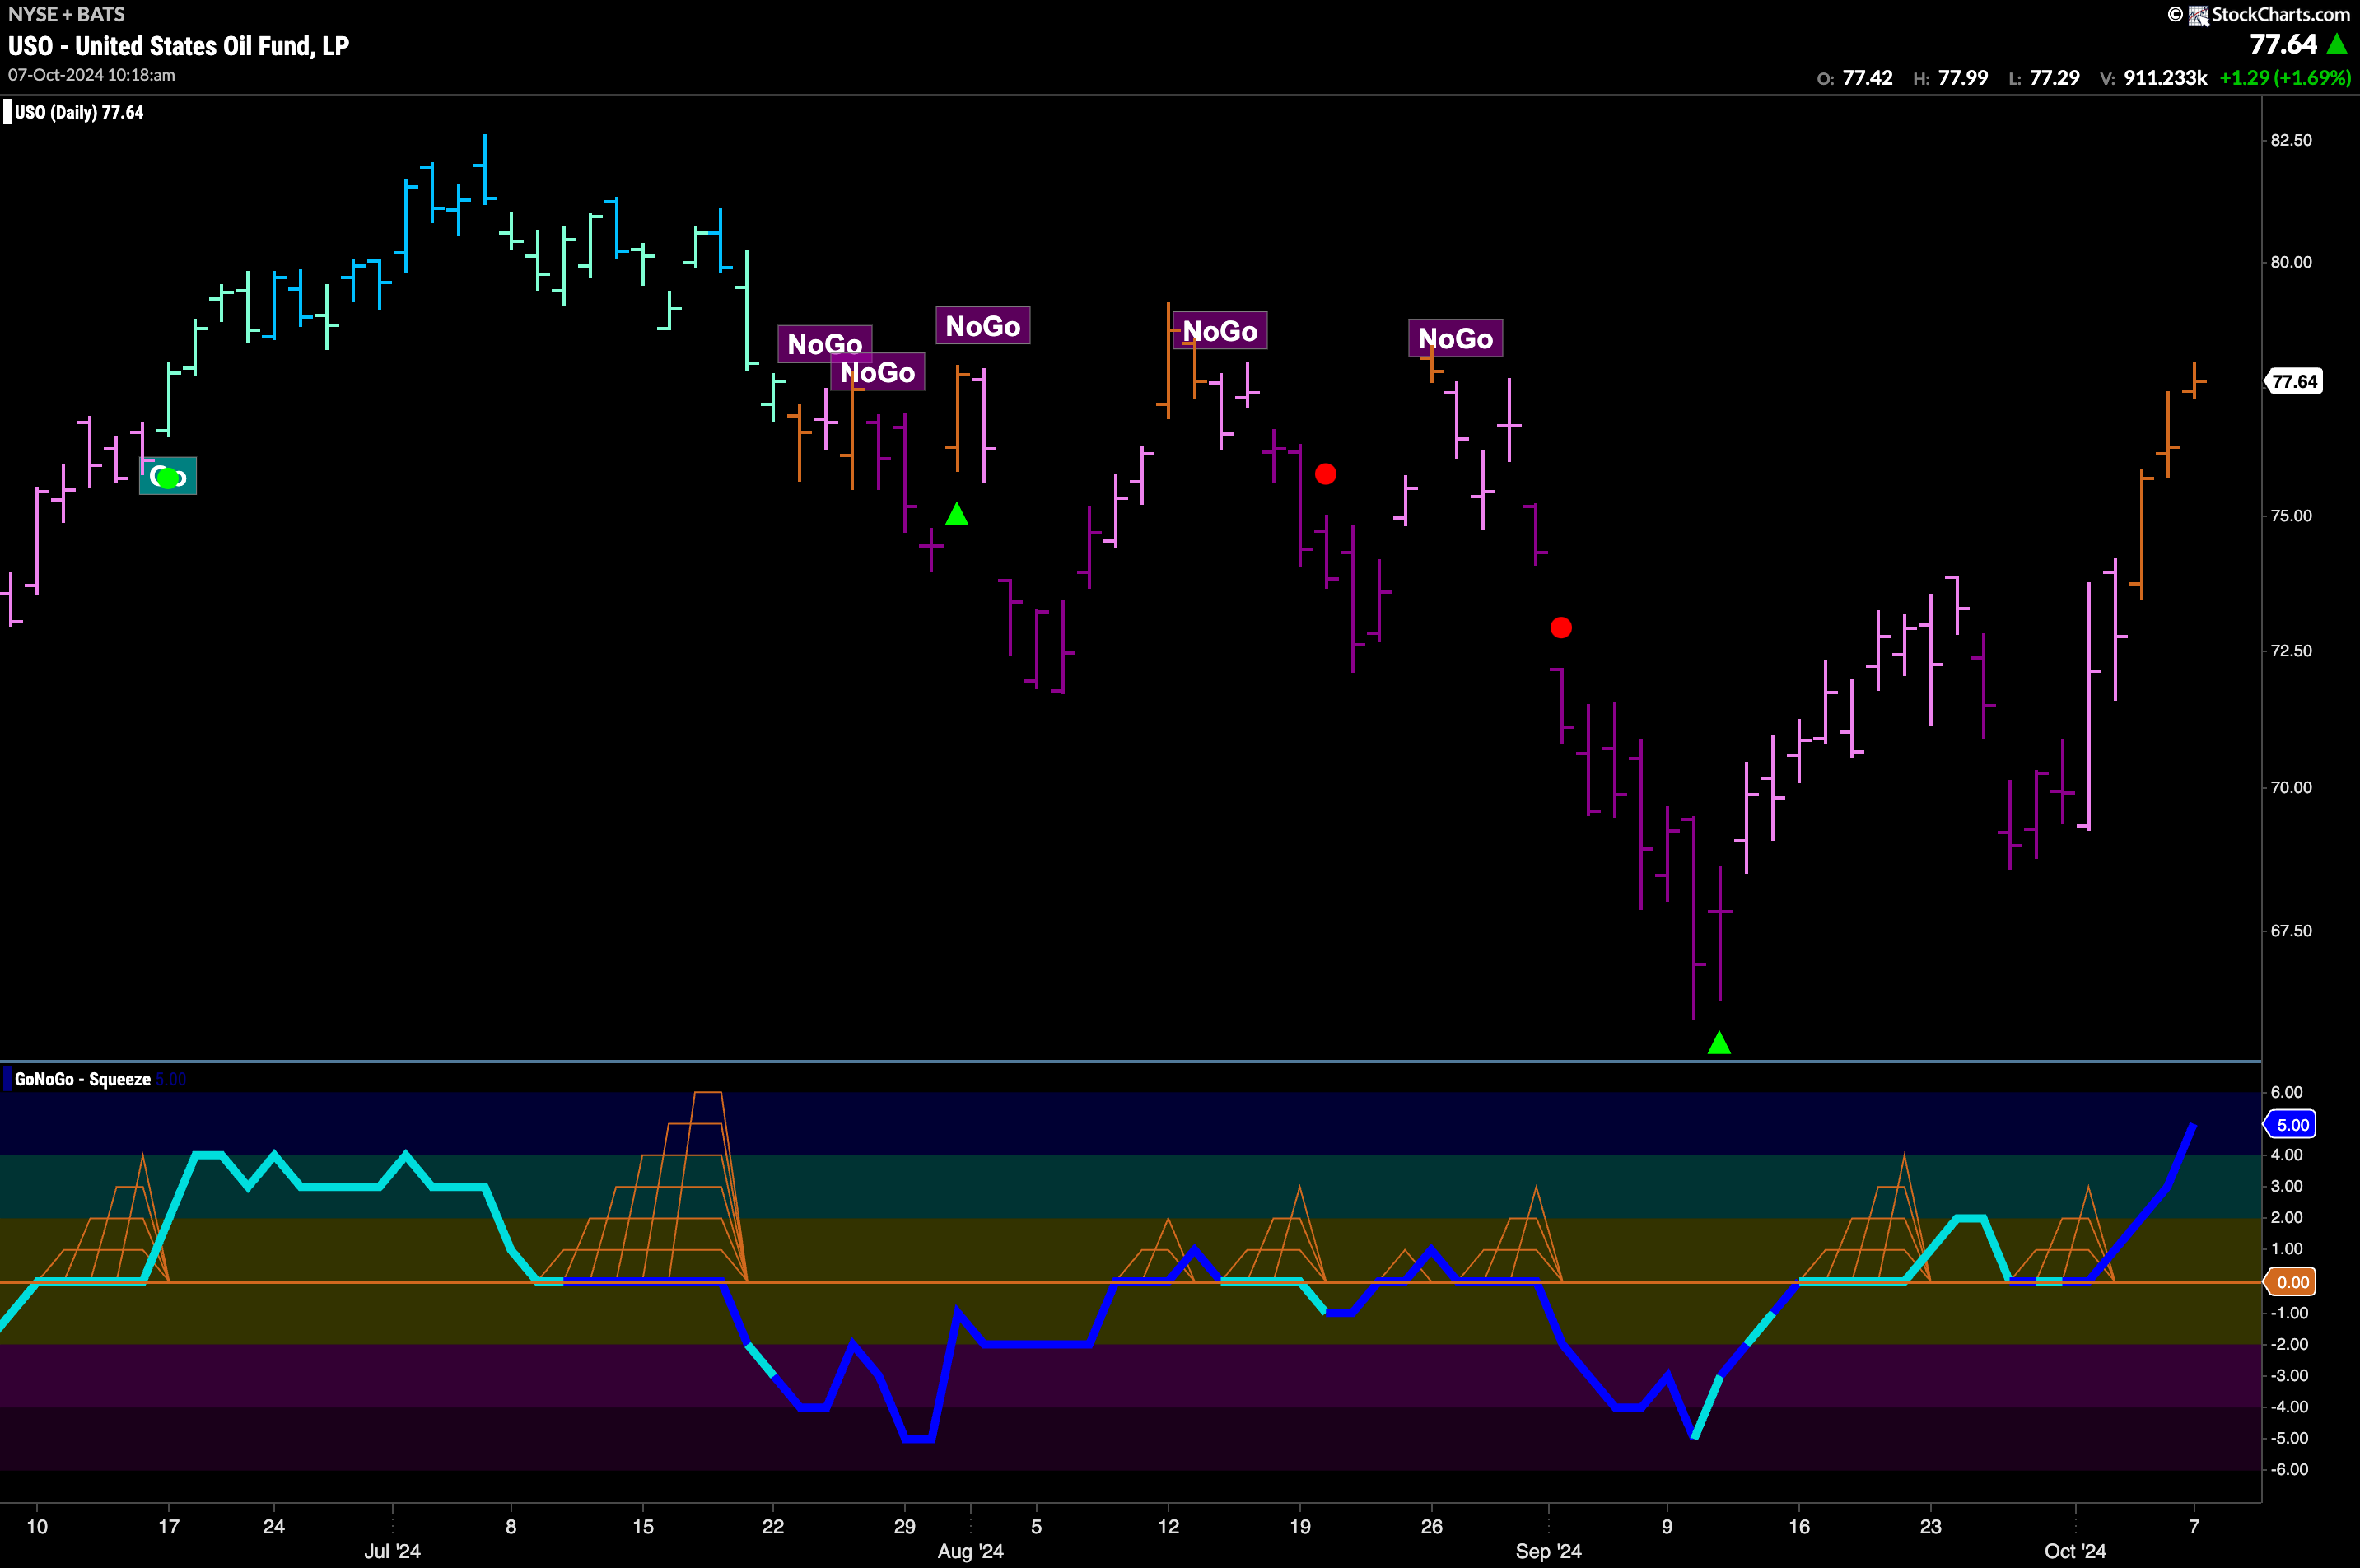
$USO rallied from a new higher low this past week and GoNoGo Trend saw the “NoGo” give way to amber “Go Fish” bars. Prior to this trend change we saw GoNoGo Oscillator manage to break above the zero level and then find support there. Now, with increased volume (darker blue color of oscillator) we see that momentum is rising and at a value of 5.
Gold Prices Remain Elevated
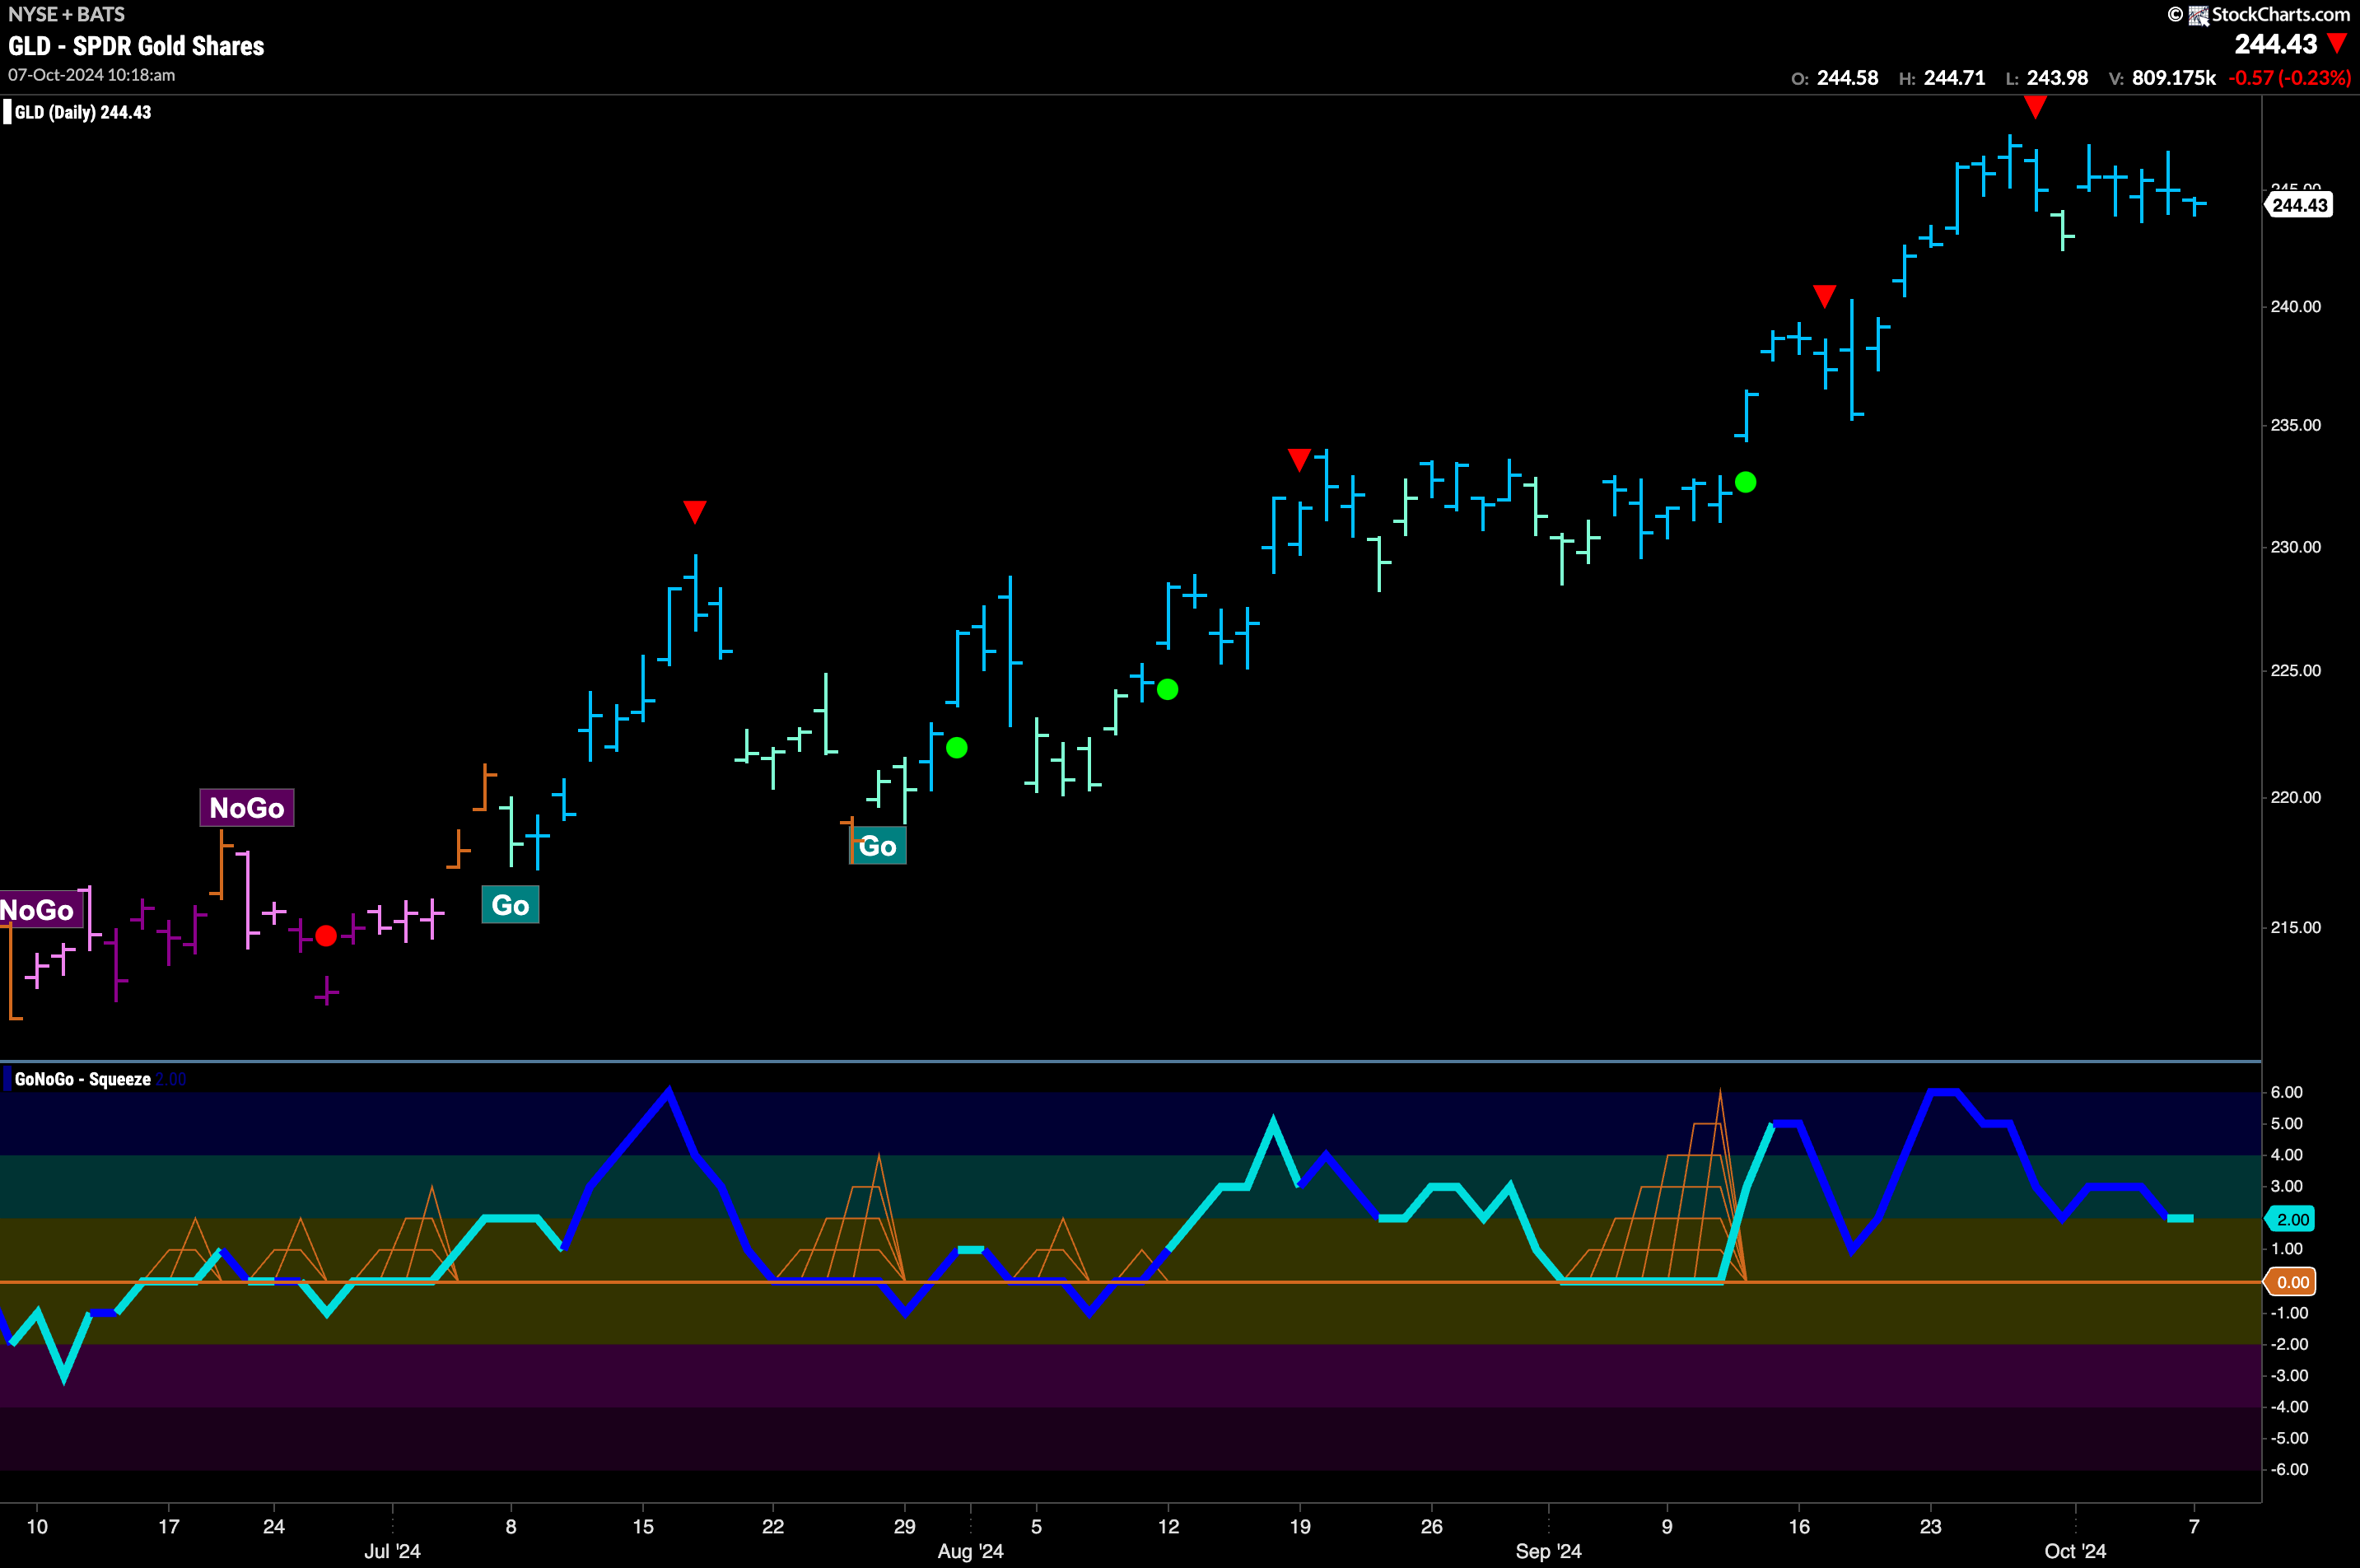
GoNoGo Trend painted a string of strong blue “Go” bars this week even as price was unable to move to new highs. Since the Go Countertrend Correction Icon (red arrow) price has moved mostly sideways. GoNoGo Oscillator has fallen and is now still positive but resting at a value of 2. We will watch for support at zero if it falls further. GoNoGo Oscillator will need to stay positive for price to take a run at new higher highs.
Sector RelMap
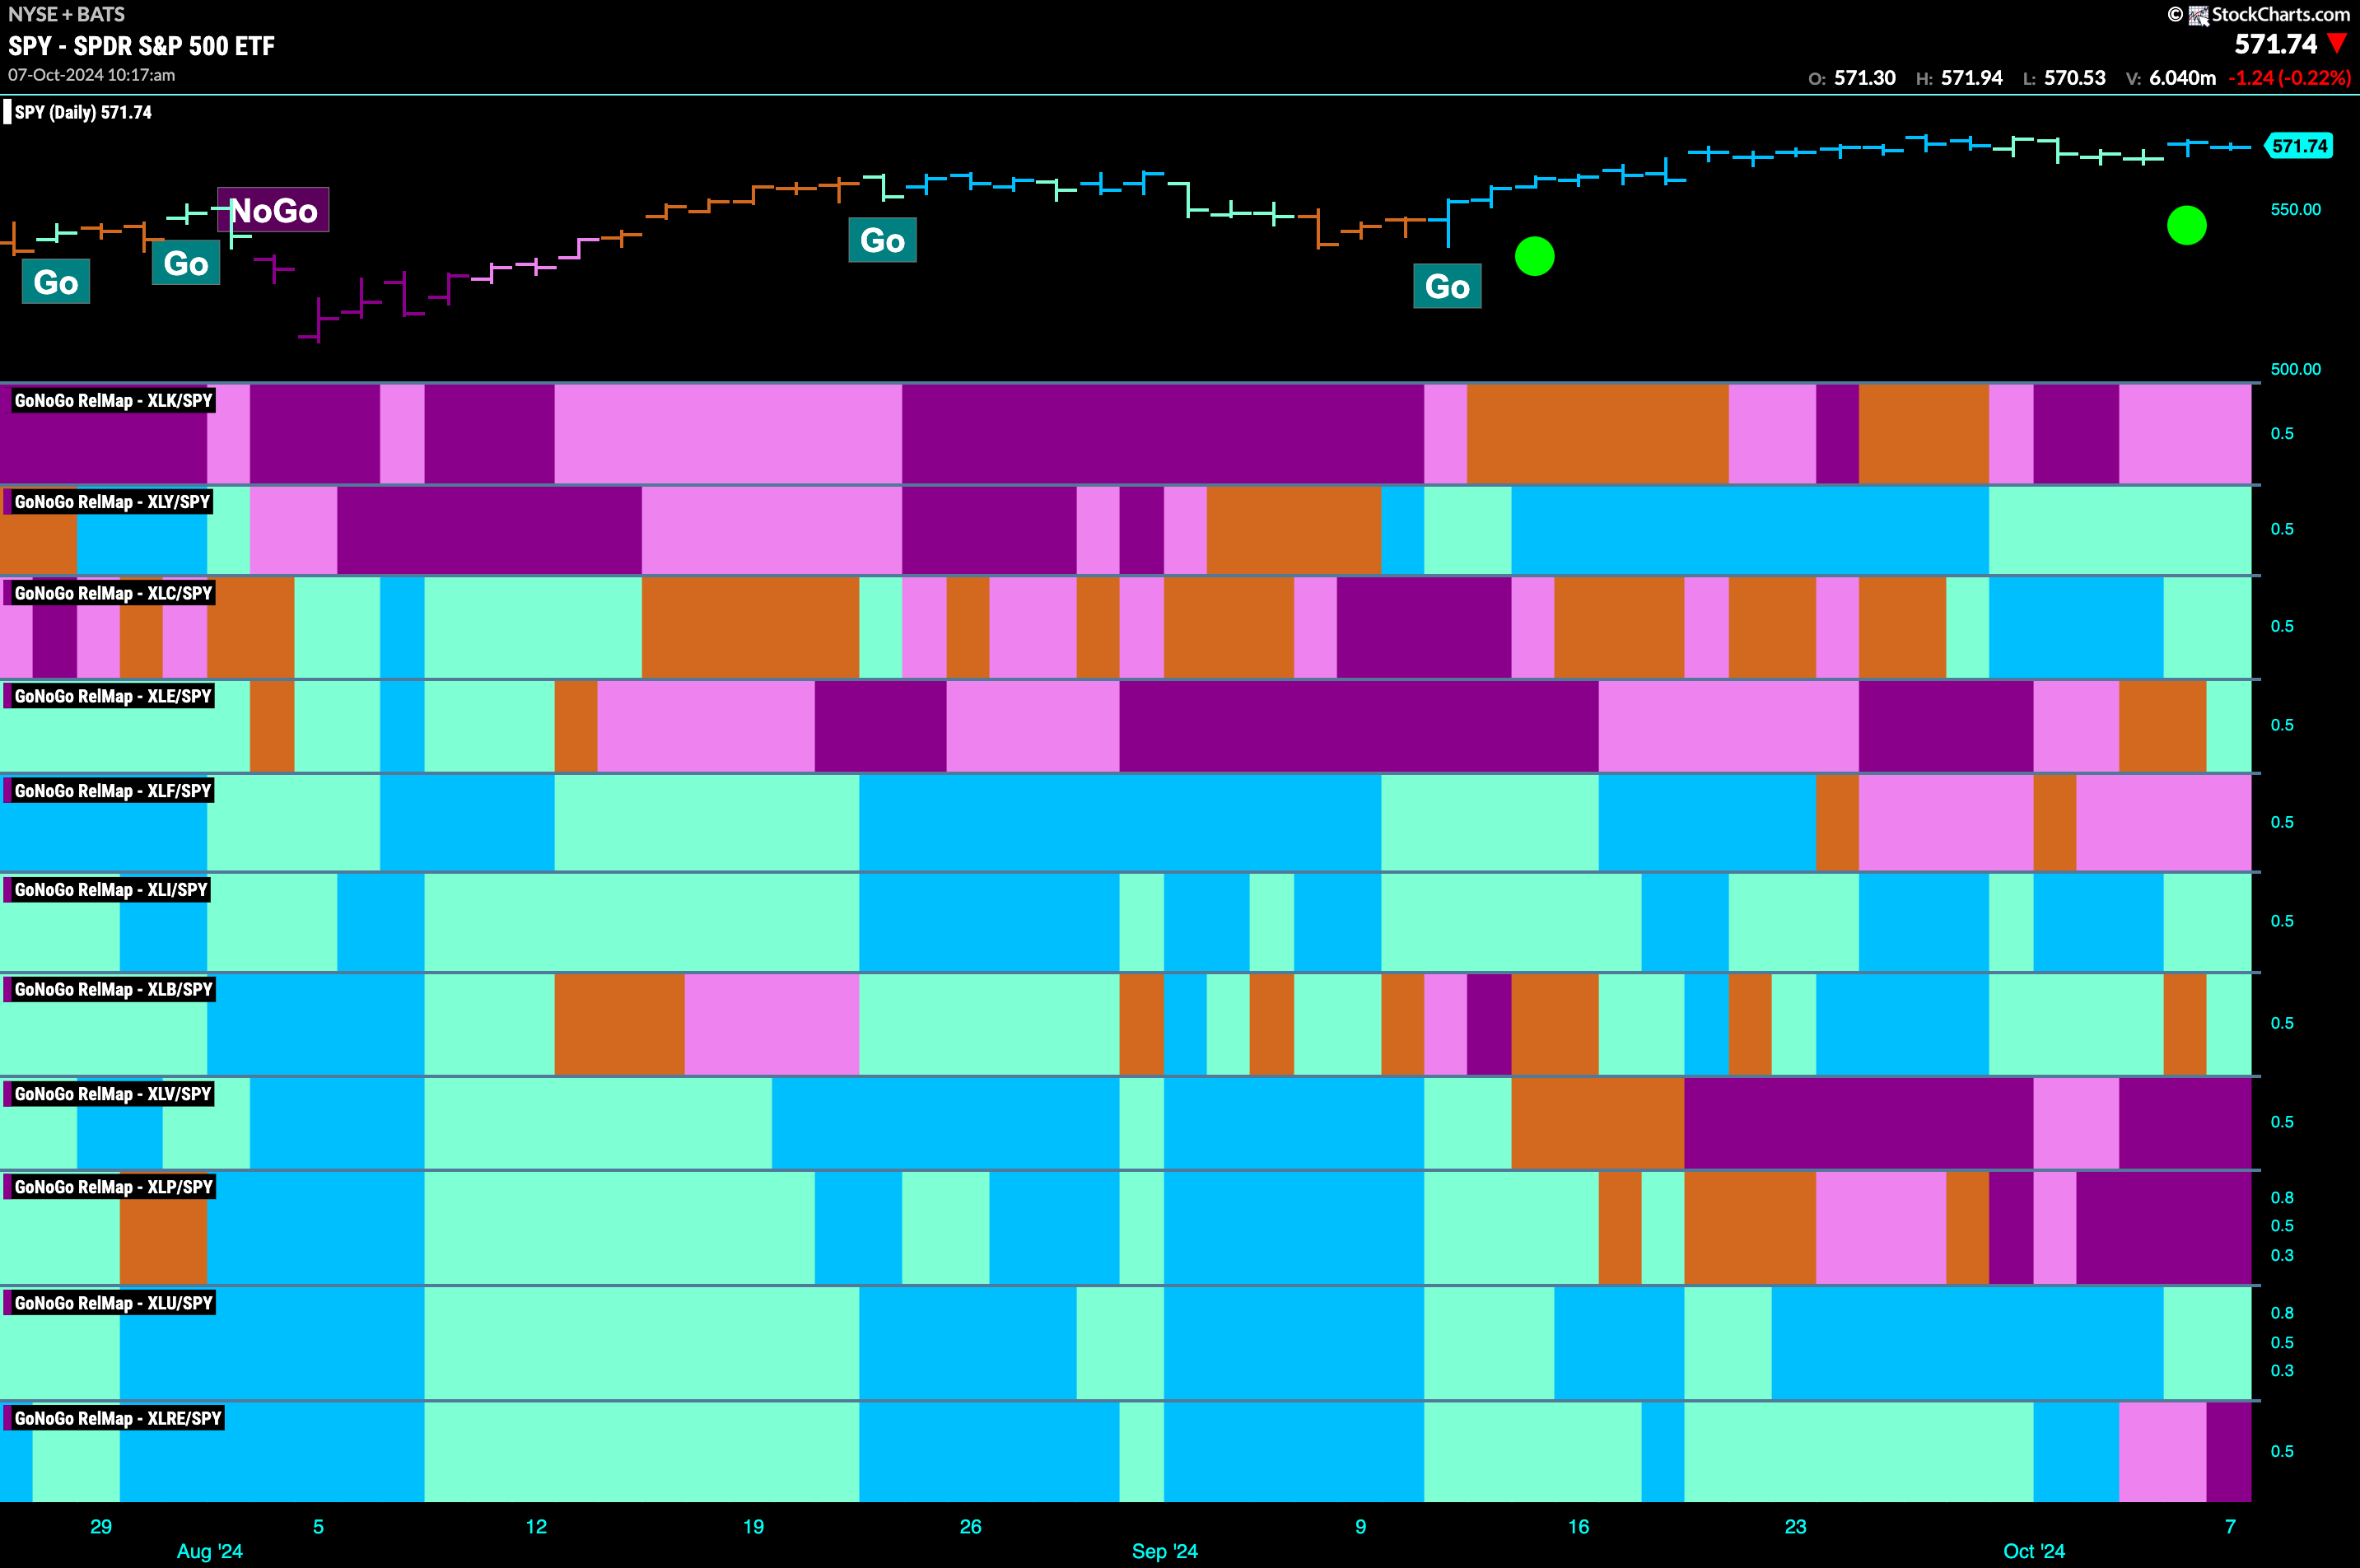
Below is the GoNoGo Sector RelMap. This GoNoGo RelMap applies the GoNoGo Trend to the relative strength ratios of the sectors to the base index. With this view we can get a sense of the relative out performance and relative underperformance of the sectors. 6 sectors are in relative “Go” trends. $XLY, $XLC, $XLE, $XLI, $XLB, $XLU are painting relative “Go” bars.
Energy Sub-Group RelMap
The chart below shows a relative trend breakdown of the sub groups within the energy sector. The Sub-Group RelMap plots the GoNoGo Trend of each sub index to the $XLE. We saw in the above GoNoGo Sector RelMap that $XLE is a new out-performer, with GoNoGo Trend starting to paint aqua “Go” bars. If we look at the breakdown of the groups in the map below we can see where that outperformance is coming from. Painting strong blue “Go” bars in the top panel, the integrated oil and gas index is strongly out-performing. 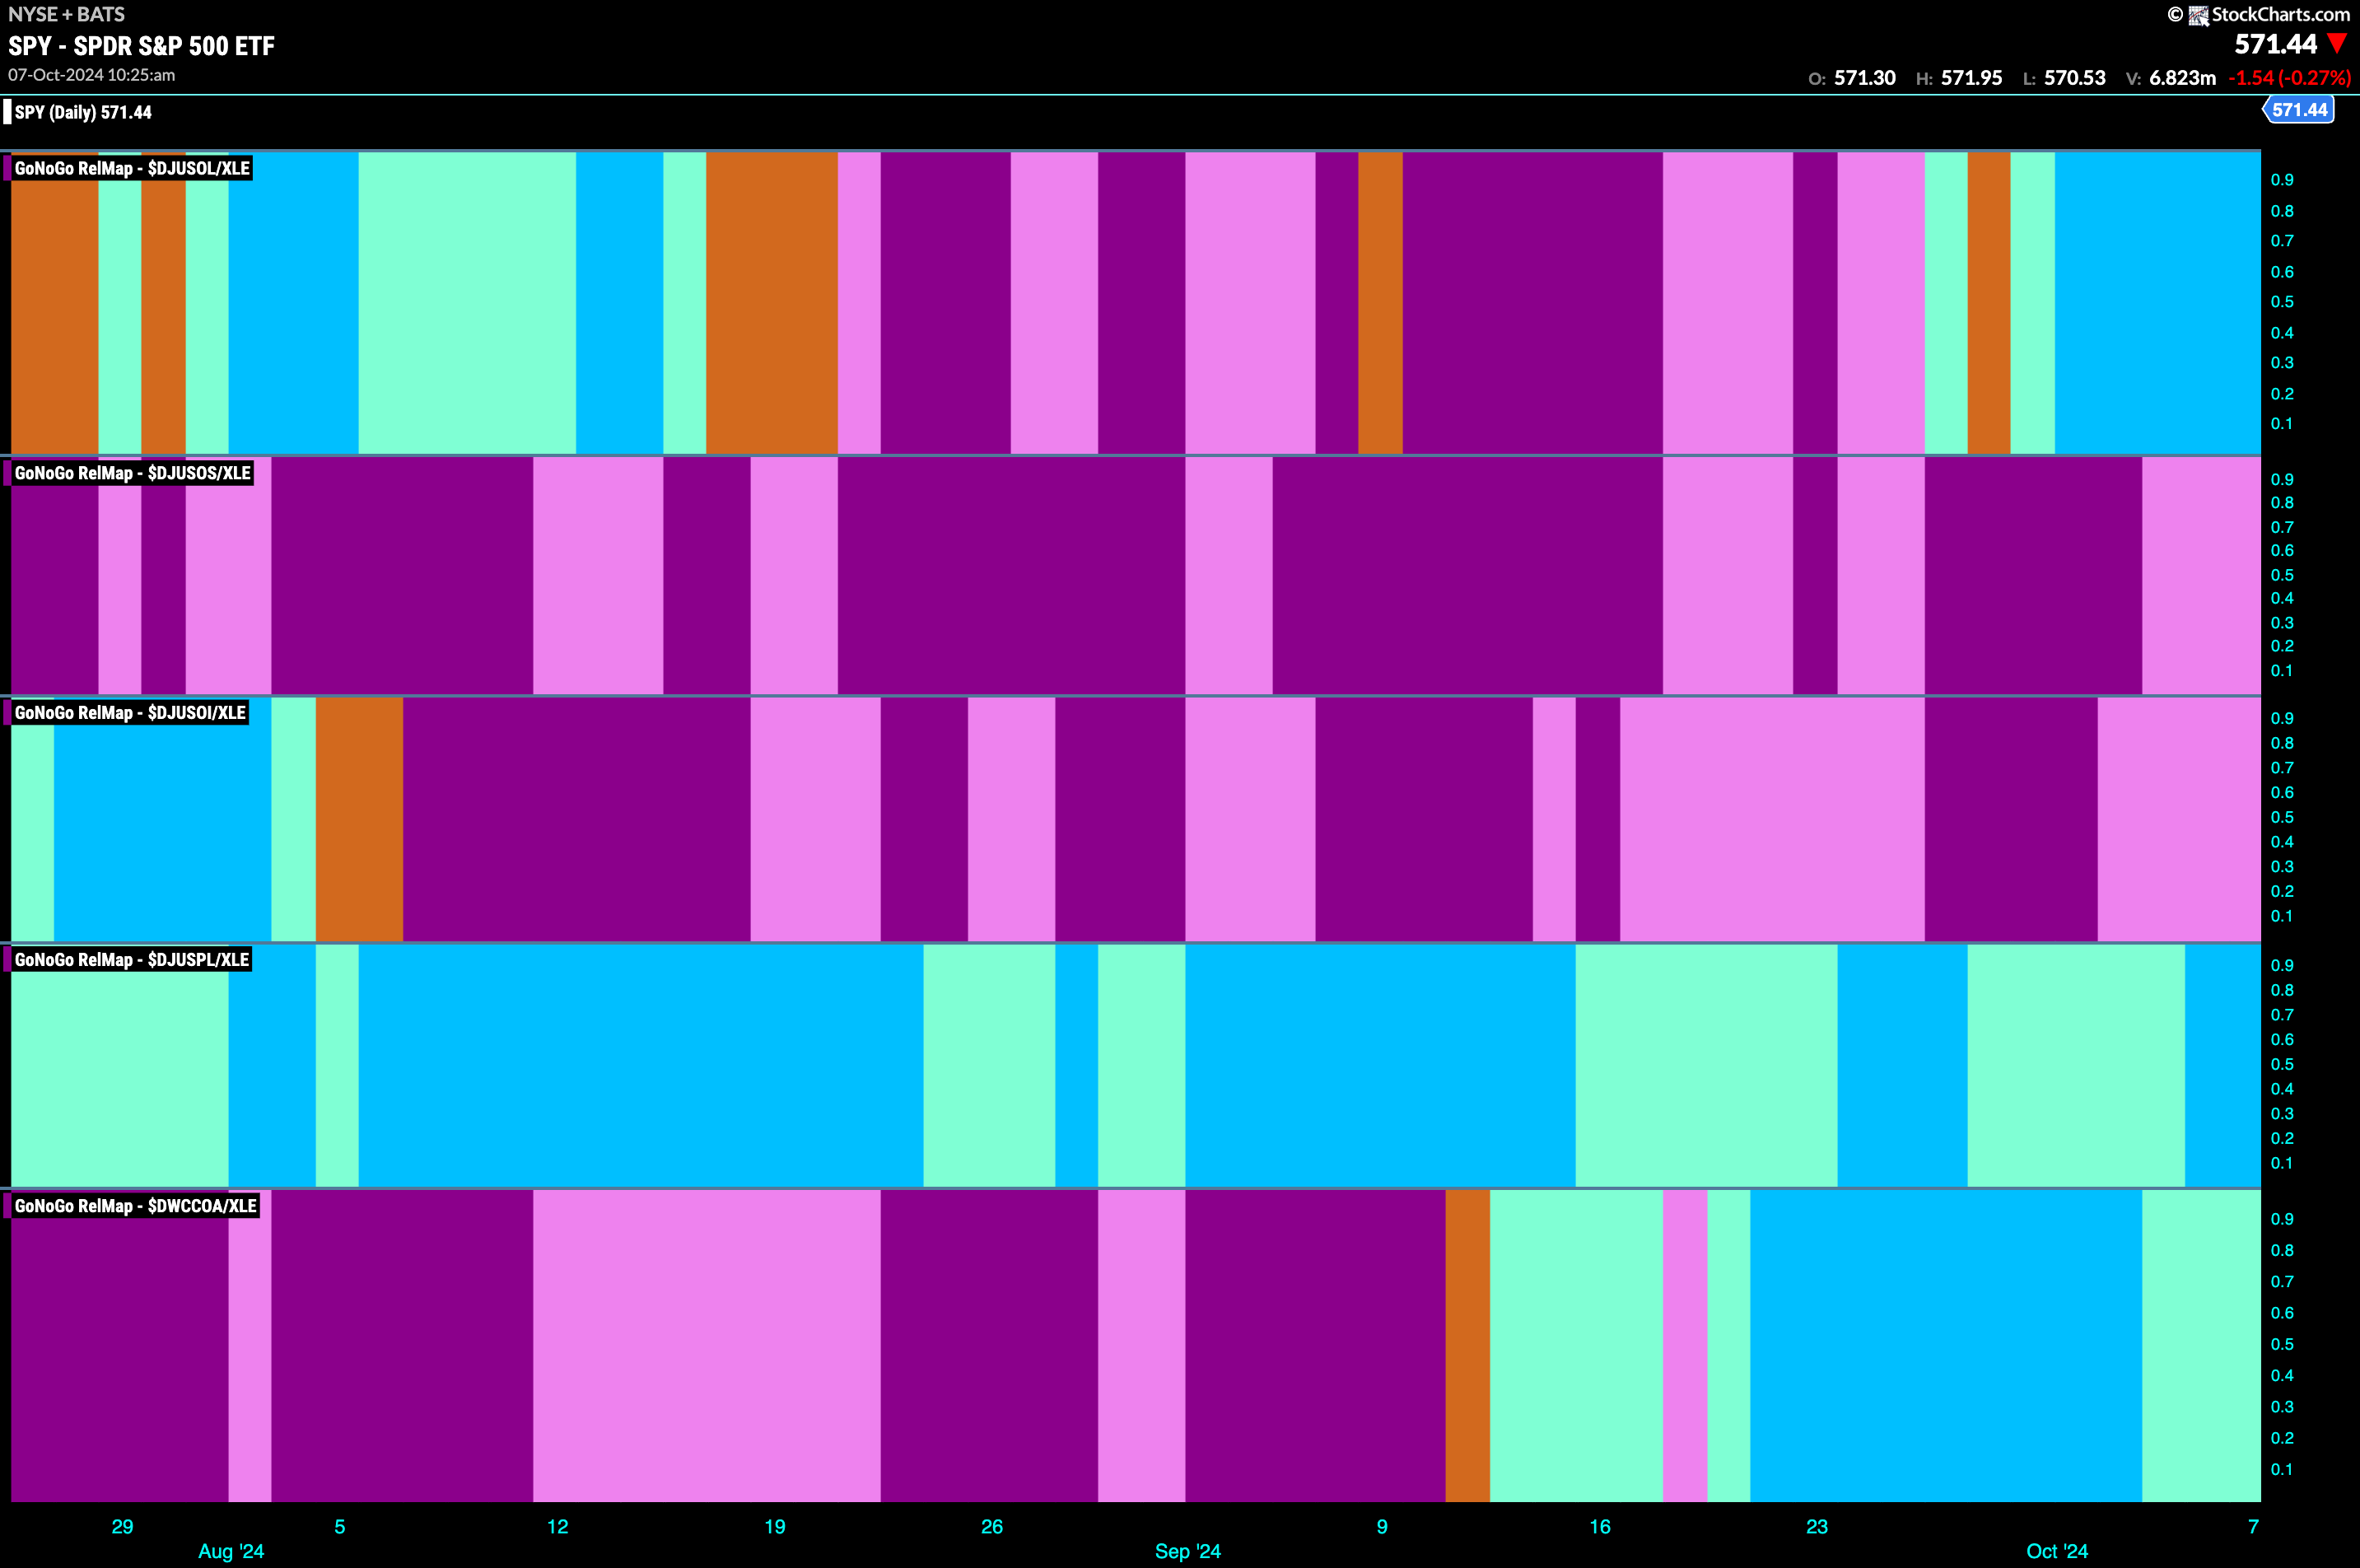
$XOM Breaks Higher on Strong Weekly “Go” Bars
The chart below shows the full suite of GoNoGo tools using weekly bars for $XOM. We can see that we have been in a period of sideways movement for several months. GoNoGo Trend has been able to maintain “Go” bars throughout and GoNoGo Oscillator has been able to primarily stay at of above the zero level. We now see price at new highs on strong blue bars and momentum resurgent in the direction of this “Go” trend.

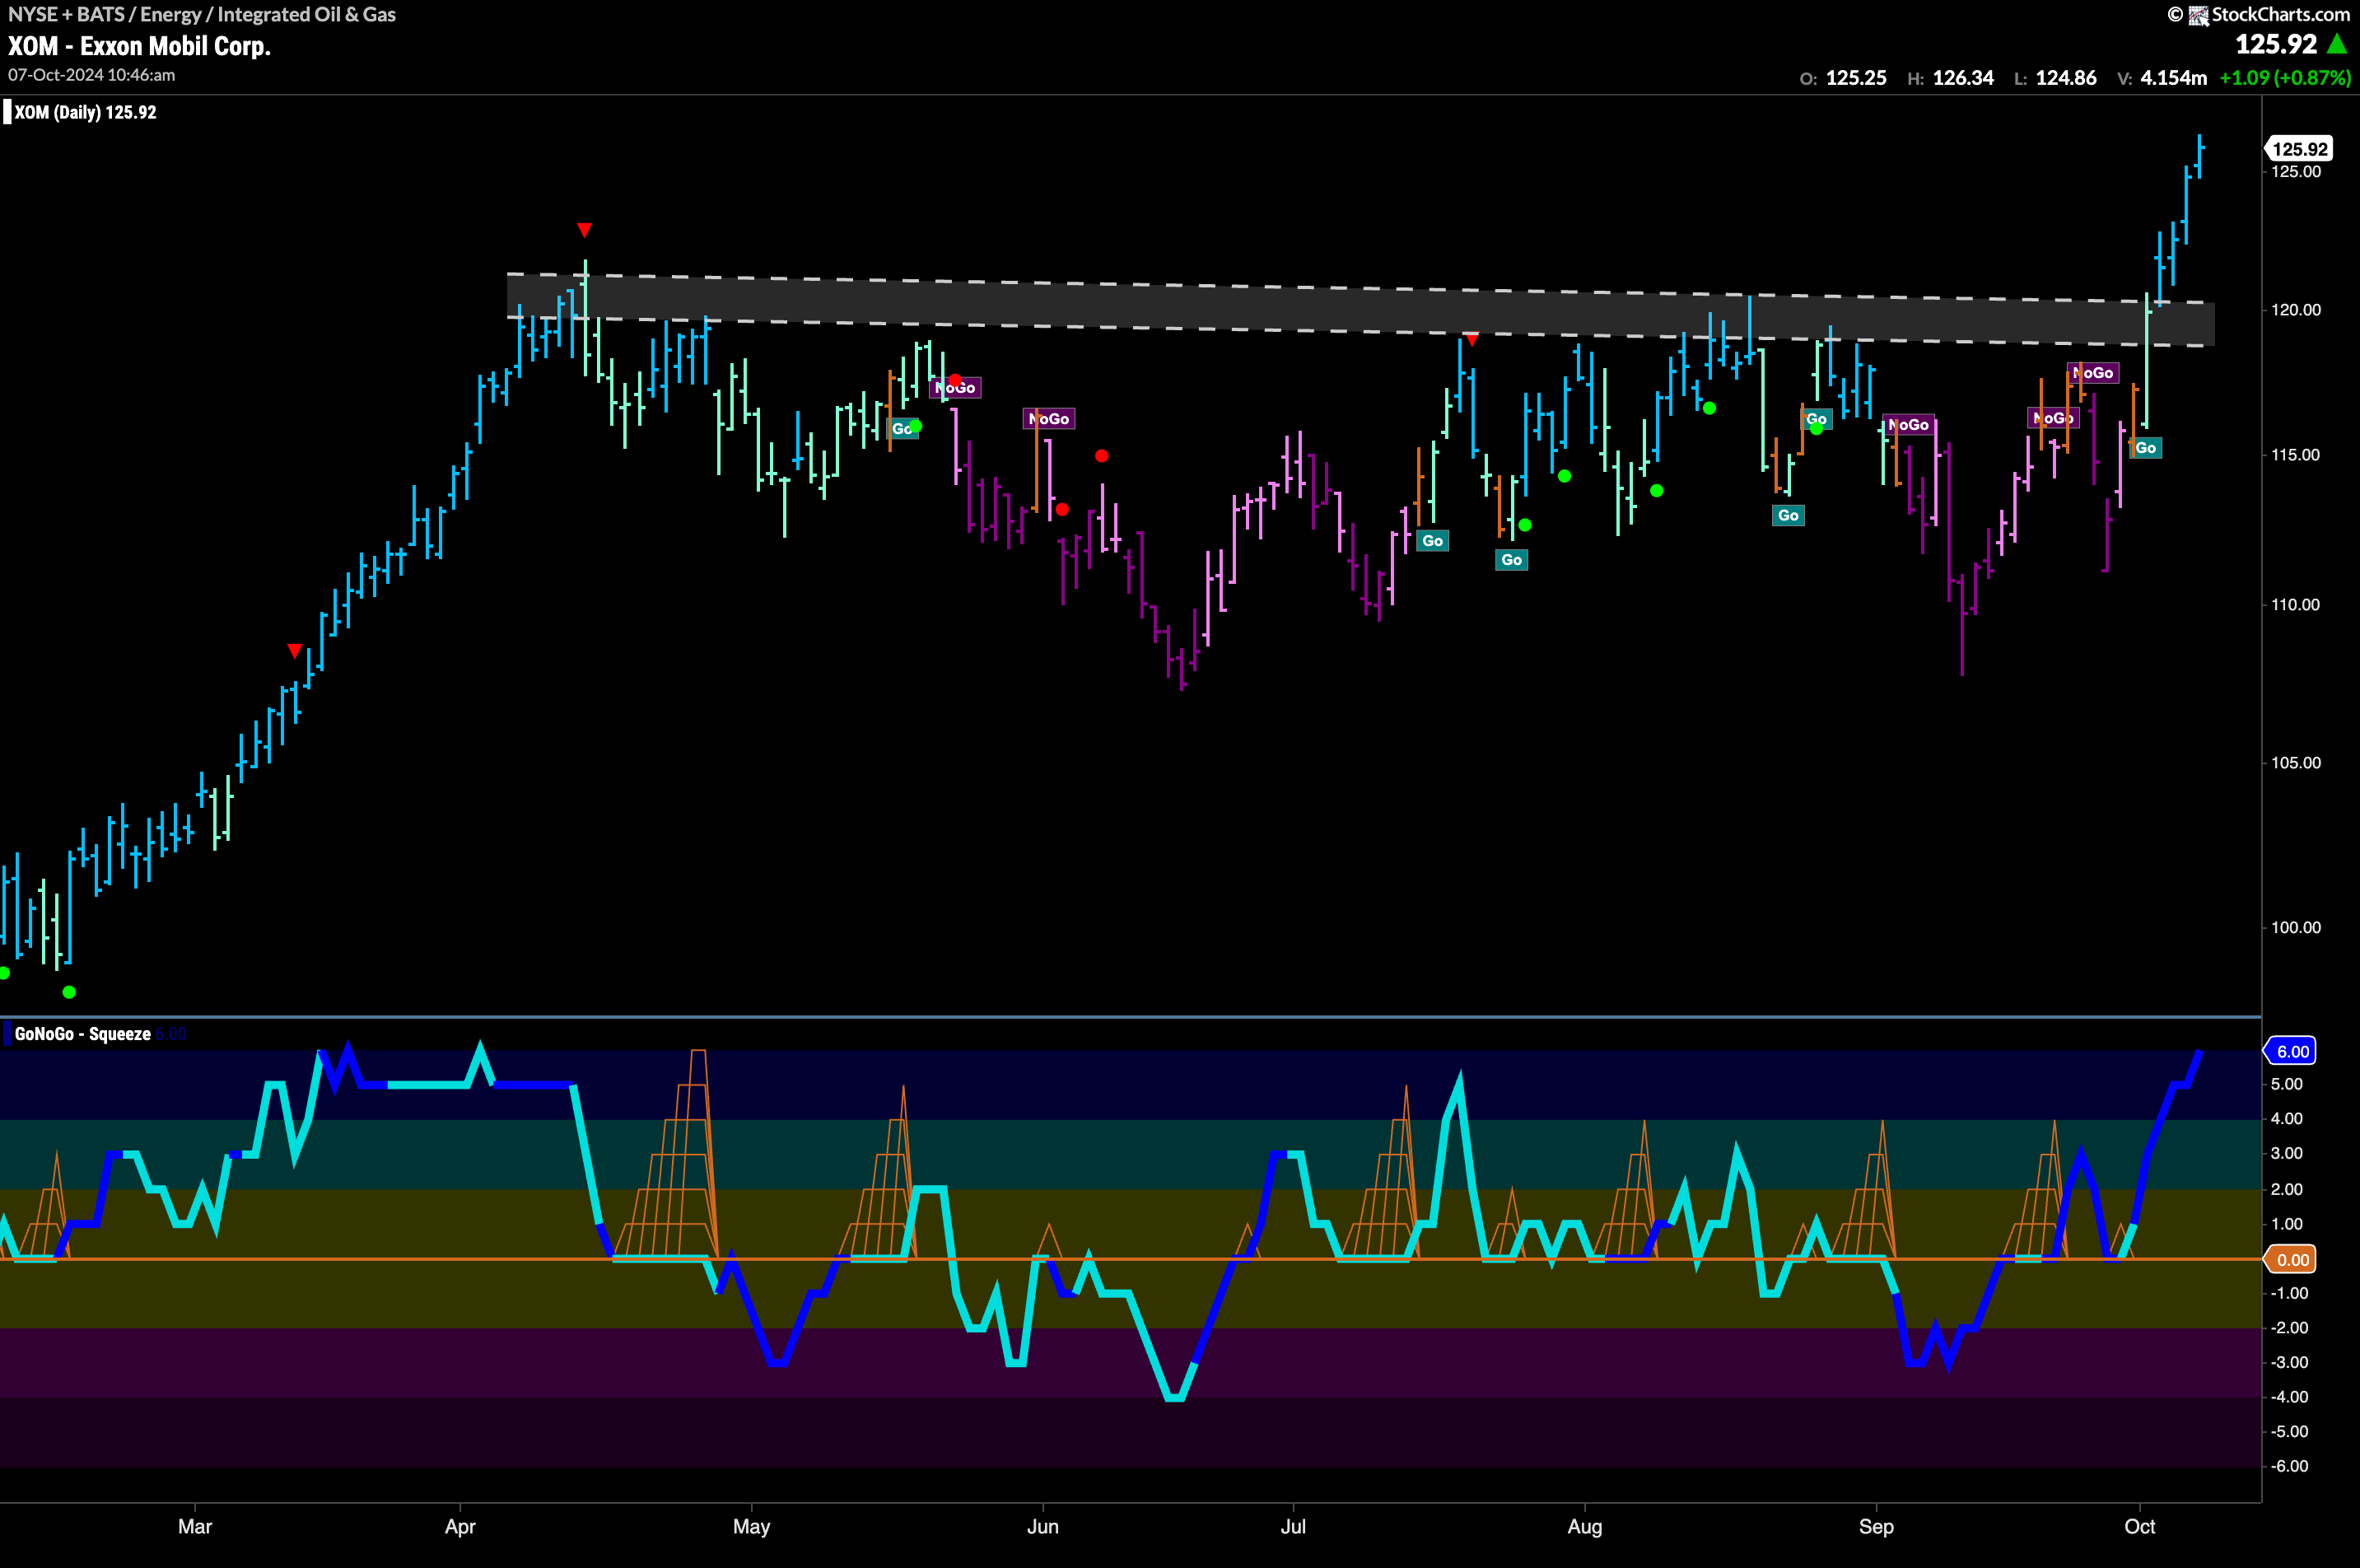
On the daily chart below, we can see just how significant the resistance is that has been broken. For months, and several attempts, price has failed to move higher. However, this last time, we see that the oscillator reflected increased volume as price rallied to test that level. Now we see momentum at an overbought extreme as price soars to new highs.
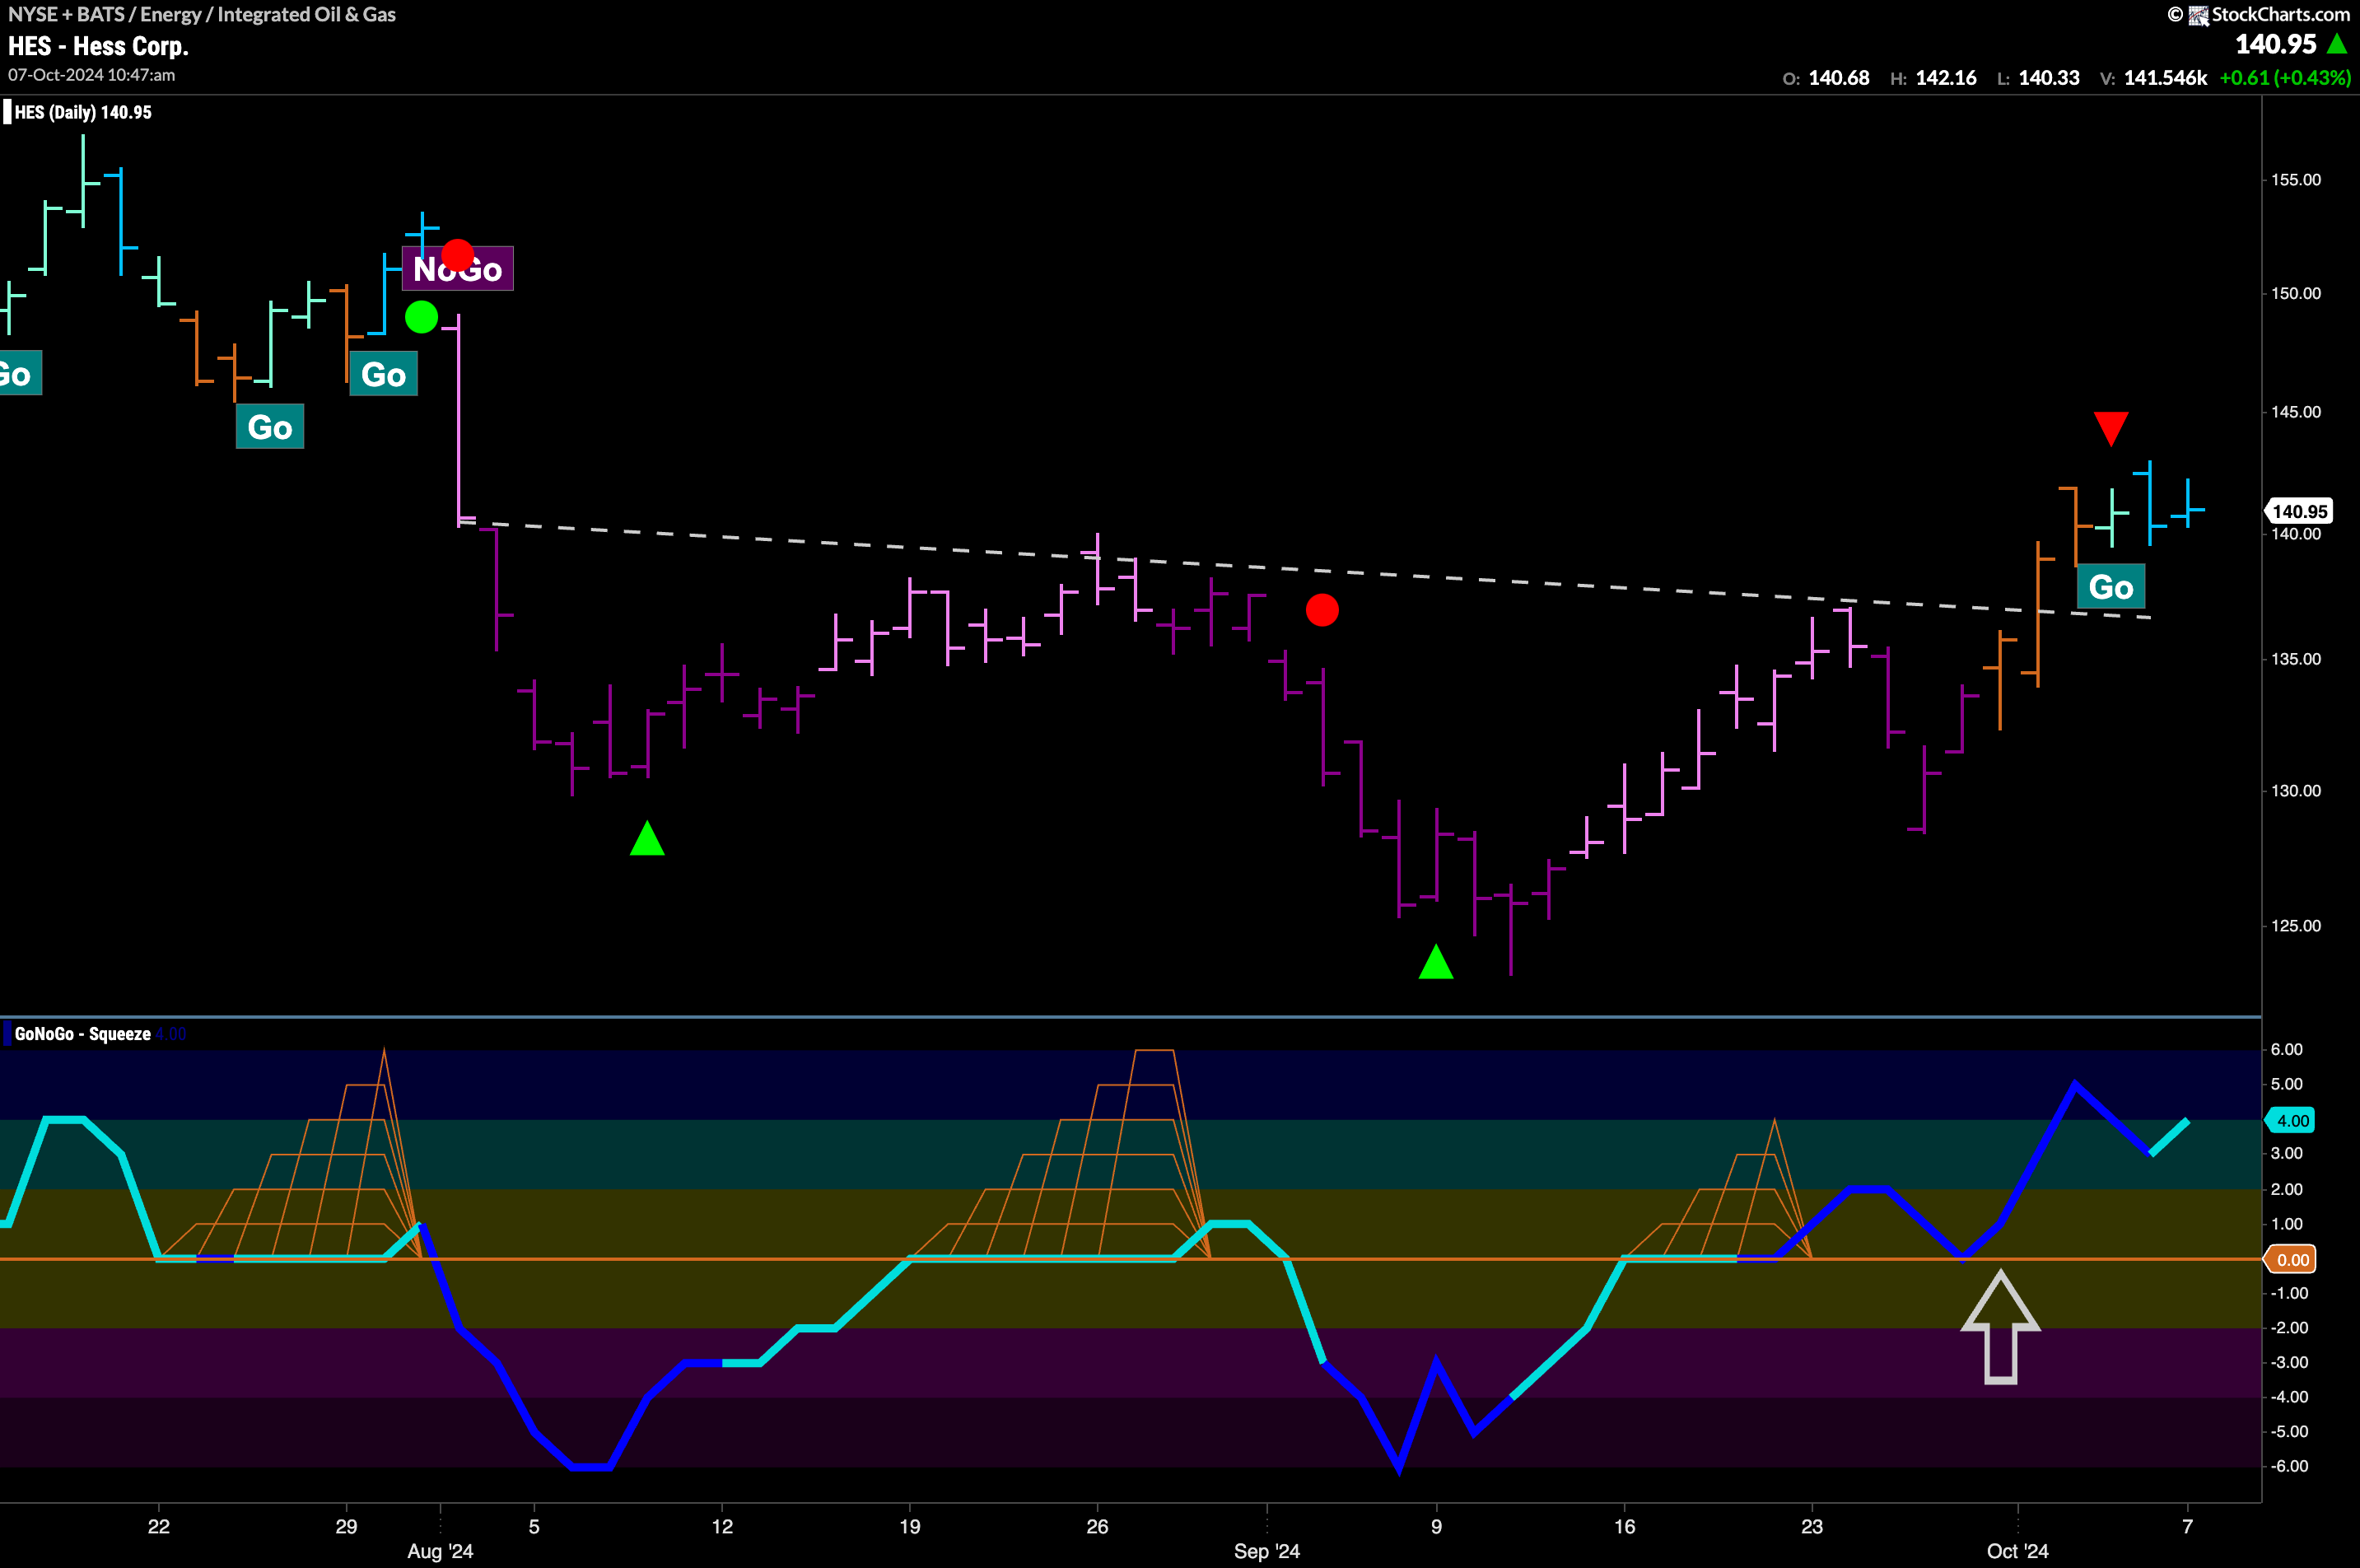
$HES Enters New “Go” Trend at New Highs
$HES has entered a “Go” trend and GoNoGo Trend shows that it has strengthened quickly as the indicator paints strong blue bars. We saw price rise after the last higher low and as price broke through resistance GoNoGo Trend painted amber “Go Fish” bars. That came after GoNoGo Oscillator broke above the zero line tell us that momentum had turned positive on heavy volume. Now, we see that momentum remains in positive territory, confirming the new trend we see in price.
