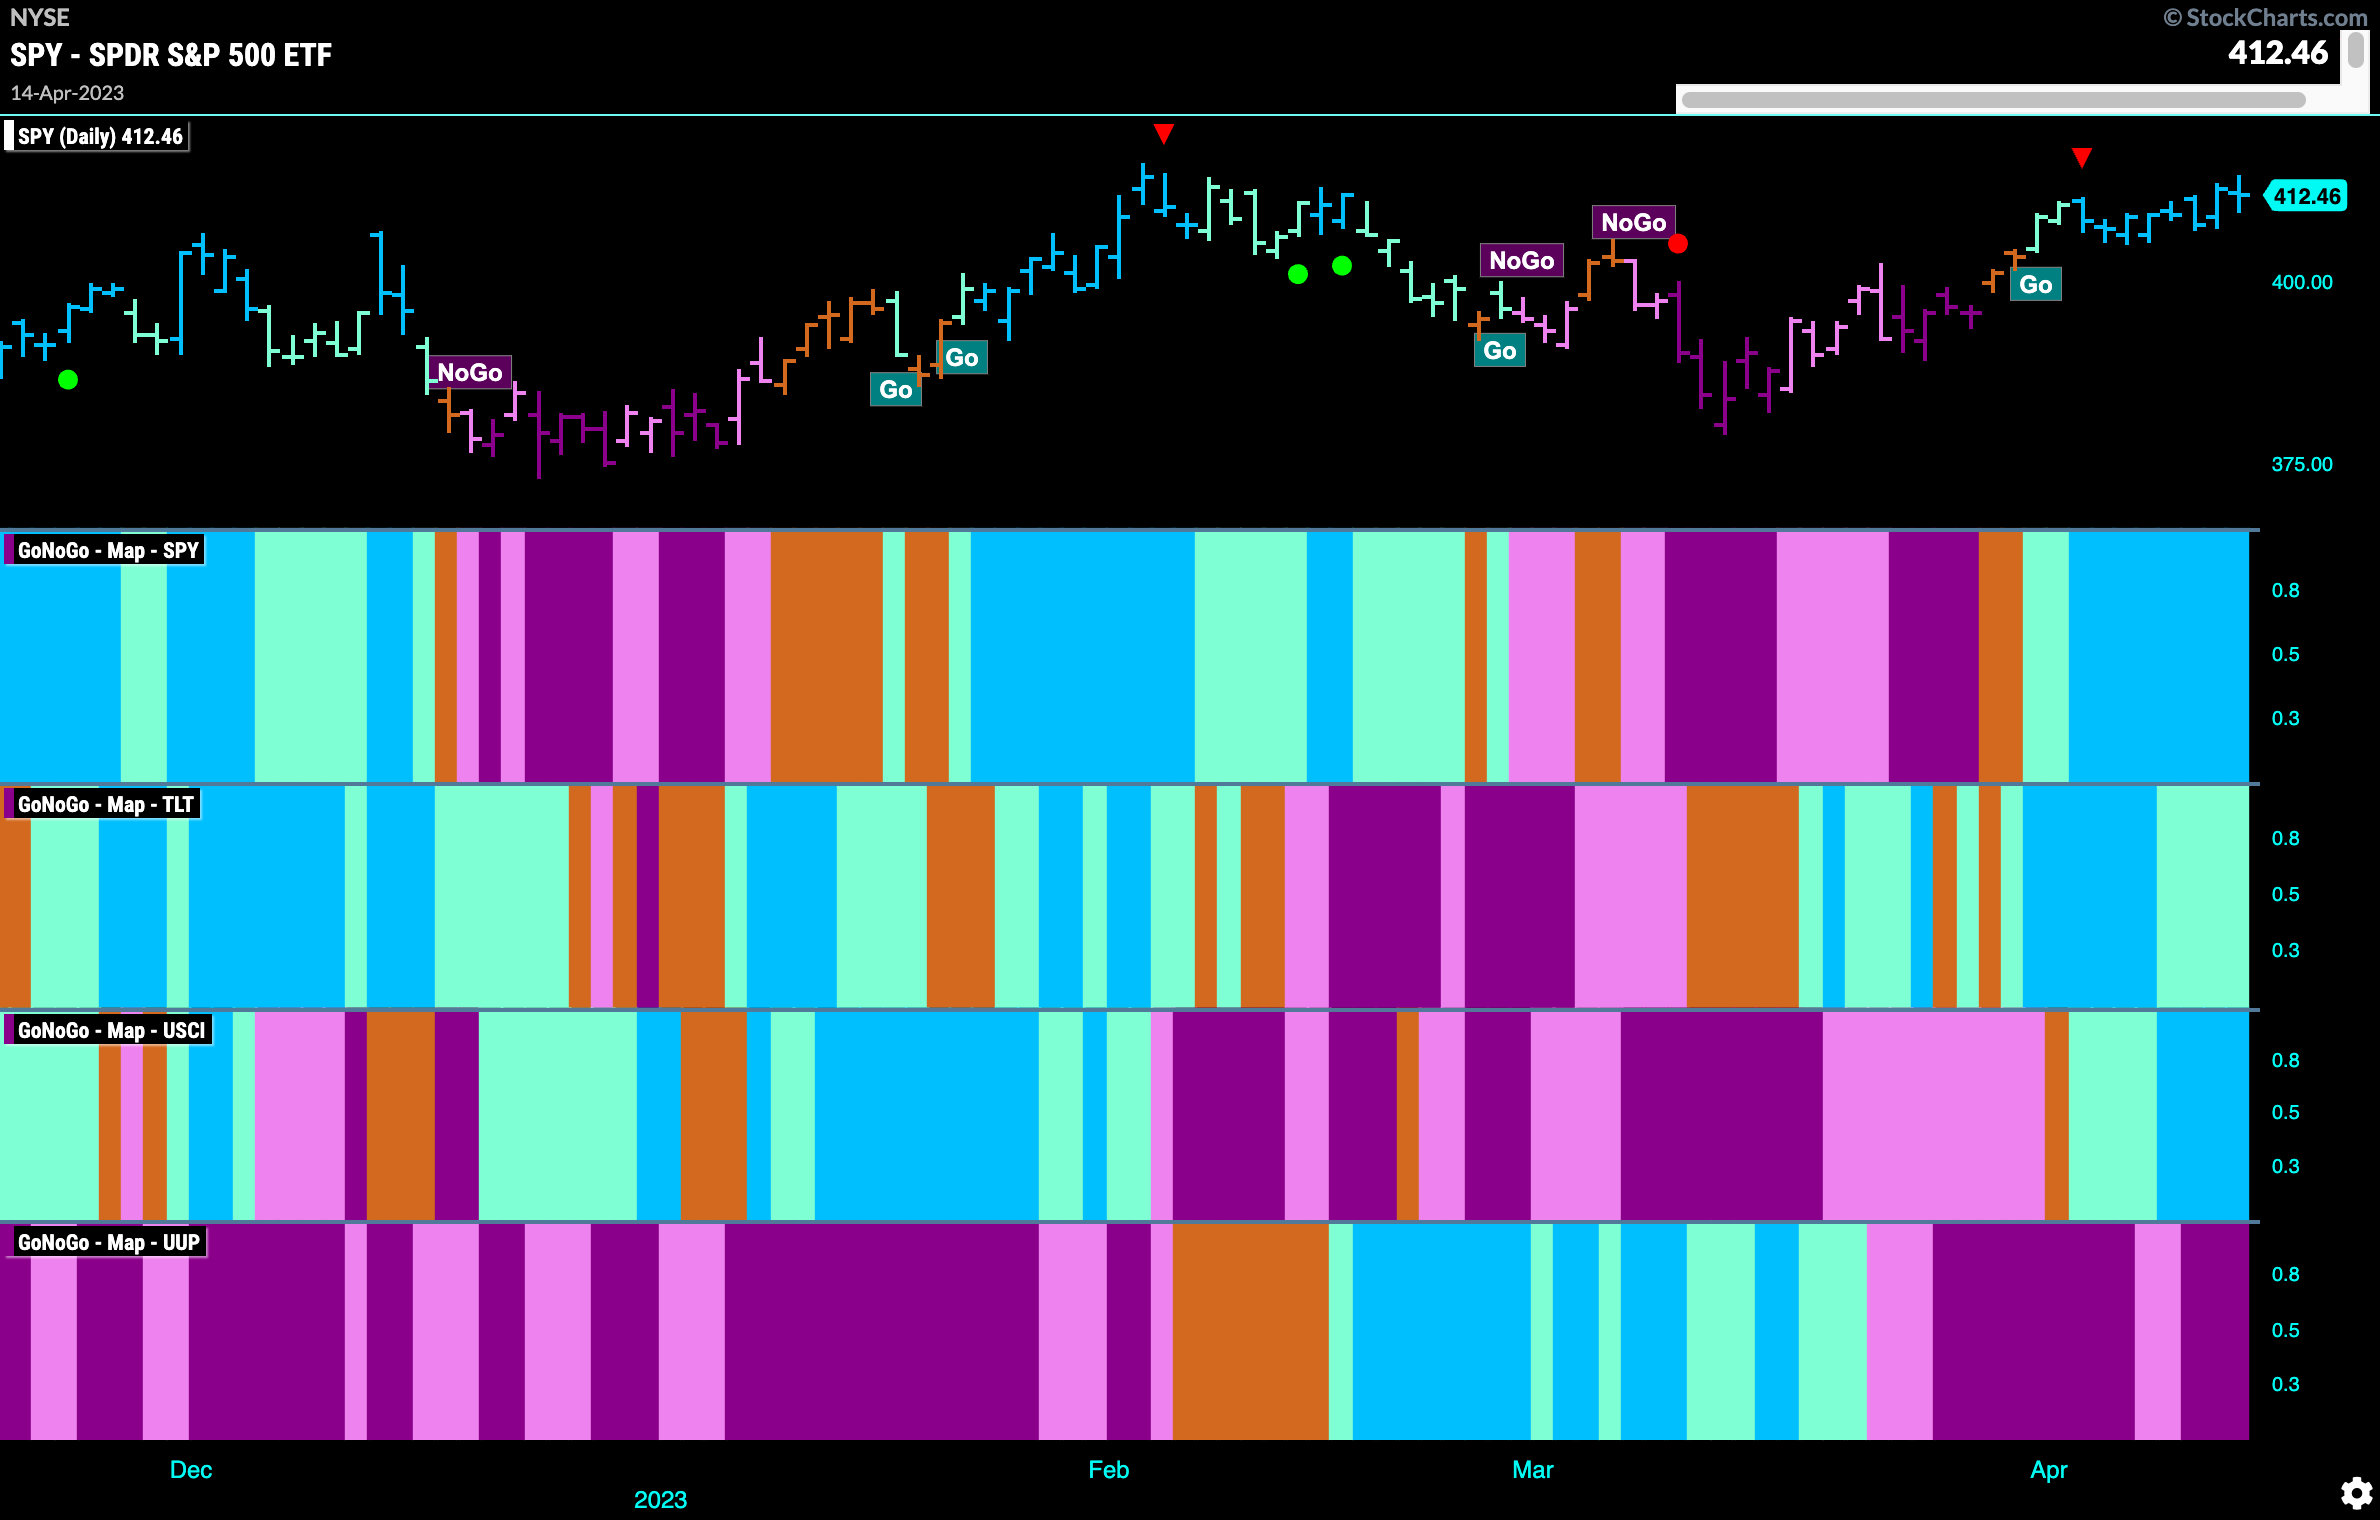
Good morning and welcome to this week’s Flight Path. Let’s take a look at the GoNoGo Asset map below. Equities remain in a strong “Go” trend as we start this week. Treasury bond prices are still in trend but painting weaker aqua “Go” bars. Commodities have re-entered the fray and paint strong “Go” bars to end last week. The dollar, of course, remains embroiled in a “NoGo” painting strong purple bars.
Equities Approach Prior Highs
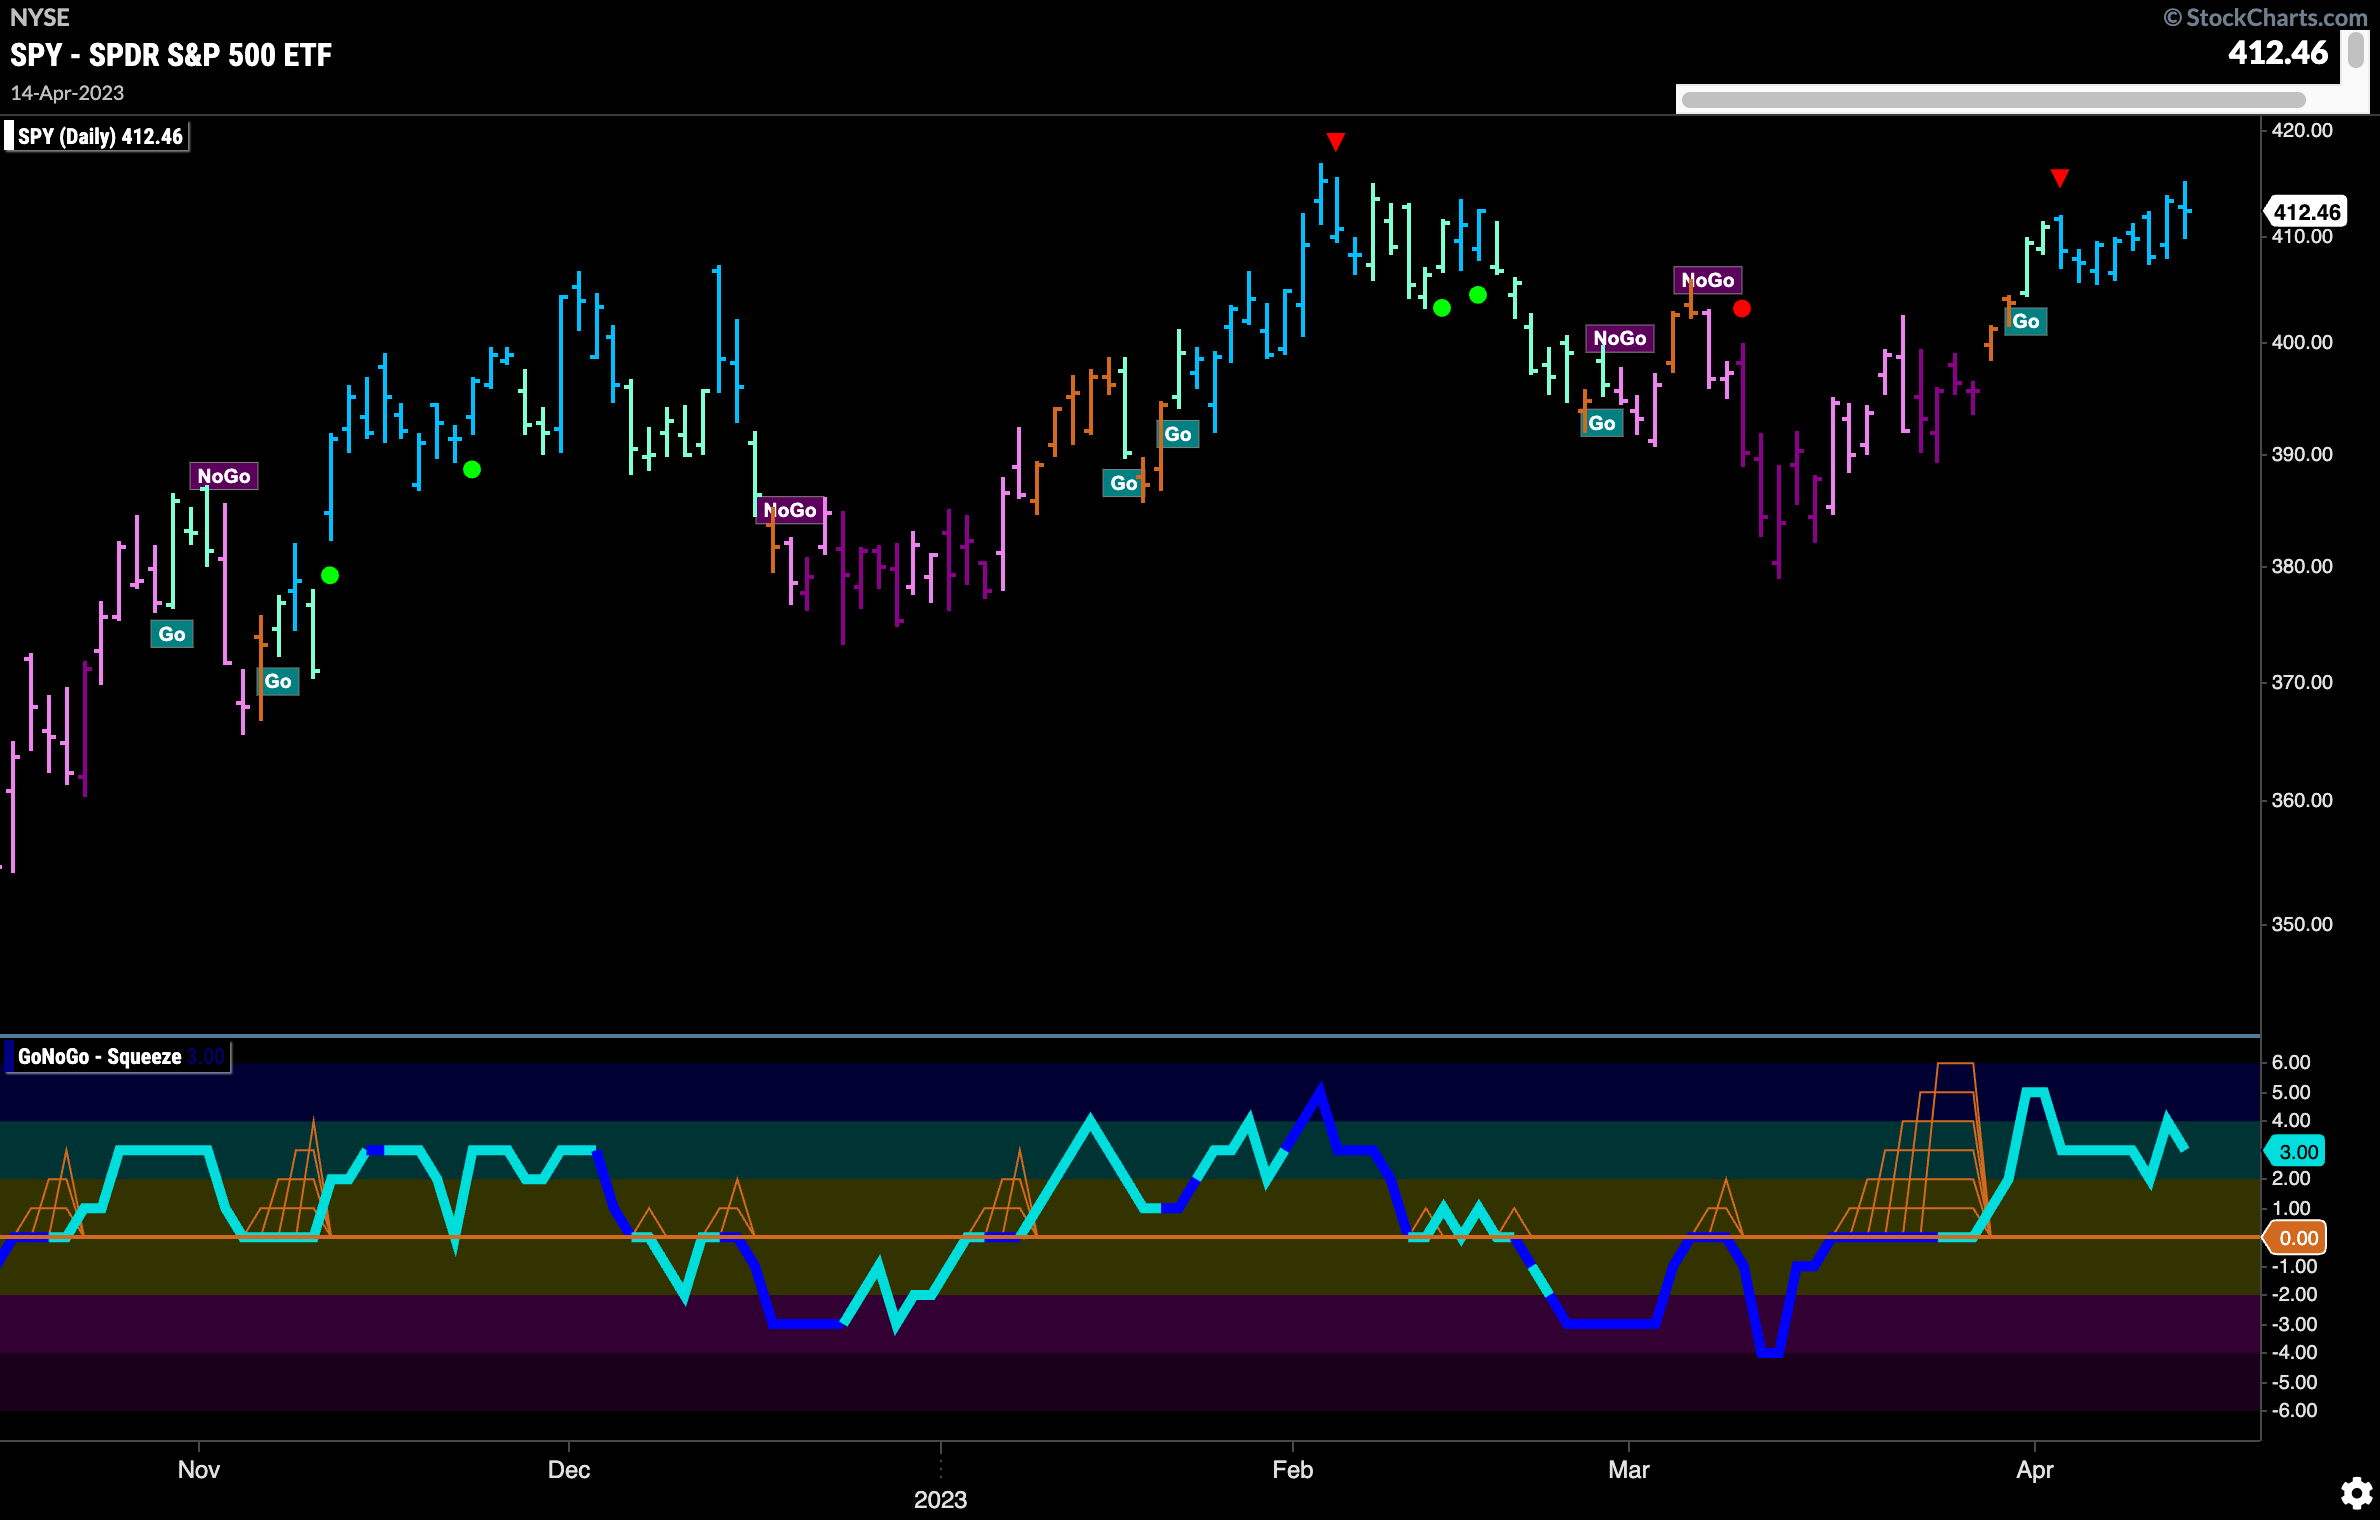
GoNoGo Trend shows that the trend solidified over the past two weeks and has painted a string of strong blue bars as price approaches what could be resistance from prior highs in February. GoNoGo oscillator shows that momentum has been in positive territory since breaking out of the Max GoNoGo Squeeze. We have not yet tested the zero line in this “Go” trend.
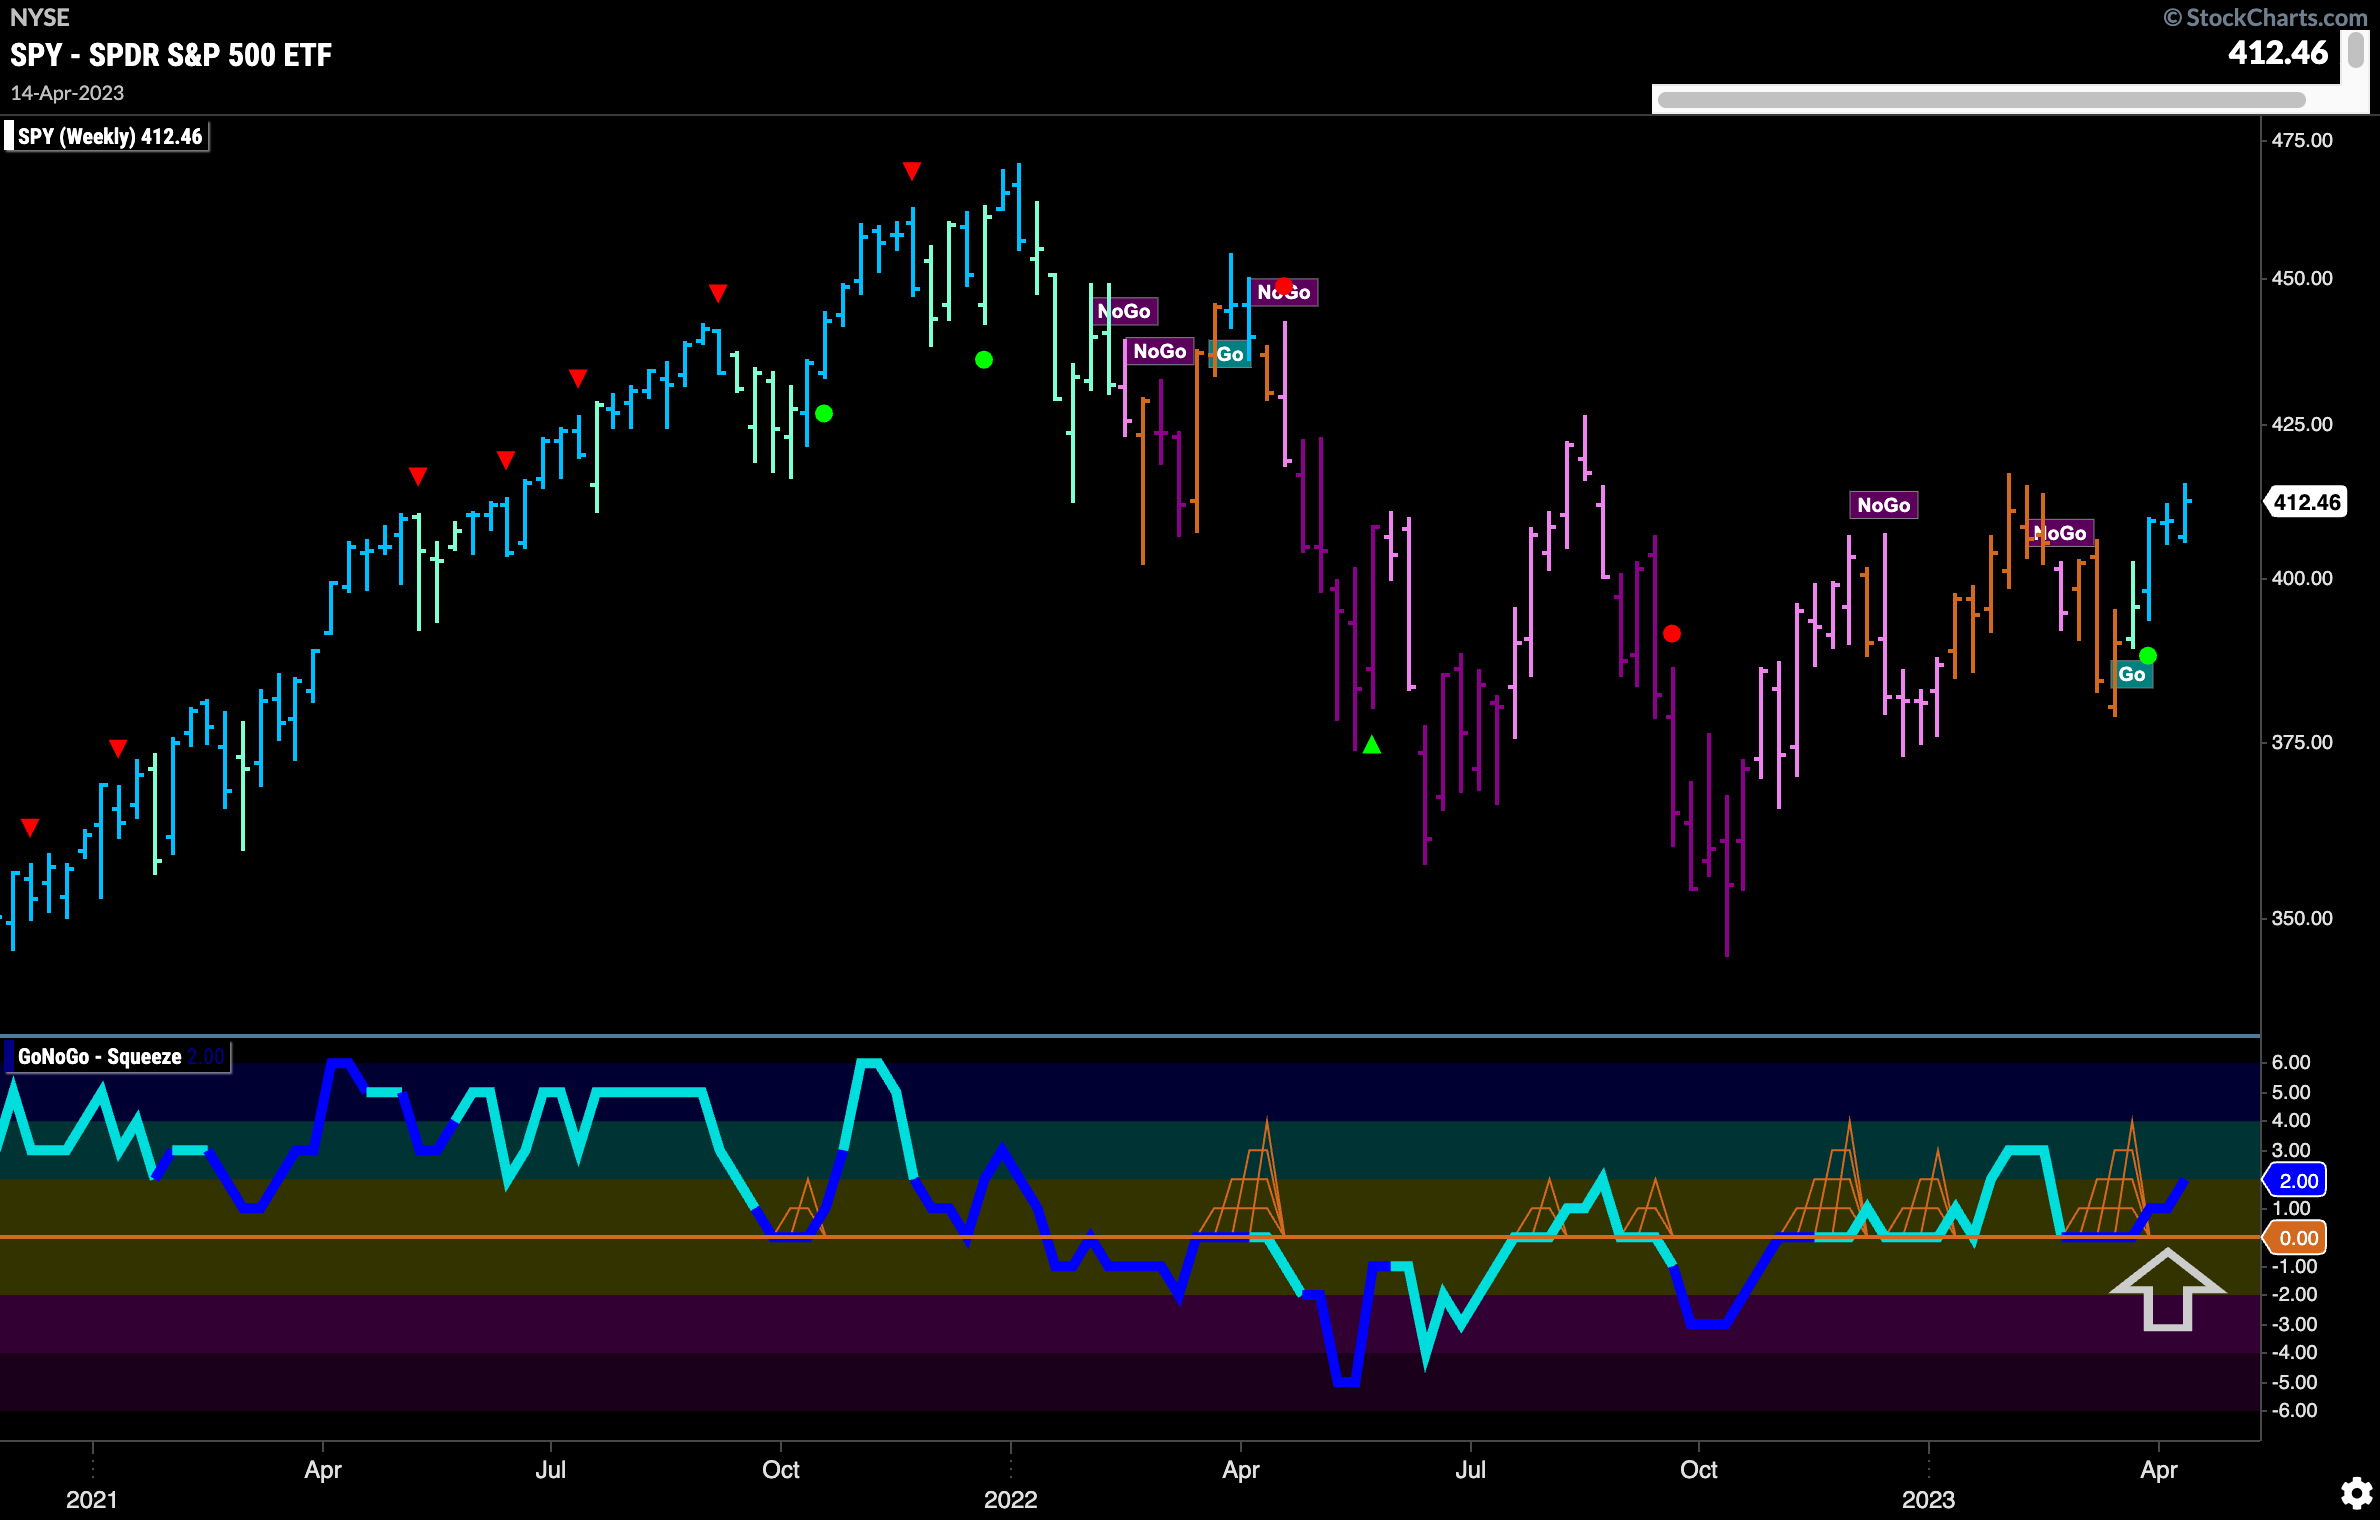
We see another strong blue bar showing the “Go” trend in place on the weekly chart. After a second higher low we are still looking for price to set new highs. It is facing some overhead resistance at these levels but GoNoGo Oscillator has repeatedly found support at the zero line telling us that momentum is on the side of the new “Go” trend. Volume is heavy.
Treasury Rally Off Lows
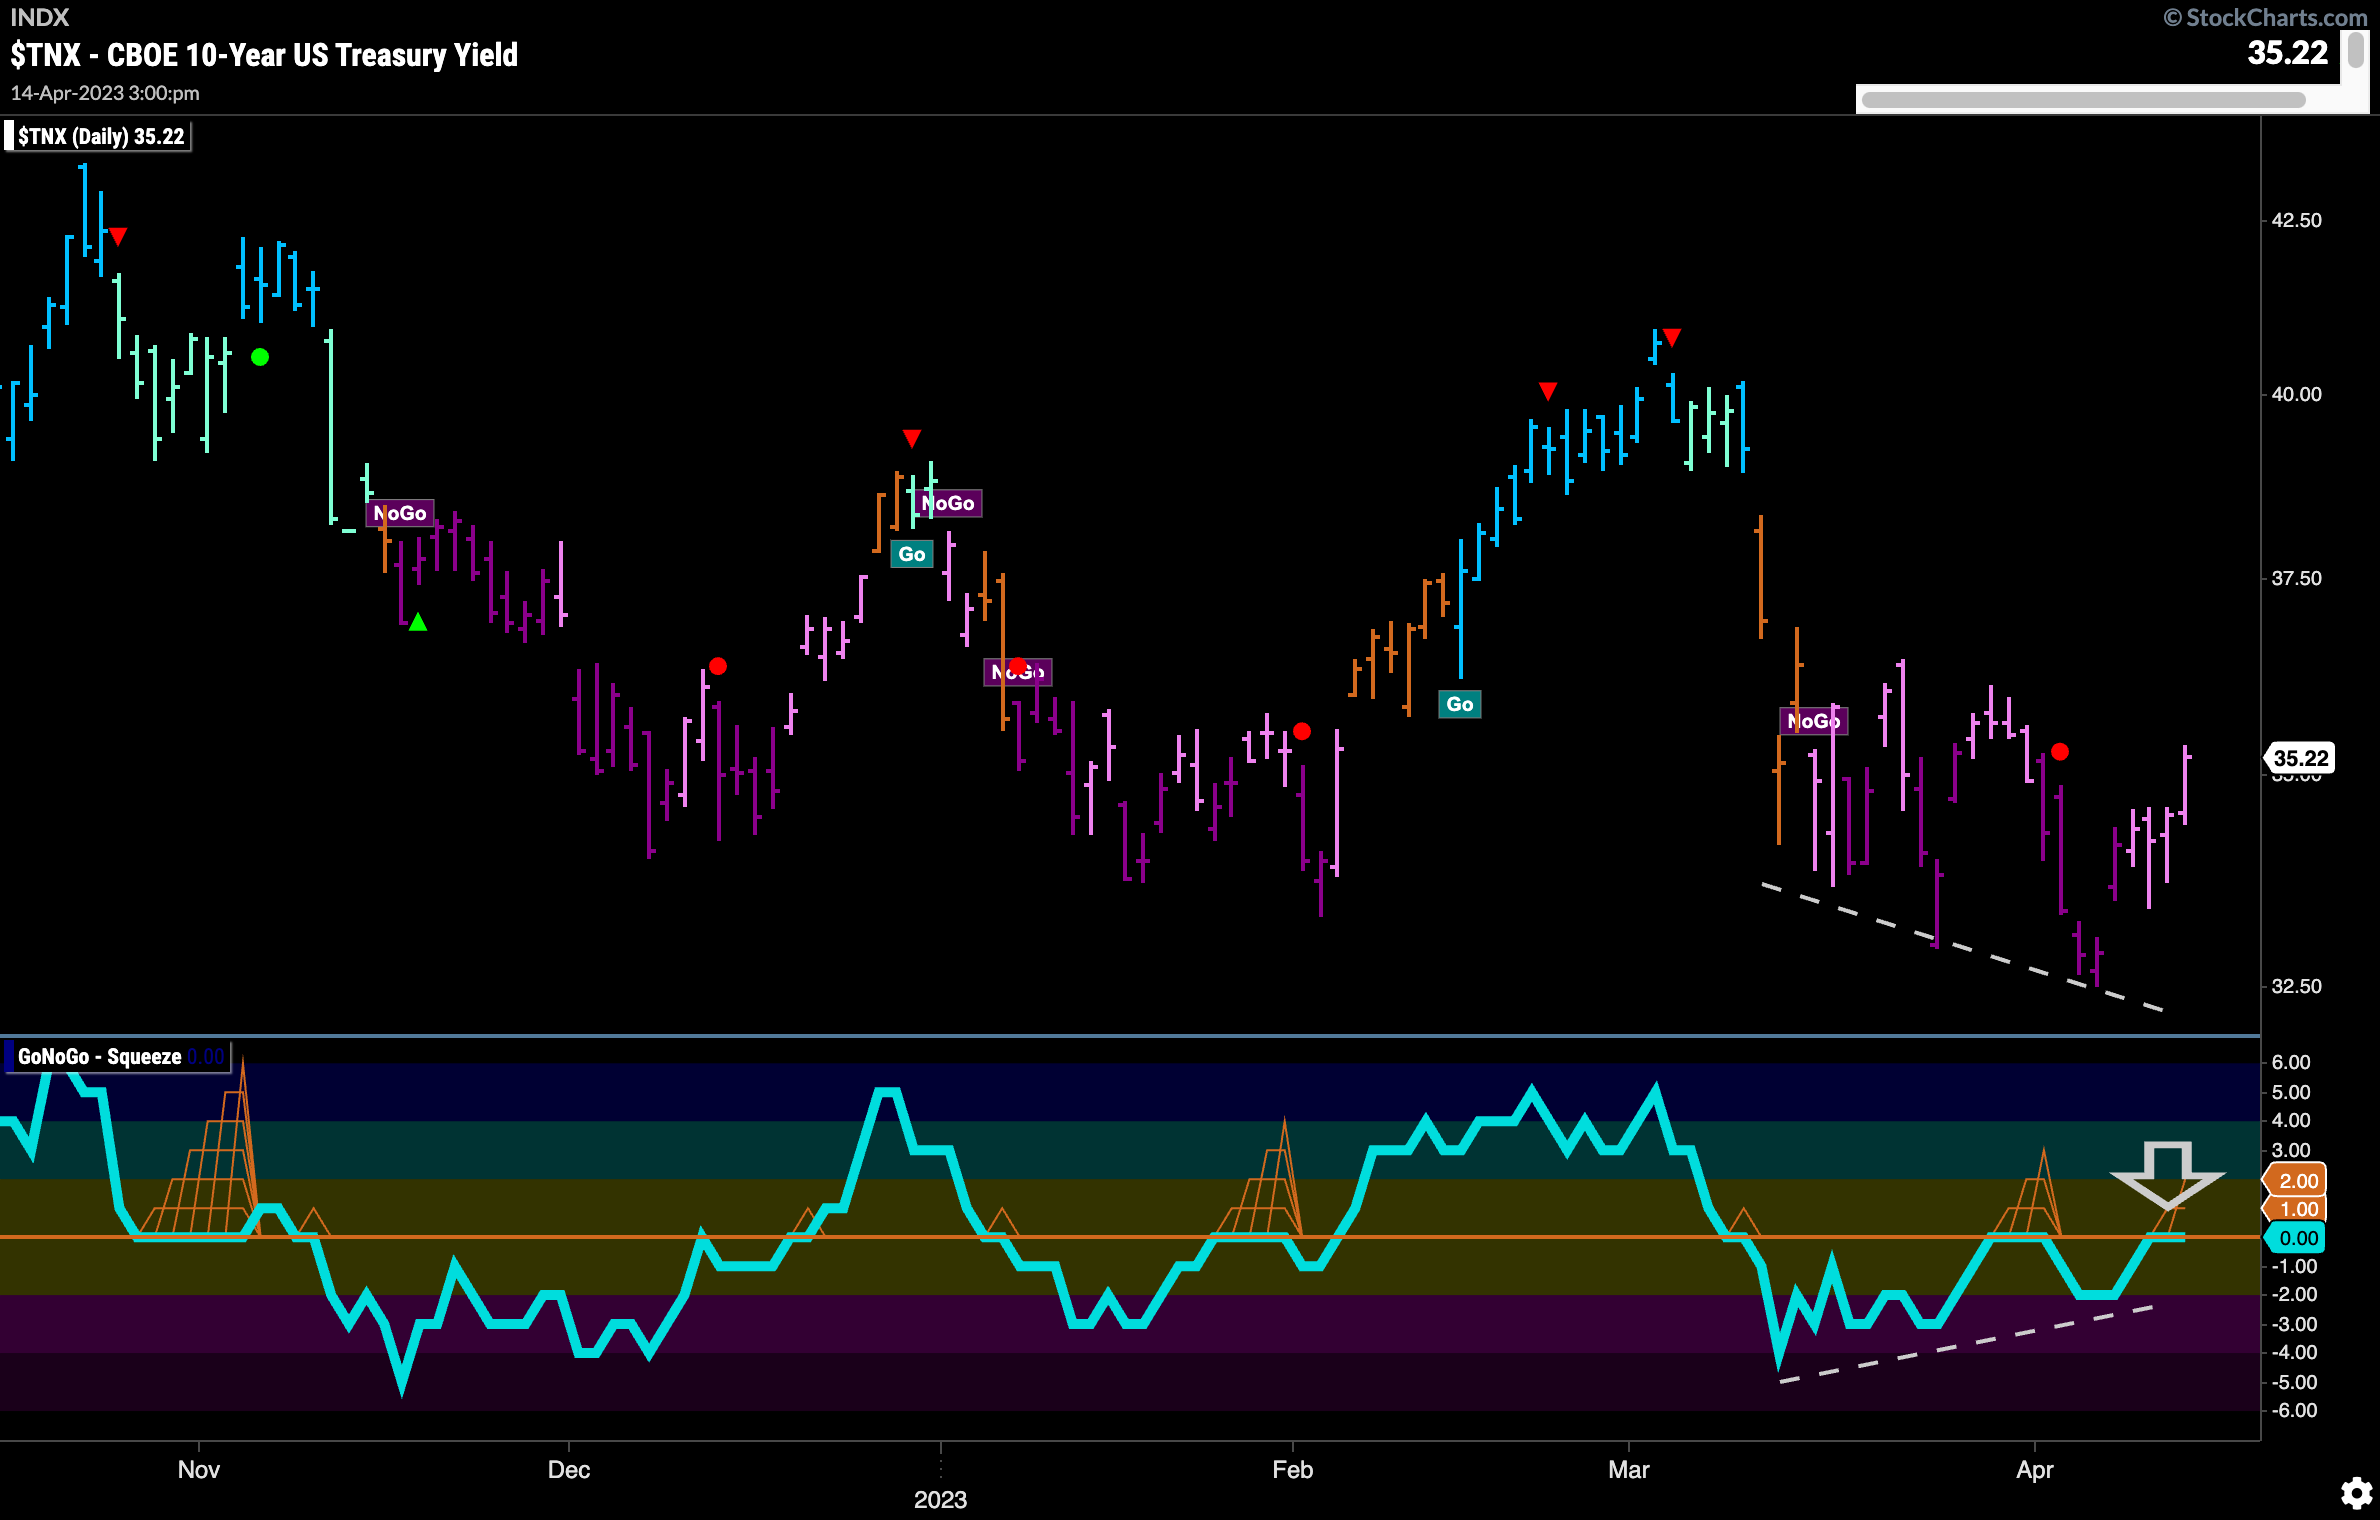
Treasury rates rallied this week after setting a new low the last. GoNoGo Trend paints mostly weaker pink bars as price approaches prior highs. We are seeing some bullish divergence on the chart with price making lower lows and GoNoGo Oscillator making higher lows. Currently, GoNoGo Oscillator is testing the zero line from below where we will watch to see if it experiences resistance.
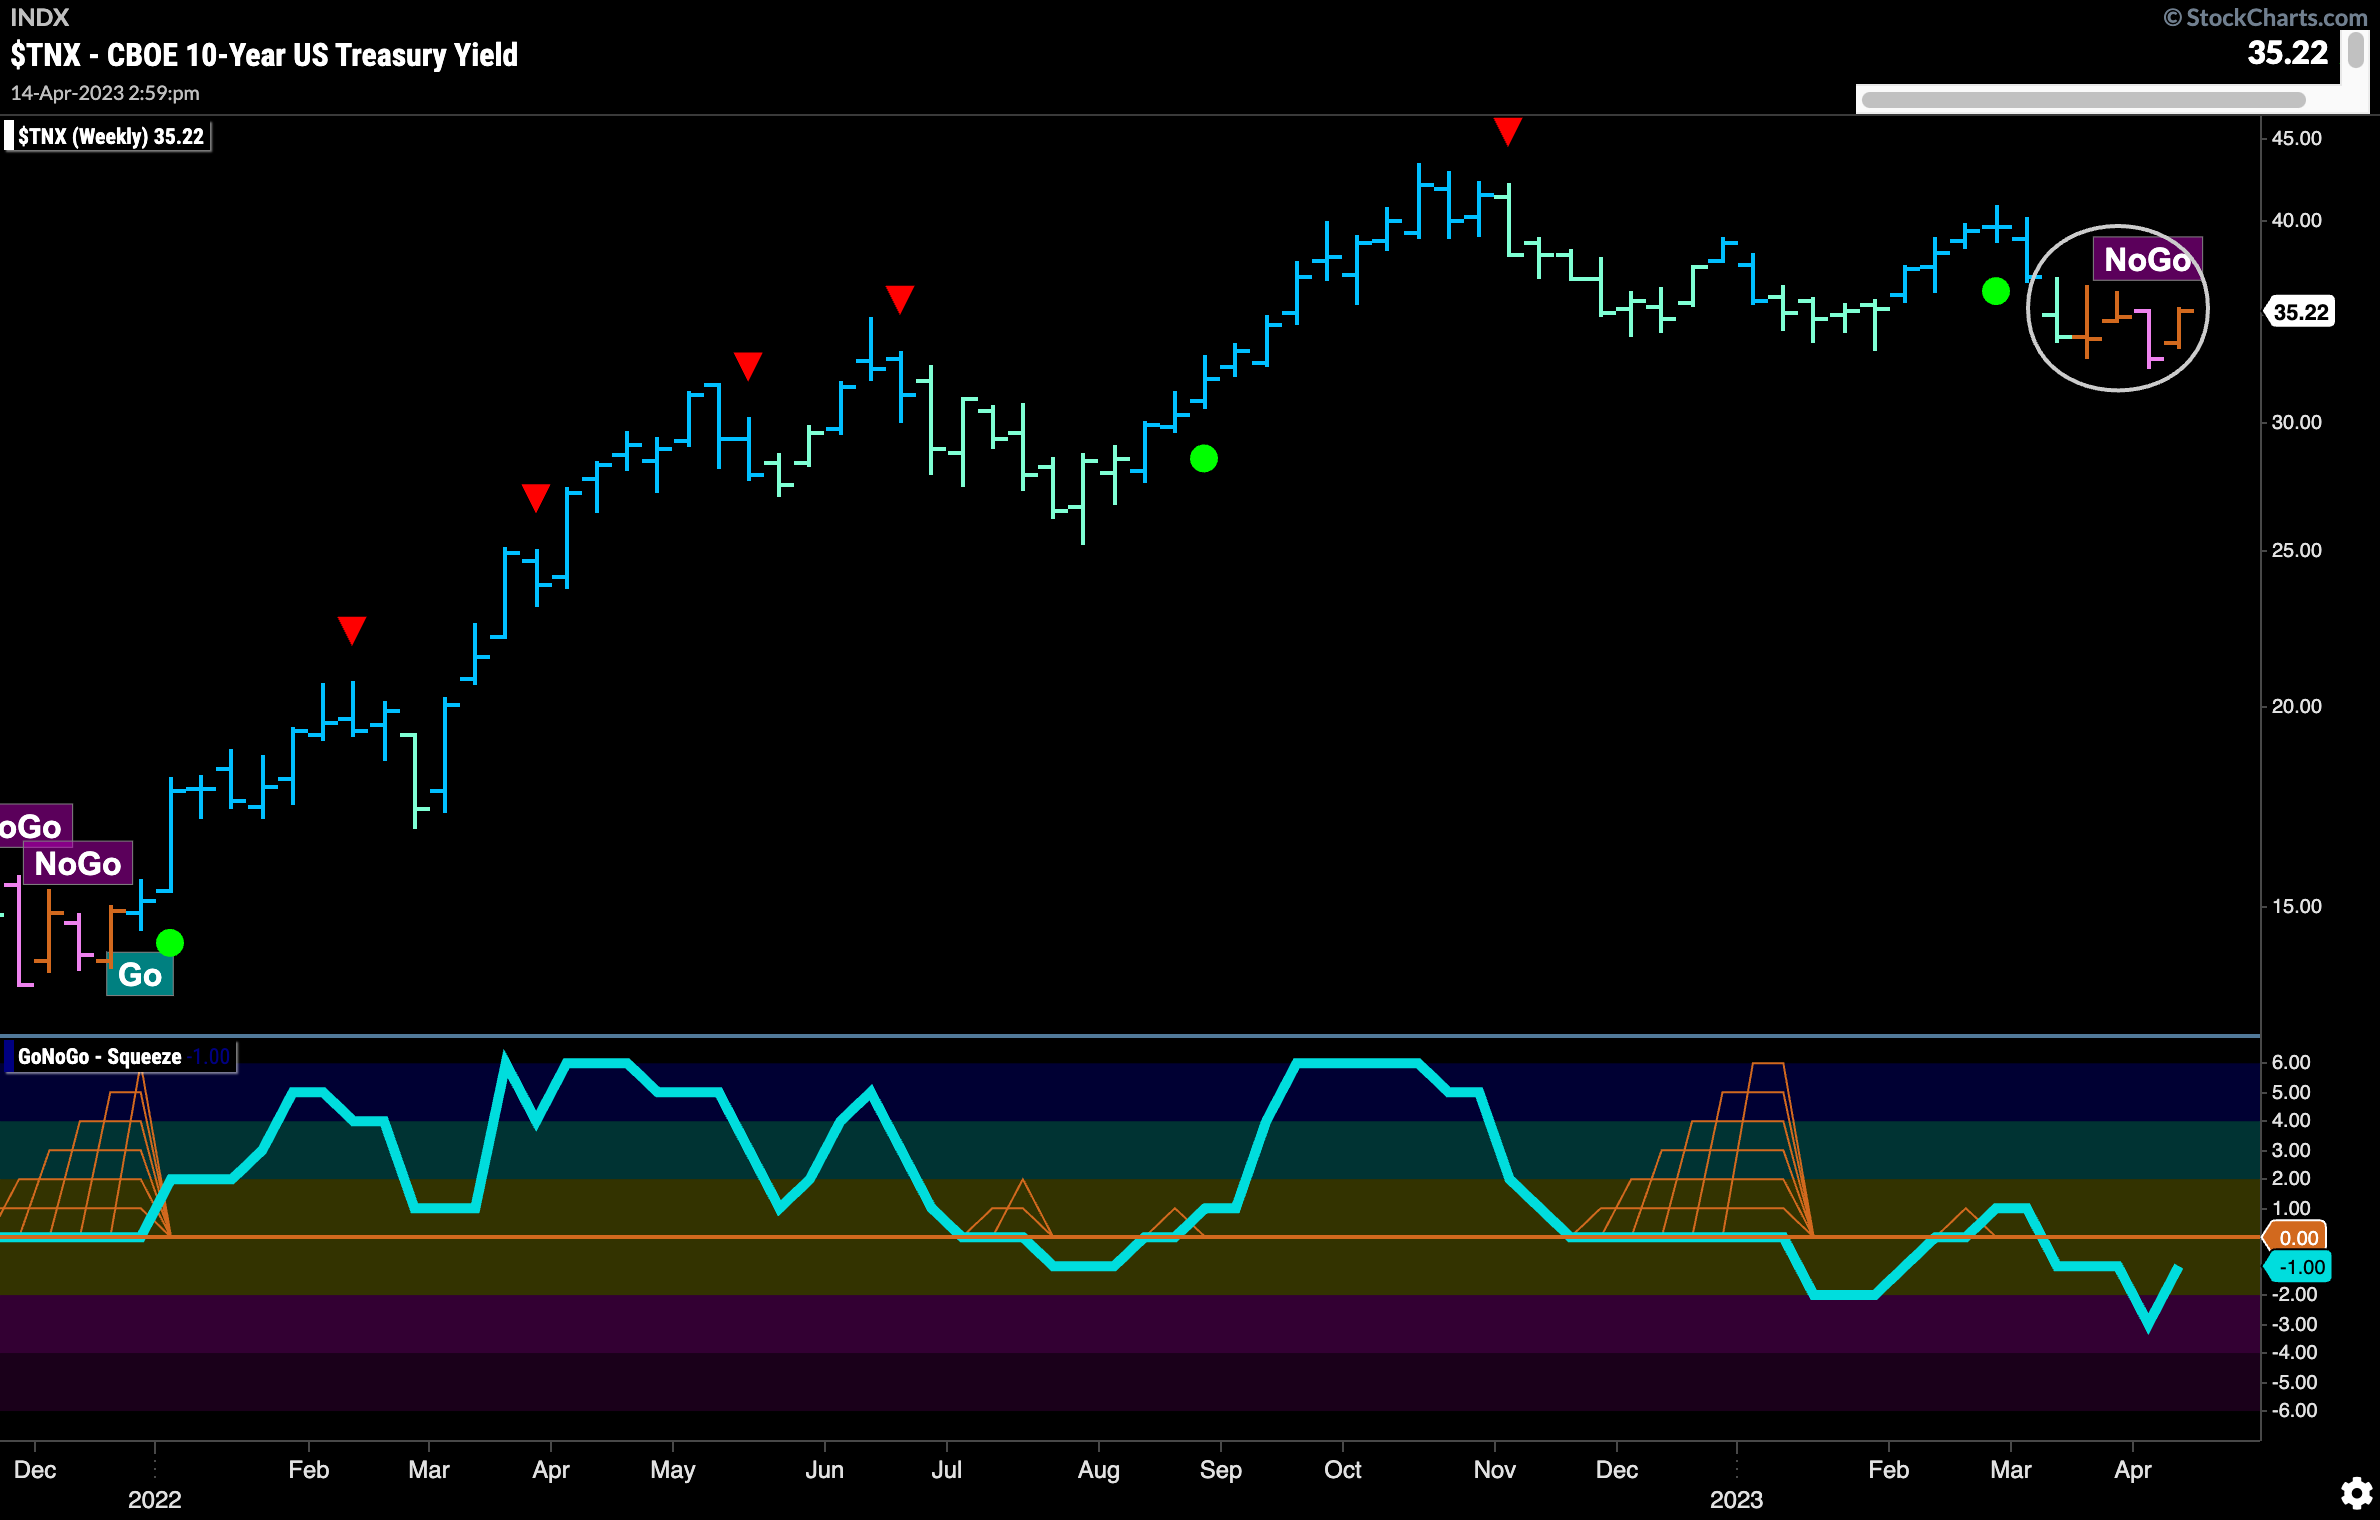
The weekly chart shows uncertainty as GoNoGo Trend paints an amber “Go Fish” bar. As a reminder, when there are not enough conditions being met to signal either a “Go” or a “NoGo” trend the indicator paints an amber bar. This often happens in transition periods or moments of inaction. With price hovering around a level that could be support we will see if price is able to rally from here or move lower. GoNoGo Oscillator shows that momentum is in negative territory but not yet oversold.
Dollar Continues in “NoGo” Trend
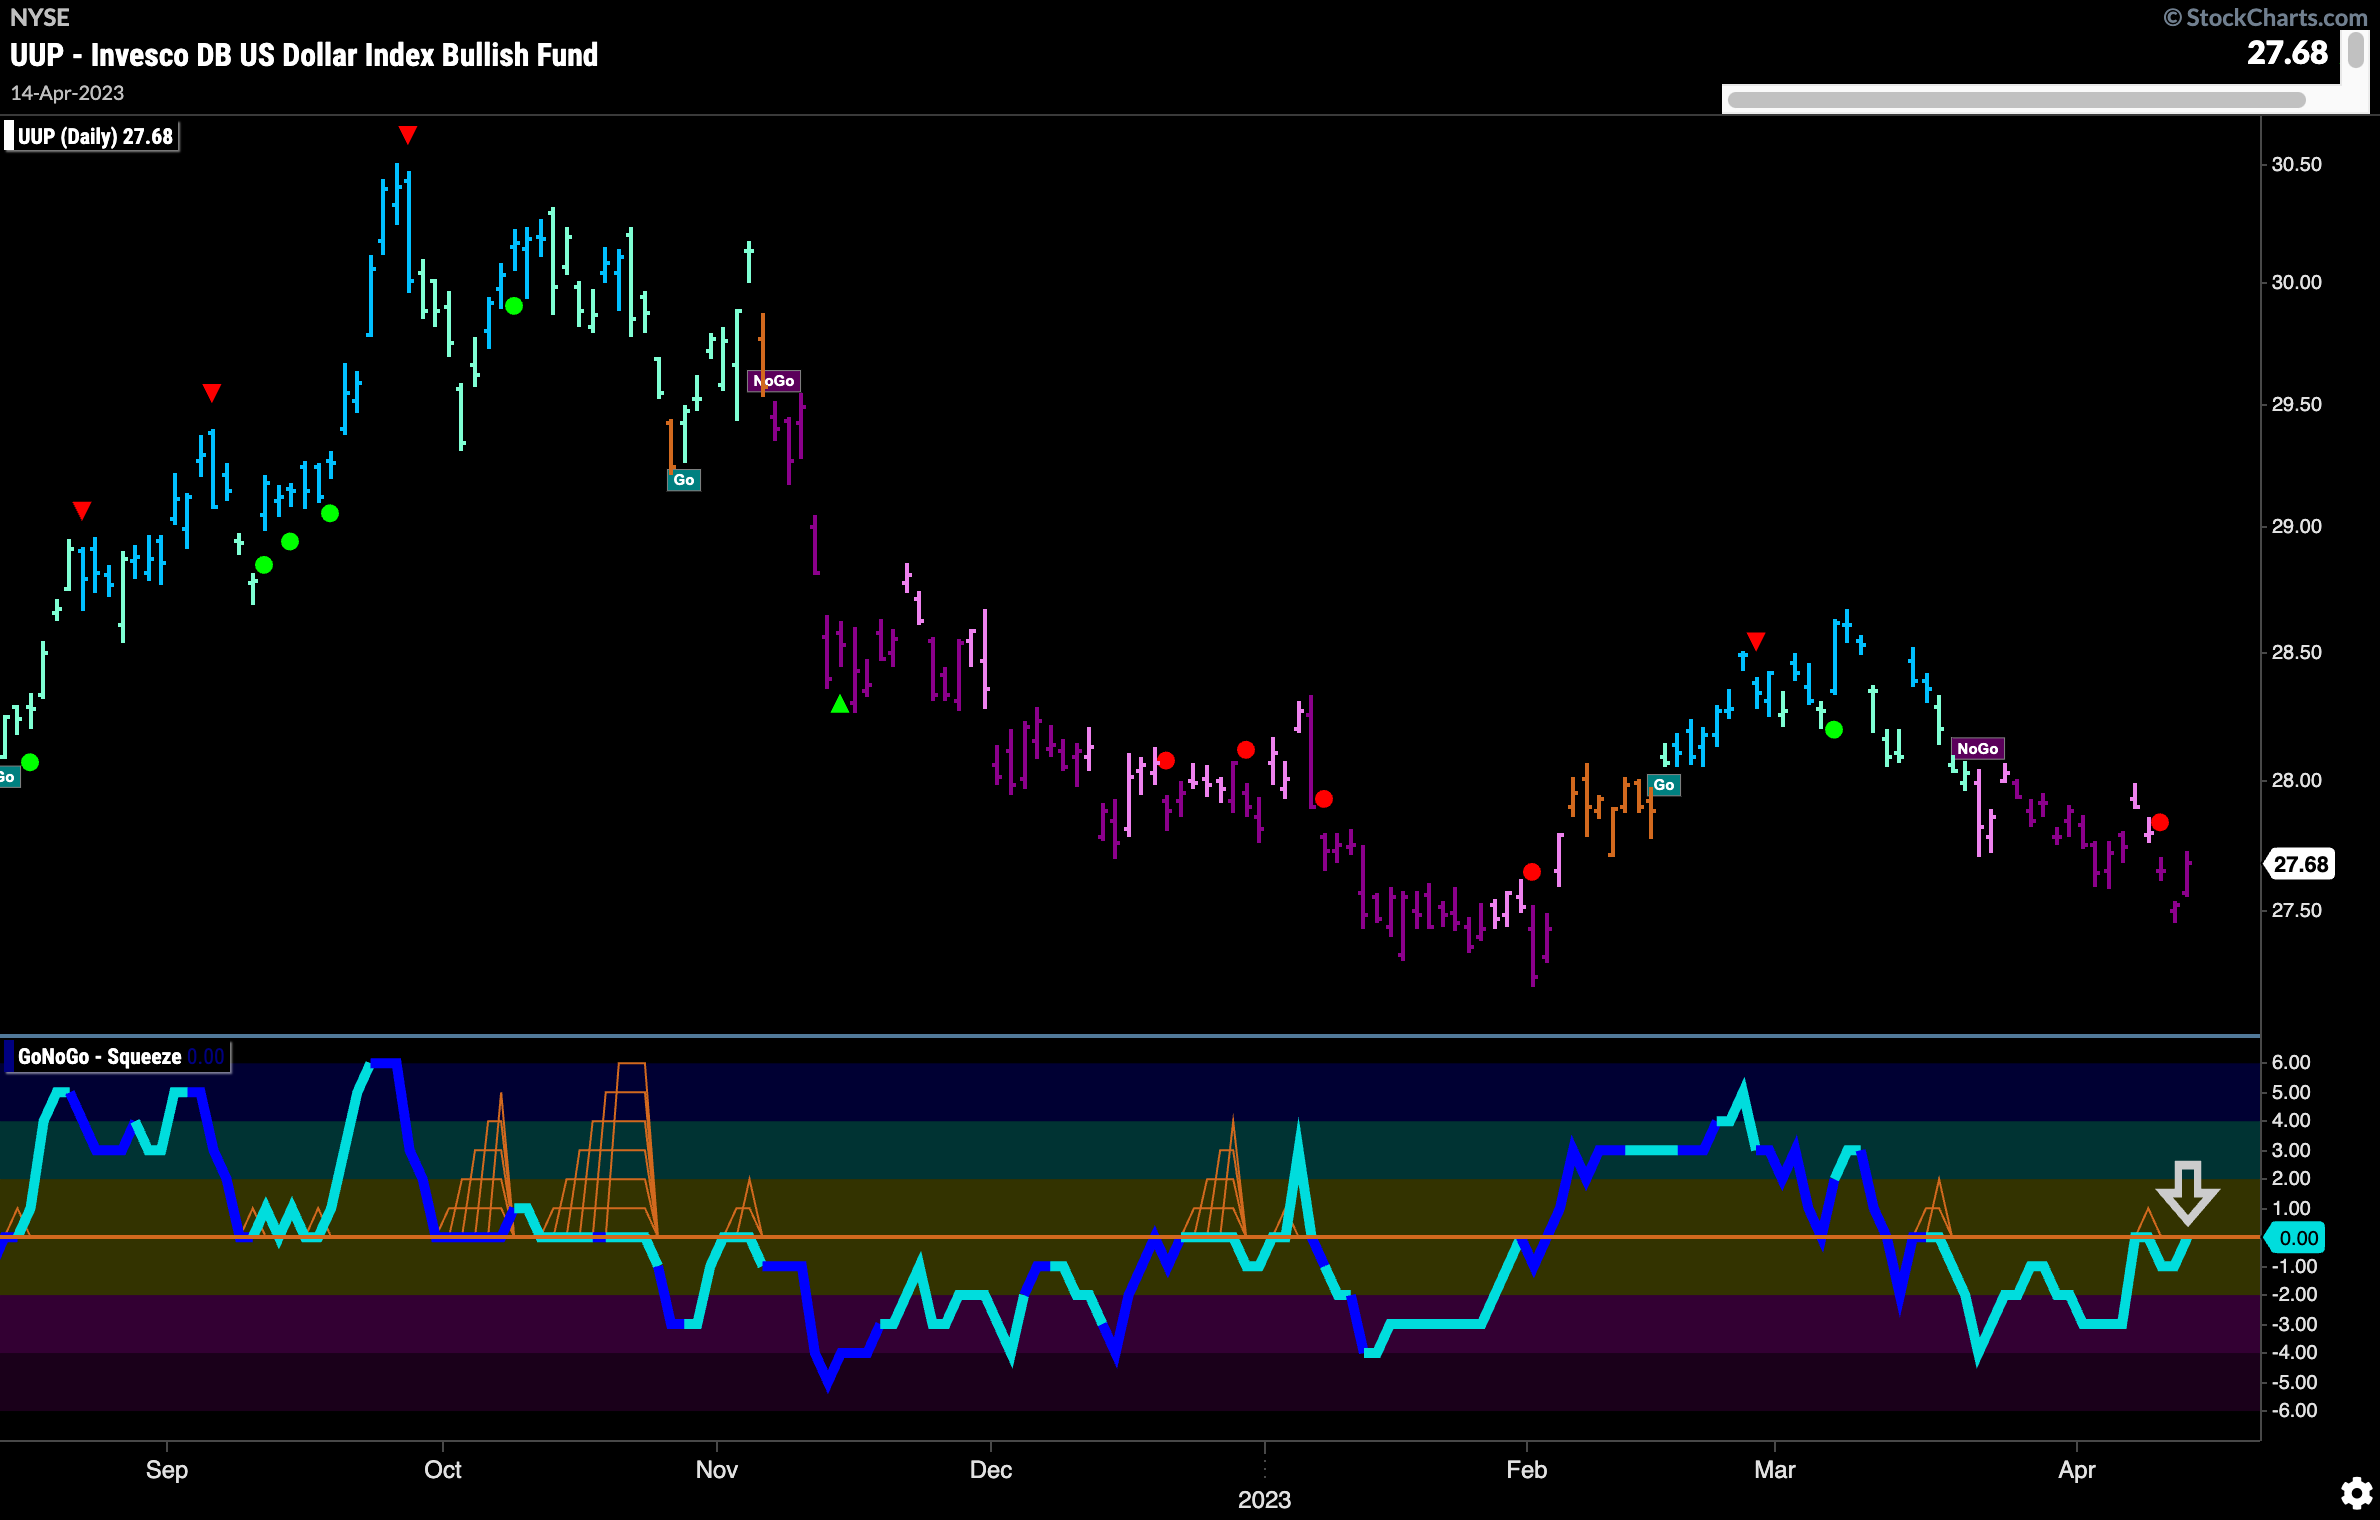
GoNoGo Trend colored the price bars mostly strong purple this past week as price edged lower still. We do see that there is possible support from the prior low in February and GoNoGo Oscillator has risen to test the zero line level from below. We will watch to see if this level acts as resistance. If it does, we would expect trend continuation and for price to attack those prior low levels.
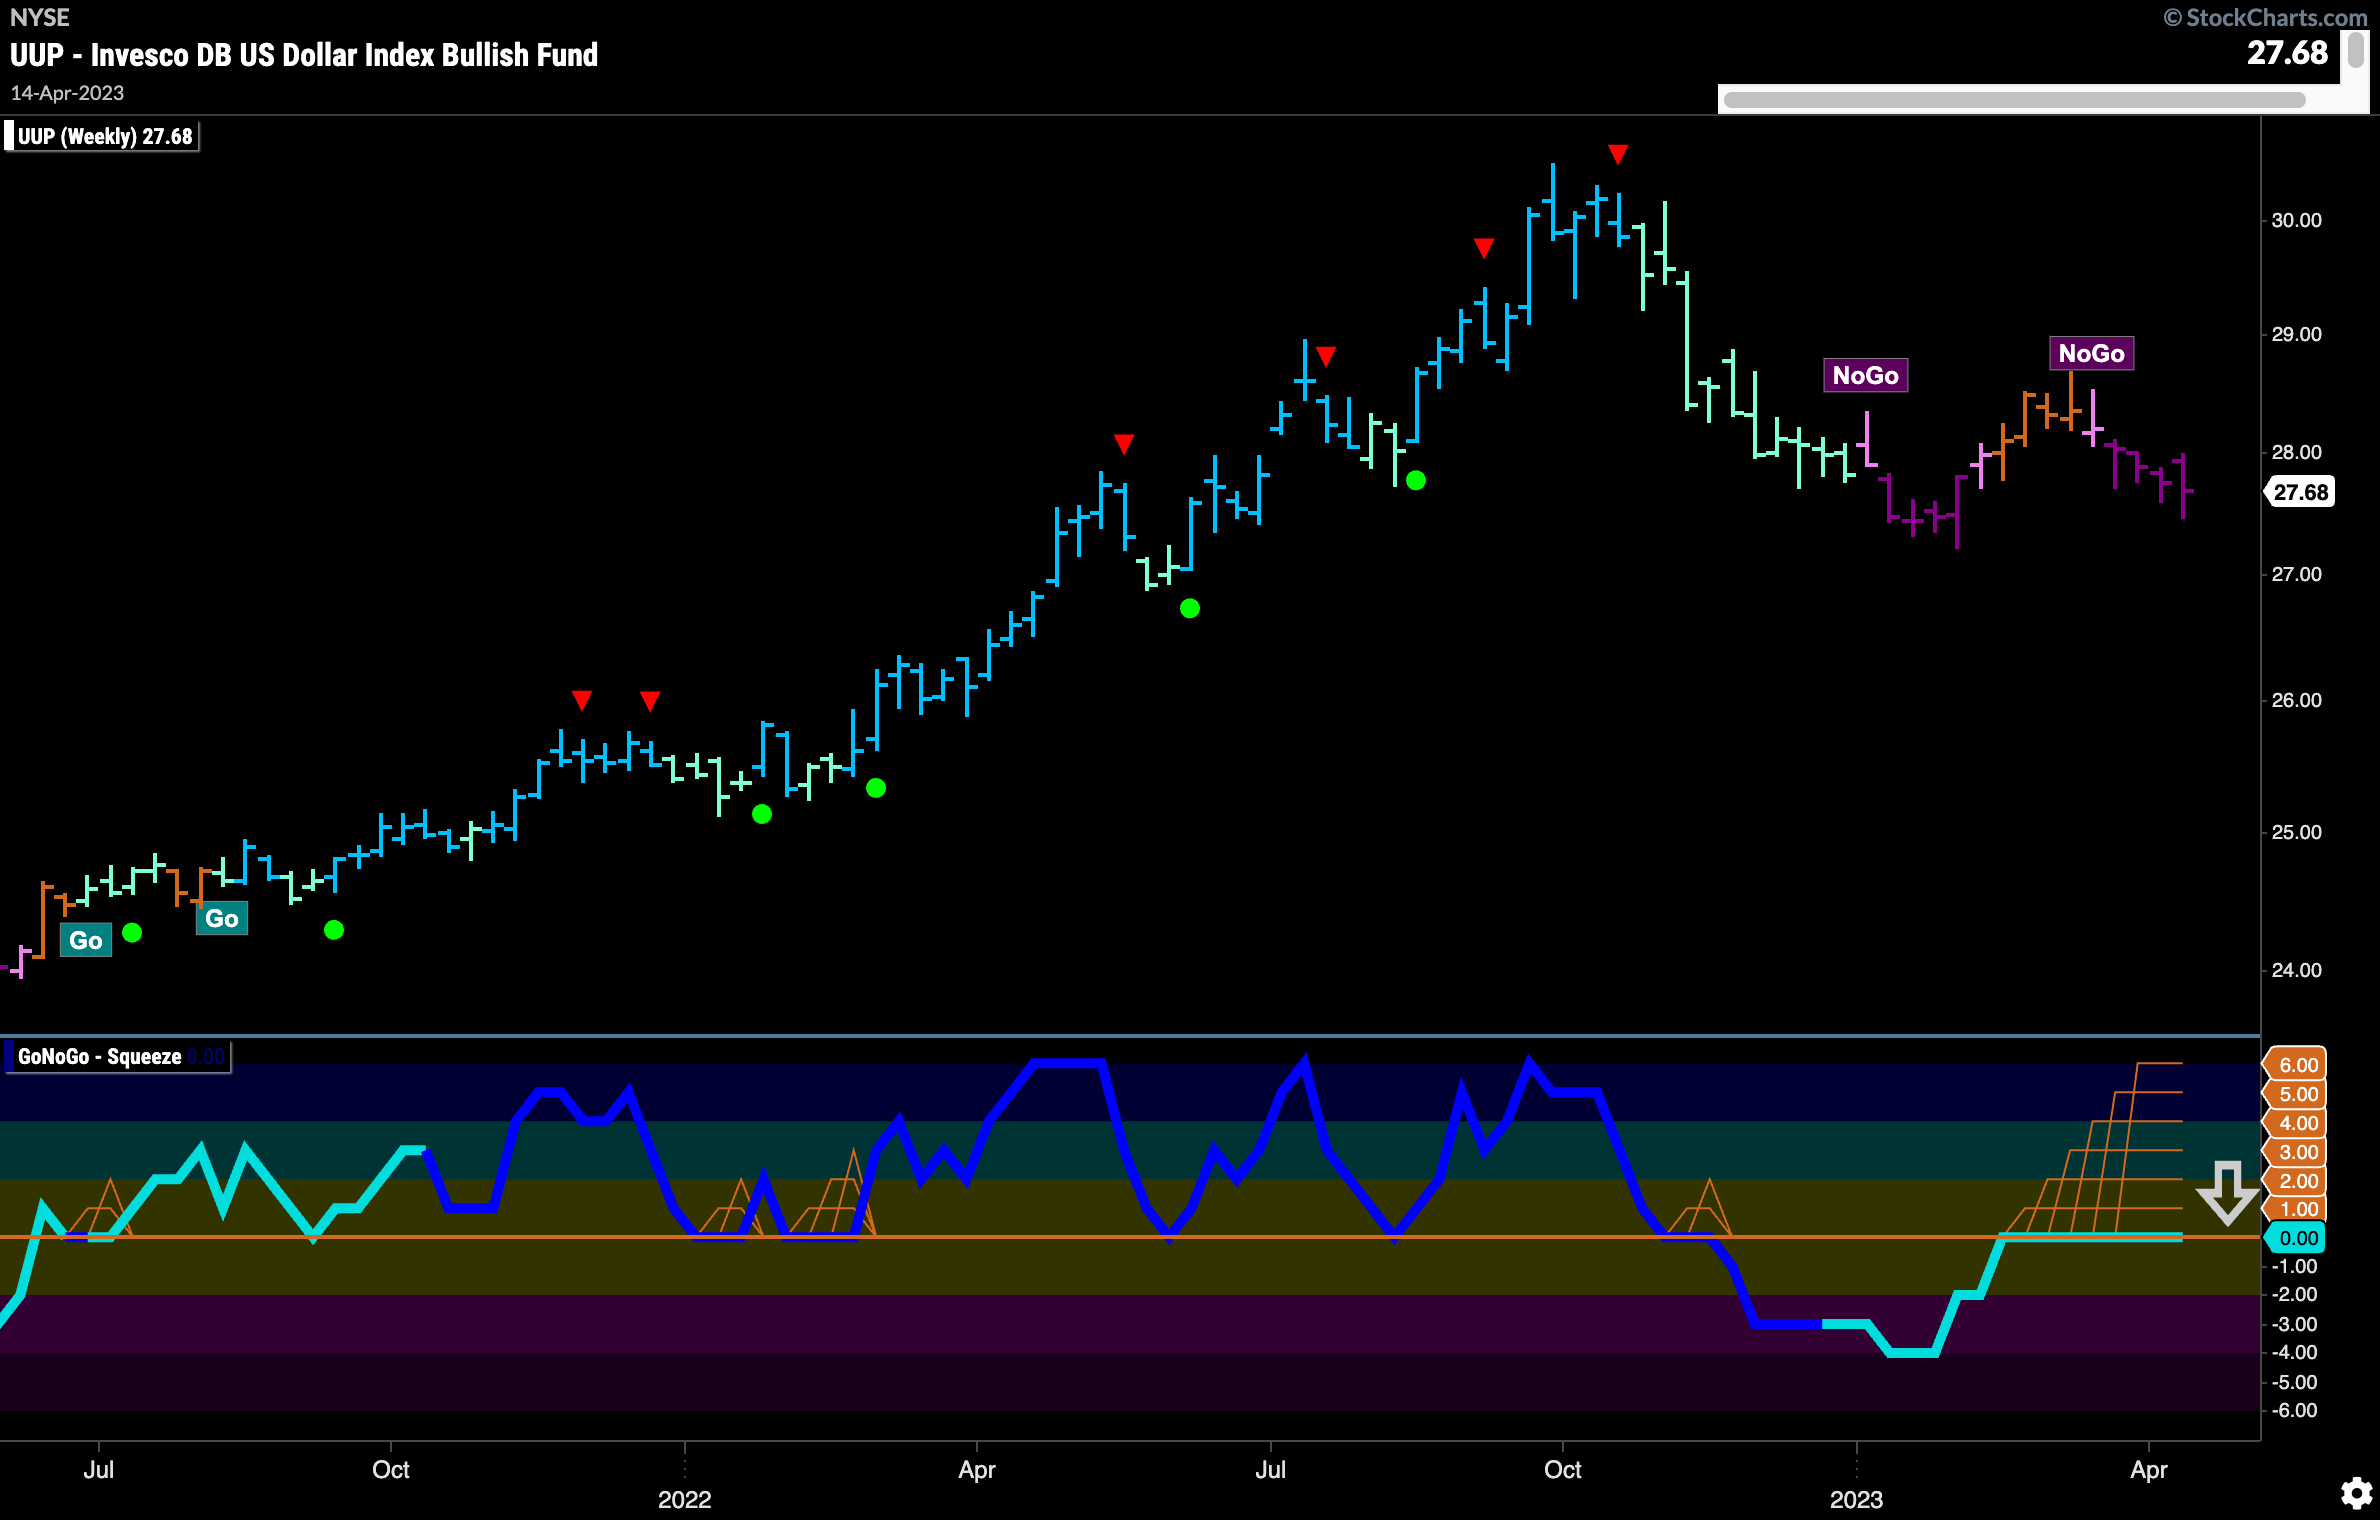
The weekly chart shows that while price is in a strong “NoGo” trend there is something very important happening in the lower panel. We see a Max GoNoGo Squeeze which tells us that there is little directional momentum. There is a tug of war between the buyers and sellers at this level. This make sense as we are nearing prior low support levels. It will be very telling in which direction the Max GoNoGo Squeeze is broken.
Oil Threatening to Break Higher
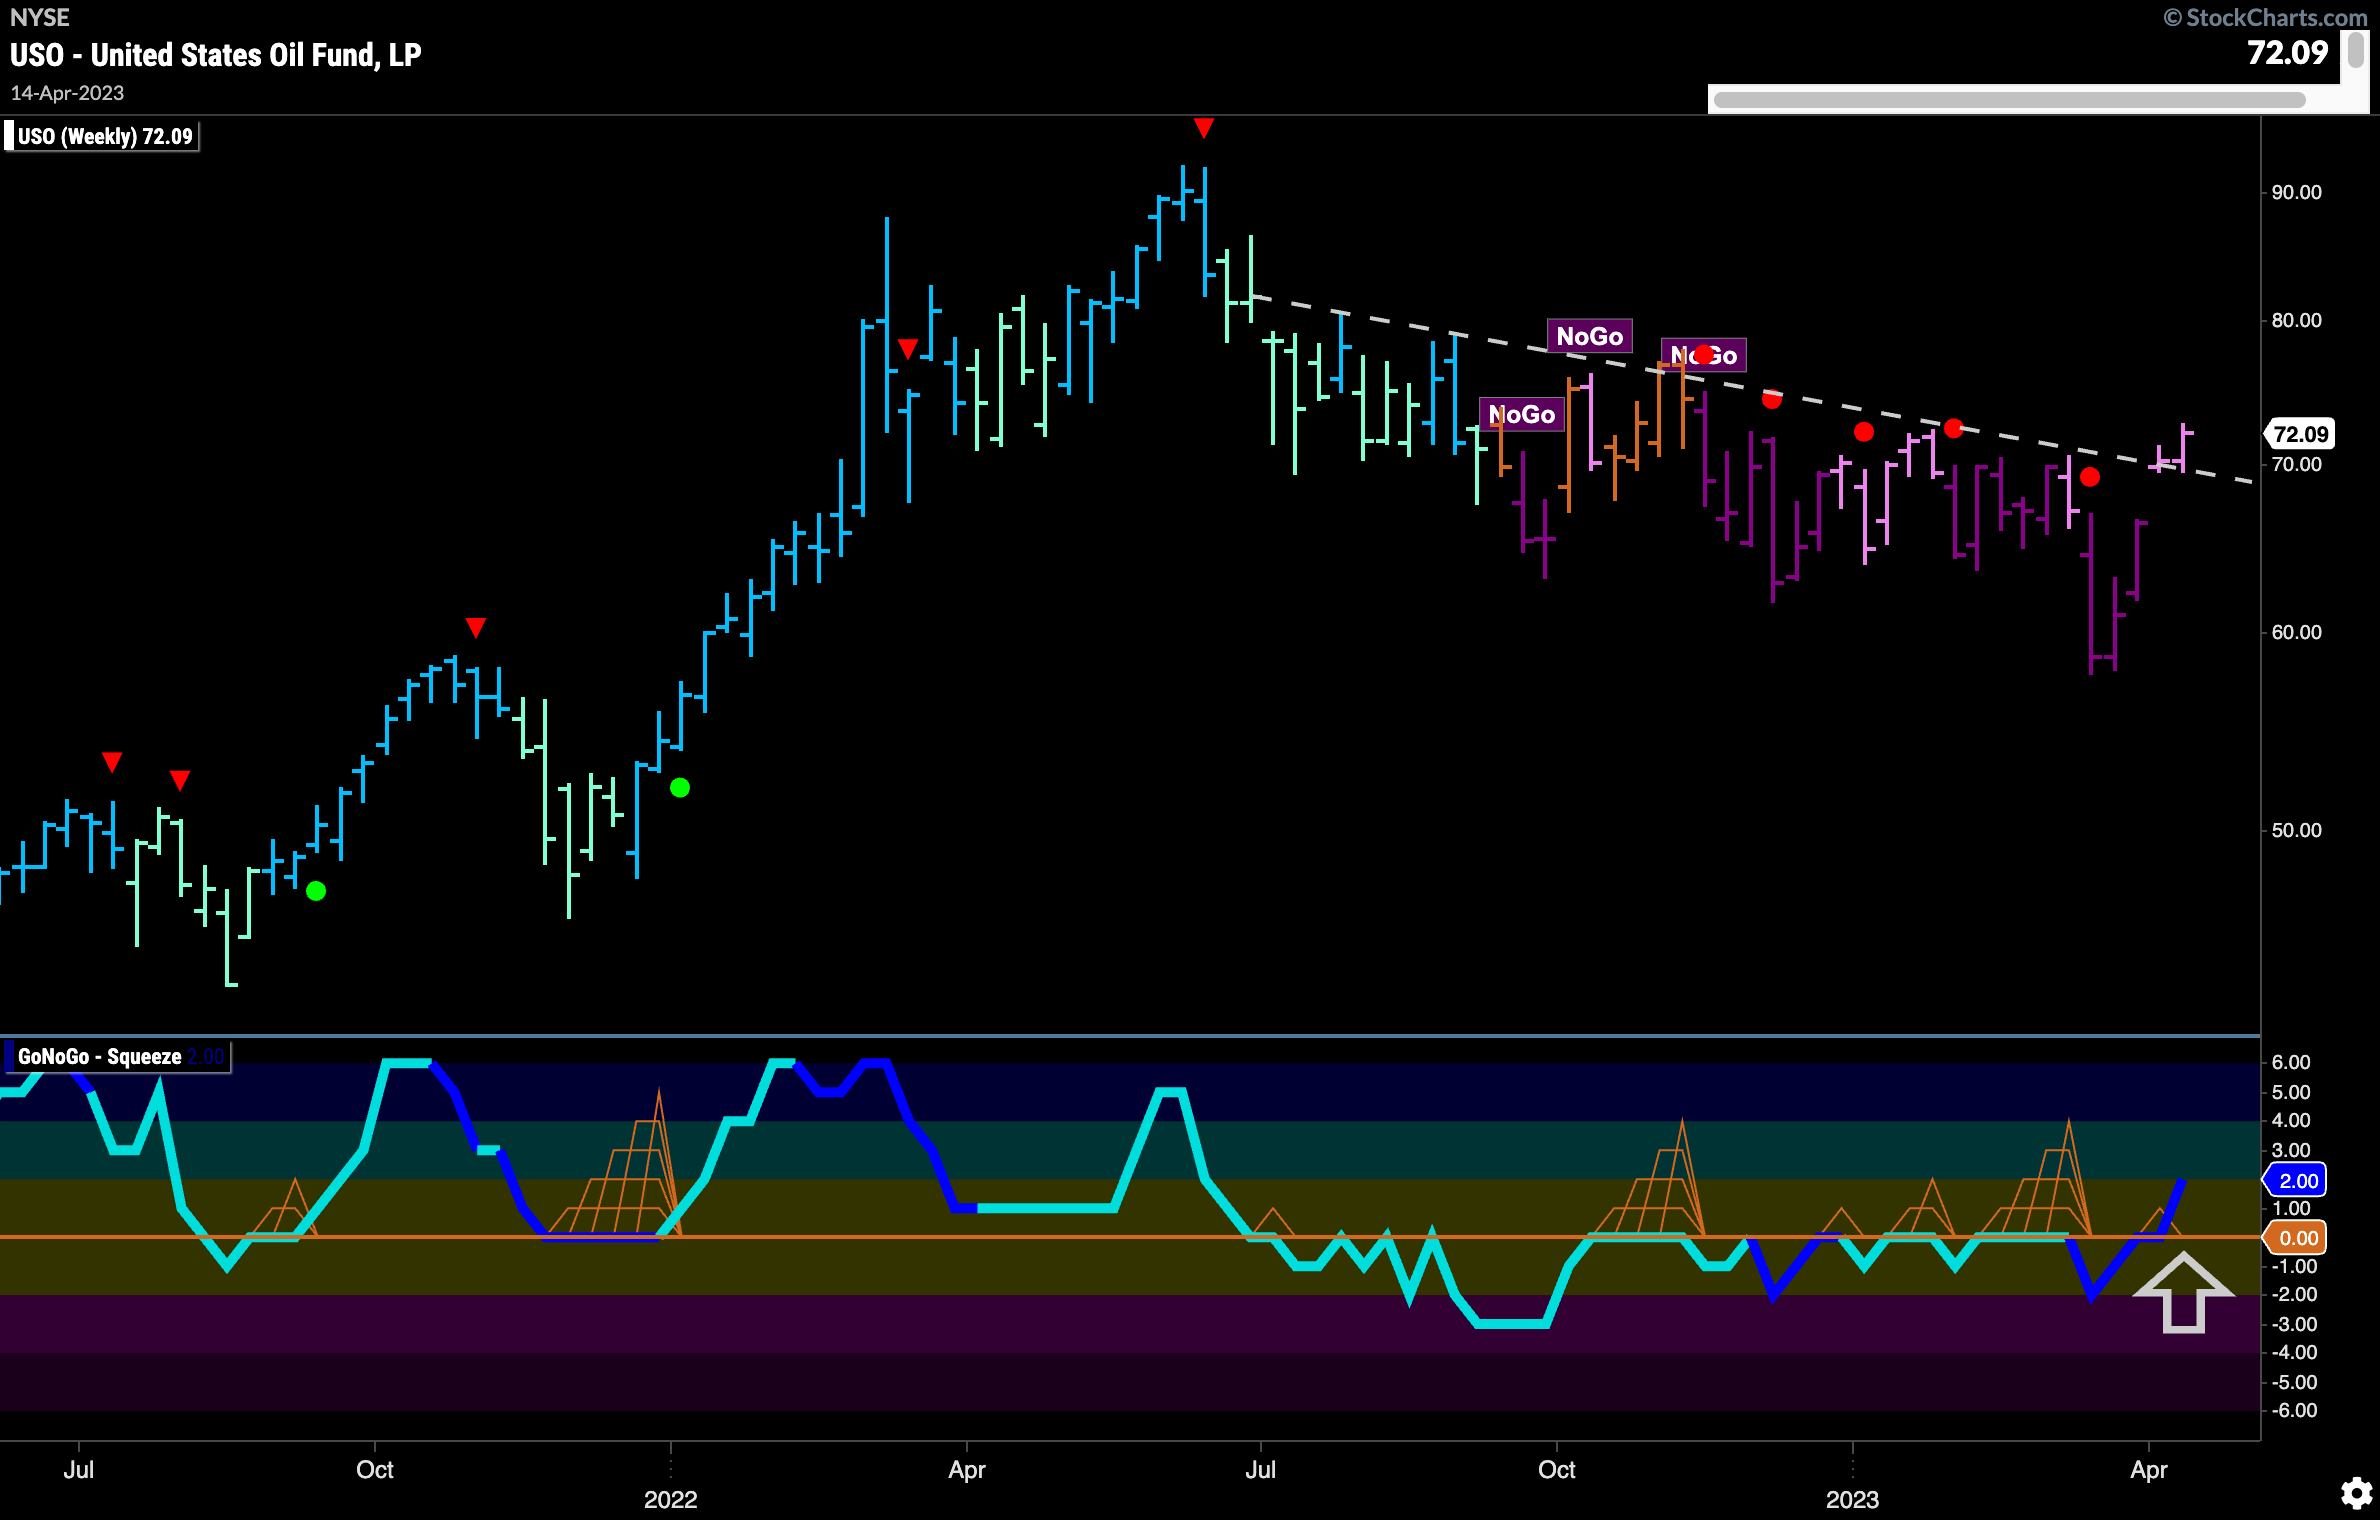
$USO saw a second weaker pink “NoGo” bar on the weekly chart as price closed above downward sloping resistance for the first time. This has coincided with GoNoGo Oscillator breaking above zero on heavy volume telling us that there is positive momentum which is counter to the “NoGo” trend. The zero line had held up to this point as resistance for the oscillator since early summer of last year and so we see some significance in this move.
Gold Creeps Higher Still
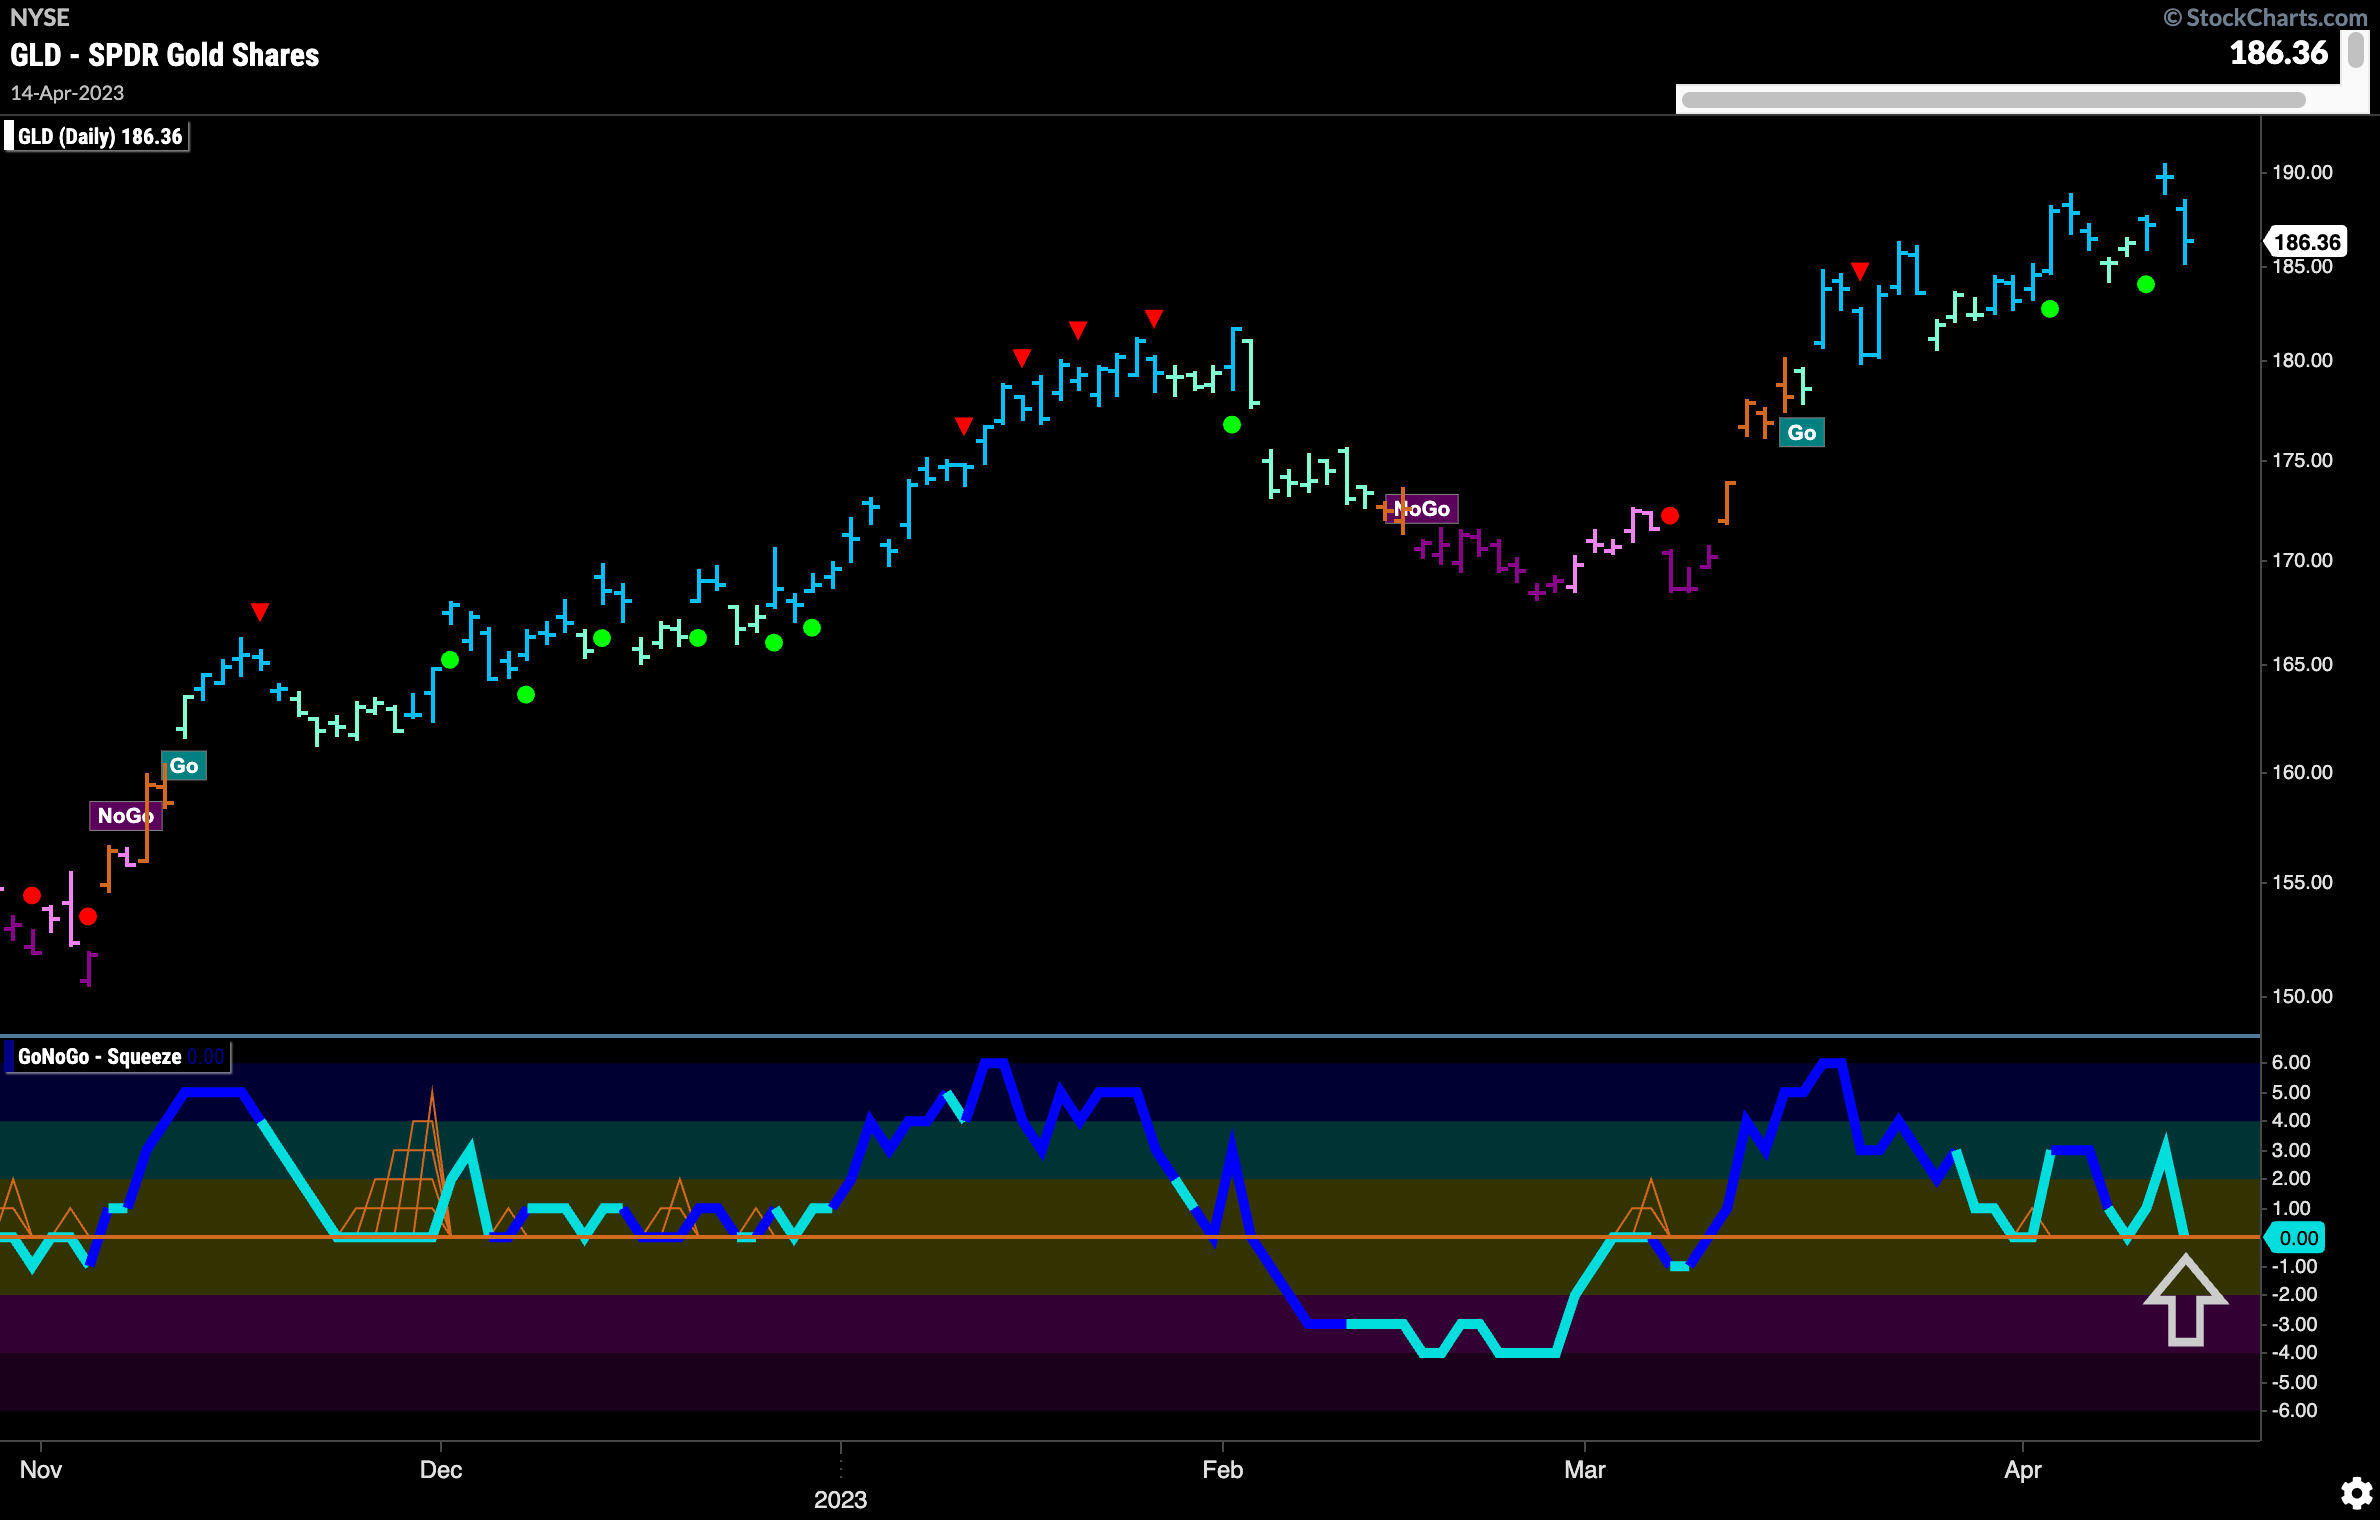
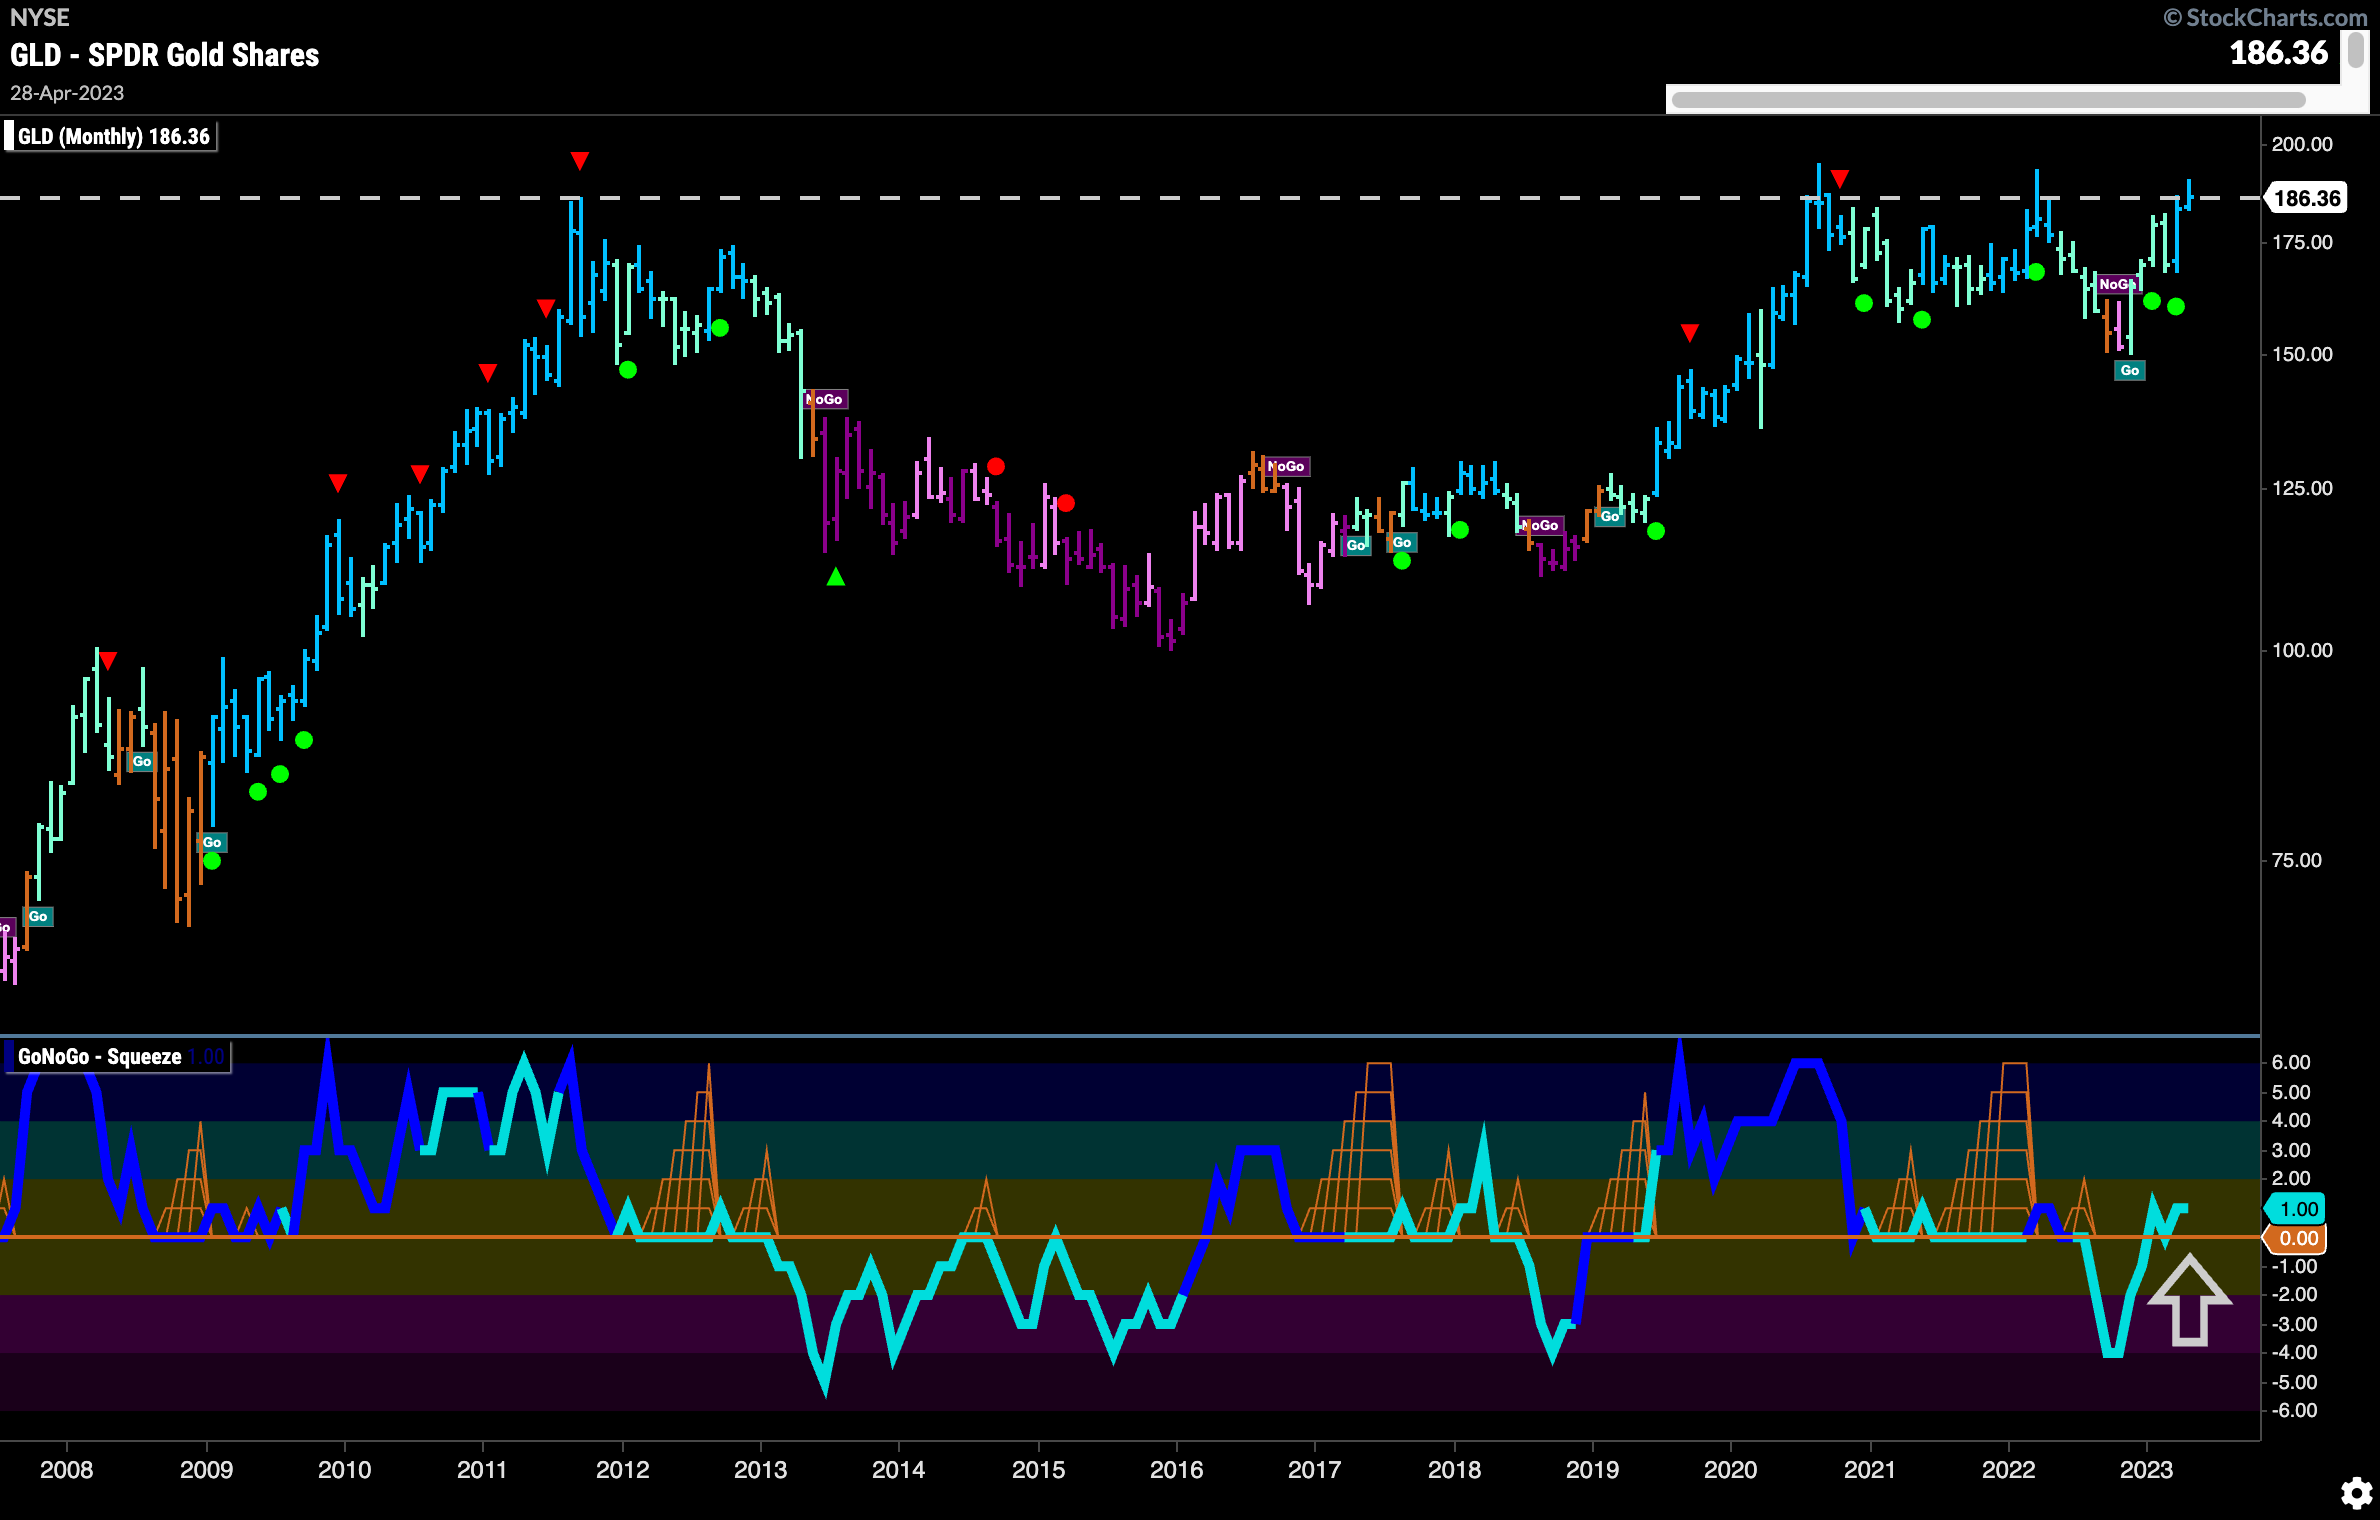
$GLD saw a new high this week as GoNoGo Trend more strong blue “Go” bars. GoNoGo Oscillator has found support at the zero line on multiple occasions already in this latest “Go” trend. We are seeing that zero level tested once again. We will watch to see if the oscillator finds support once more.
On a really long term chart we can see how significant these price levels are. Many have pointed to the massive cup and handle formation and recent price action shows us threatening to break above the rim of the cup. Any higher movement would consolidate a break above highs that have remained resistance for over a decade.
Sector RelMap
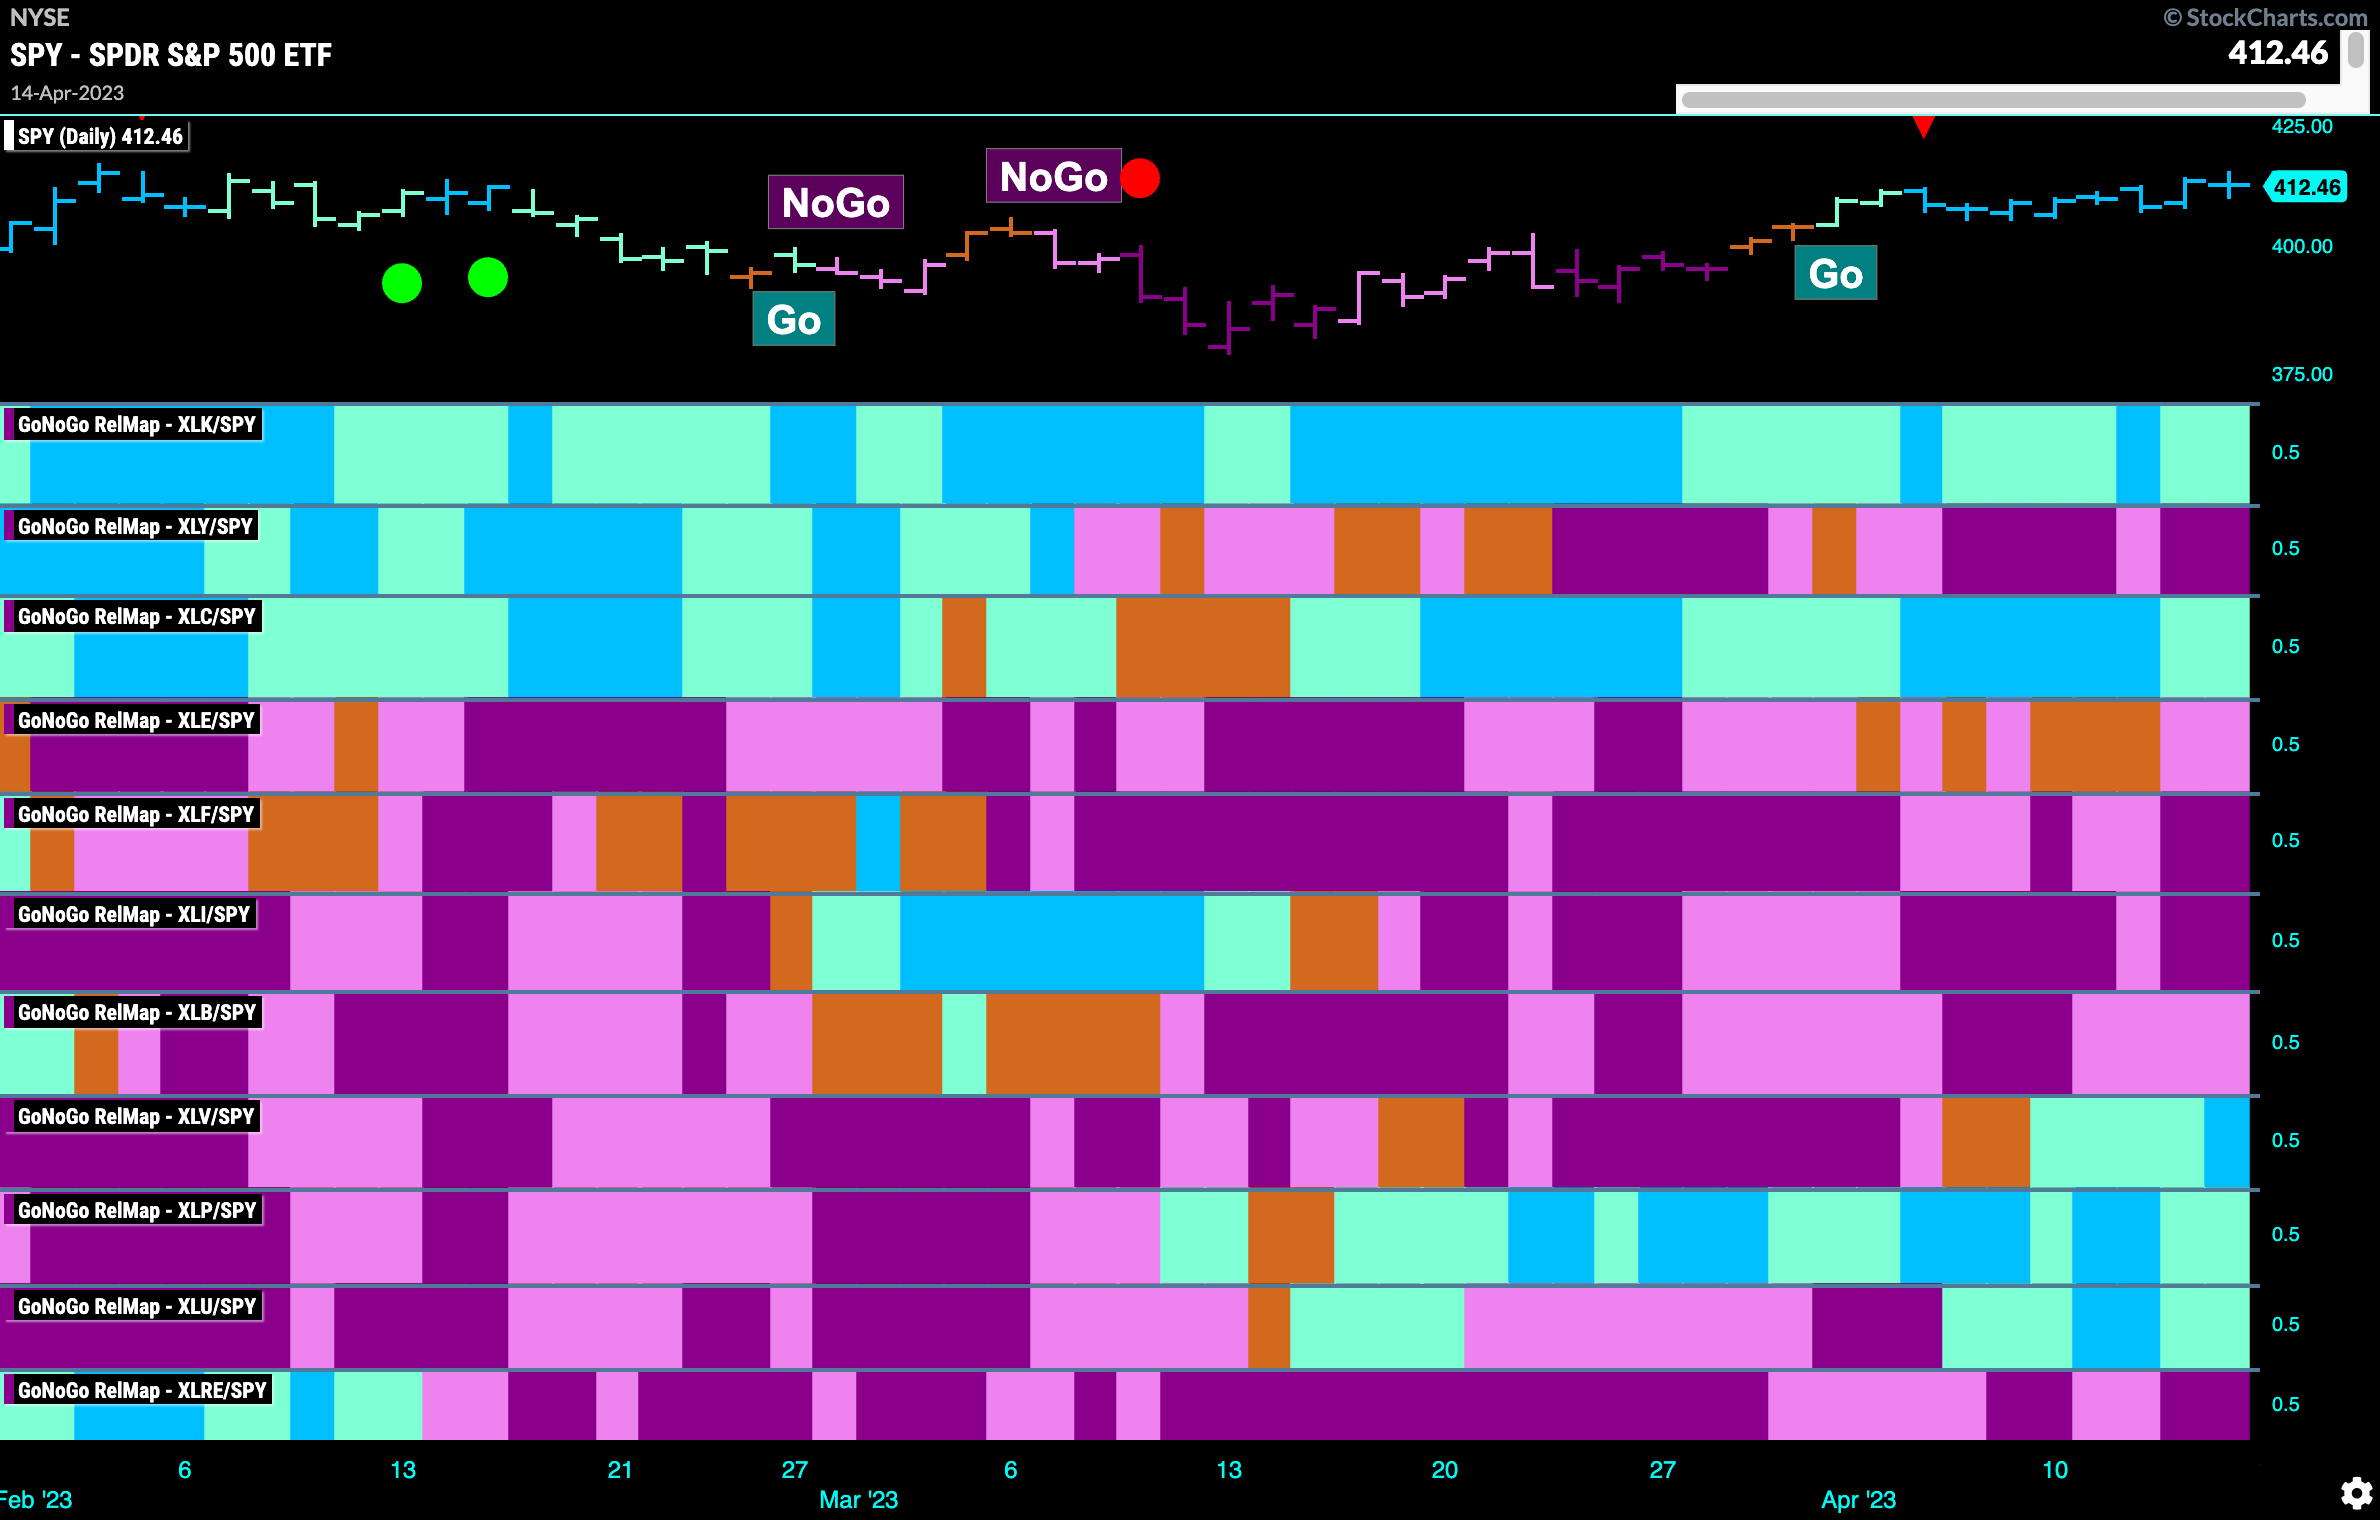
Below is the GoNoGo Sector RelMap. This GoNoGo RelMap applies the GoNoGo Trend to the relative strength ratios of the sectors to the base index. Looking at this map, we can quickly see where the relative outperformance is coming from as well as which sectors are lagging on a relative basis. 5 sectors are outperforming the base index this week. $XLK, $XLC, $XLV, $XLP, and $XLU are painting “Go” bars.
Sub-Industry Group RelMap
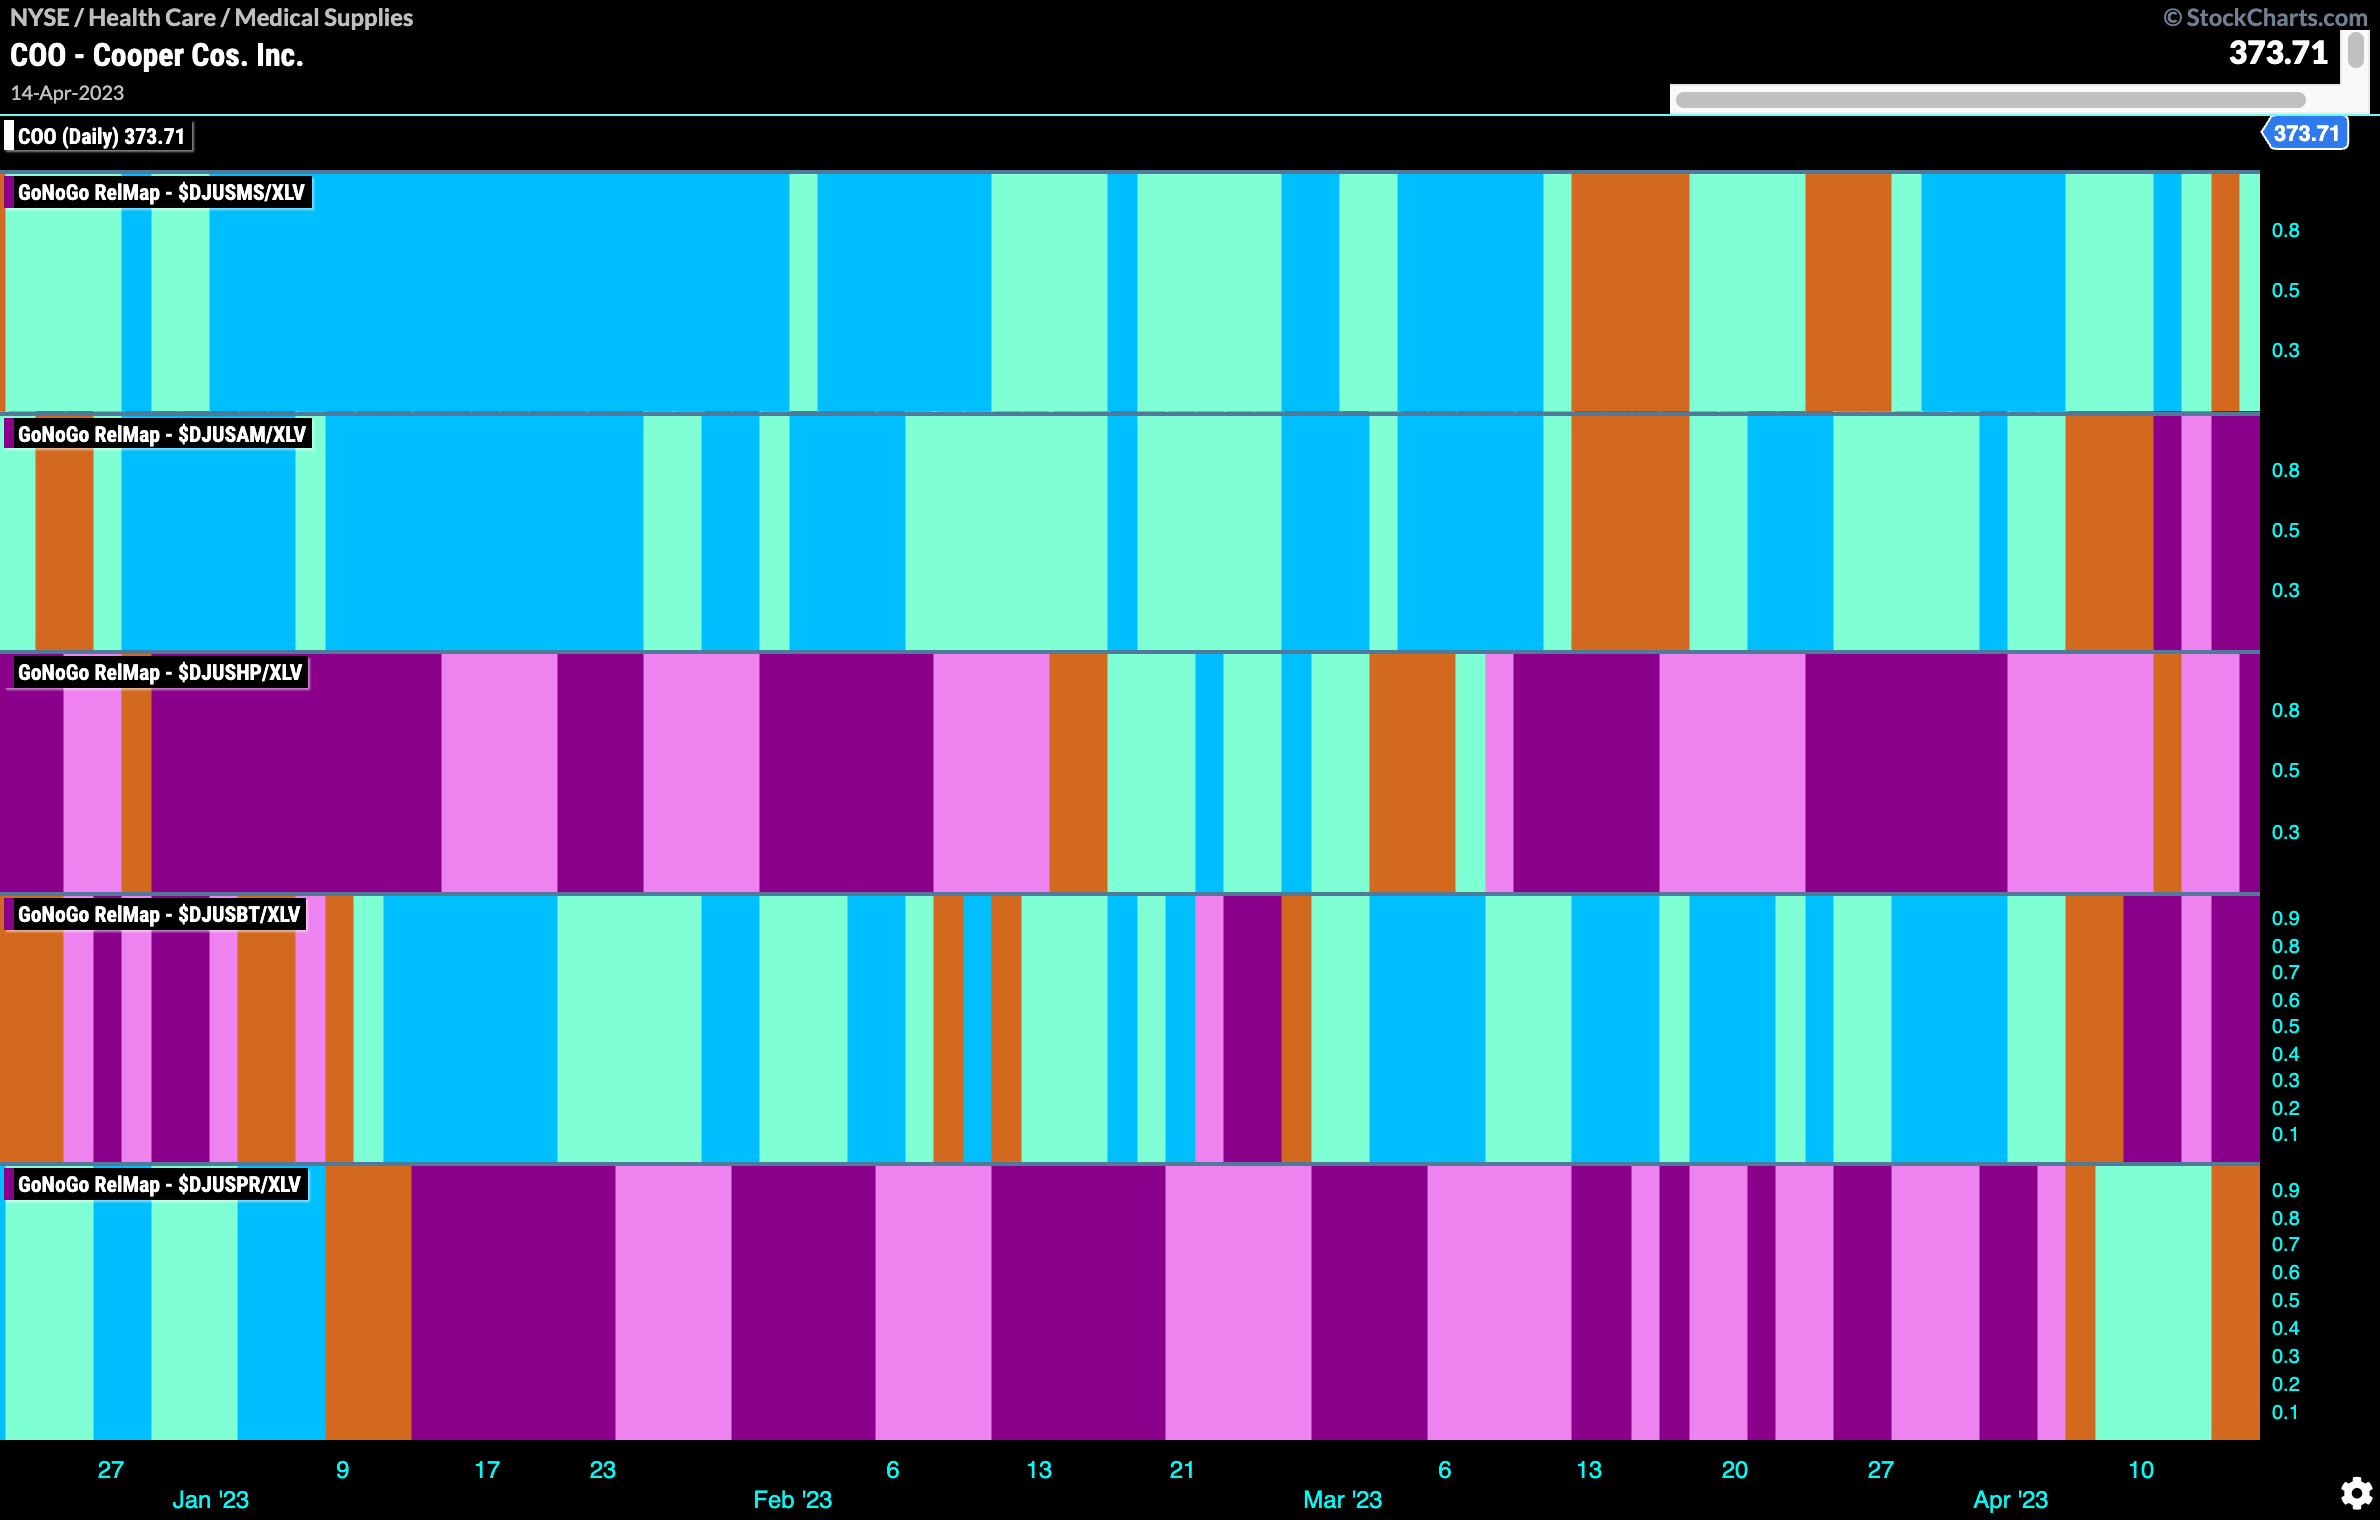
In the above GoNoGo Sector RelMap, we saw that healthcare has joined in the outperformance relative to the broader index. The below map shows the relative performance of each industry group within healthcare to the healthcare sector. In this way we can analyze the outperformance of sub groups within an outperforming sector. The map below shows that it is medical supplies, in the top panel, that has shown the most persistent outperformance in terms of a “Go” trend that has endured several months.
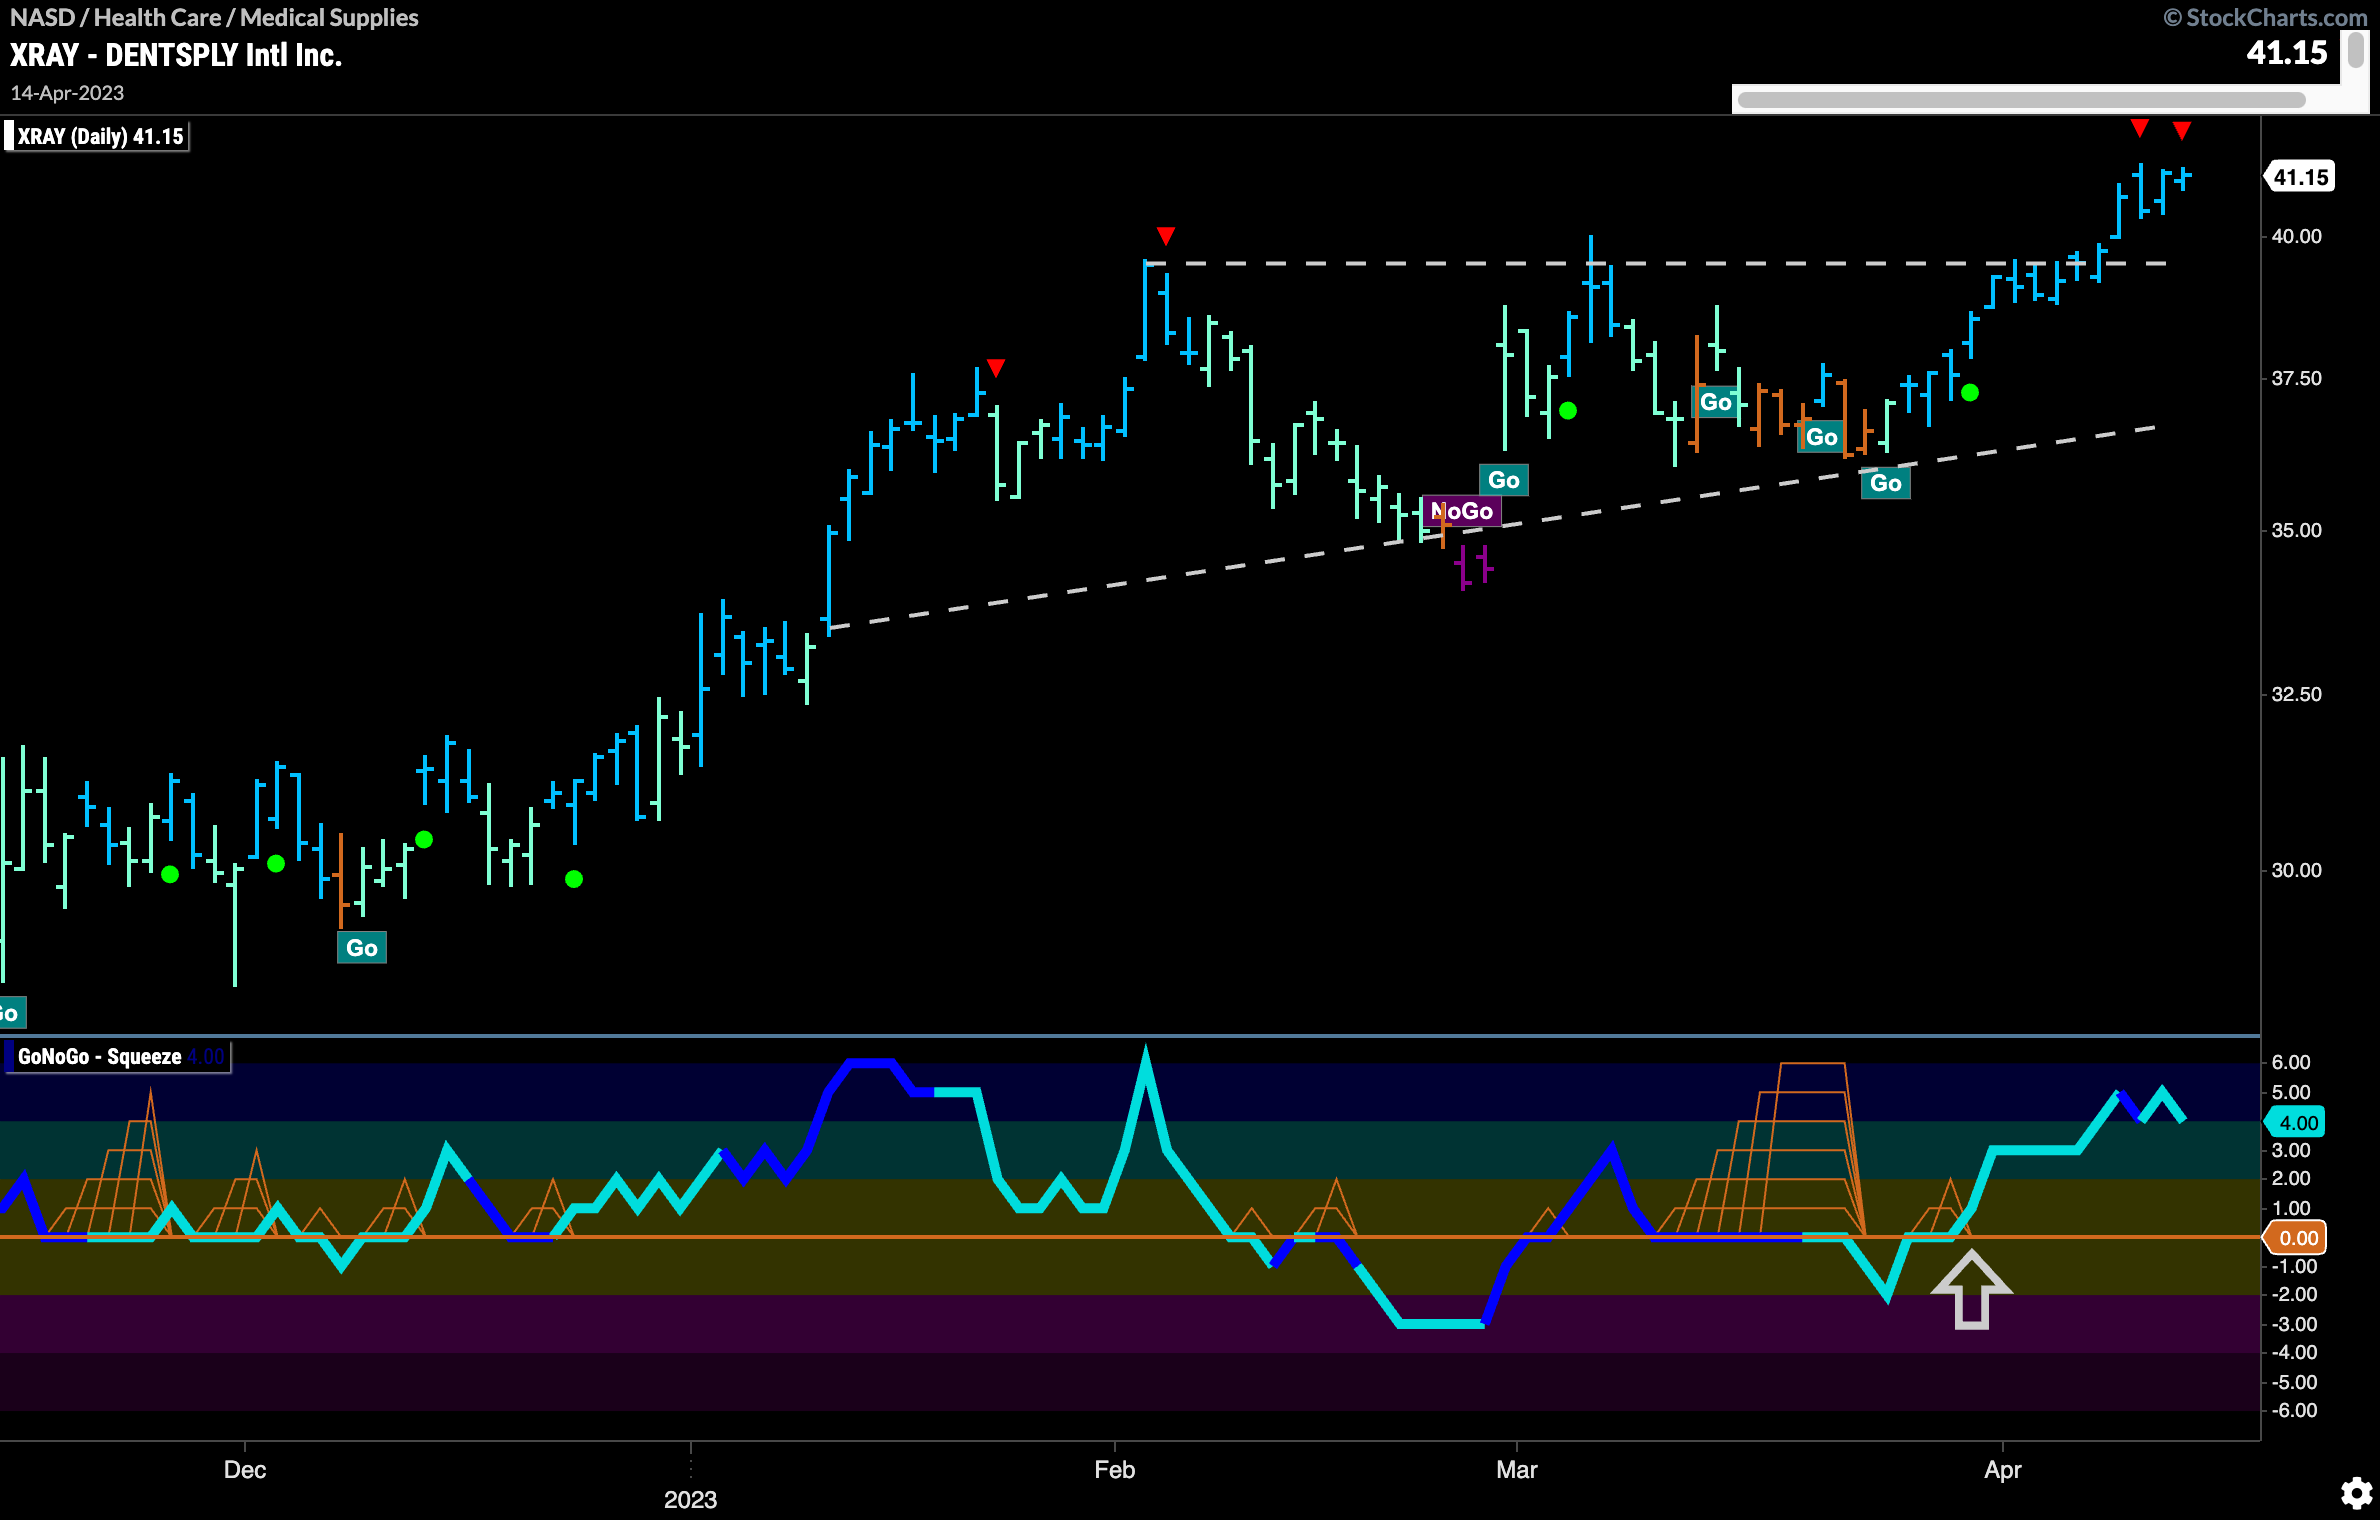
$XRAY Breaks Upper Bound of Ascending Triangle
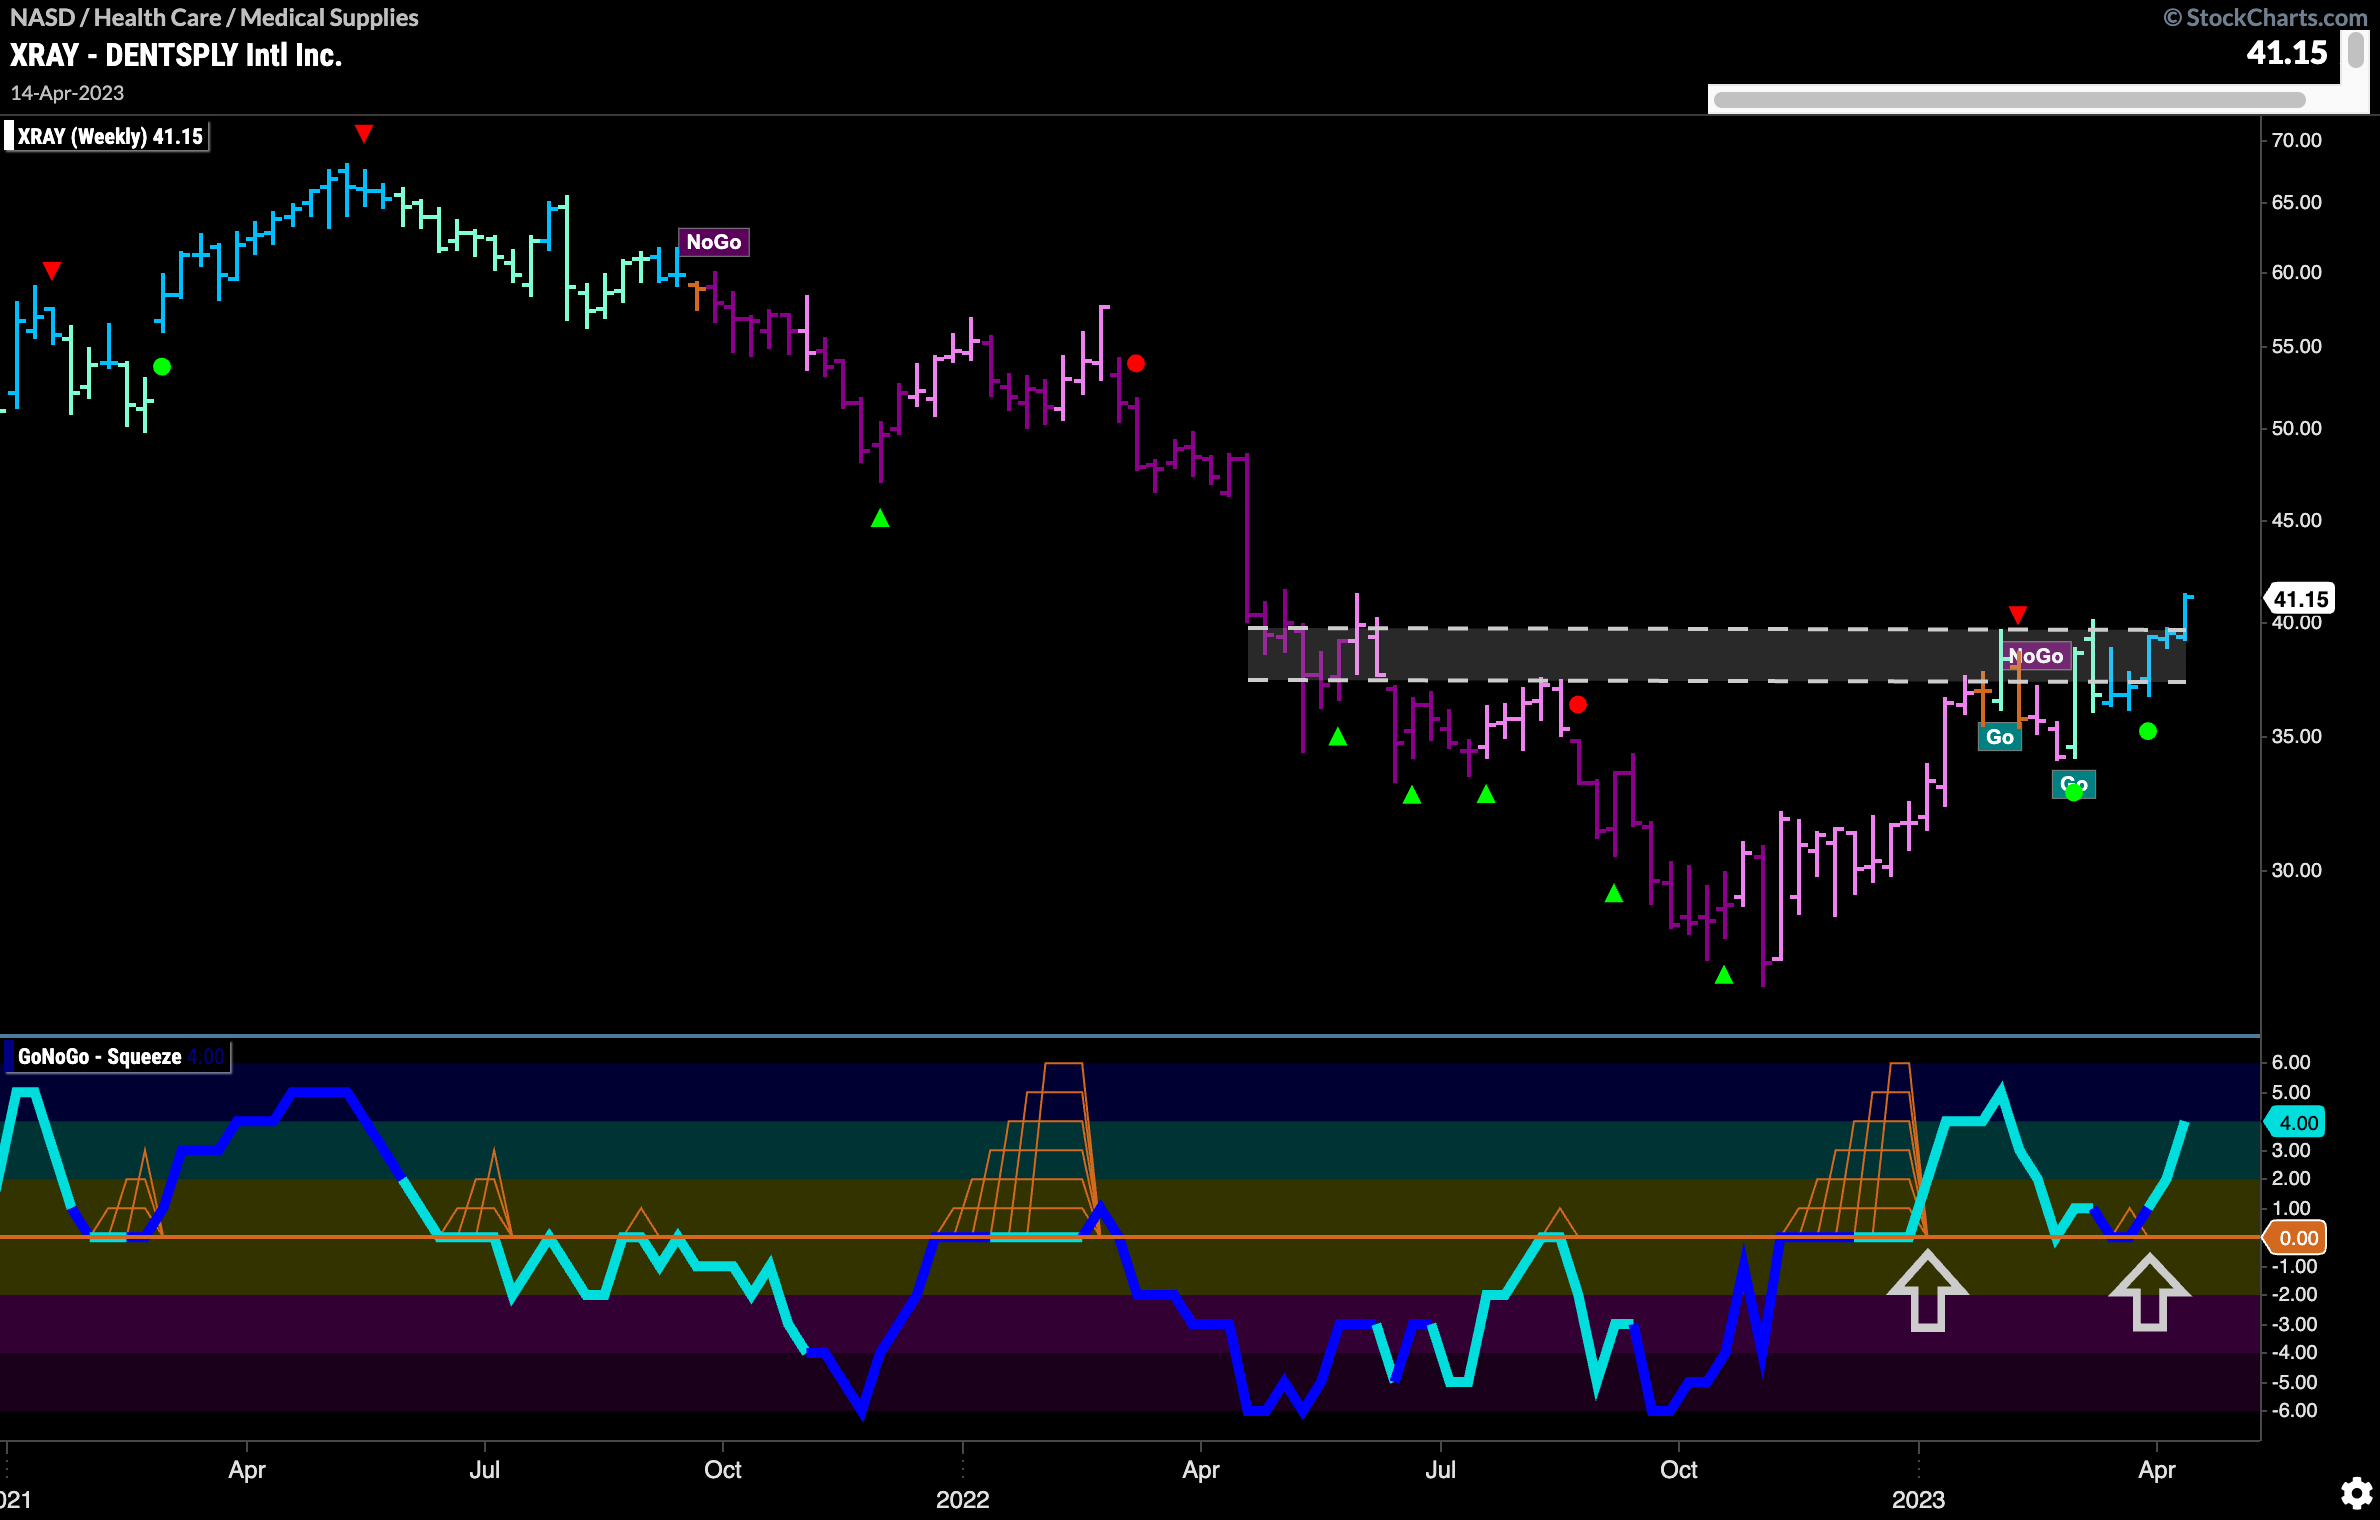
Within the medical supplies sub group, we can look for GoNoGo set ups in individual stocks. That way we are looking for outperformance at the stock level within an industry group that is outperforming a sector that is outperforming the broader market. Below is a chart of $XRAY. We can see that we are in a “Go” trend as the indicator paints strong blue bars. Also, after breaking out of a Max GoNoGo Squeeze we saw trend continuation (green circle) and then price was able to push higher above prior pattern highs.
The weekly chart below shows that this “Go” trend may be just getting started. Again, we see a break out of a Max GoNoGo Squeeze into positive territory which help price emerge from the “NoGo” trend and paint “Go” bars as it ran in to pattern resistance. After GoNoGo Oscillator found support at the zero line multiple times, price has been able to solidify the “Go” trend by painting stronger blue bars. Last week’s weekly close also moved price higher and we will look to see if it can consolidate above levels that were resistance, and look for them to provide support moving forward.
