Good morning and welcome to this week’s Flight Path. The “Go” trend in equities is well and truly back as we saw a string of uninterrupted blue bars this week and price hit a new all time high. Treasury bond prices entered a weak “Go” trend which is perhaps bad news for rates as we’ll see in a moment due to the inverse relationship. The U.S. commodity index continued to show market uncertainty as it ended the week with another amber “Go Fish” bar. The dollar maintained its “Go” trend but we saw some weakness as this week GoNoGo Trend painted a majority of aqua bars.

$SPY Hits New All Time Highs
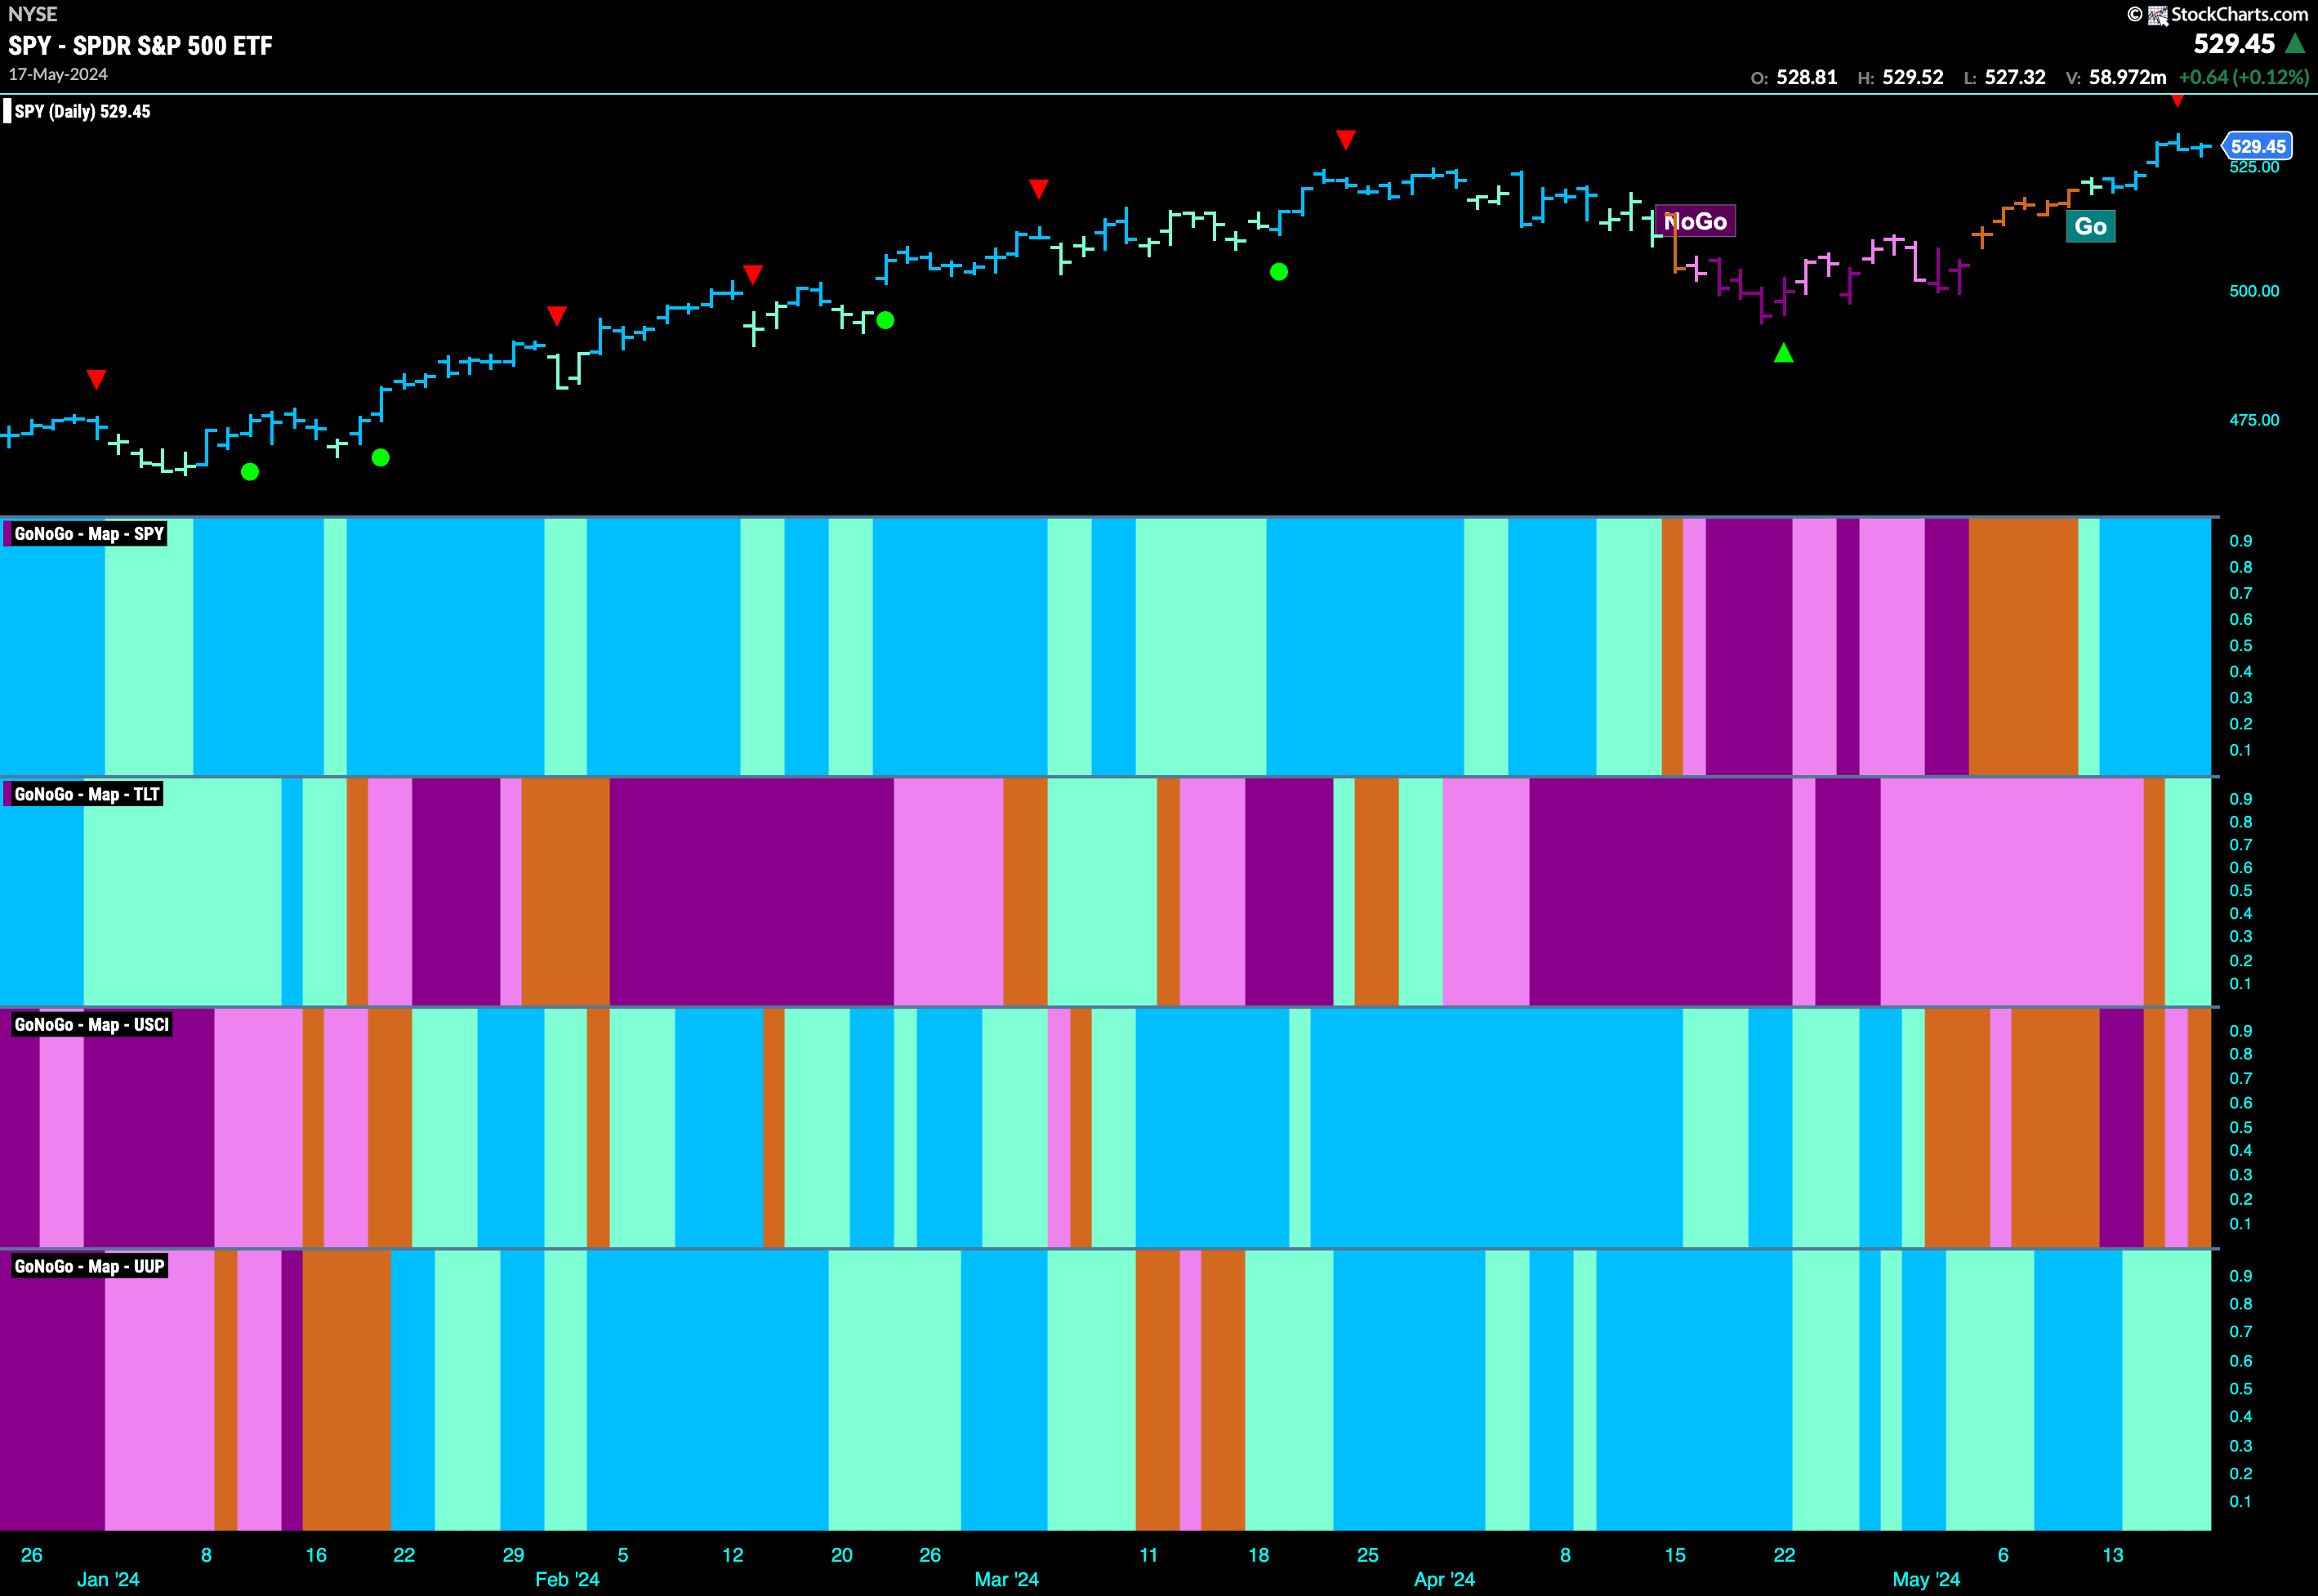
The “Go” trend we spied last week really took off this week as we saw a week of uninterrupted strong blue bars and price high all time highs midweek. GoNoGo Oscillator fell out of overbought territory and that caused a Go Countertrend Correction Icon to appear on the chart which tells us price may struggle to go higher in the short term. Now at a value of 4, momentum is positive and in the direction of the underlying “Go” trend. We will look for price to find support and consolidate above prior highs.

The larger weekly chart shows that after several weeks of pullback, coming after the Go Countertrend Correction Icon that we saw over a month ago, the trend has once again strengthened as GoNoGo Trend once again paints strong blue bars. GoNoGo Oscillator bounced sharply off the zero line which helped confirm the “Go” trend and with momentum resurgent in the direction of the “Go” trend we saw price hit a new high this week.

Rates Enter “NoGo”
GoNoGo Trend saw the weakness we noted last week turn into a new “NoGo” trend. After GoNoGo oscillator entered negative territory a couple of weeks ago we could infer that the “Go” trend was no longer healthy. After a long run of weaker aqua “Go” bars we saw the trend give way this week and a mix of pink and purple “NoGo” bars. Now, with GoNoGo Oscillator approaching the zero line from below, we will watch to see if this trend can hold.

Dollar Remains in “Go” but Struggles
The”Go” trend remained in place this week but we saw a majority of weaker aqua bars as price made a new lower low. GoNoGo Oscillator has been rejected by the zero line twice since first crossing into negative territory and now is steadily falling. This is a concern for the “Go” trend in this periodicity and we will watch to see if this week brings a change in technical environment.

The weekly chart shows just how important it is for the greenback to stabilize at these levels. After breaking to new highs we are watching closely to see if it can consolidate and find support above the breakout. GoNoGo Oscillator is now falling close to the zero line where we will watch to see if it bounces back into positive territory. This would be a good sign for the long term health of the “Go” trend.

Oil at Inflection Point in “NoGo”
After entering a “NoGo” trend a couple of weeks ago price has moved mostly sideways. GoNoGo Oscillator has so far remained at or below the zero line and we will watch closely as it tests that level again. GoNoGo Trend is painting weaker pink bars as price tries to make a slightly higher high. If the “NoGo” holds, and GoNoGo Oscillator is rejected by the zero line we will expect price to make a new leg down.

Gold Fights For New Highs
It was a strong week for $GLD last week as GoNoGo Trend painted another uninterrupted string of strong blue “Go” bars. This price activity has pushed price right back to new highs on a closing basis. We will watch this week to see if price can consolidate at these levels and go higher. GoNoGo Oscillator has been able to find support at the zero line on a quick retest after breaking into positive territory just over a week ago and this has given us signs of Go Trend Continuation (green circles) on the price chart.

Sector RelMap
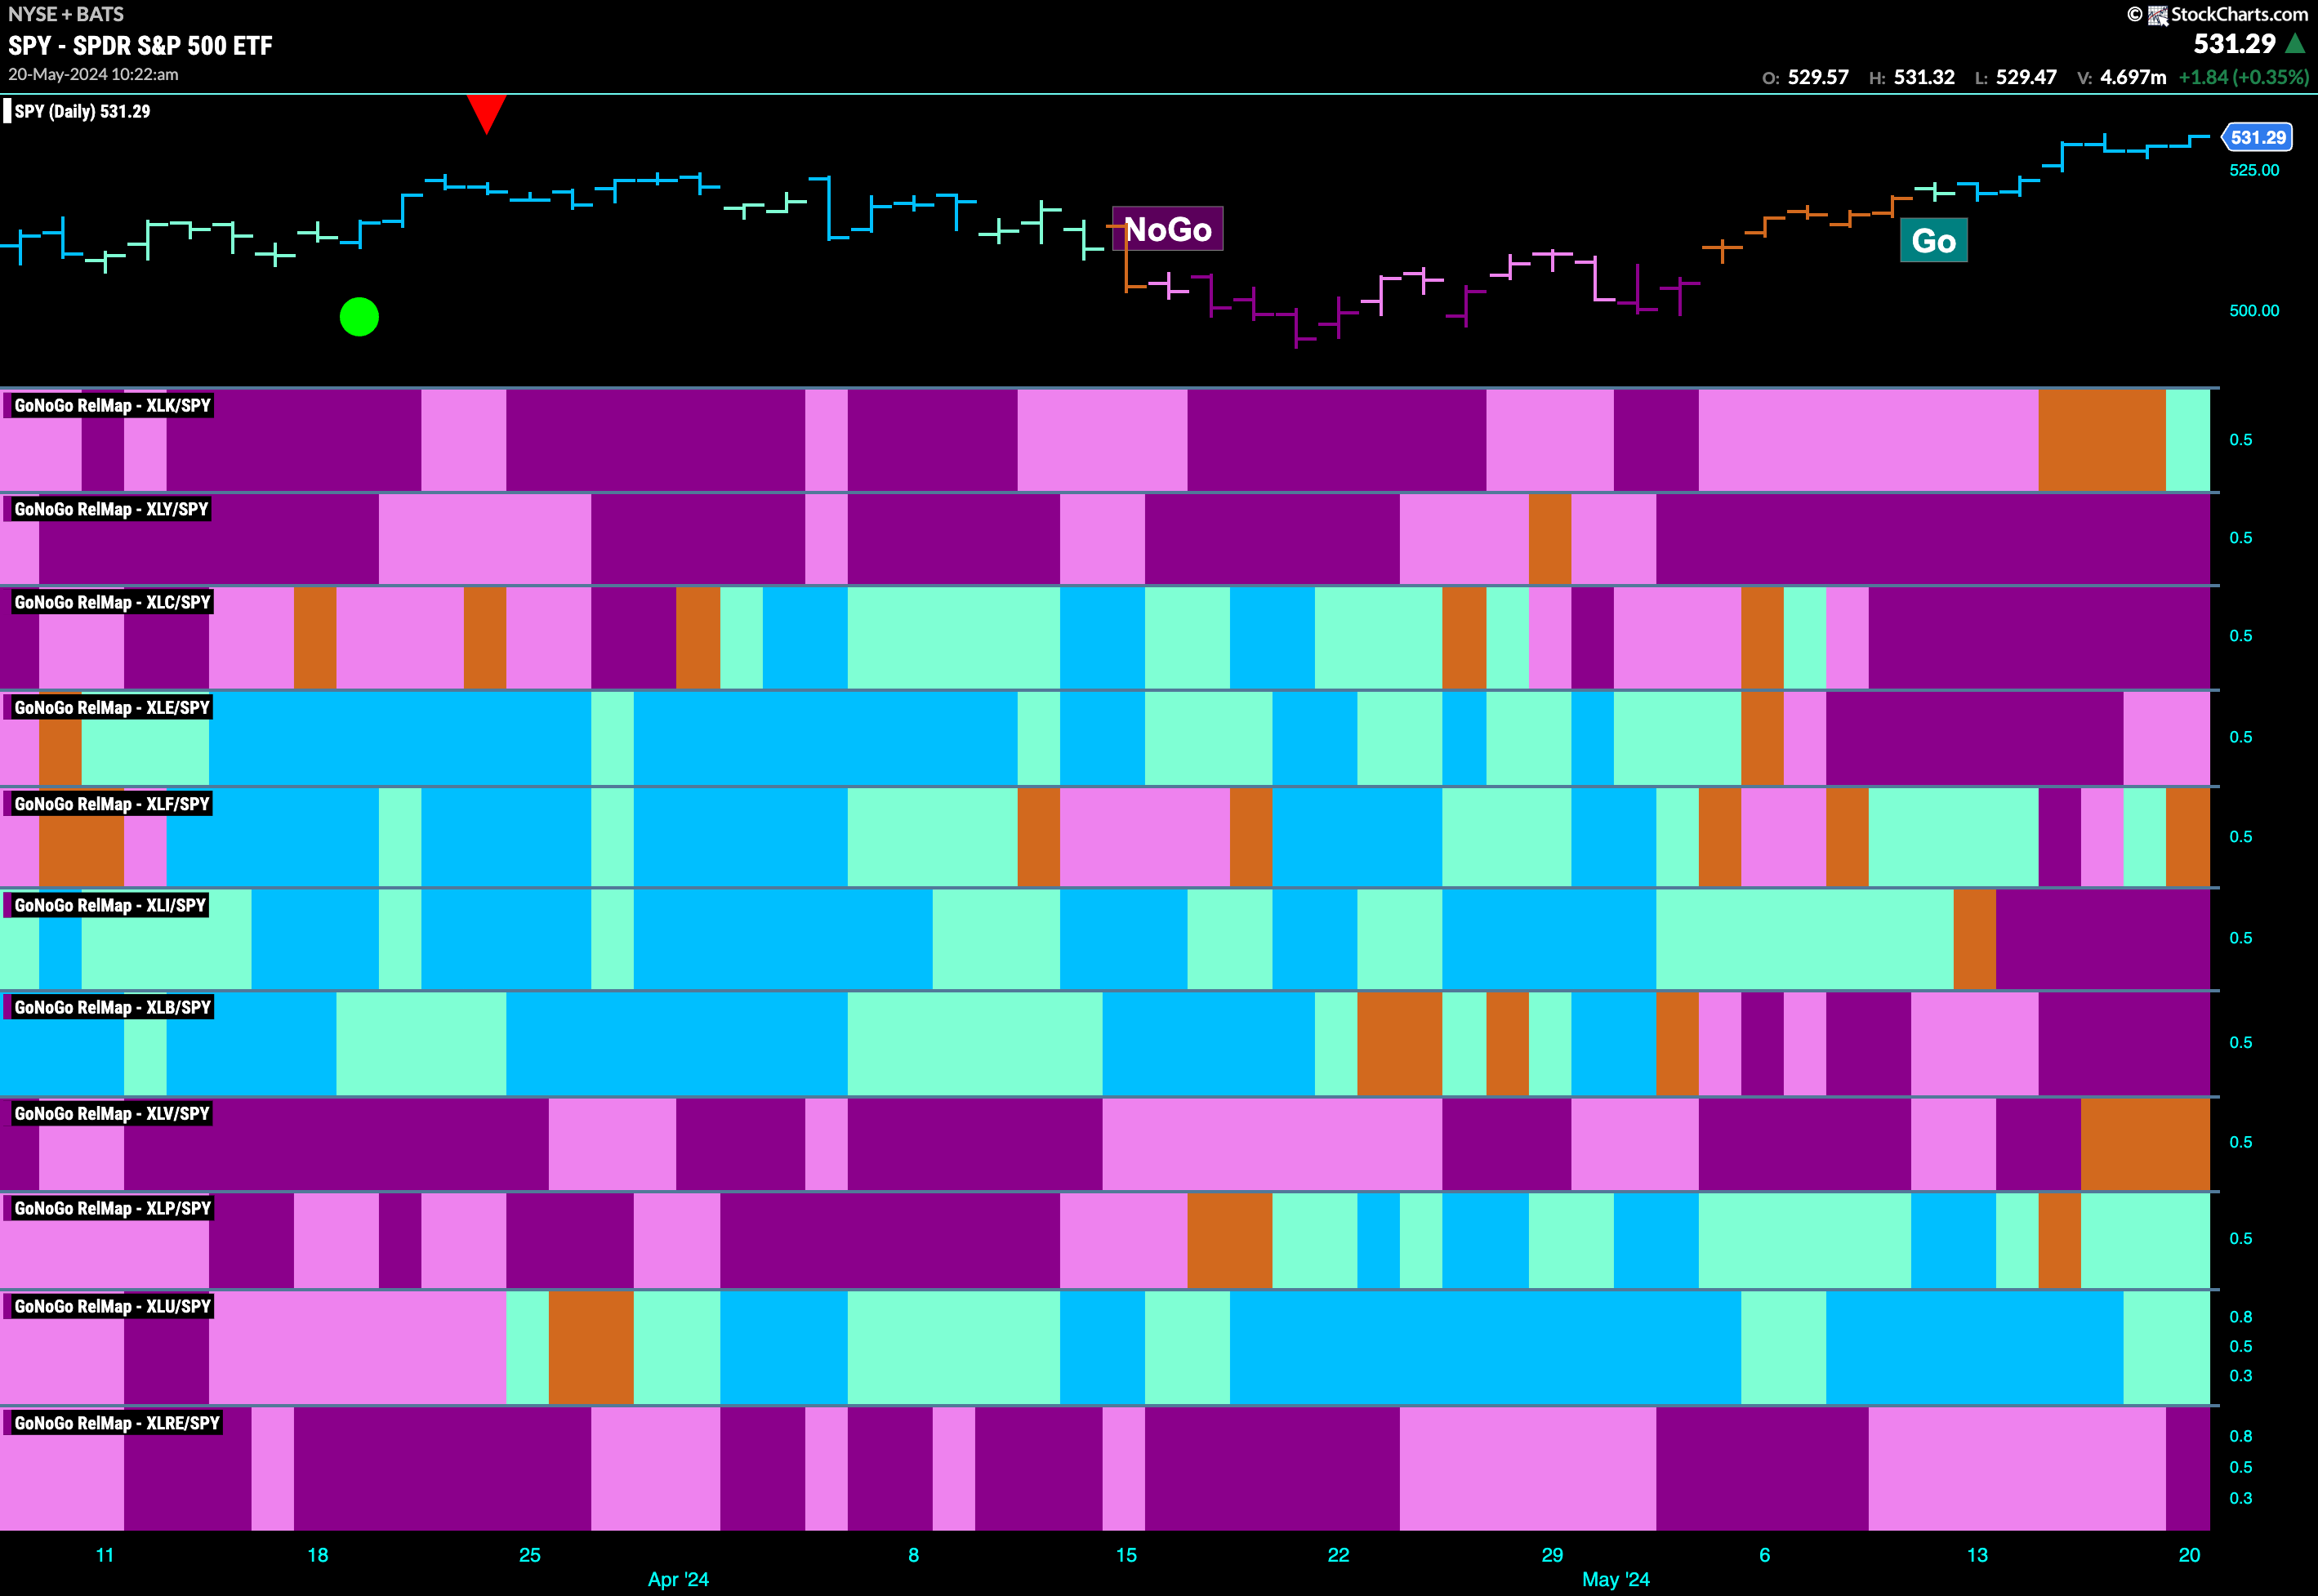
Below is the GoNoGo Sector RelMap. This GoNoGo RelMap applies the GoNoGo Trend to the relative strength ratios of the sectors to the base index. Looking at this map as I write this Monday morning just after the open, we can see that Technology has joined the defensive sectors (utilities and staples) in relative leadership. This is a good sign for those hoping the equity “Go” trend will continue. 3 sectors are outperforming the base index this week. $XLK, $XLP, and $XLU are painting relative “Go” bars.

Technology Sub-Group RelMap
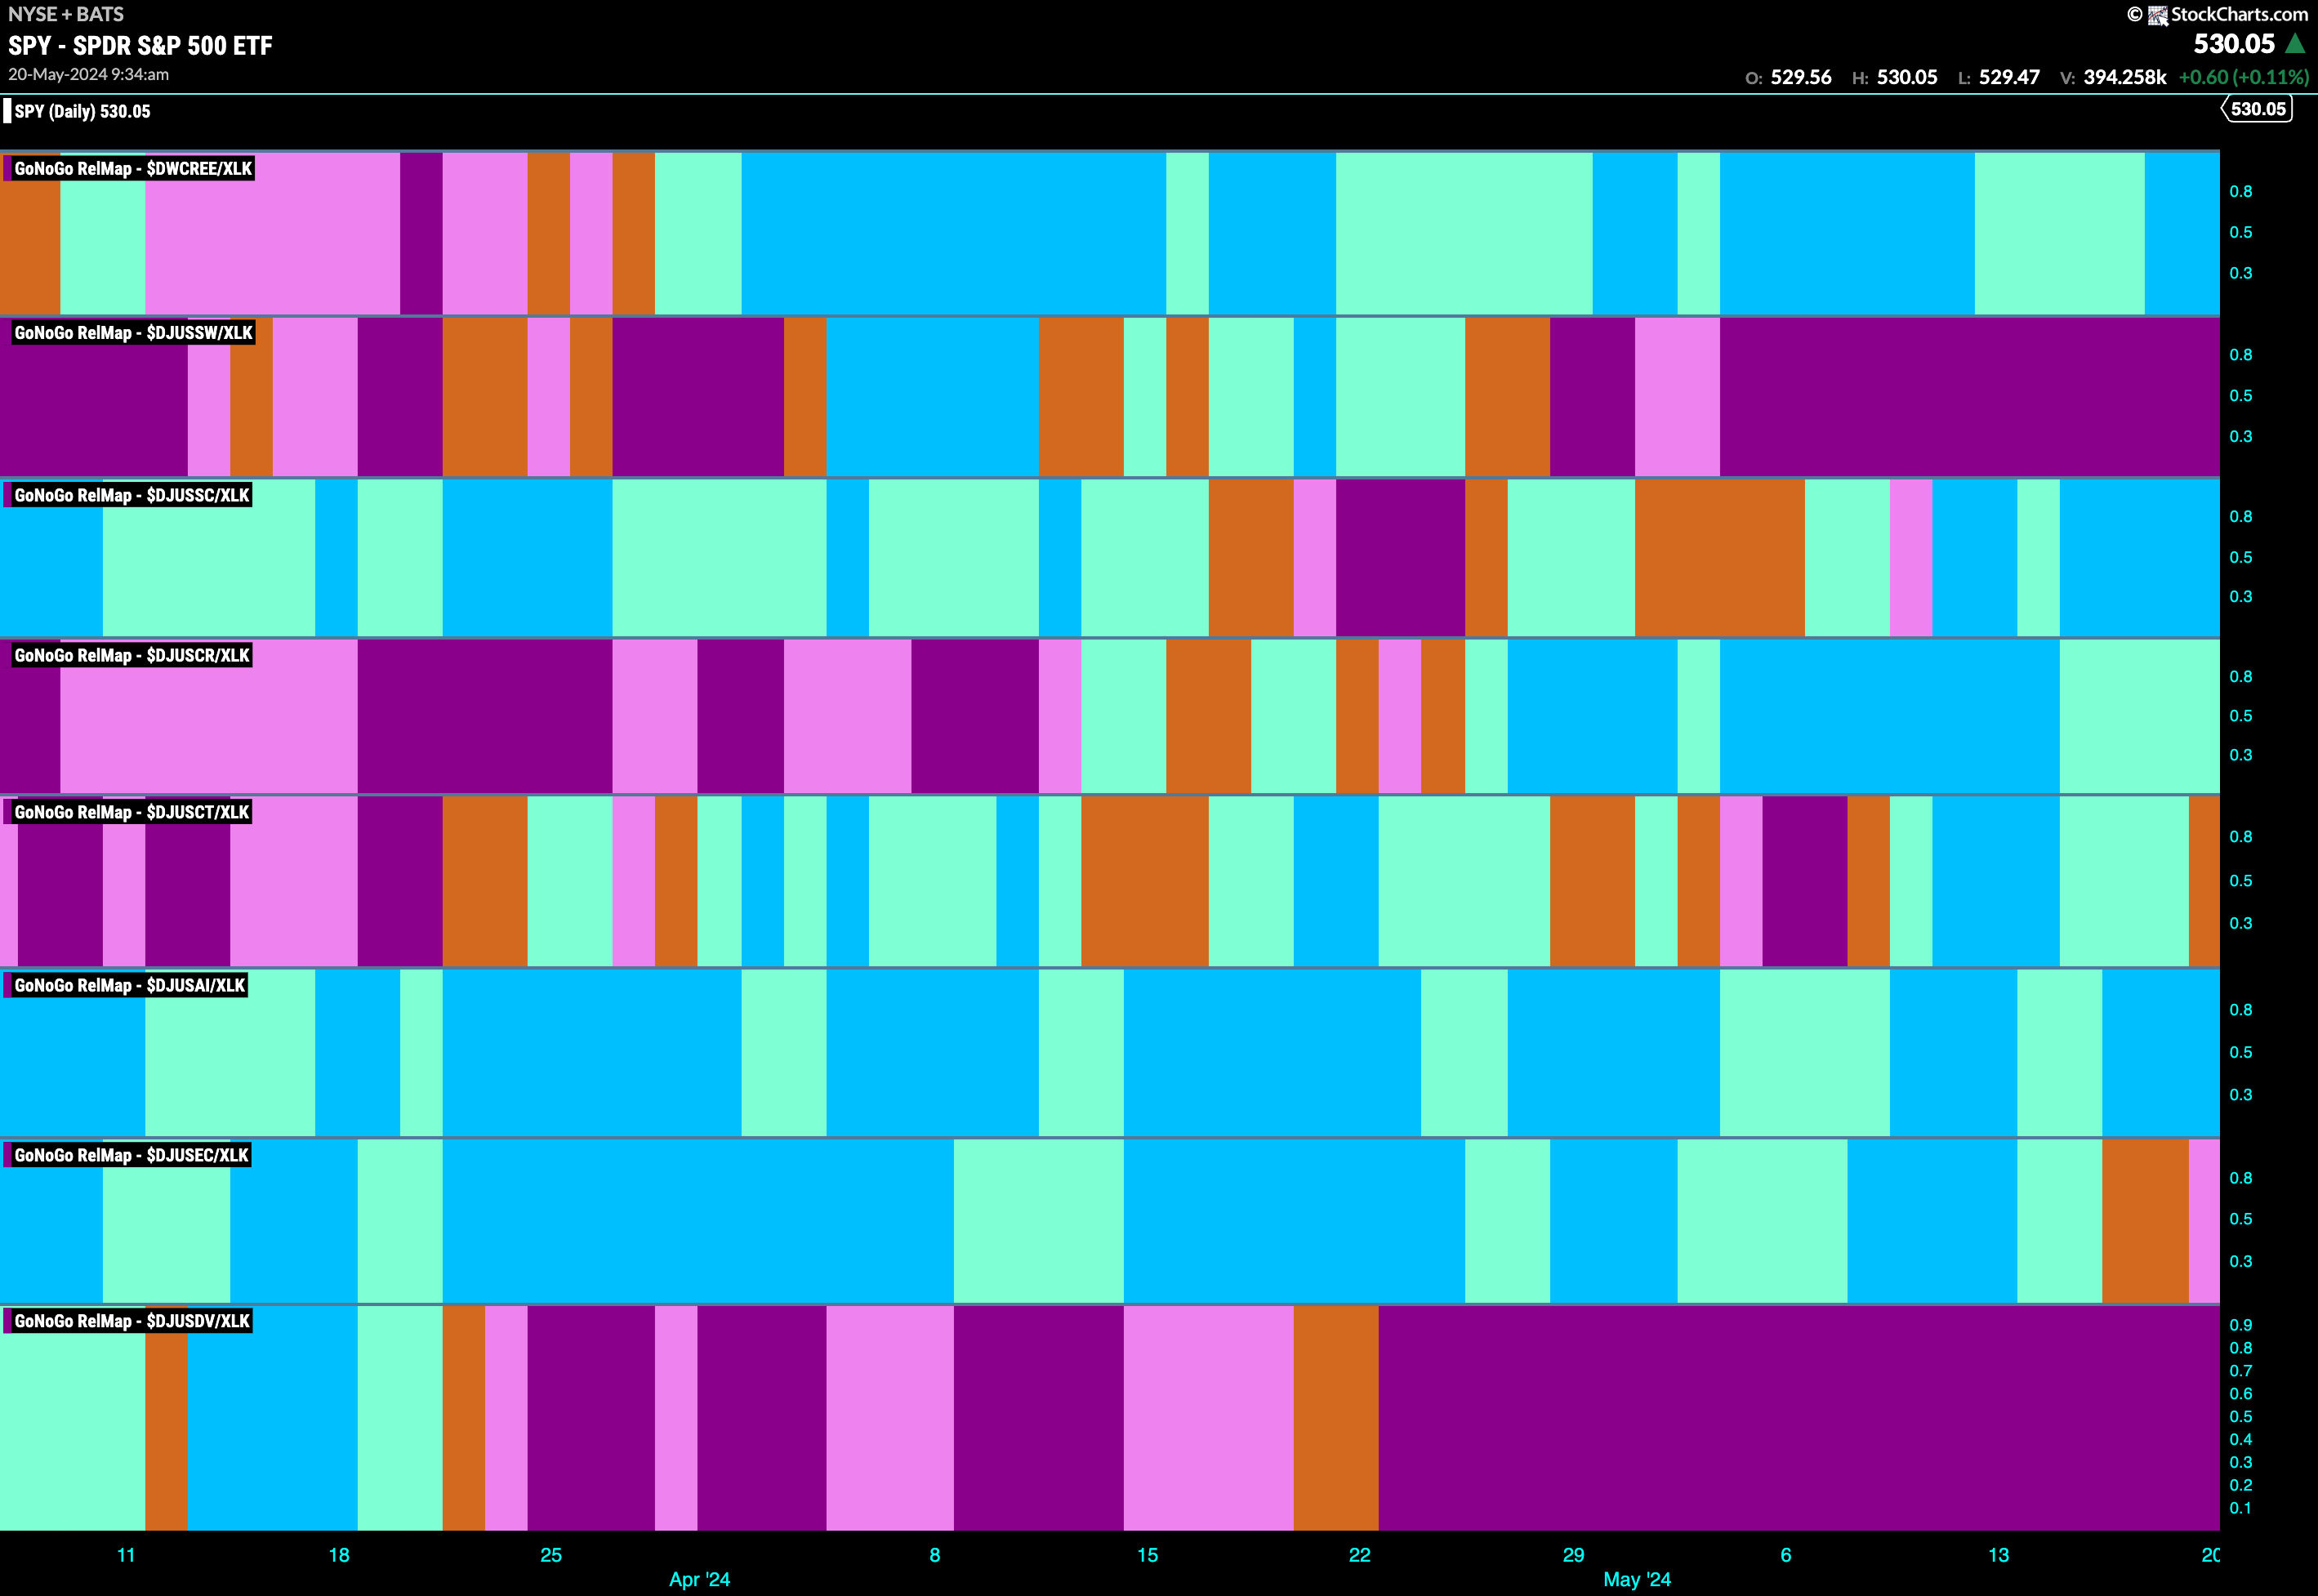
Given what we discussed above, let’s break down the technology index. As we saw in the RelMap above the sector has entered a relative “Go” trend to the broader index. If we take a look at a break down of the sub groups below we can see that there are several areas of relative outperformance within the technology sector. Paint strong blue “Go” bars are the relative ratios or renewable energy equipment, electronic equipment, and semi conductors.

$COHR Enters New “Go” Trend
In the electronic equipment space, $COHR has entered a new “Go” trend and is painting aqua bars after a “Go Fish” bar informed us that the market was uncertain regarding the health of the previous “NoGo” trend. This came about a week after GoNoGo Oscillator broke above the zero line. It then retested that level and found support, showing us that momentum was out of step with the “NoGo” trend. Now, with the new “Go” trend in place, we can see that momentum is in positive territory and therefore confirming the new trend. We will watch to see if $COHR can break to new highs this week.

$NVDA Looks for New Highs in Strong “Go” Trend
In the semi conductor space, $NVDA is a giant. In March, price hit a high and with it came a Go Countertrend Correction Icon (red arrow) that told us price may struggle to go higher in the short term. Indeed, price moved sideways and then fell from that high as the technical environment changed. First, after some weaker aqua “Go” bars, GoNoGo Oscillator failed to stay above zero and broke into negative territory. This suggested a larger correction and indeed we saw a brief “NoGo” trend. Recently, GoNoGo Oscillator broke back above the zero line after breaking out of a GoNoGo Squeeze. With this, GoNoGo Trend painted amber “Go Fish” bars before recognizing a new “Go” trend. Now, with momentum on its side, price is painting strong blue bars as it runs up against prior high resistance. We will watch to see if price can move higher this week.


