Good morning and welcome to this week’s Flight Path. Equities remained very strong this week as we saw a continued string of bright blue bars and a new price high. Treasury bond prices saw a surge in strength in the second half of the week as we see a return to bright blue bars. Commodities try to convince us that this time they’ve made up their mind and entered a “Go” trend on strong blue bars. Finally the dollar, after some uncertainty this week, closed with a strong blue “Go” bar as well.
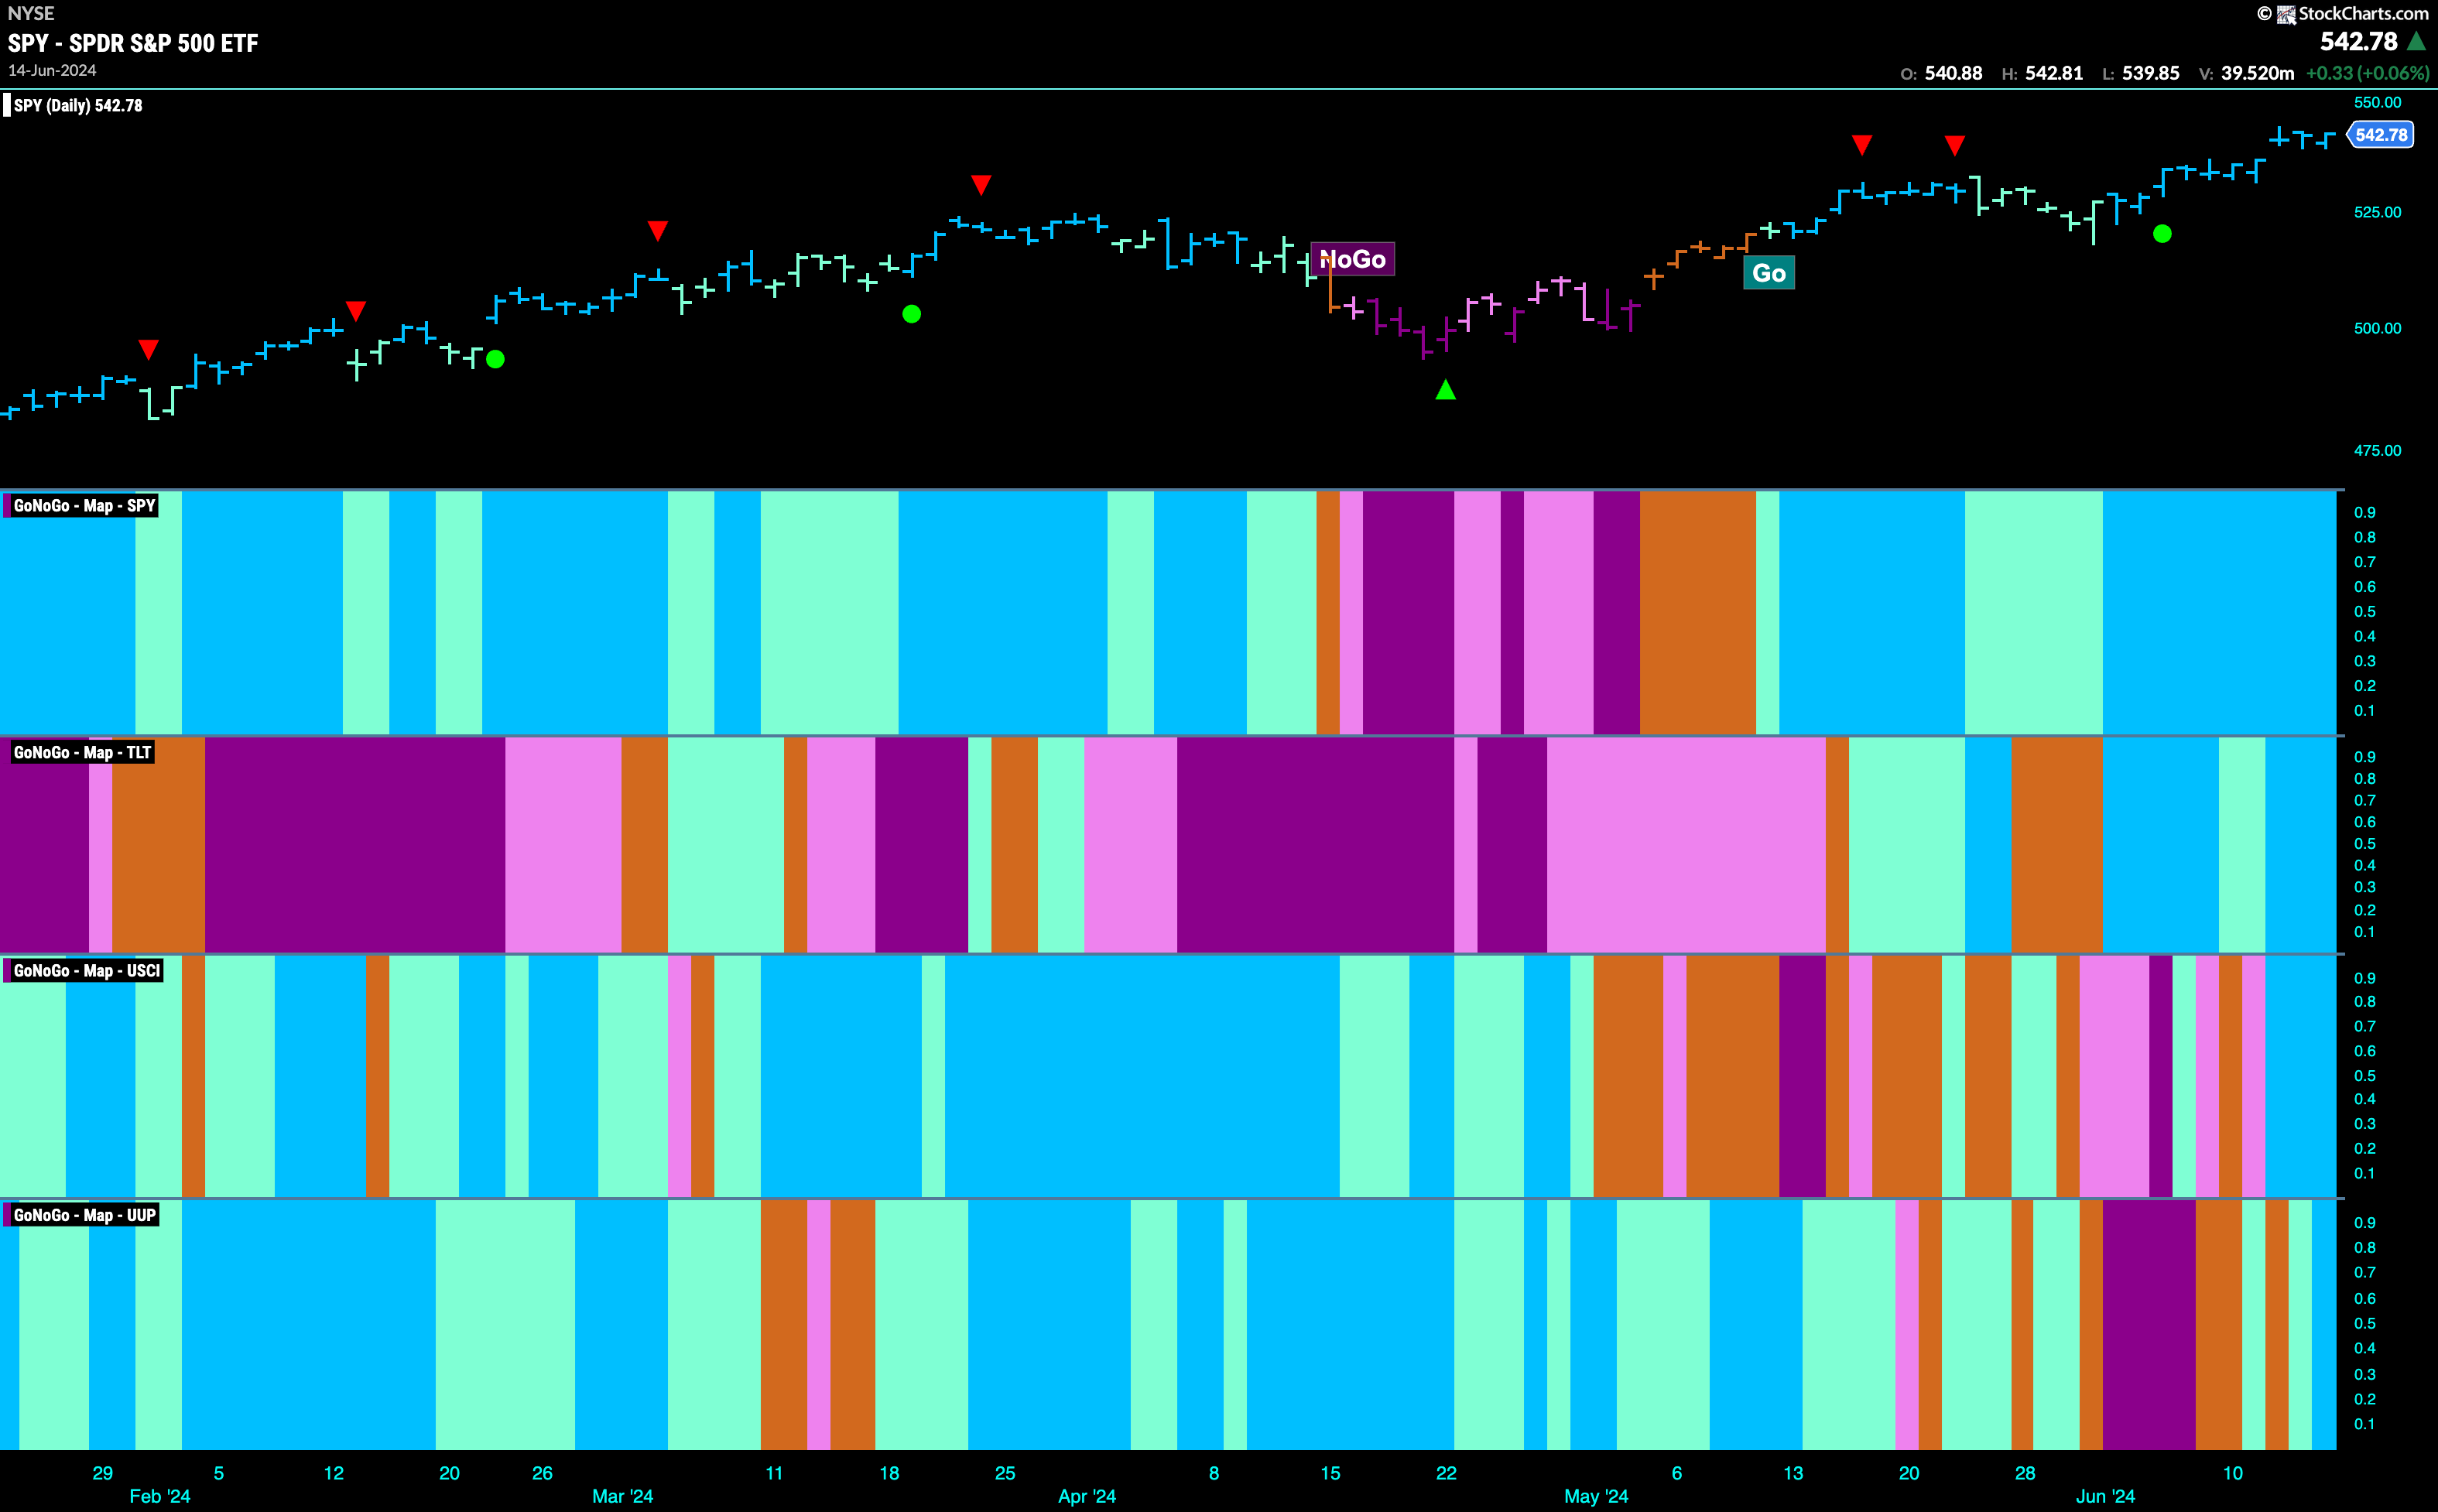
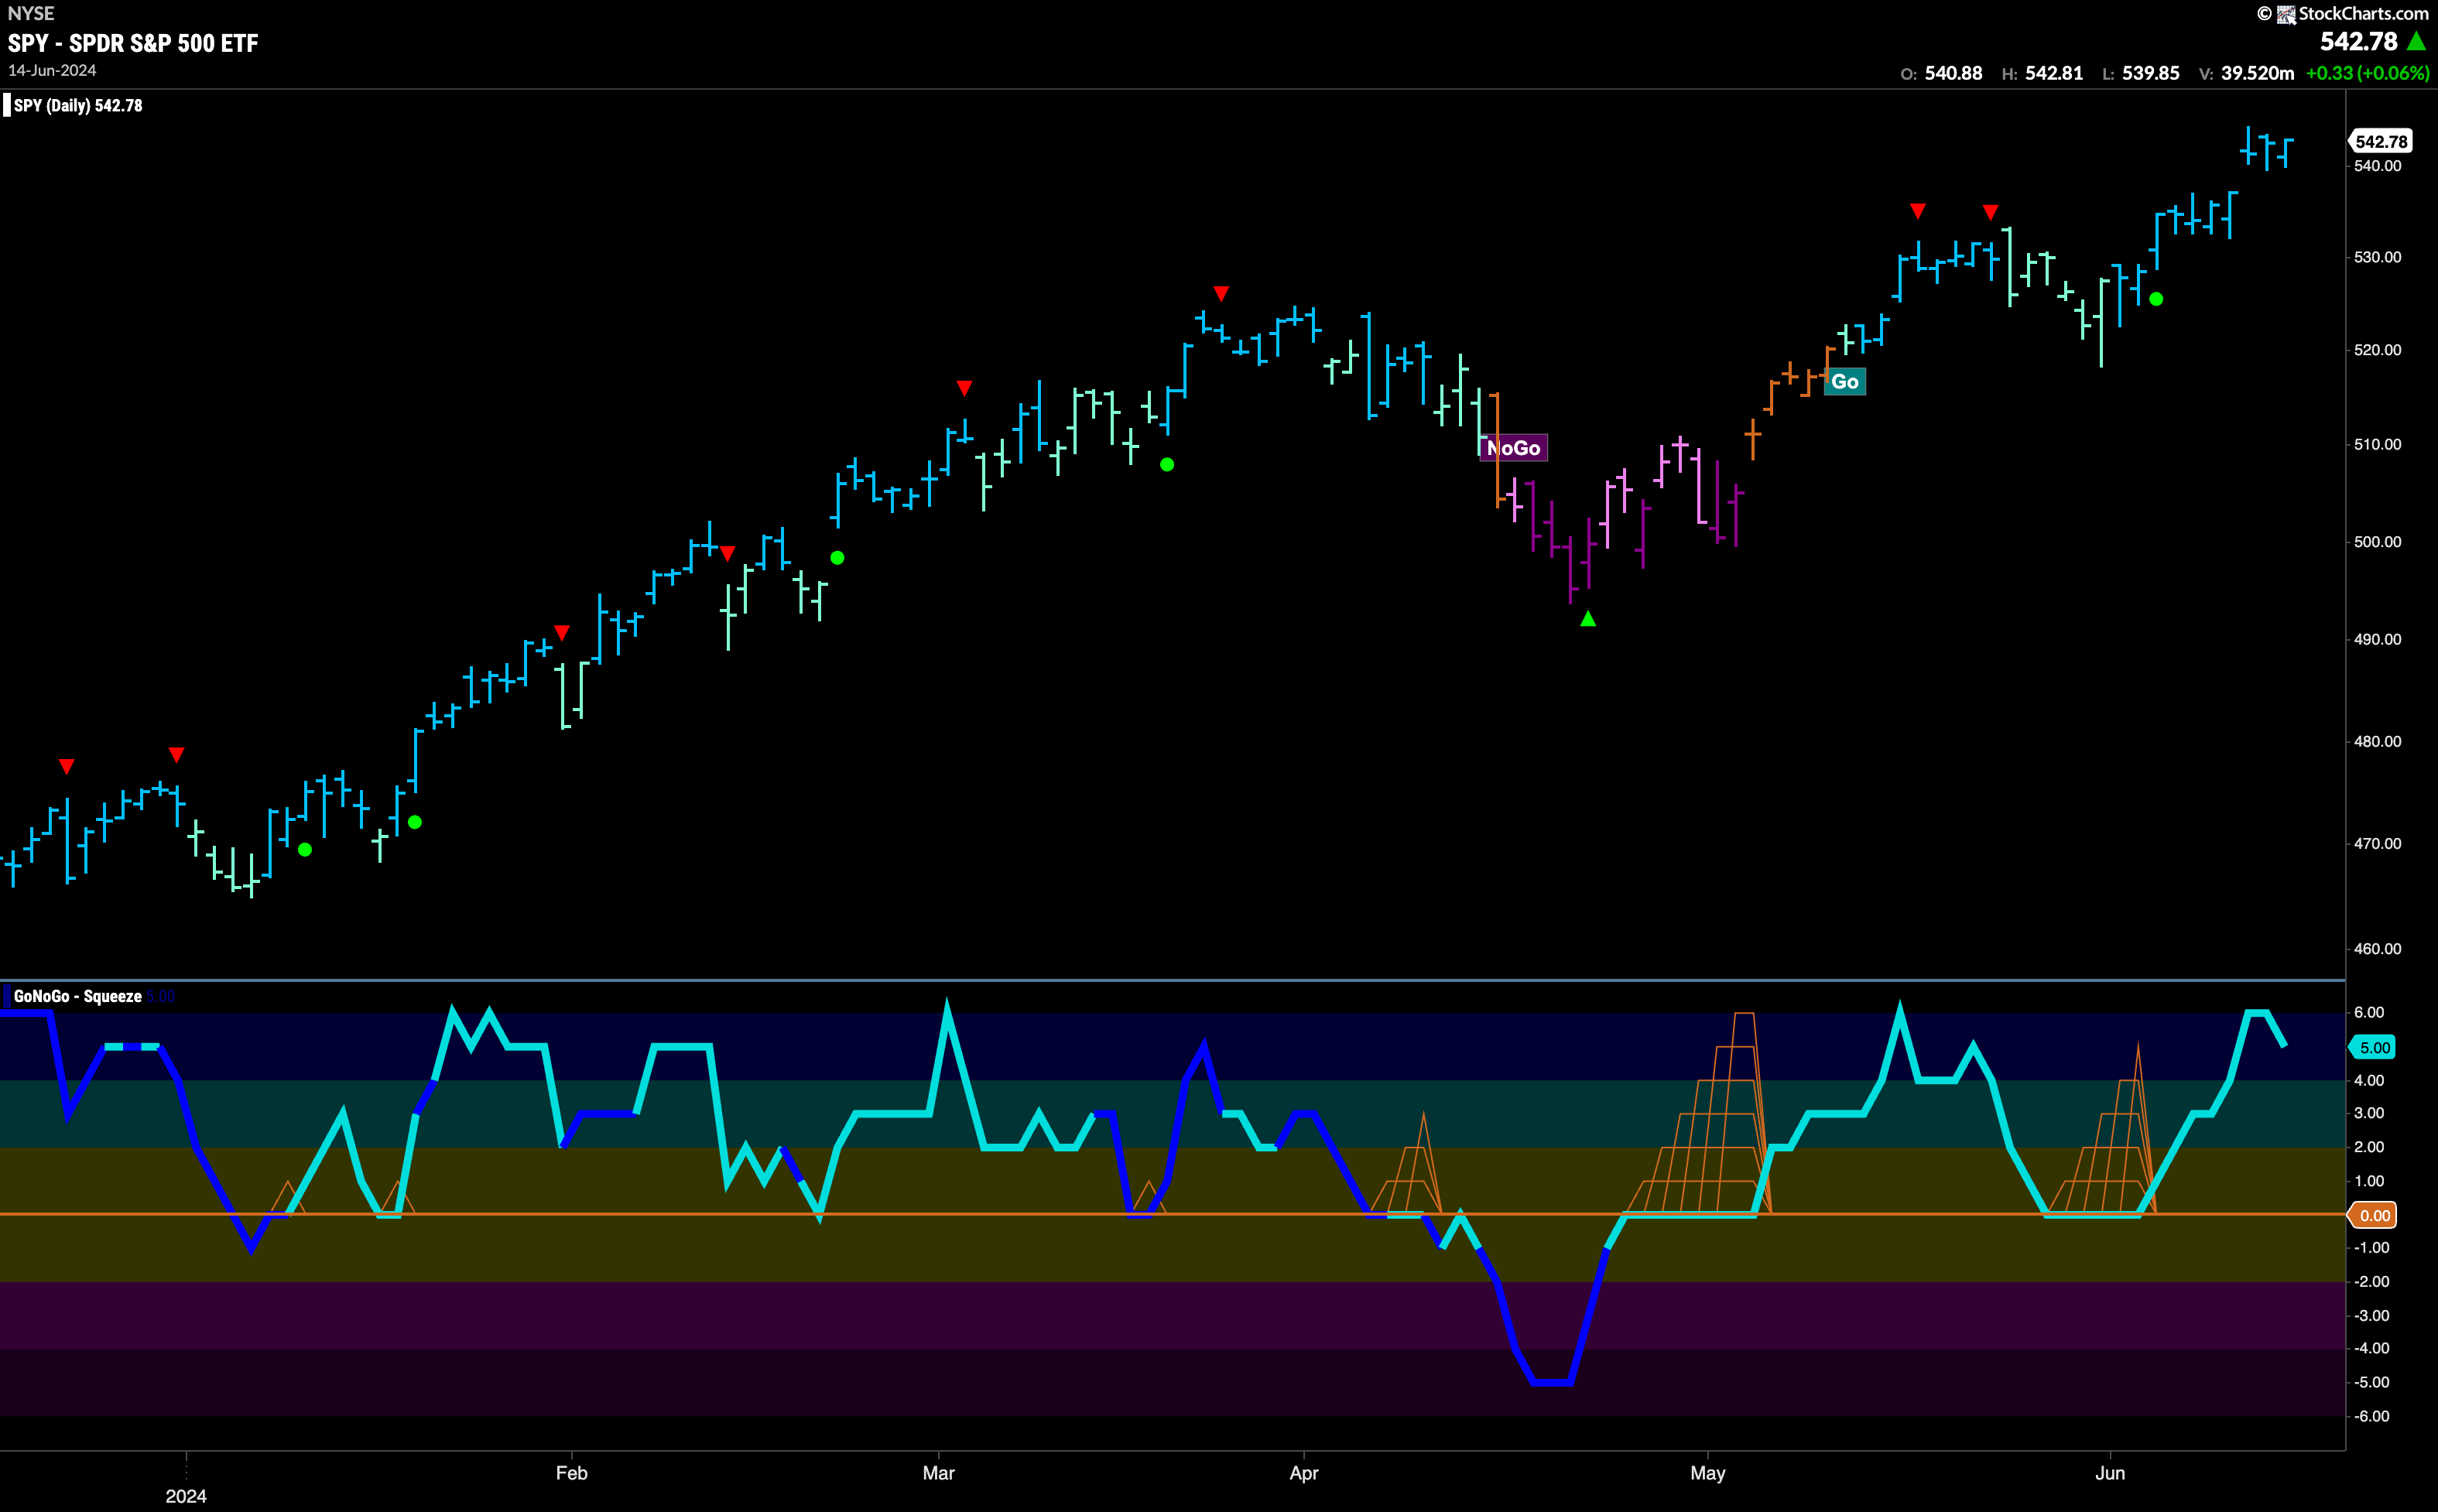
$SPY Paints Strong Blue “Go” Bars at All Time Highs ( No Change this week!)
Not only did we see the “Go” trend continue this week but we saw price gap higher mid week and nothing but strength with GoNoGo Trend painting strong blue bars. When we turn our eye to the oscillator panel, we see that momentum is coming off an extreme of overbought. At a value of 5 but falling, we may well see a Go Countertrend Correction Icon (red arrow) appear above price informing us that it may struggle to go higher in the short term. We will pay attention to this and look to see if support is found at the gap.
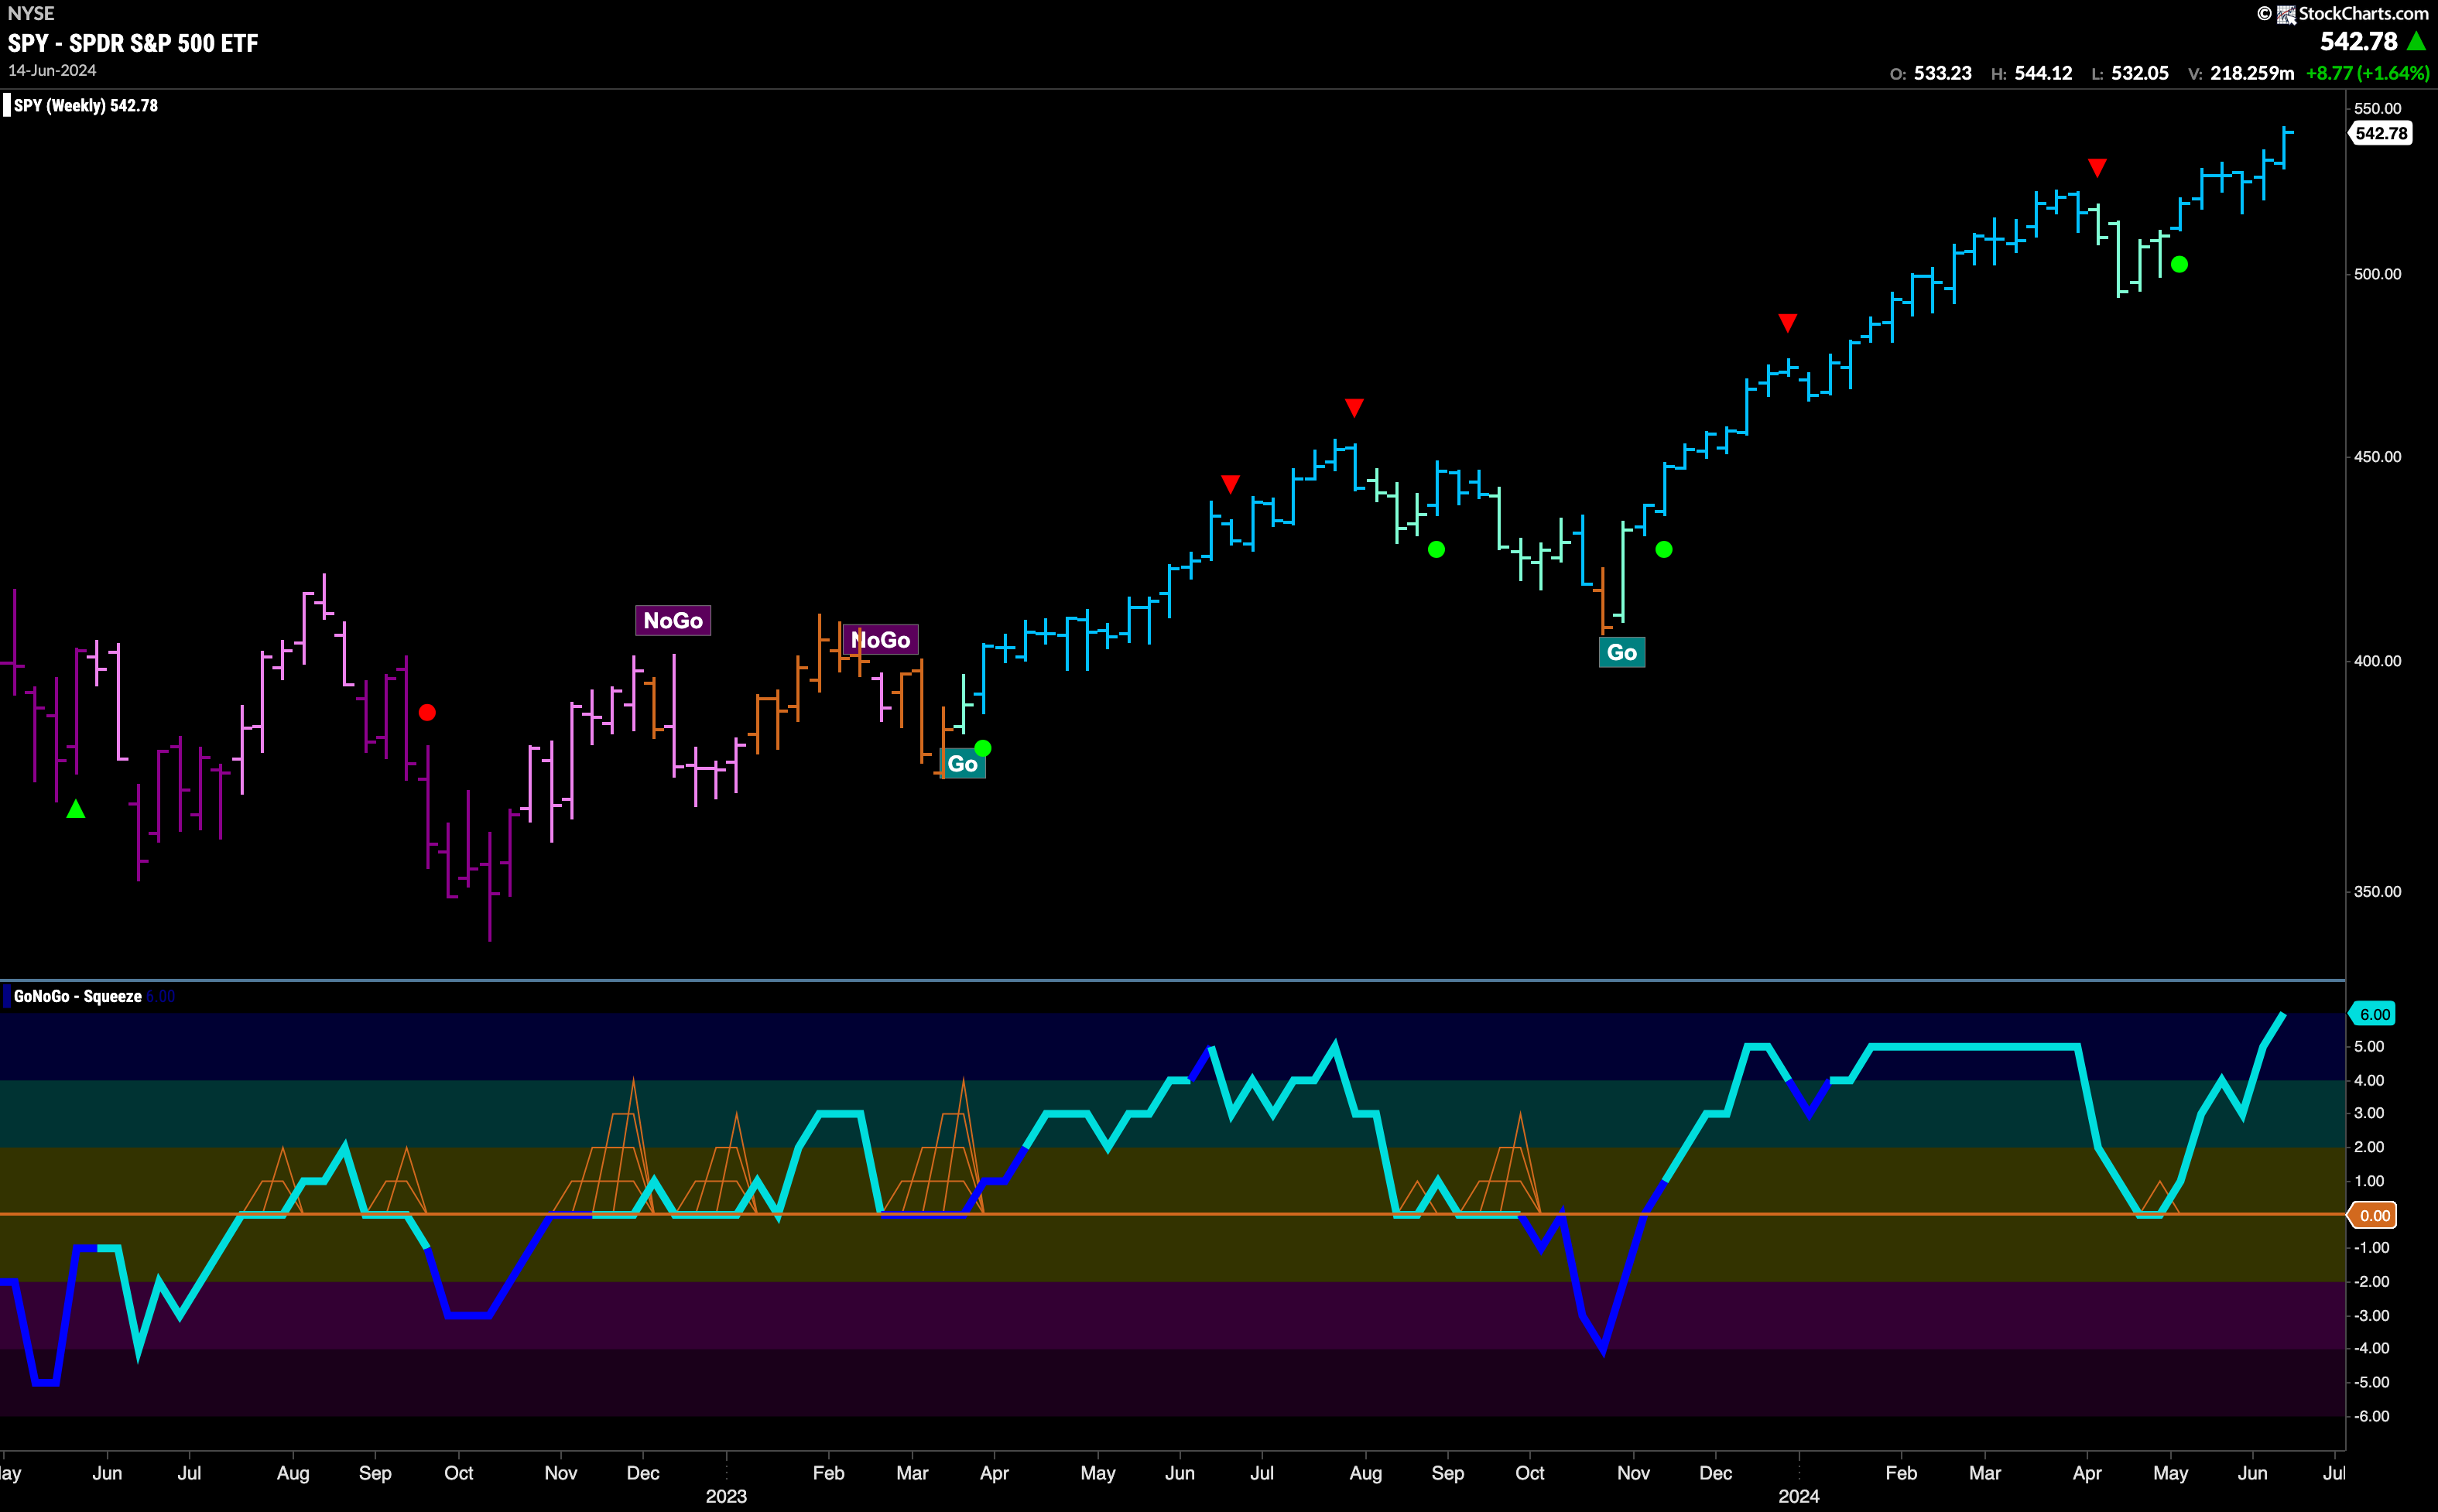
The larger weekly chart shows that the “Go” trend remained very strong this week as we see a strong blue bar setting another higher weekly close. GoNoGo Oscillator has climbed to its max of 6. We will watch closely to see if this market enthusiasm can be maintained or if there is any waning of momentum which would cause a Go Countertrend Correction icon to appear on the chart above price.
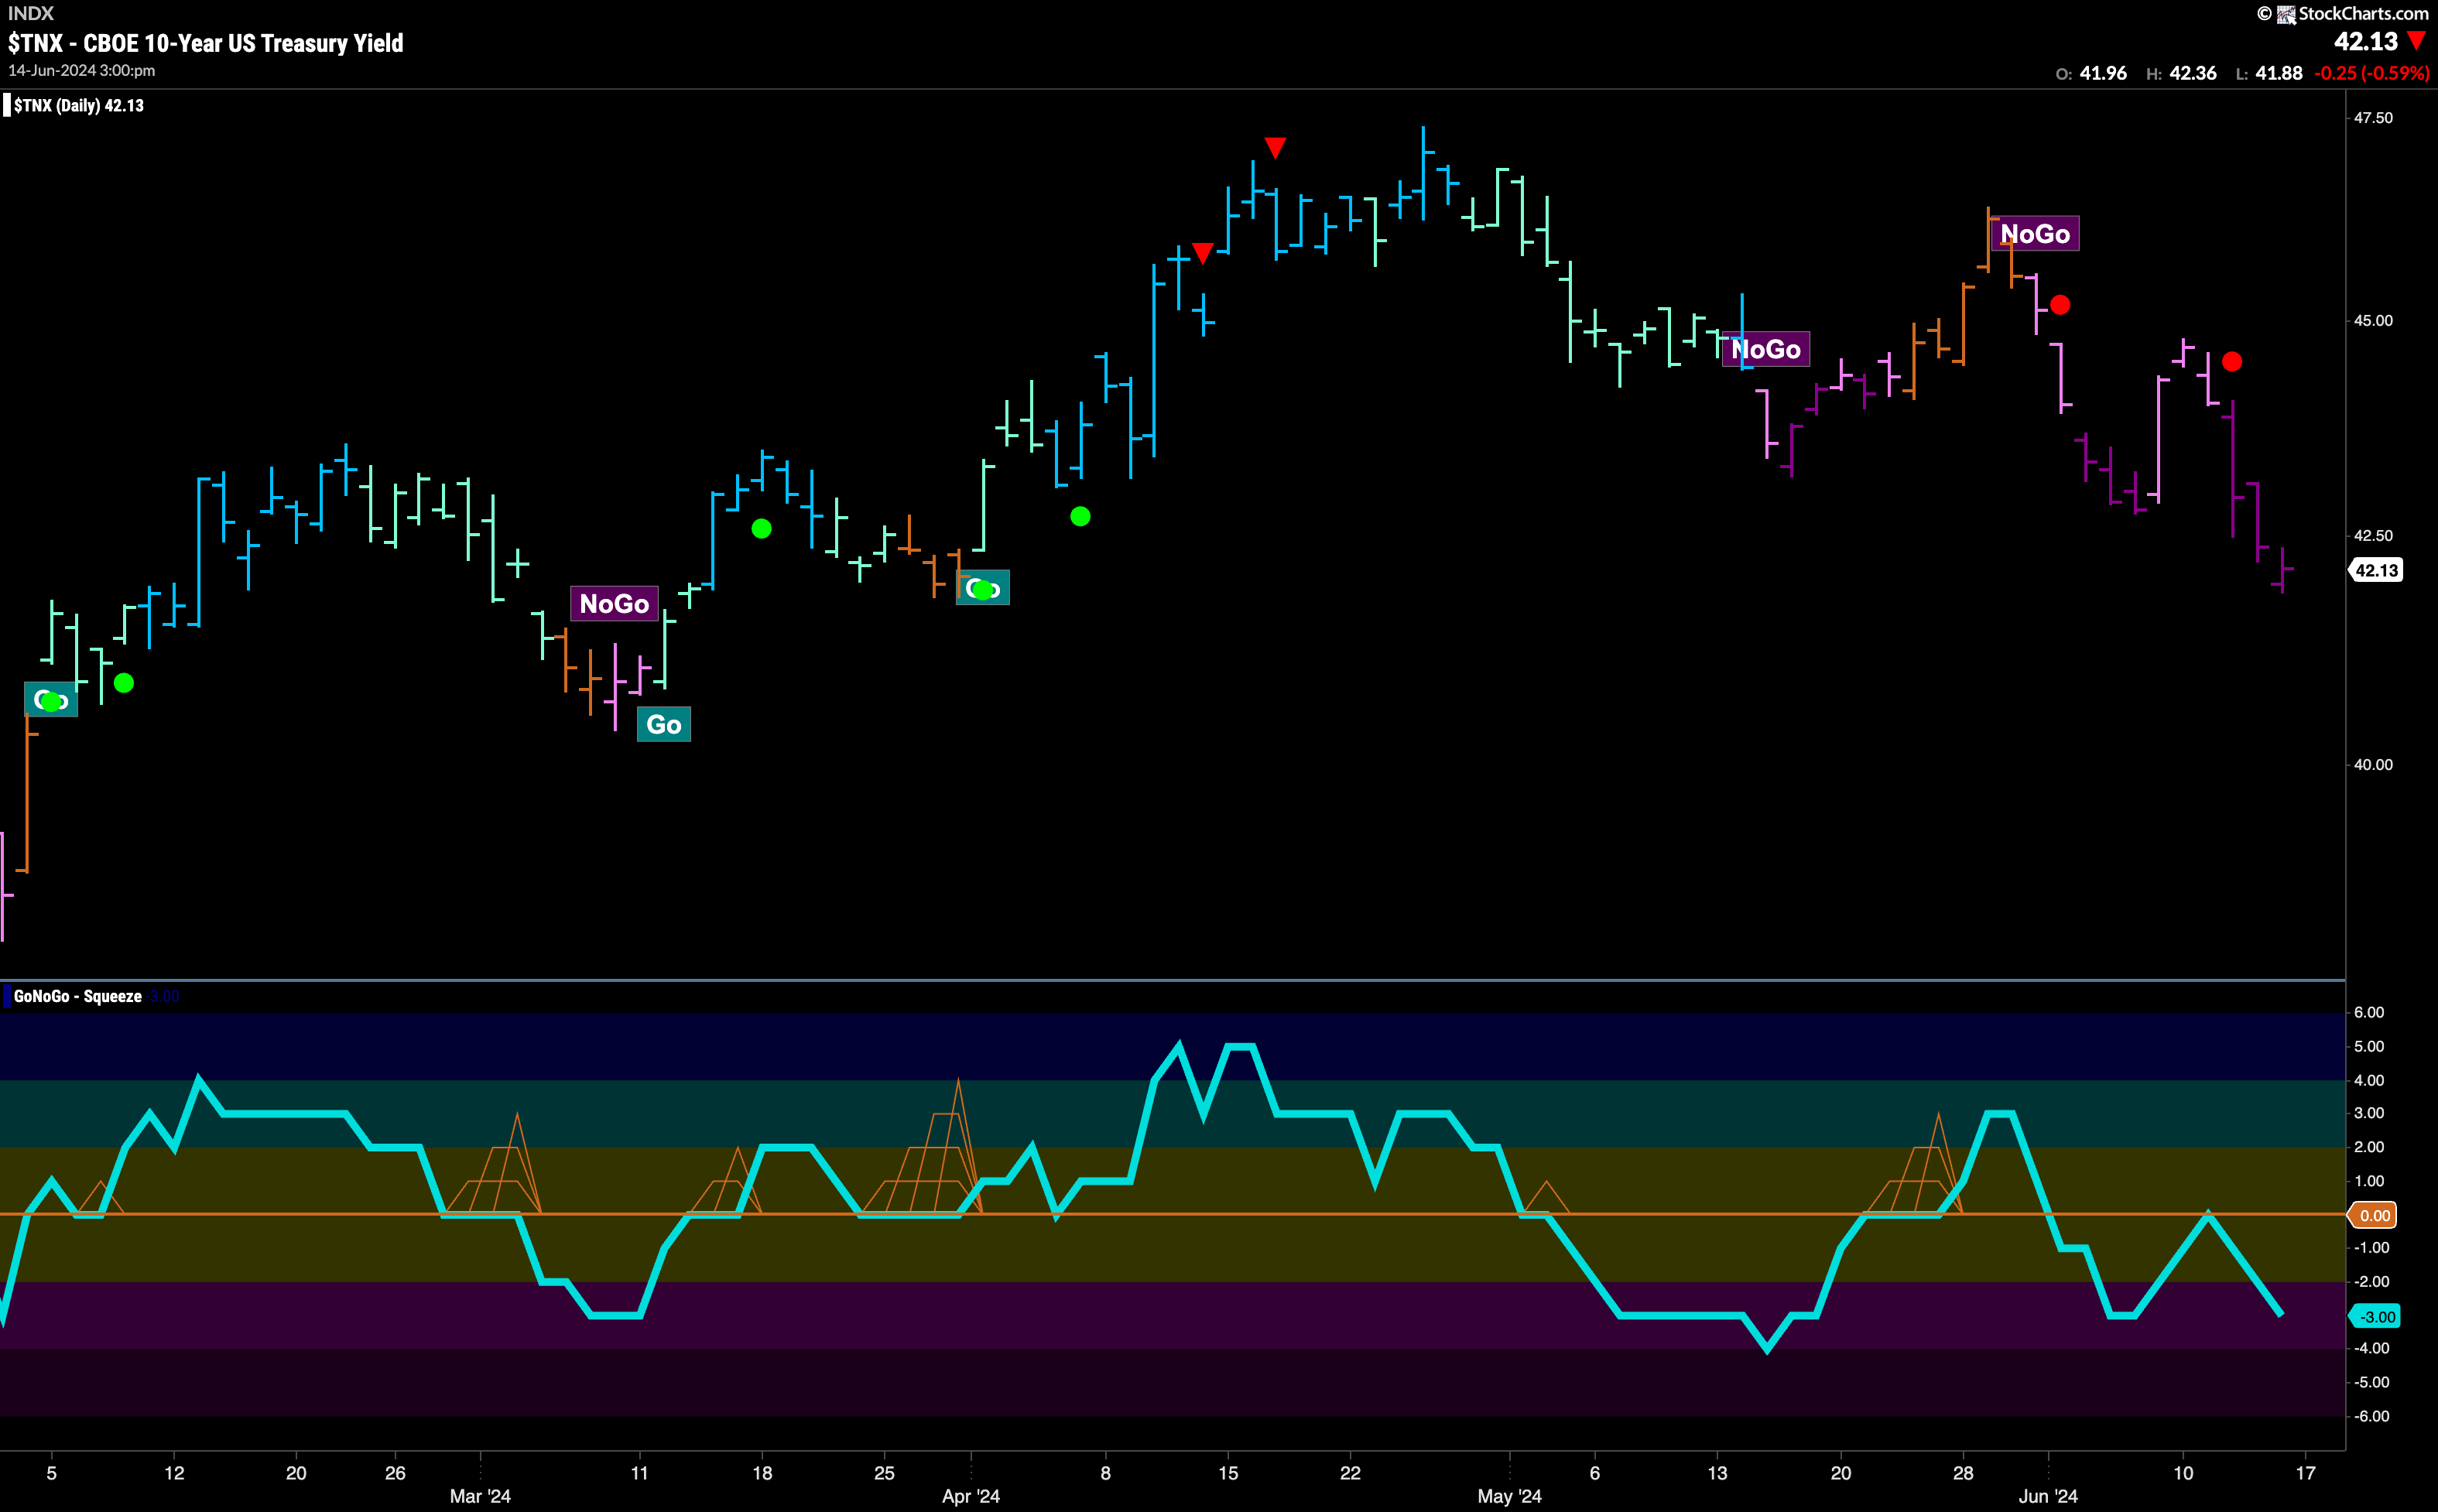
Treasury Rates Set new Lower Low in “NoGo” Trend
After a brief relief rally that set a new lower high, we saw price fall through the second half of the week. GoNoGo Trend returned to paint more strong purple “NoGo” bars and price made a new lower low. We were alerted to this trend continuation mid week as GoNoGo Oscillator rose to test the zero line from below and was turned away. Now, with the “NoGo” firmly in place, we see that momentum is resurgent in the direction of the underlying trend. The oscillator is at a value of -3, not yet oversold.
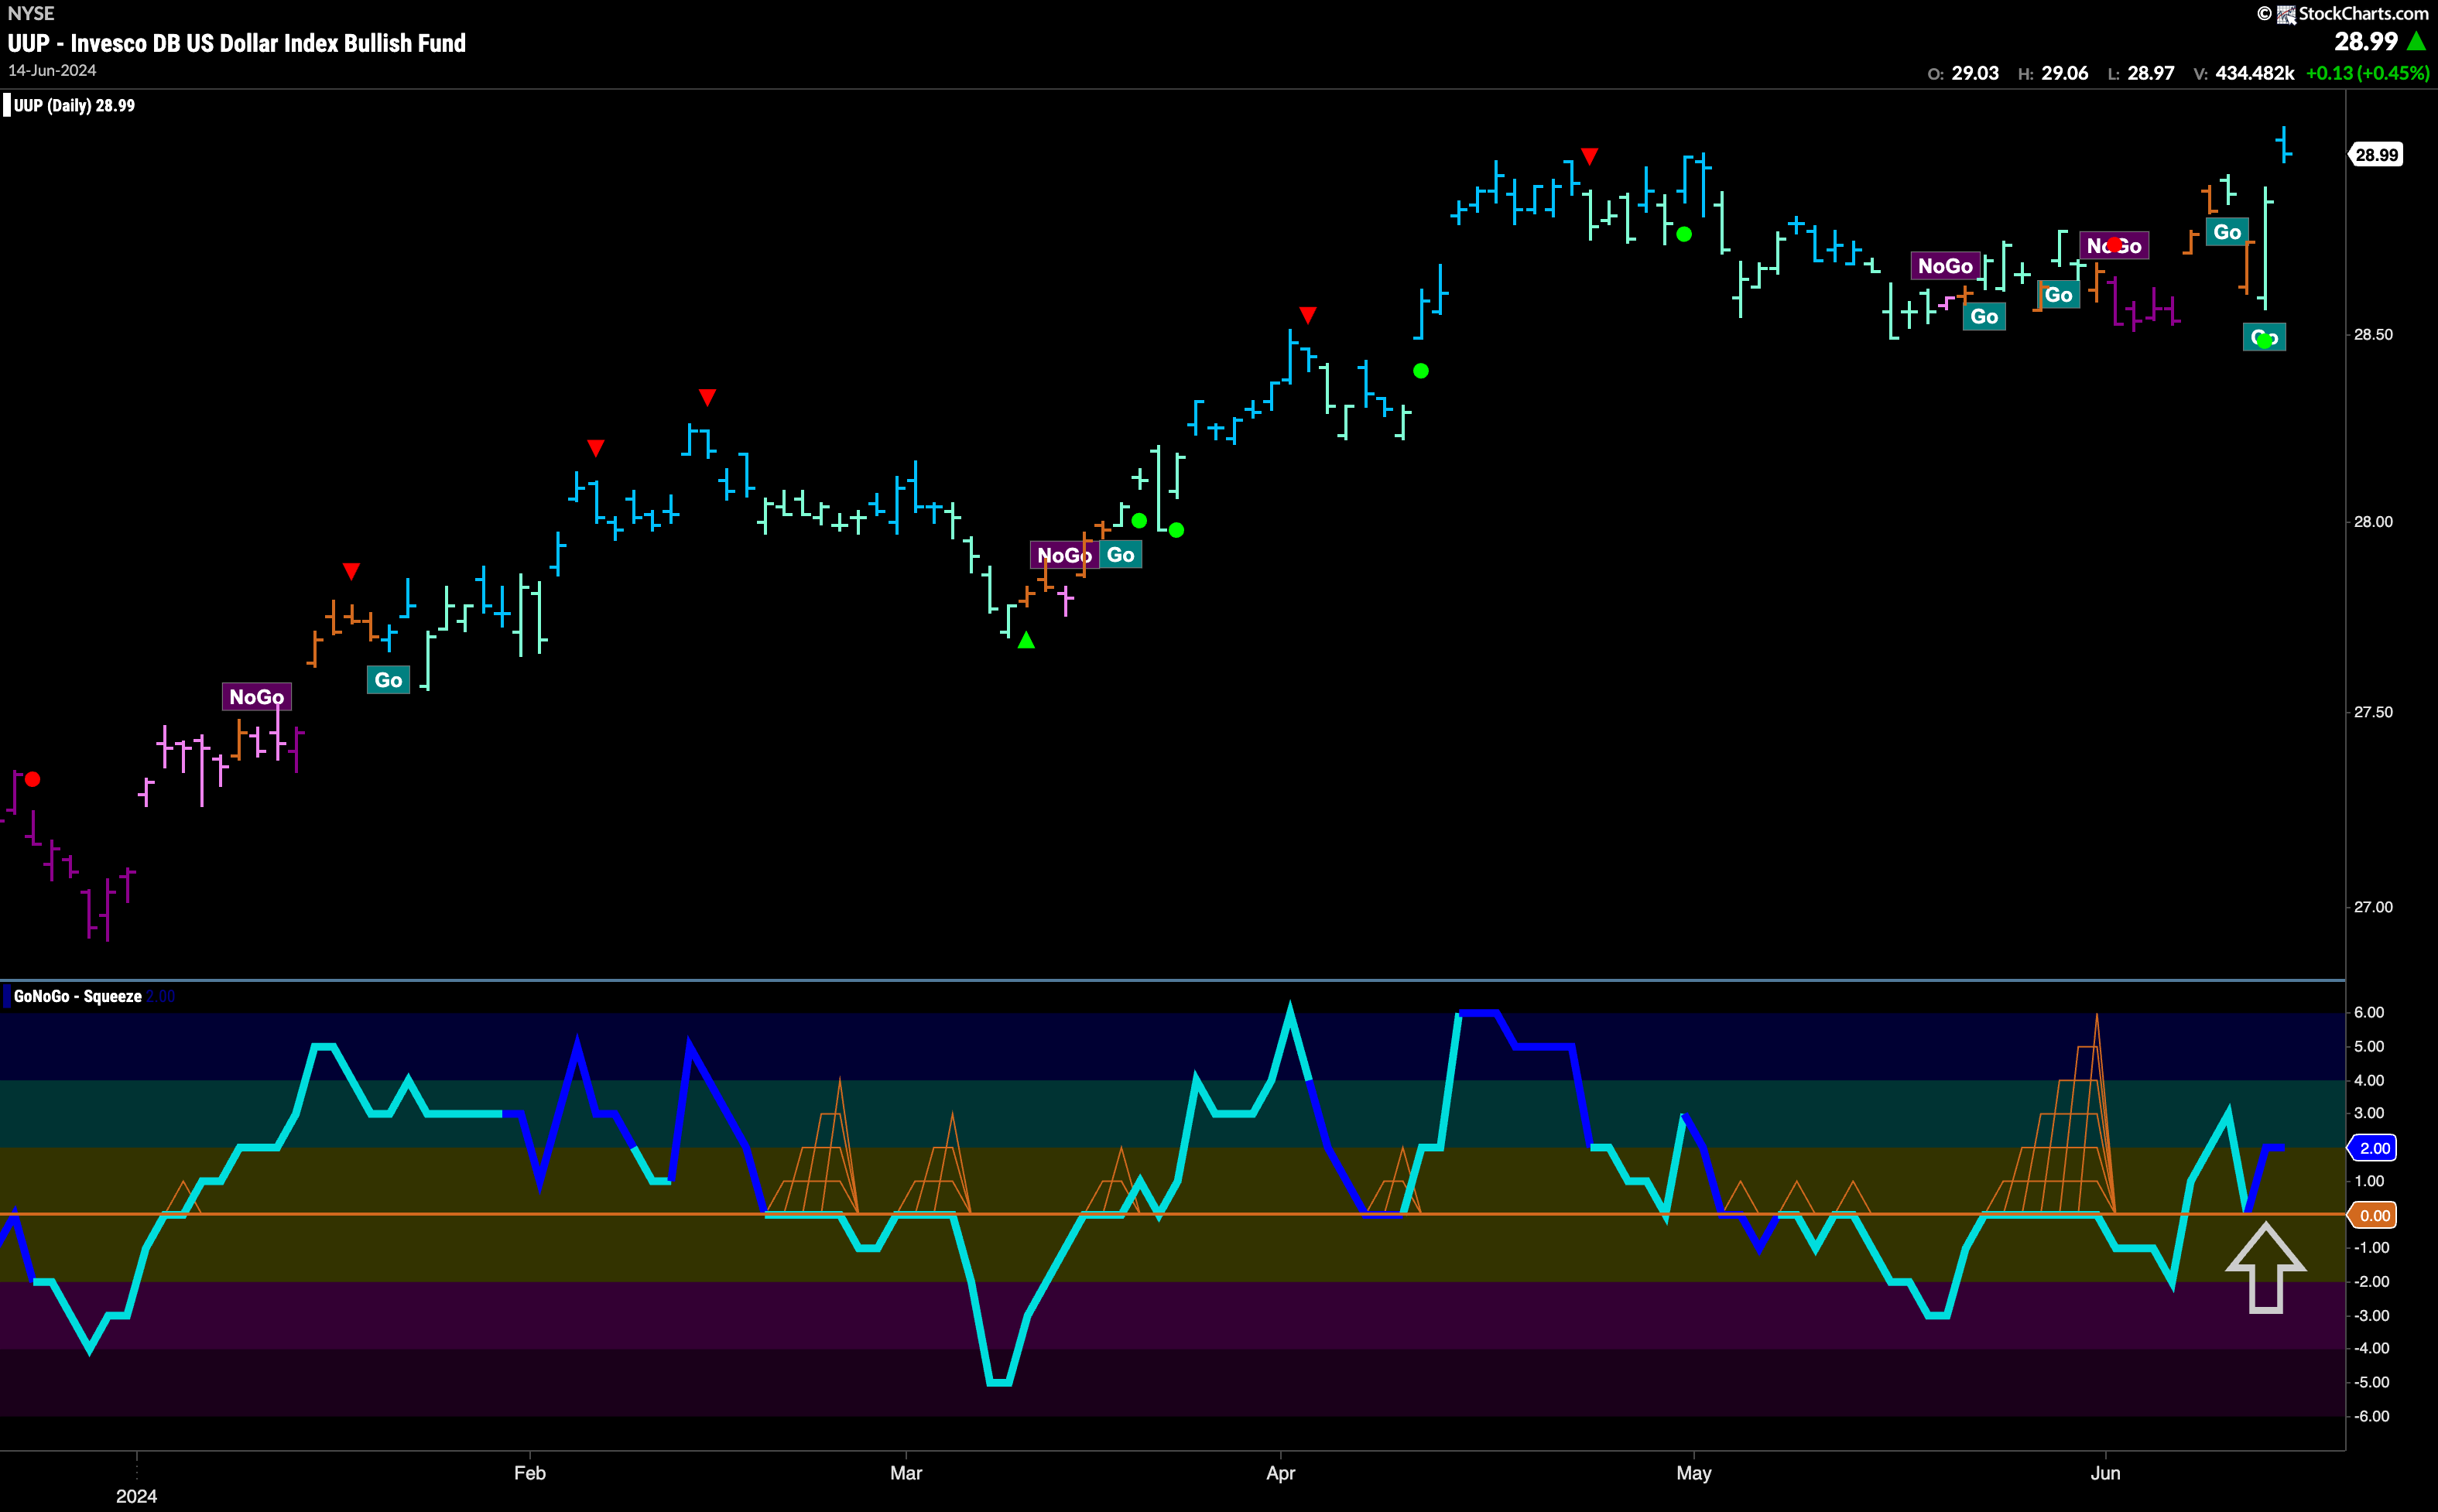
Dollar Makes a Move after Uncertainty
After a few “Go Fish” bars, amber bars that reflect market uncertainty, we saw the dollar paint a couple of aqua bars this week before a strong blue “Go” bar was painted on Friday. Thursday’s “Go” bar was impressive, with its trading range completely engulfing that of the day before. This is known as a bullish engulfing pattern, and suggests higher price moves over the near term. Friday’s gap higher is above prior high levels and it will be important to note if we can consolidate at these levels. GoNoGo Oscillator is in positive territory on heavy volume after bouncing off the zero line.
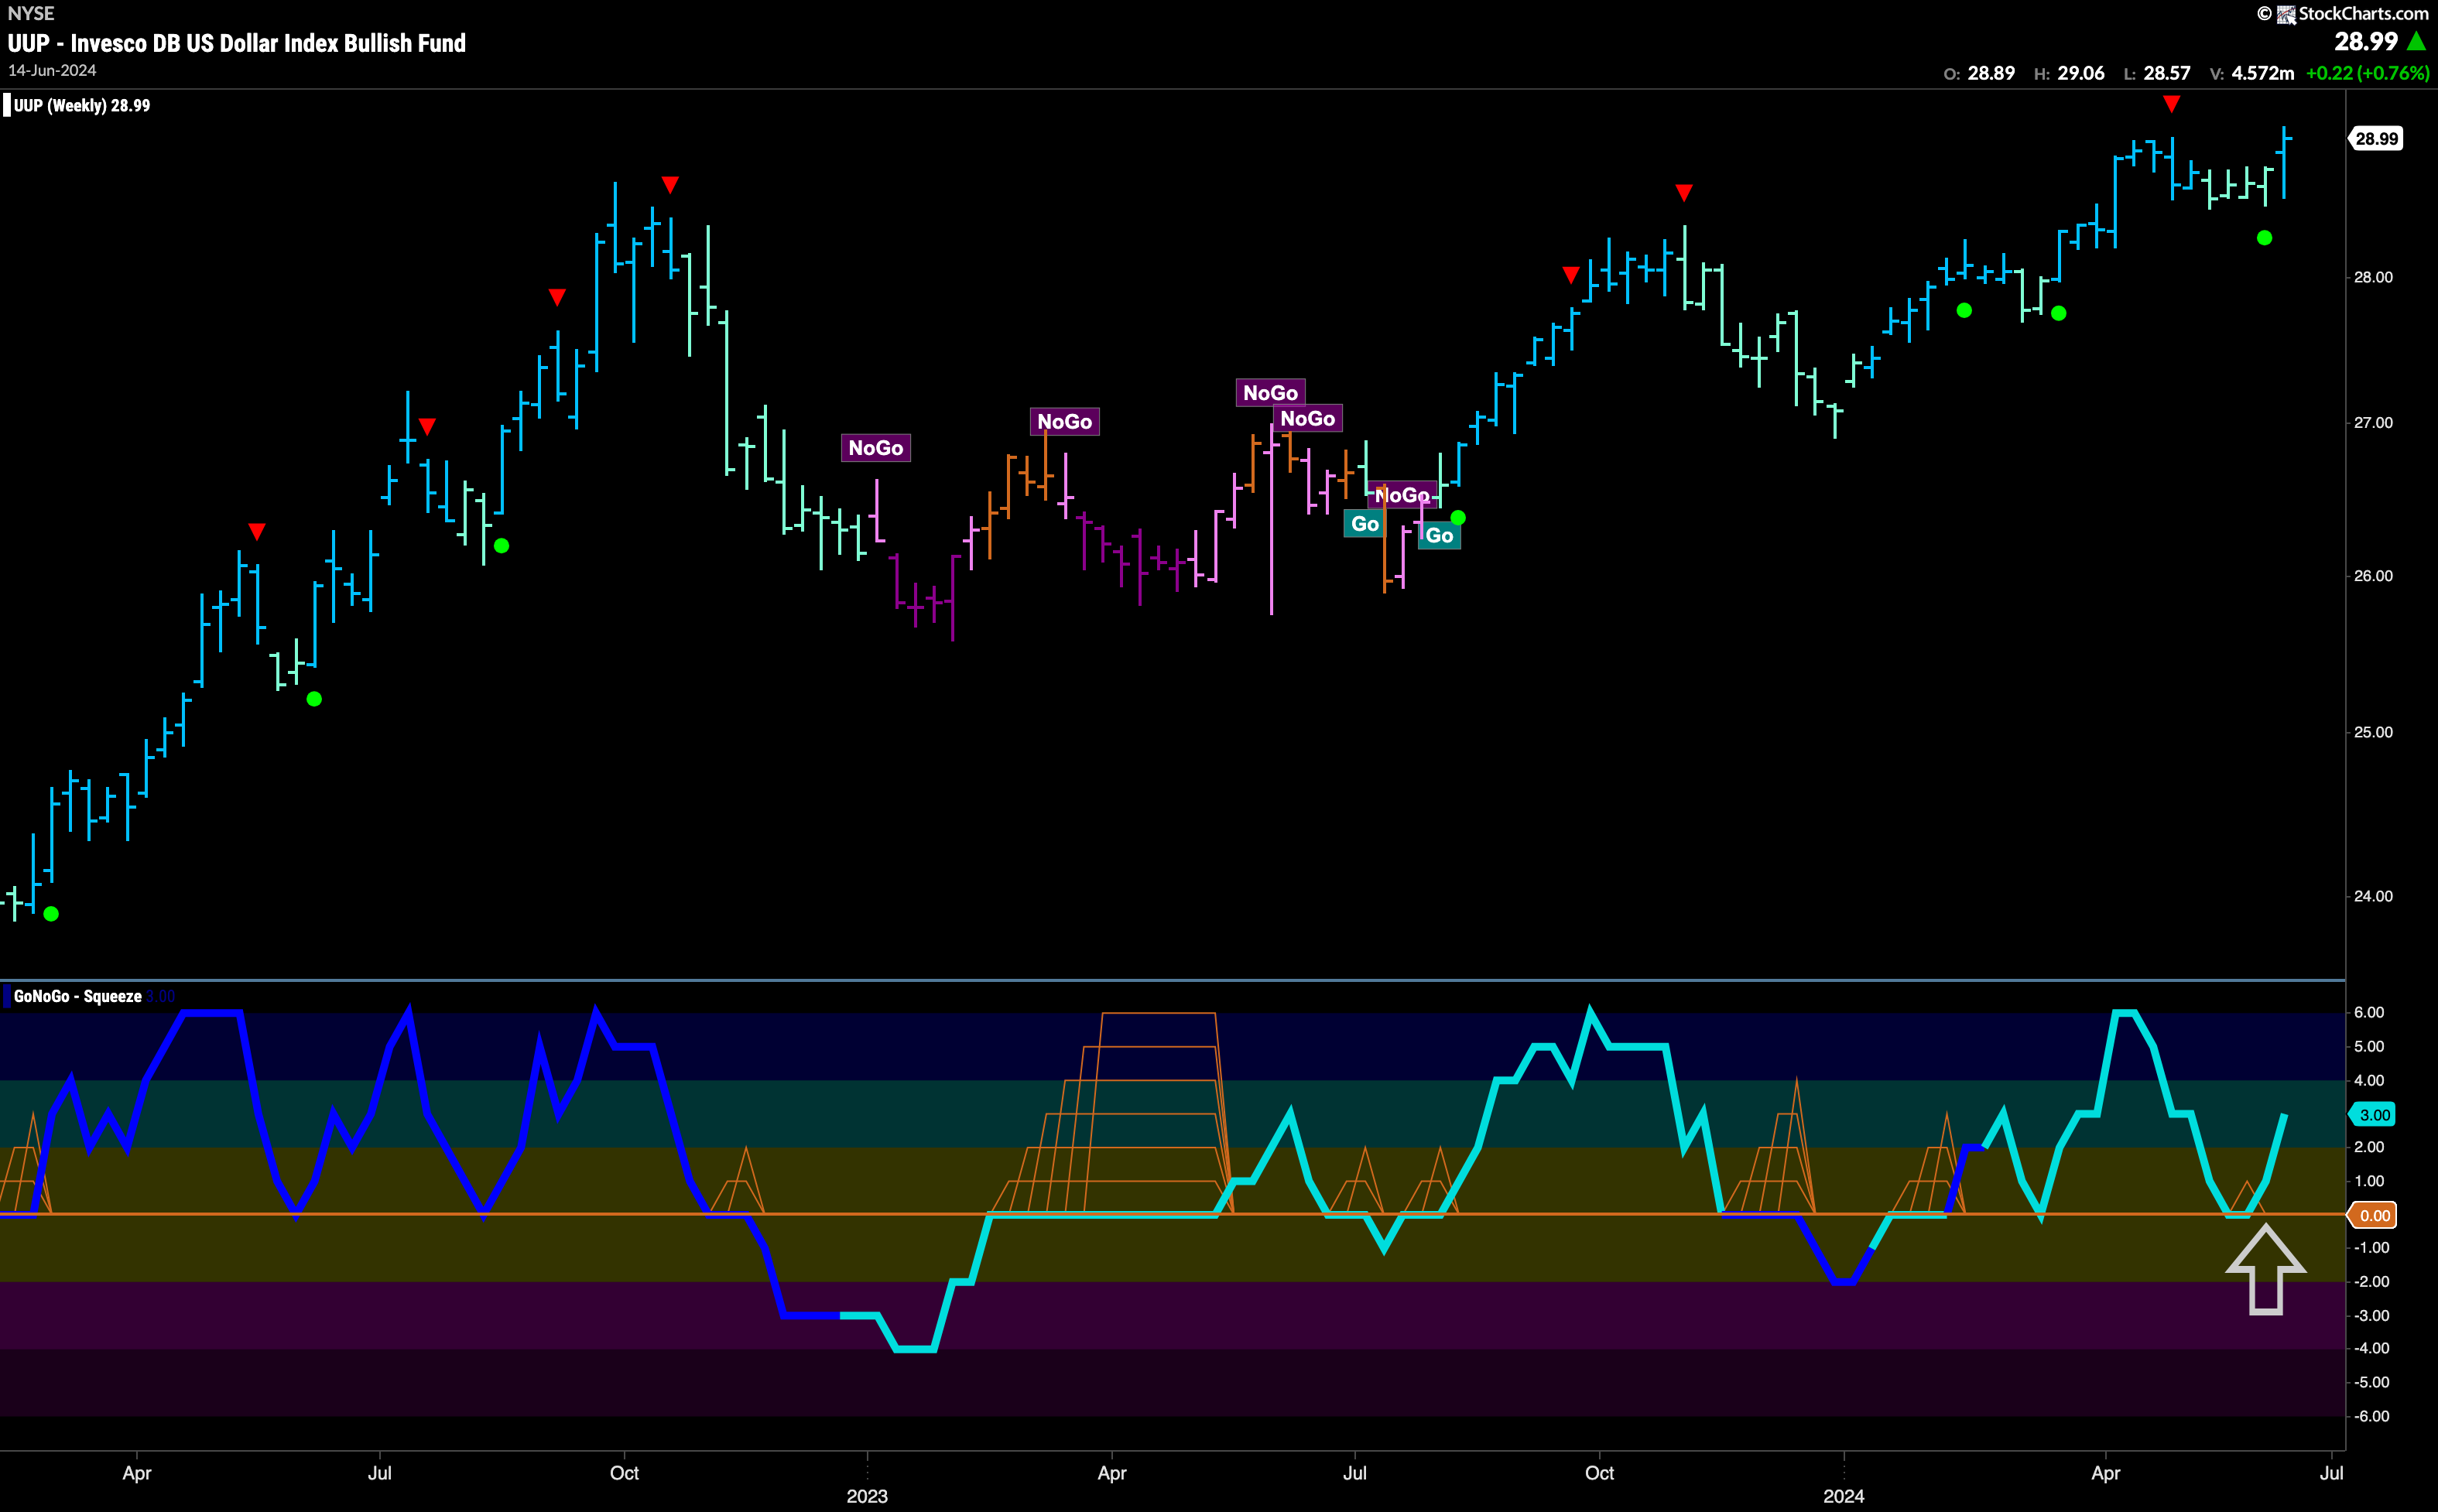
The weekly chart shows a return to strength this week. GoNoGo Trend painted a strong blue “Go” bar as price challenges prior highs. GoNoGo Oscillator bounced off the zero line last week giving us signs of Go Trend Continuation (green circle). Now, momentum is positive and moving higher at a value of 3.
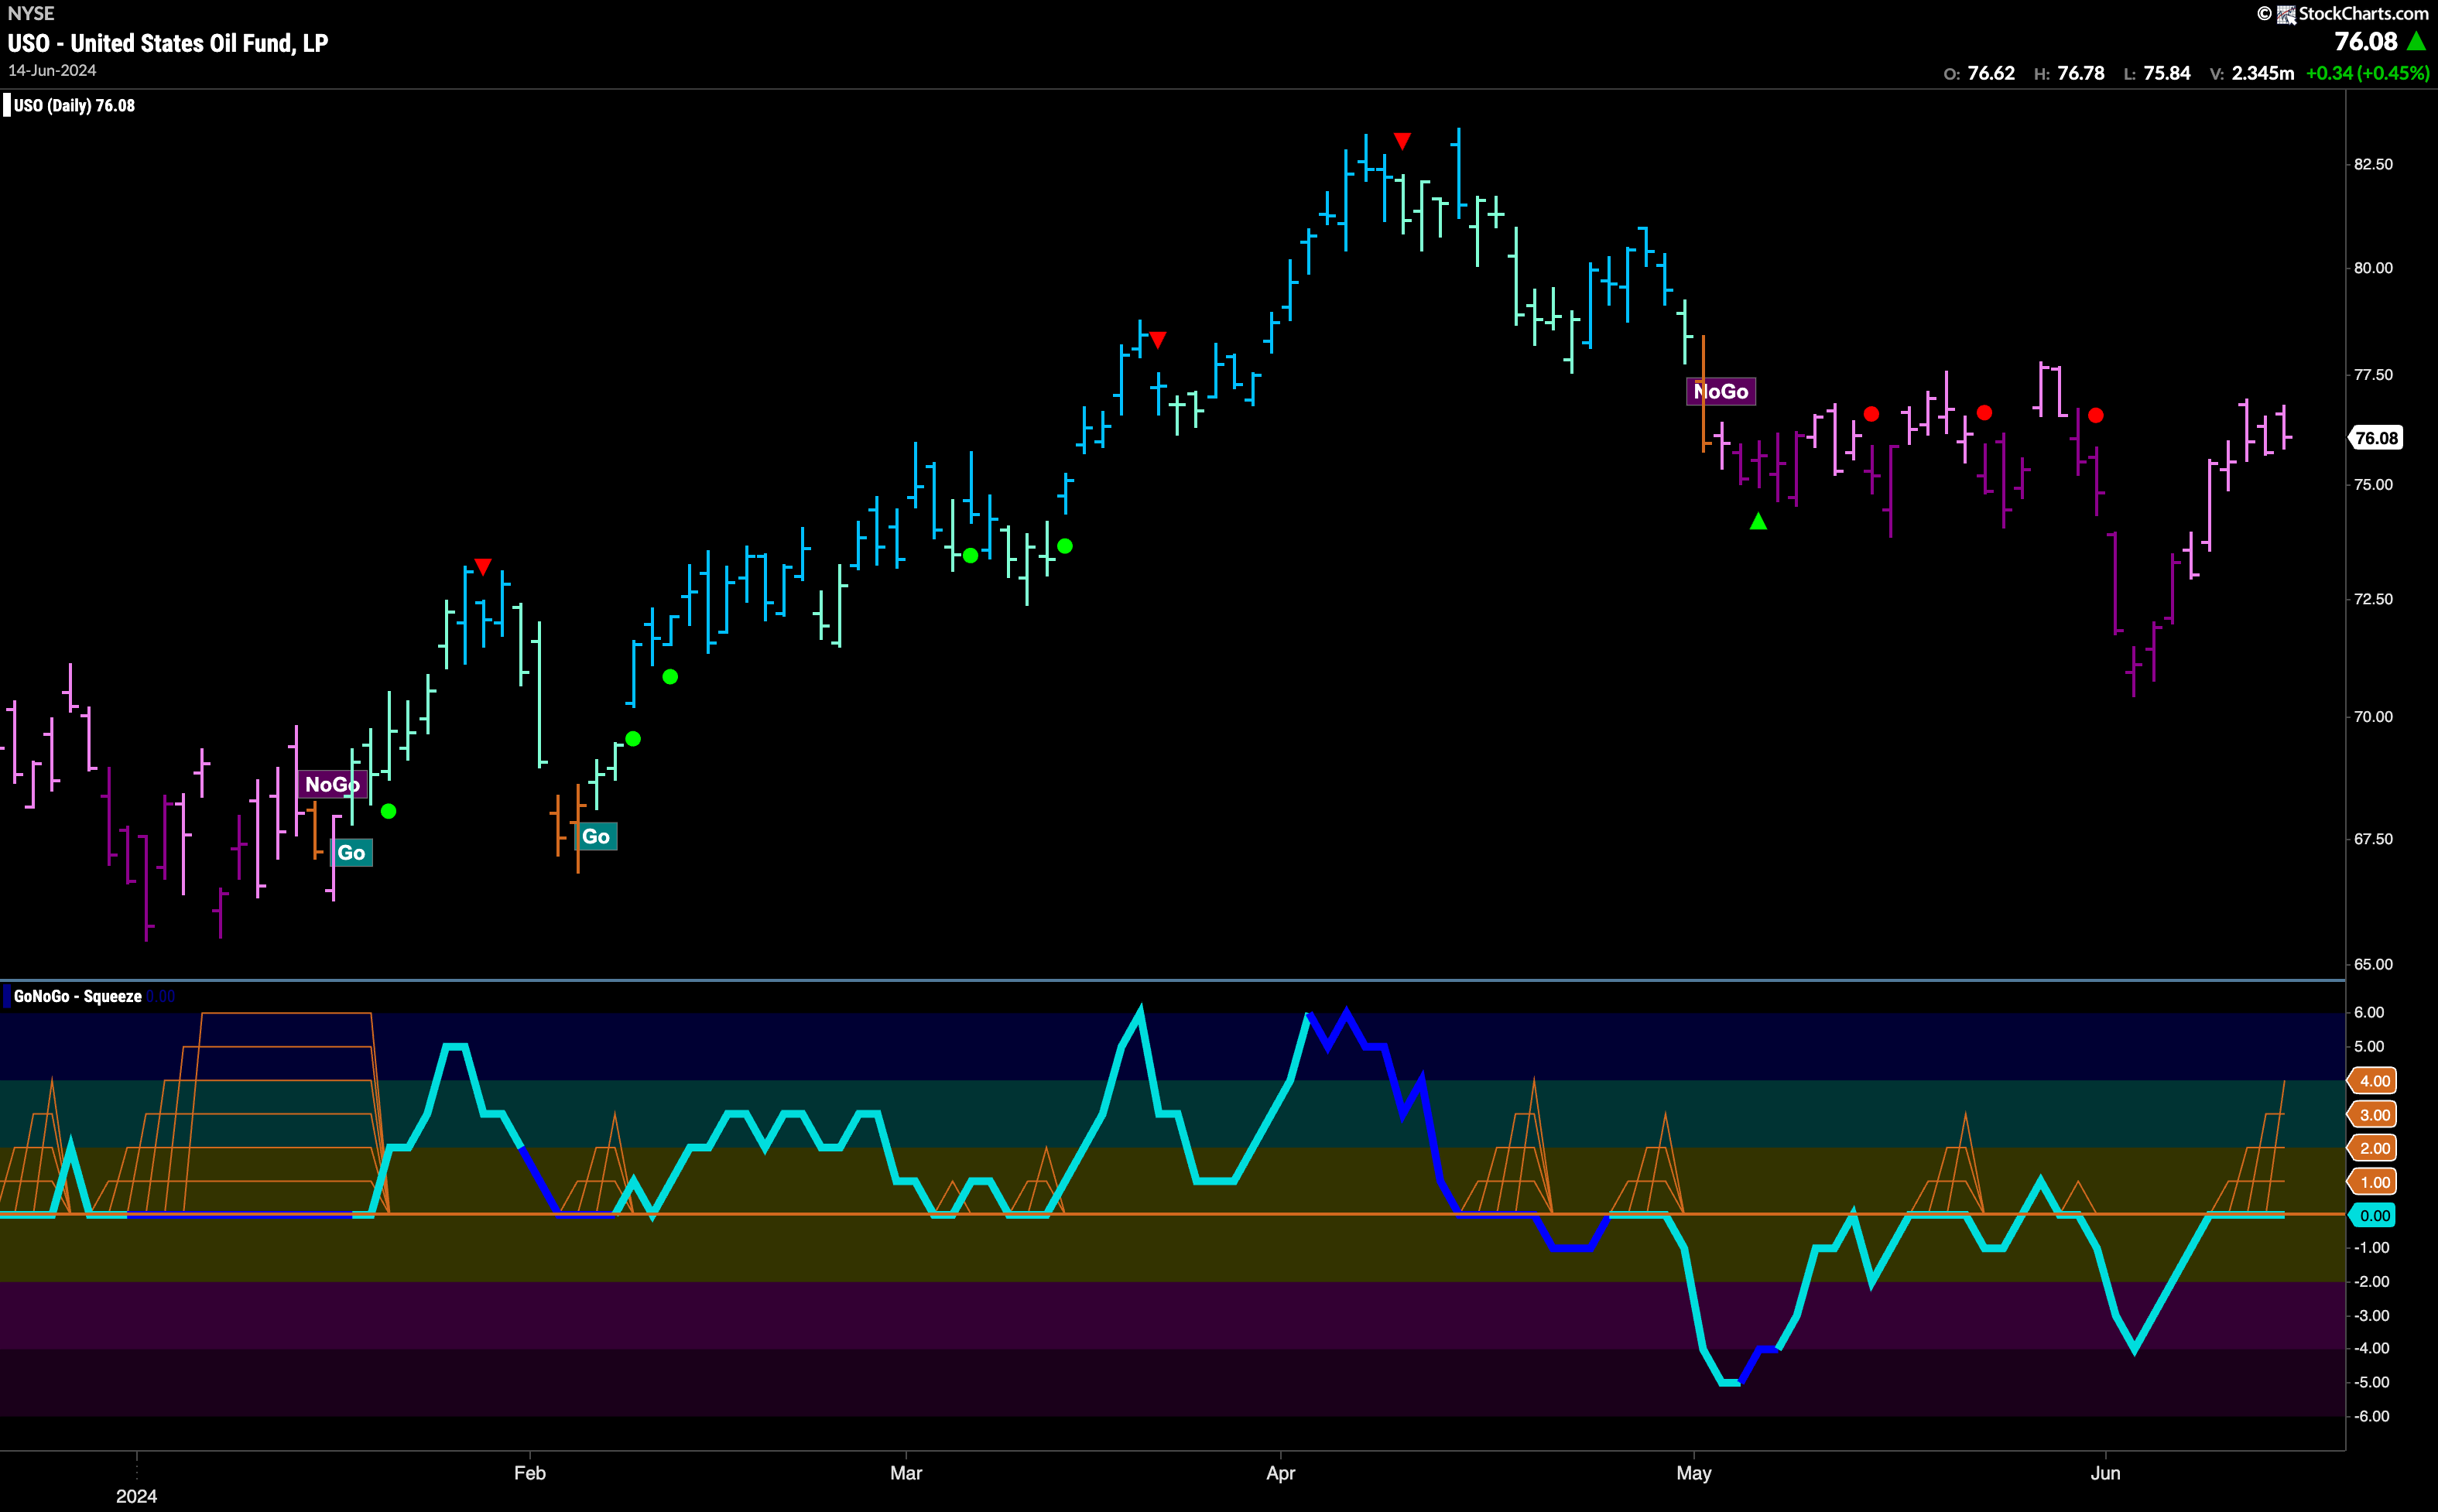
Oil Continues to Paint Weak “NoGo” Bars
The “NoGo” trend showed weakness this week as price continued to climb off the lows. GoNoGo Trend painted an entire week of weaker pink “NoGo” bars as price runs into a congestion area that may provide resistance. GoNoGo Oscillator is at the zero level and is stuck there. We see a GoNoGo Squeeze building as there is a tug of war between buyers and sellers at this level. We will watch to see in which direction the Squeeze is broken and that will give us a clue as to whether the “NoGo” trend will continue or not.
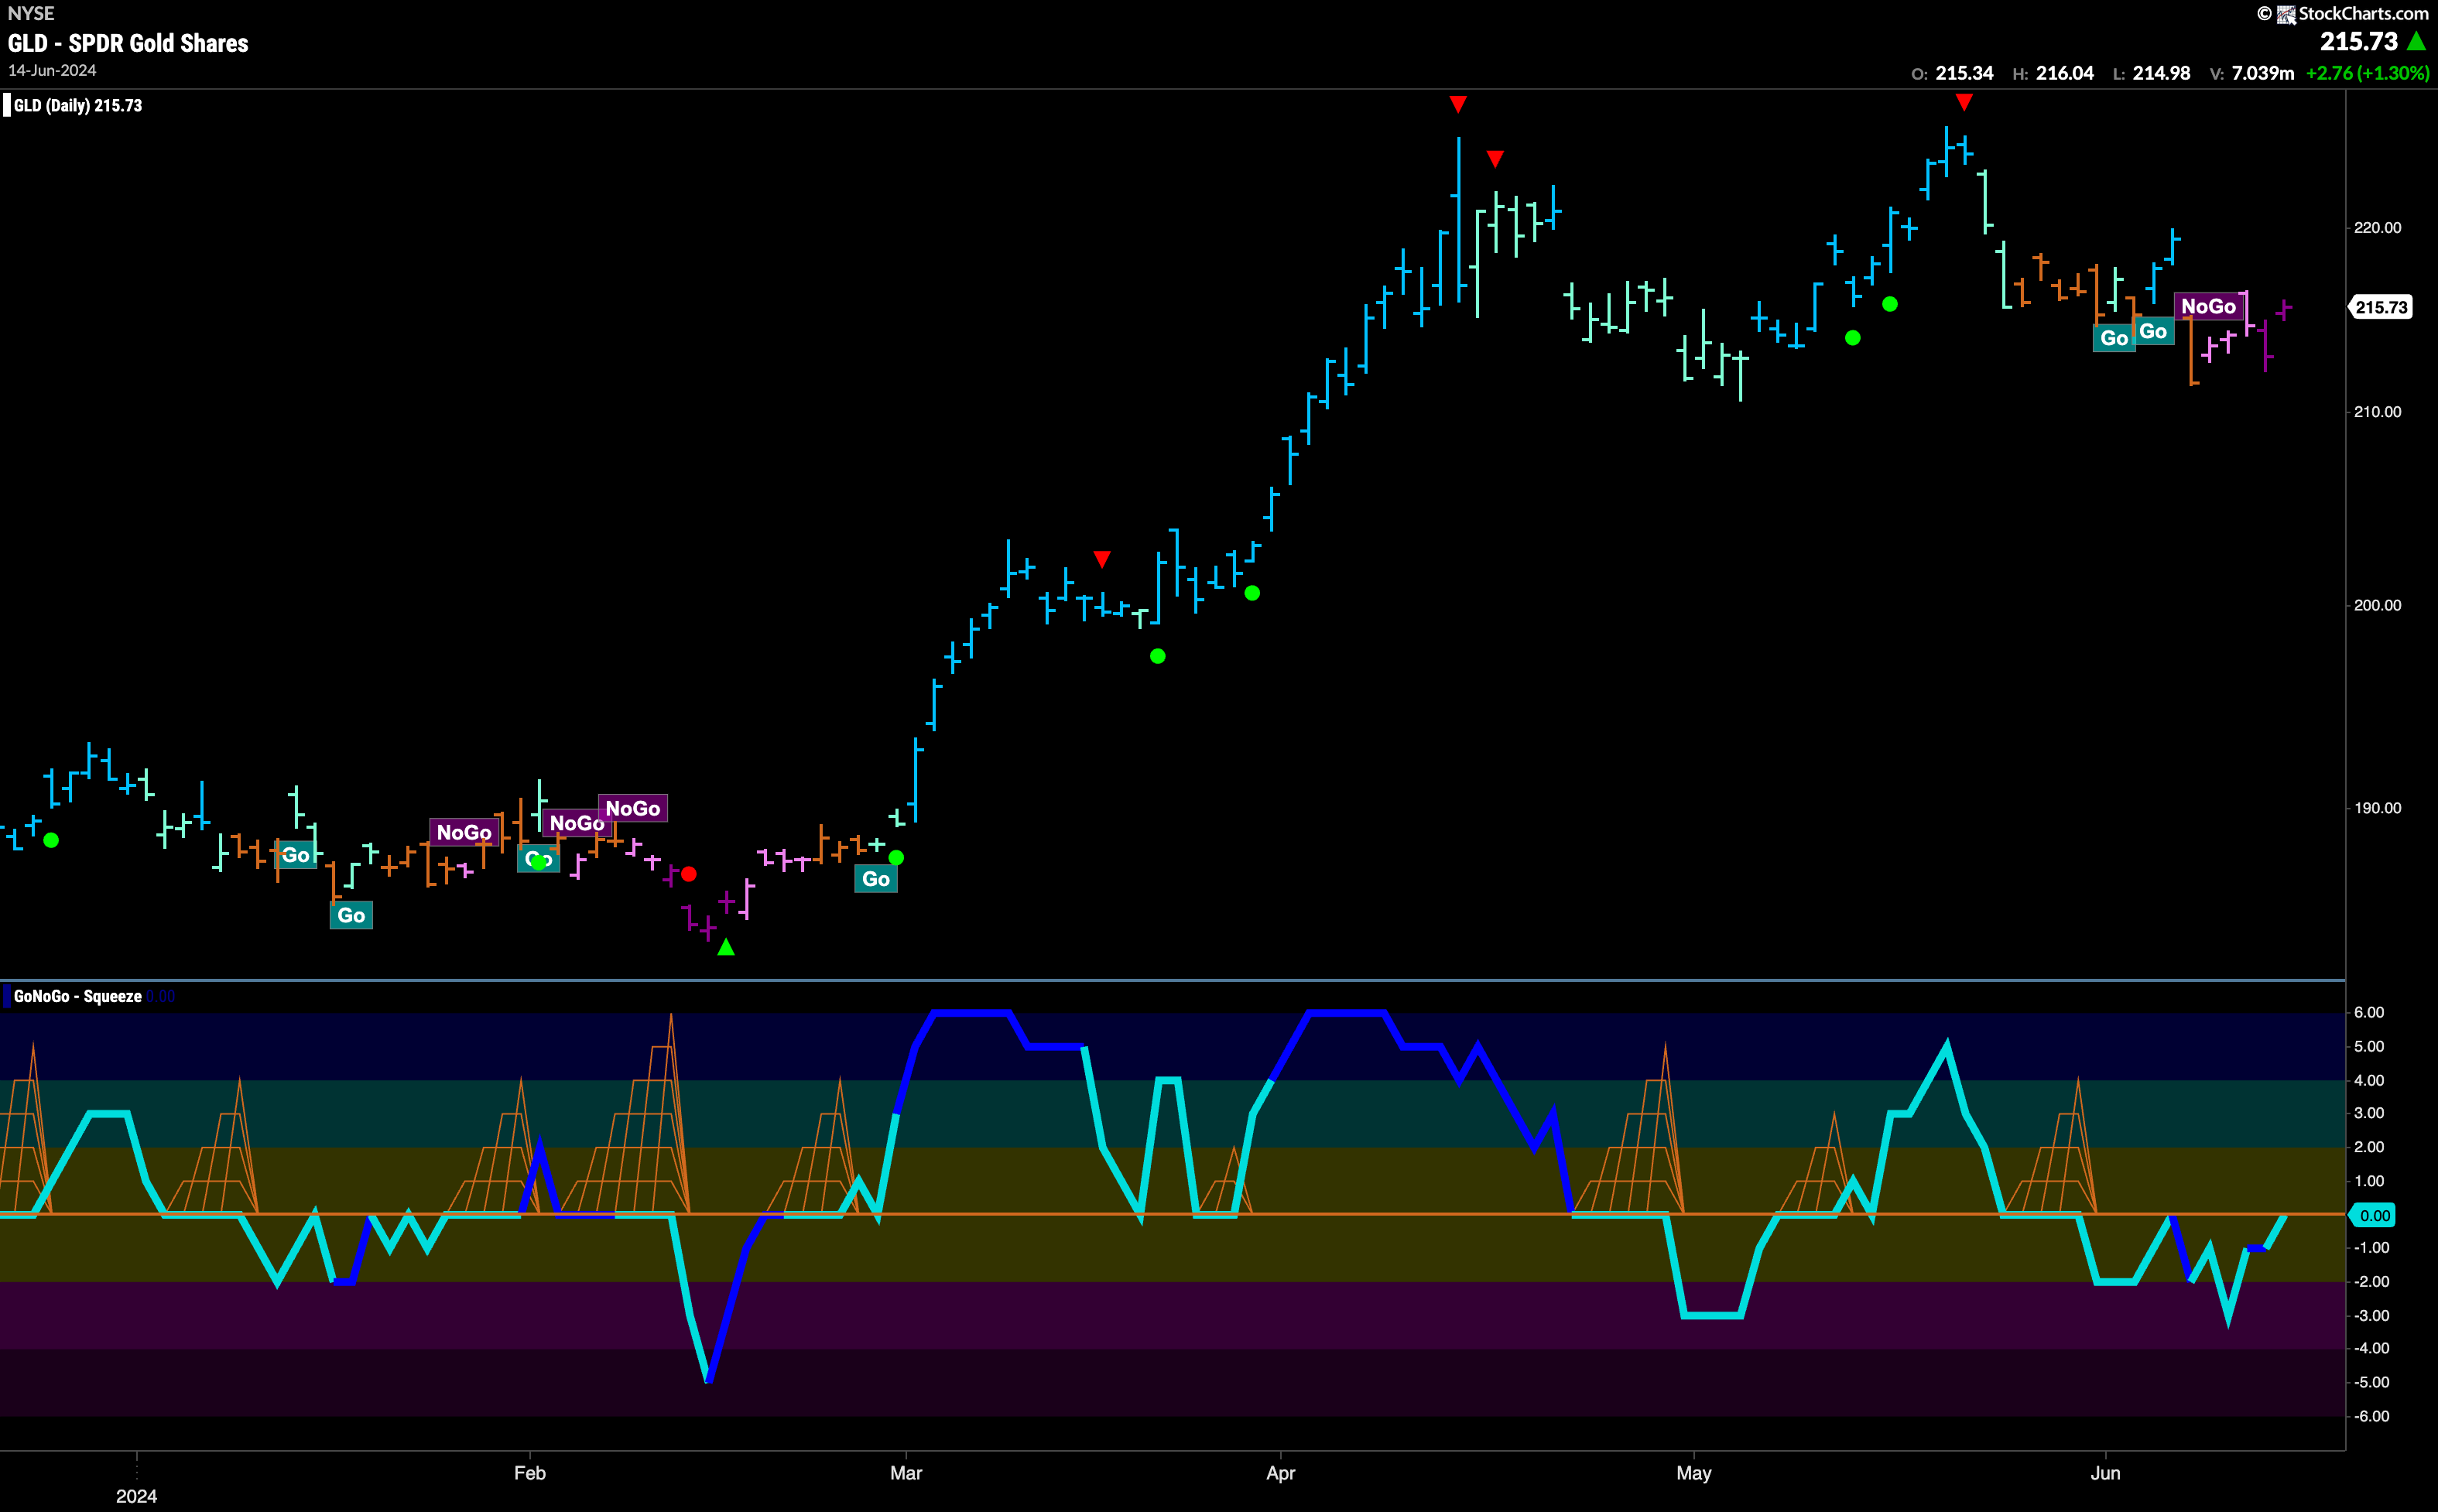
Gold Enters “NoGo” Trend
After GoNoGo Oscillator broke down through the zero line a couple of weeks ago we knew it would be hard for any “Go” bars to survive. Momentum has been negative since then and has been rejected by the zero line. This week, a “NoGo” began, and after weaker pink bars we saw strong purple bars to end the week. GoNoGo Oscillator is at the zero level again and we will watch to see if it finds resistance here. If it gets rejected, and turned away into negative territory then we will expect a new leg down in price and NoGo Trend Continuation.
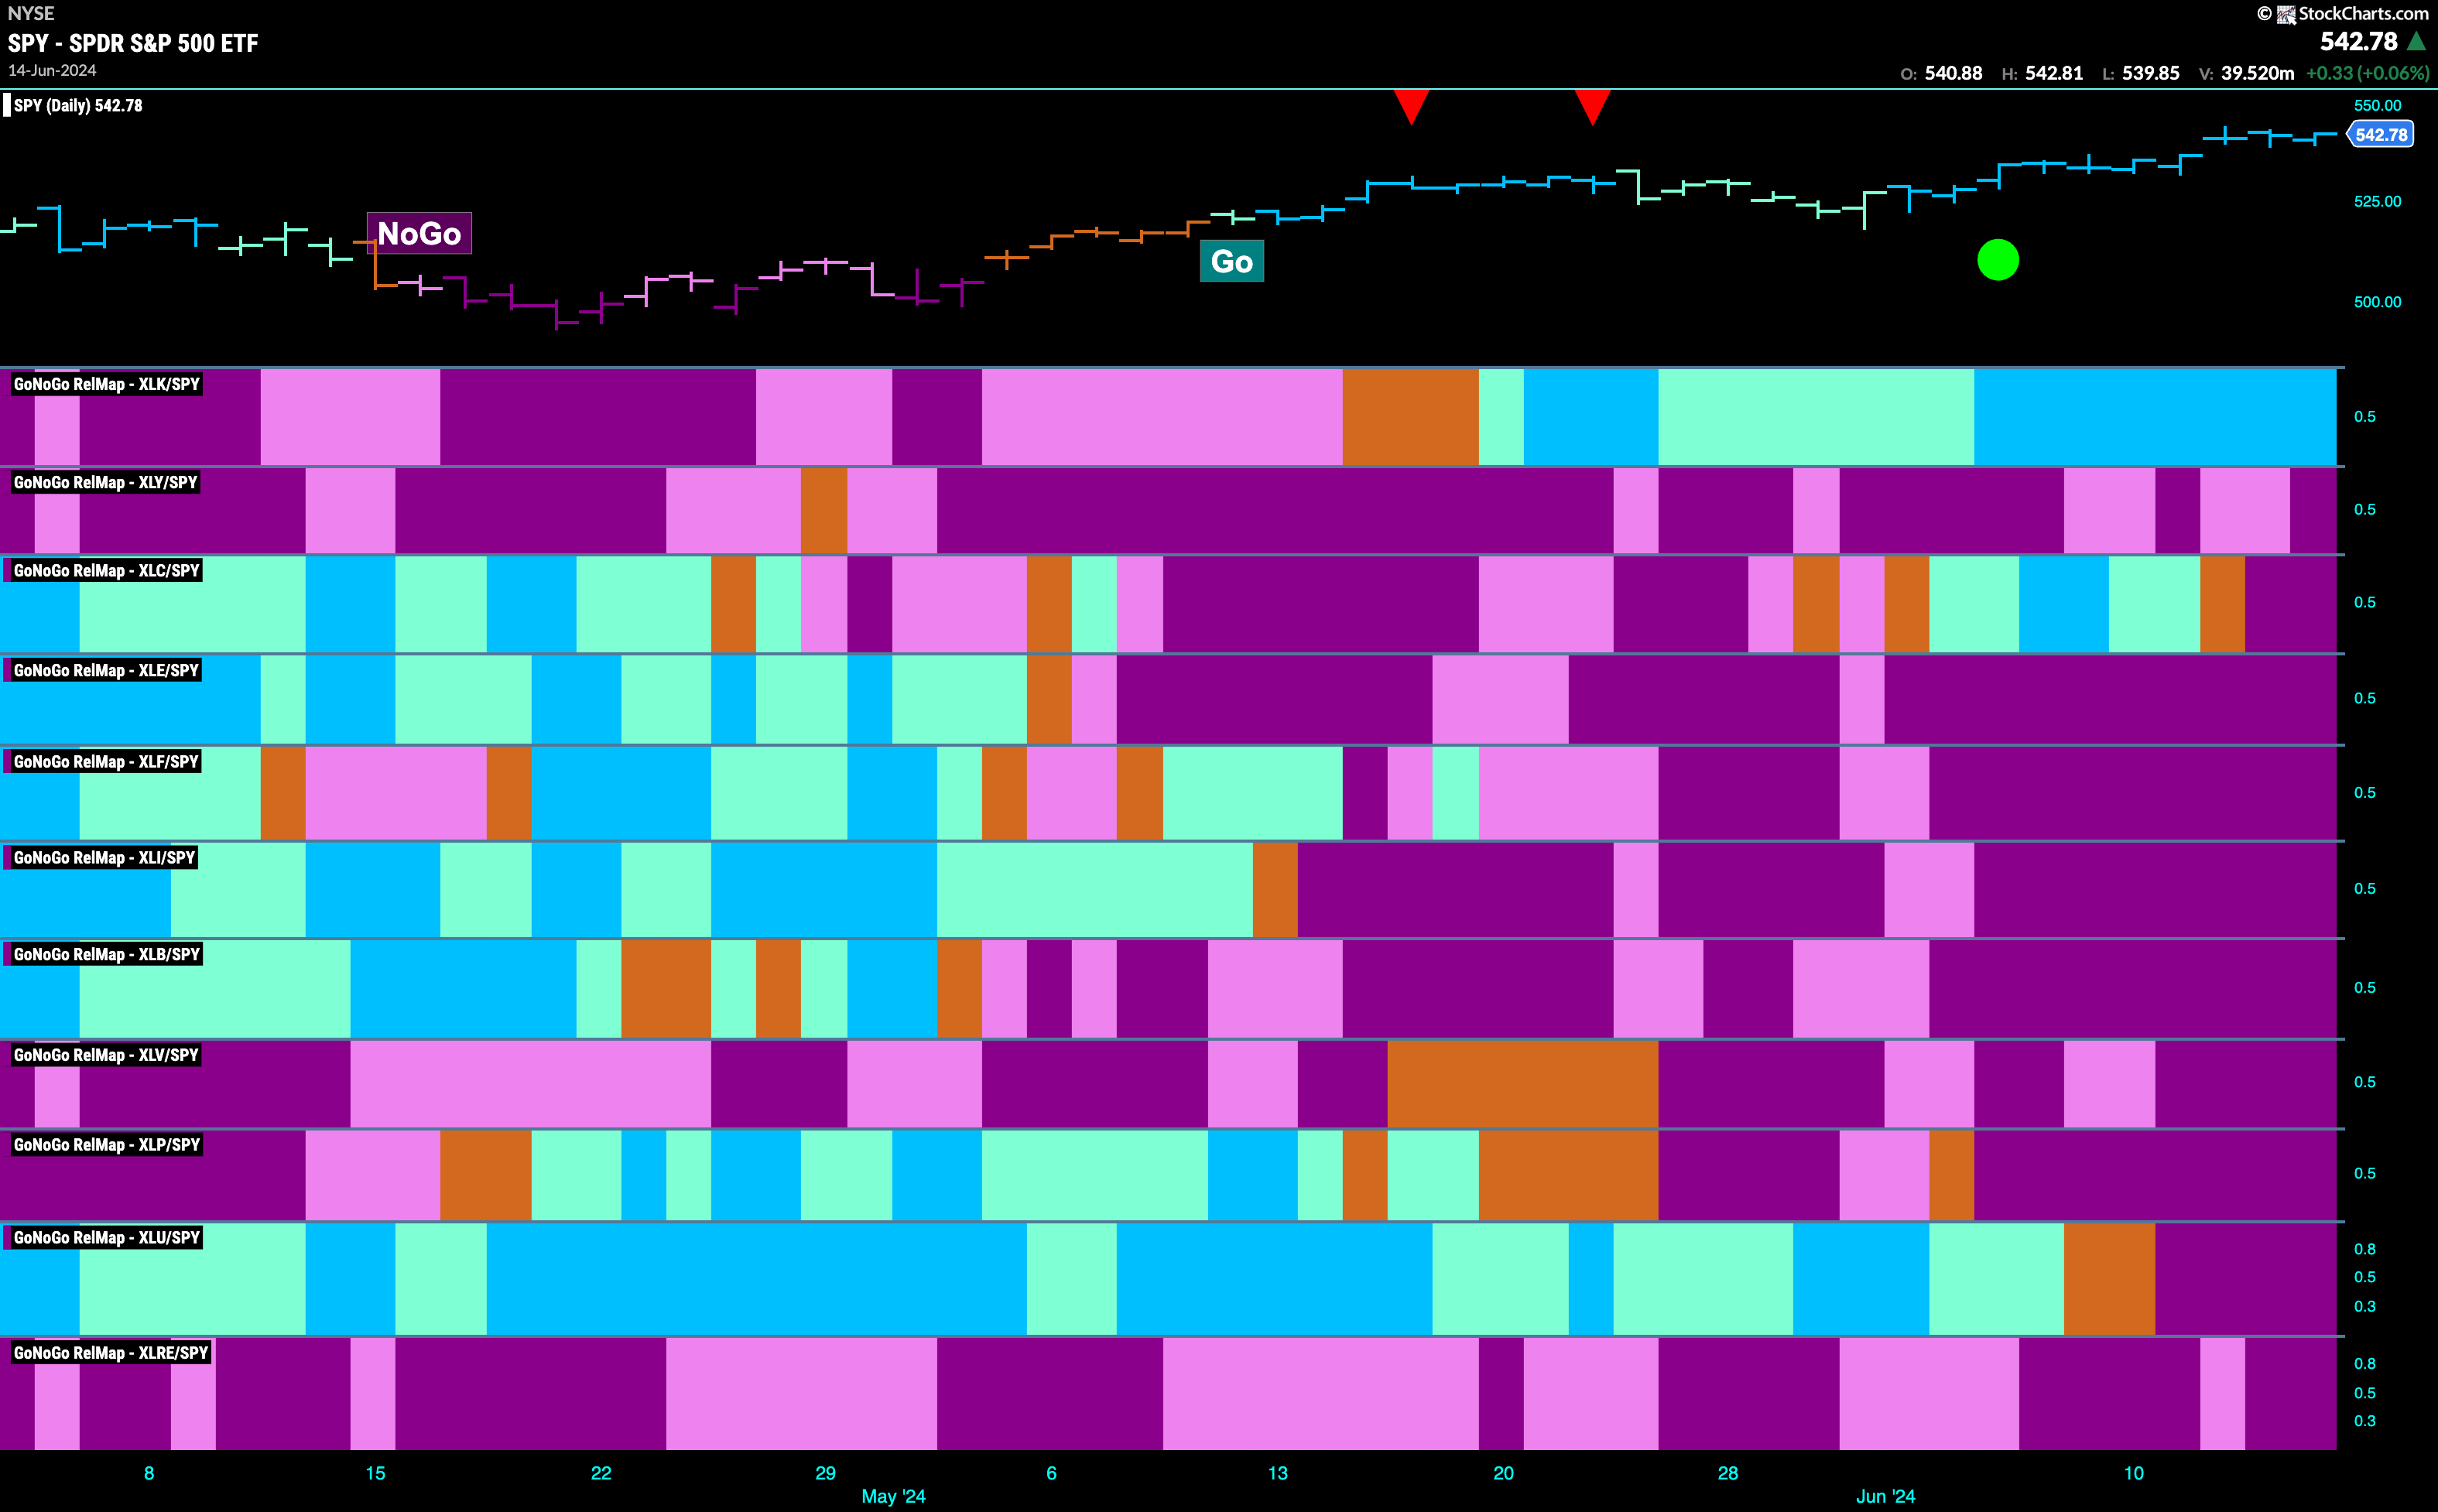
Sector RelMap
Below is the GoNoGo Sector RelMap. This GoNoGo RelMap applies the GoNoGo Trend to the relative strength ratios of the sectors to the base index. Looking at the map, we can see that only 1 sector is outperforming the base index this week. $XLK, is painting relative “Go” bars.
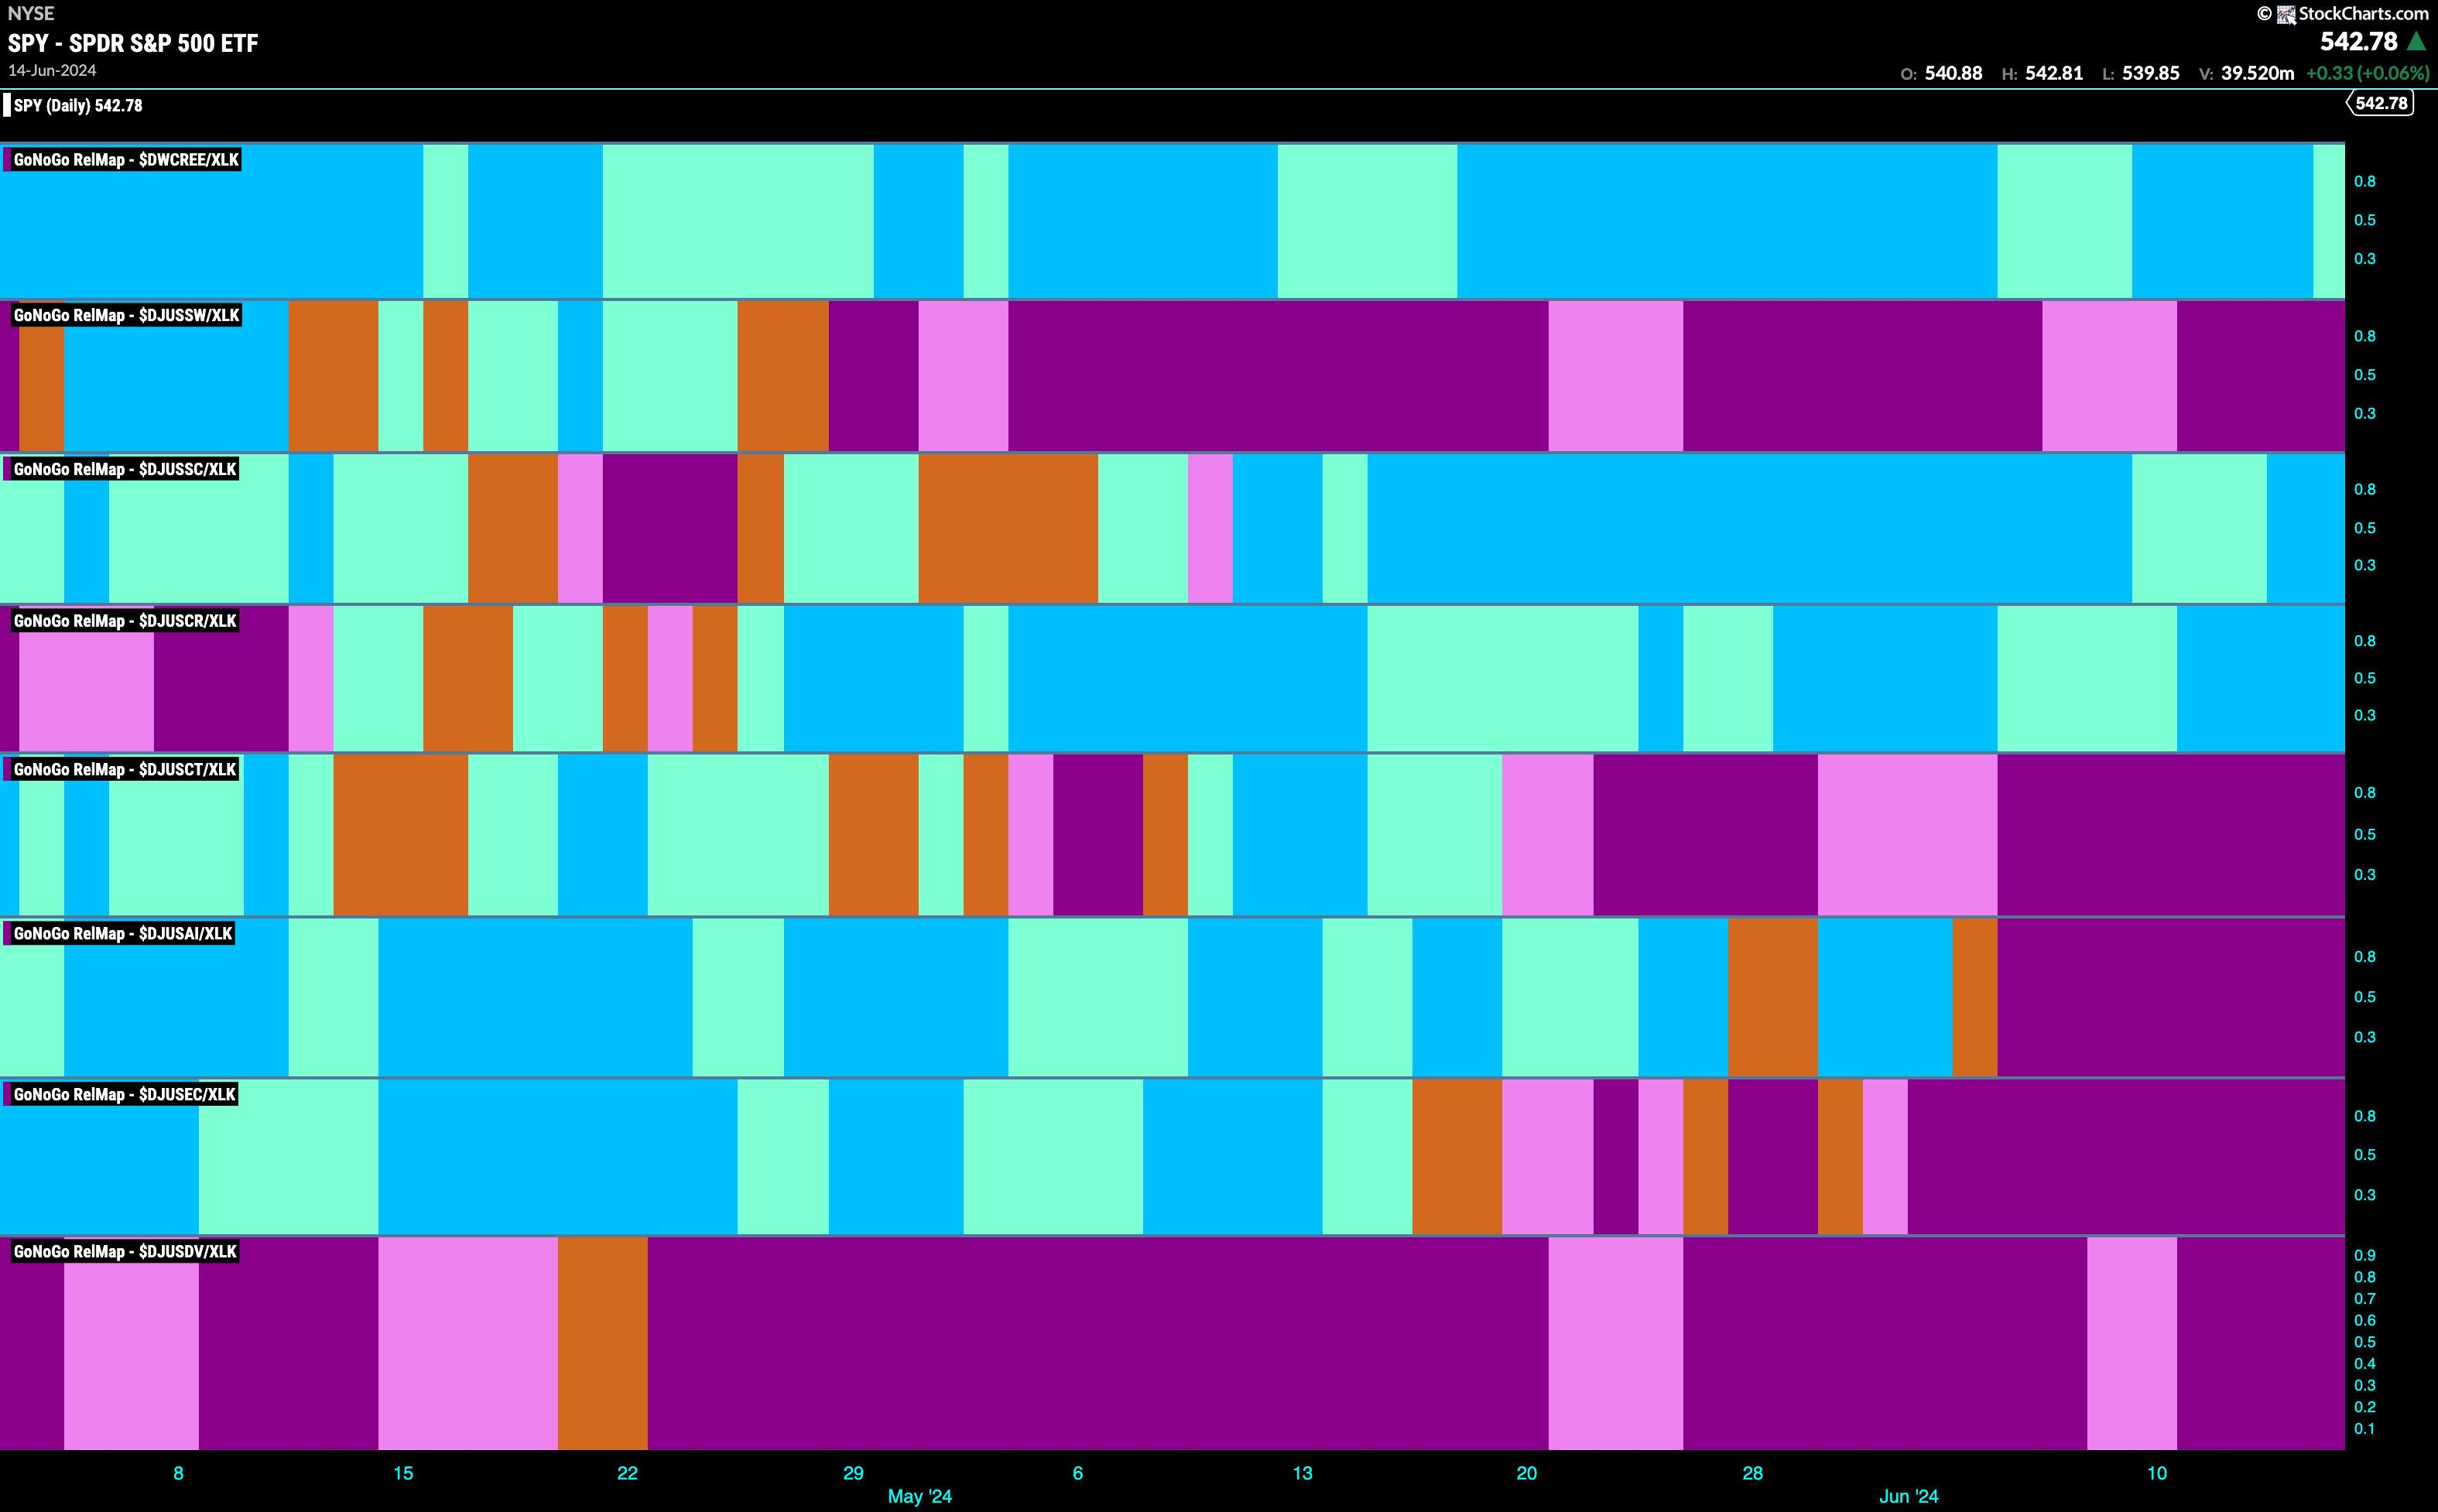
Technology Sub-Group RelMap
The GoNoGo Sector RelMap above shows that technology is the lone driver of these equity highs. While that kind of thin leadership may be a concern for many analysts, we can break down the sector to look for possible opportunities within the out-performing sector. Below is the Sub-Group RelMap for the technology sector. We can see that there are some areas of leadership that have been in persistent relative “Go” trends. Renewable energy remains in a “Go” trend in the top panel, albeit painting a weaker aqua bar to end the week. Semiconductors and computer hardware are the other two that are in relative “Go” trends and those trends are strong.
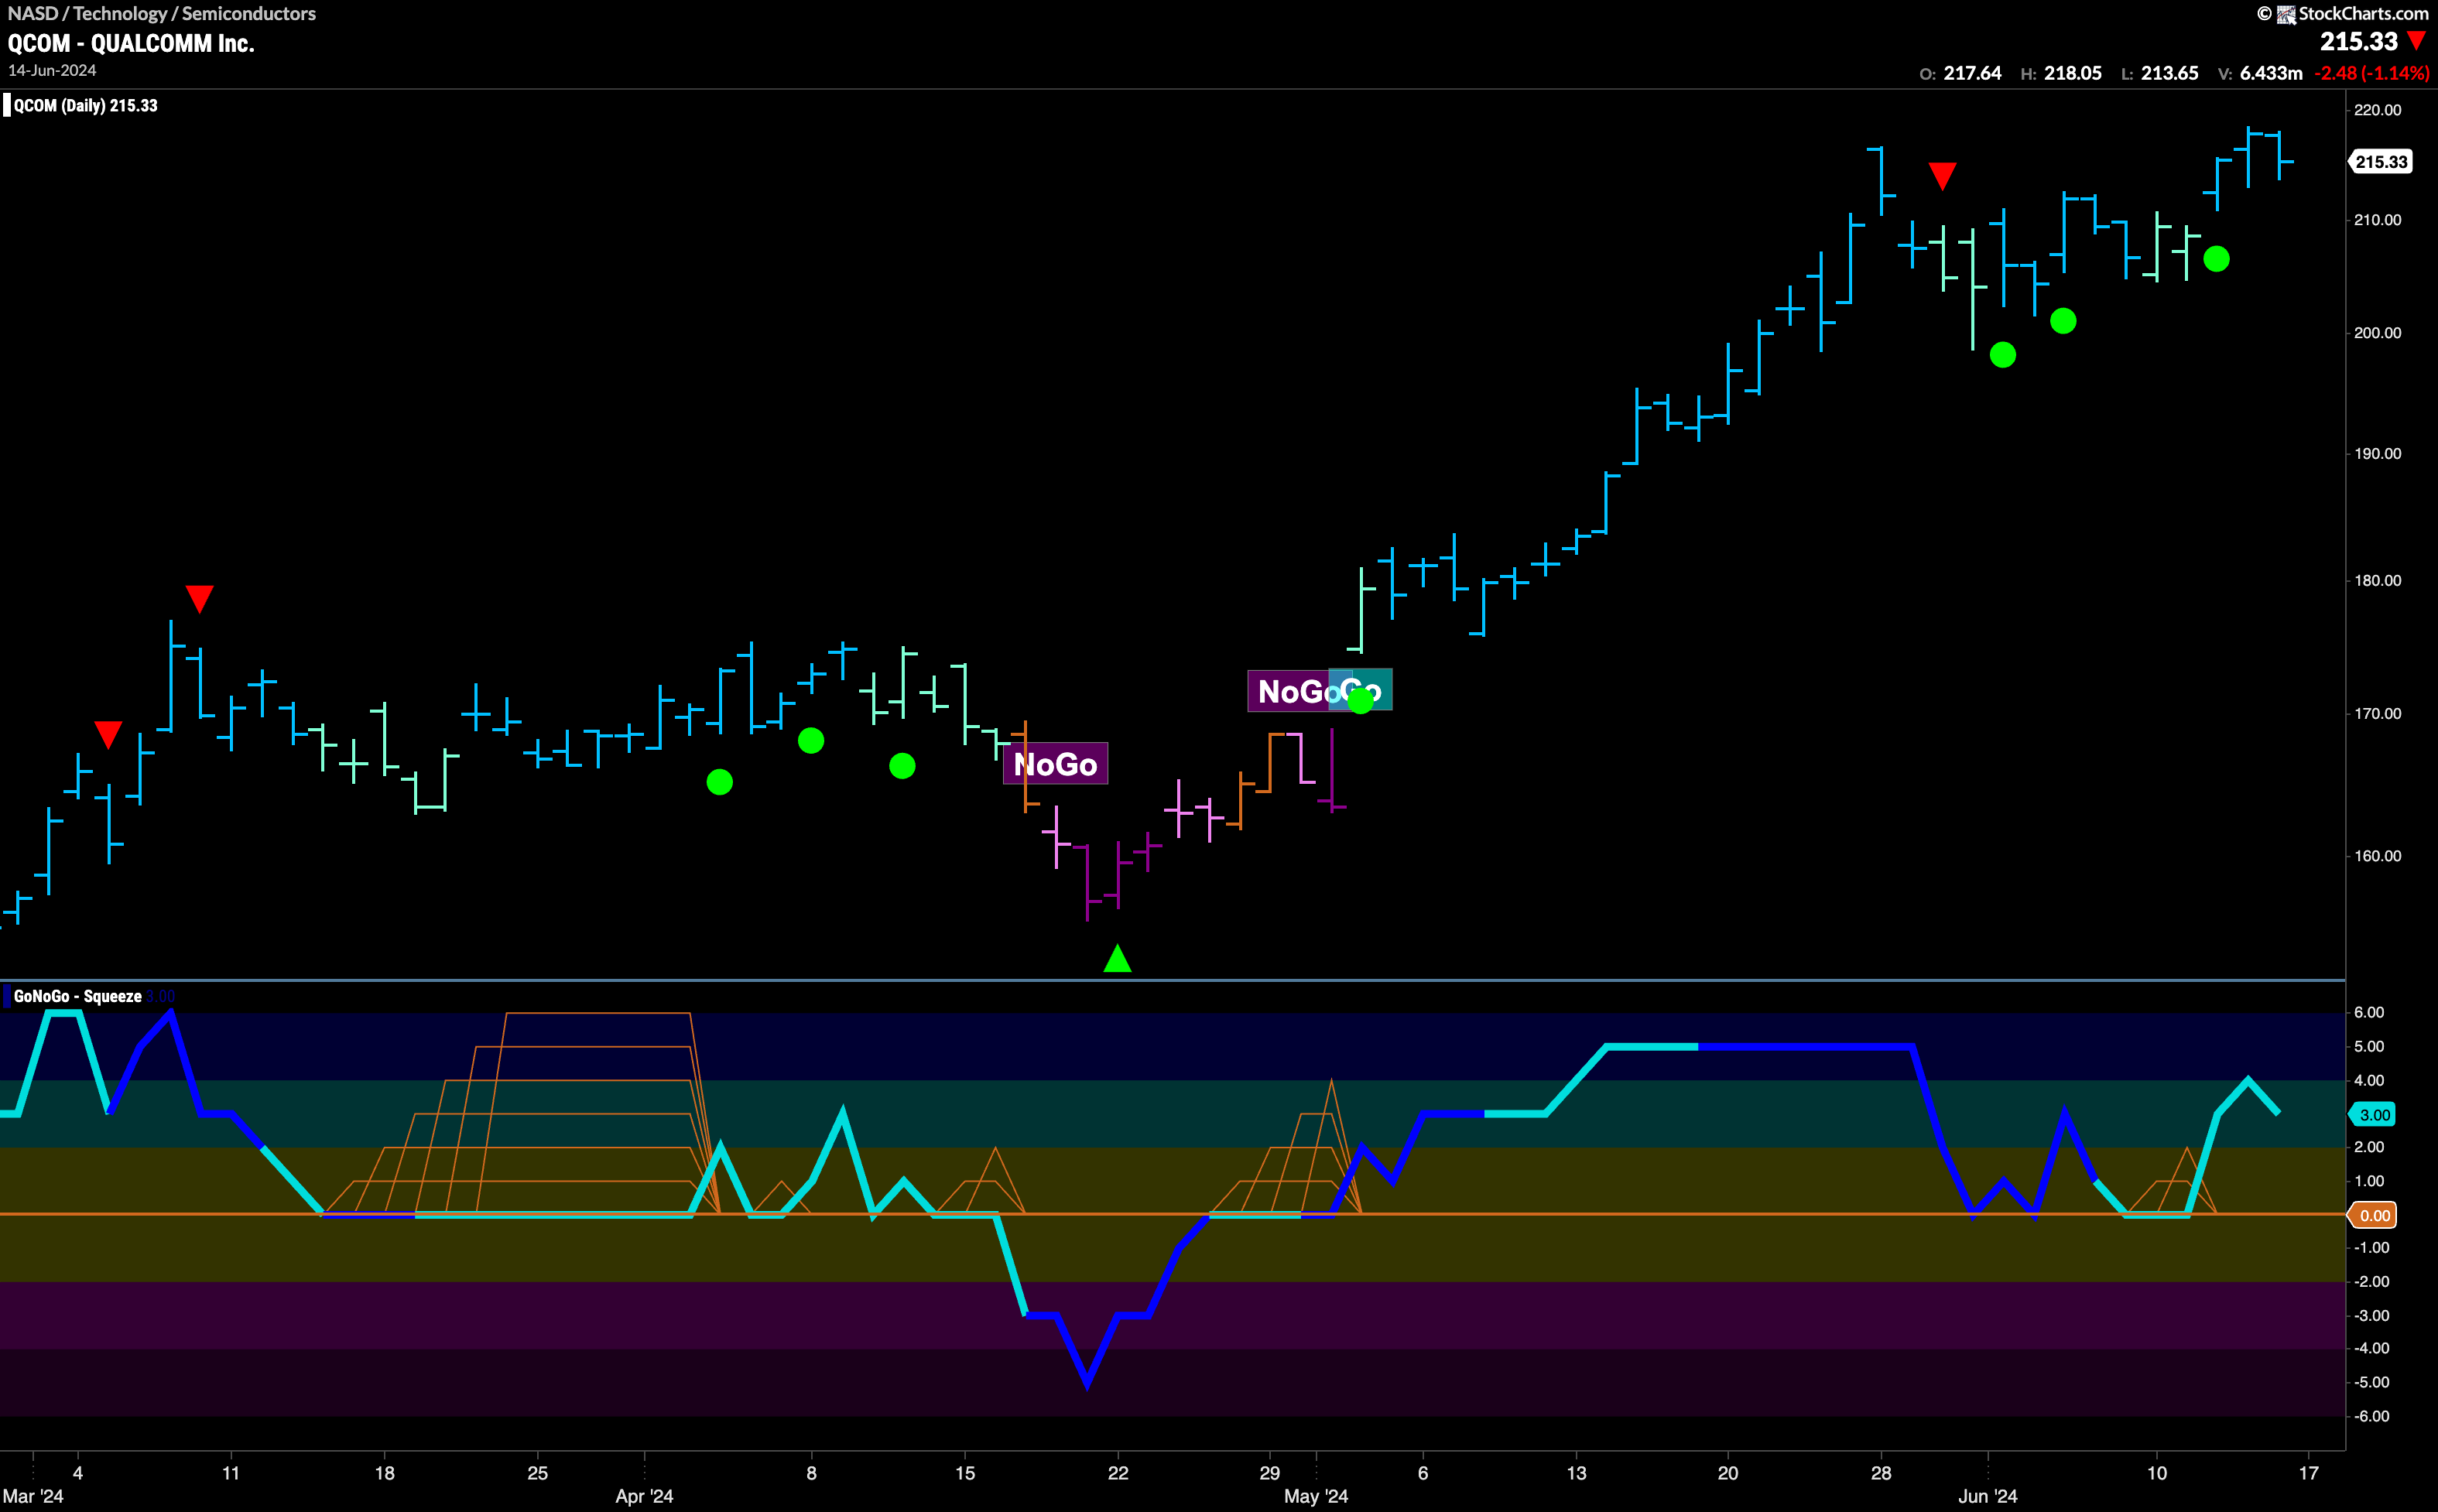
$QCOM Breaking to New Highs
Qualcomm, Inc has been in a “Go” trend since May and after hitting a high later that month entered a period of consolidation. We saw a Go Countertrend Correction Icon (red arrow) that informed us price may struggle to go higher in the short term. Indeed, GoNoGo Oscillator fell to the zero line but importantly has continued to find support at that level. This has led to a clustering of Go Trend Continuation Icons and as the oscillator moves further into positive territory we see price pushing to challenge for new highs. We will look for price to consolidate and move higher from here.
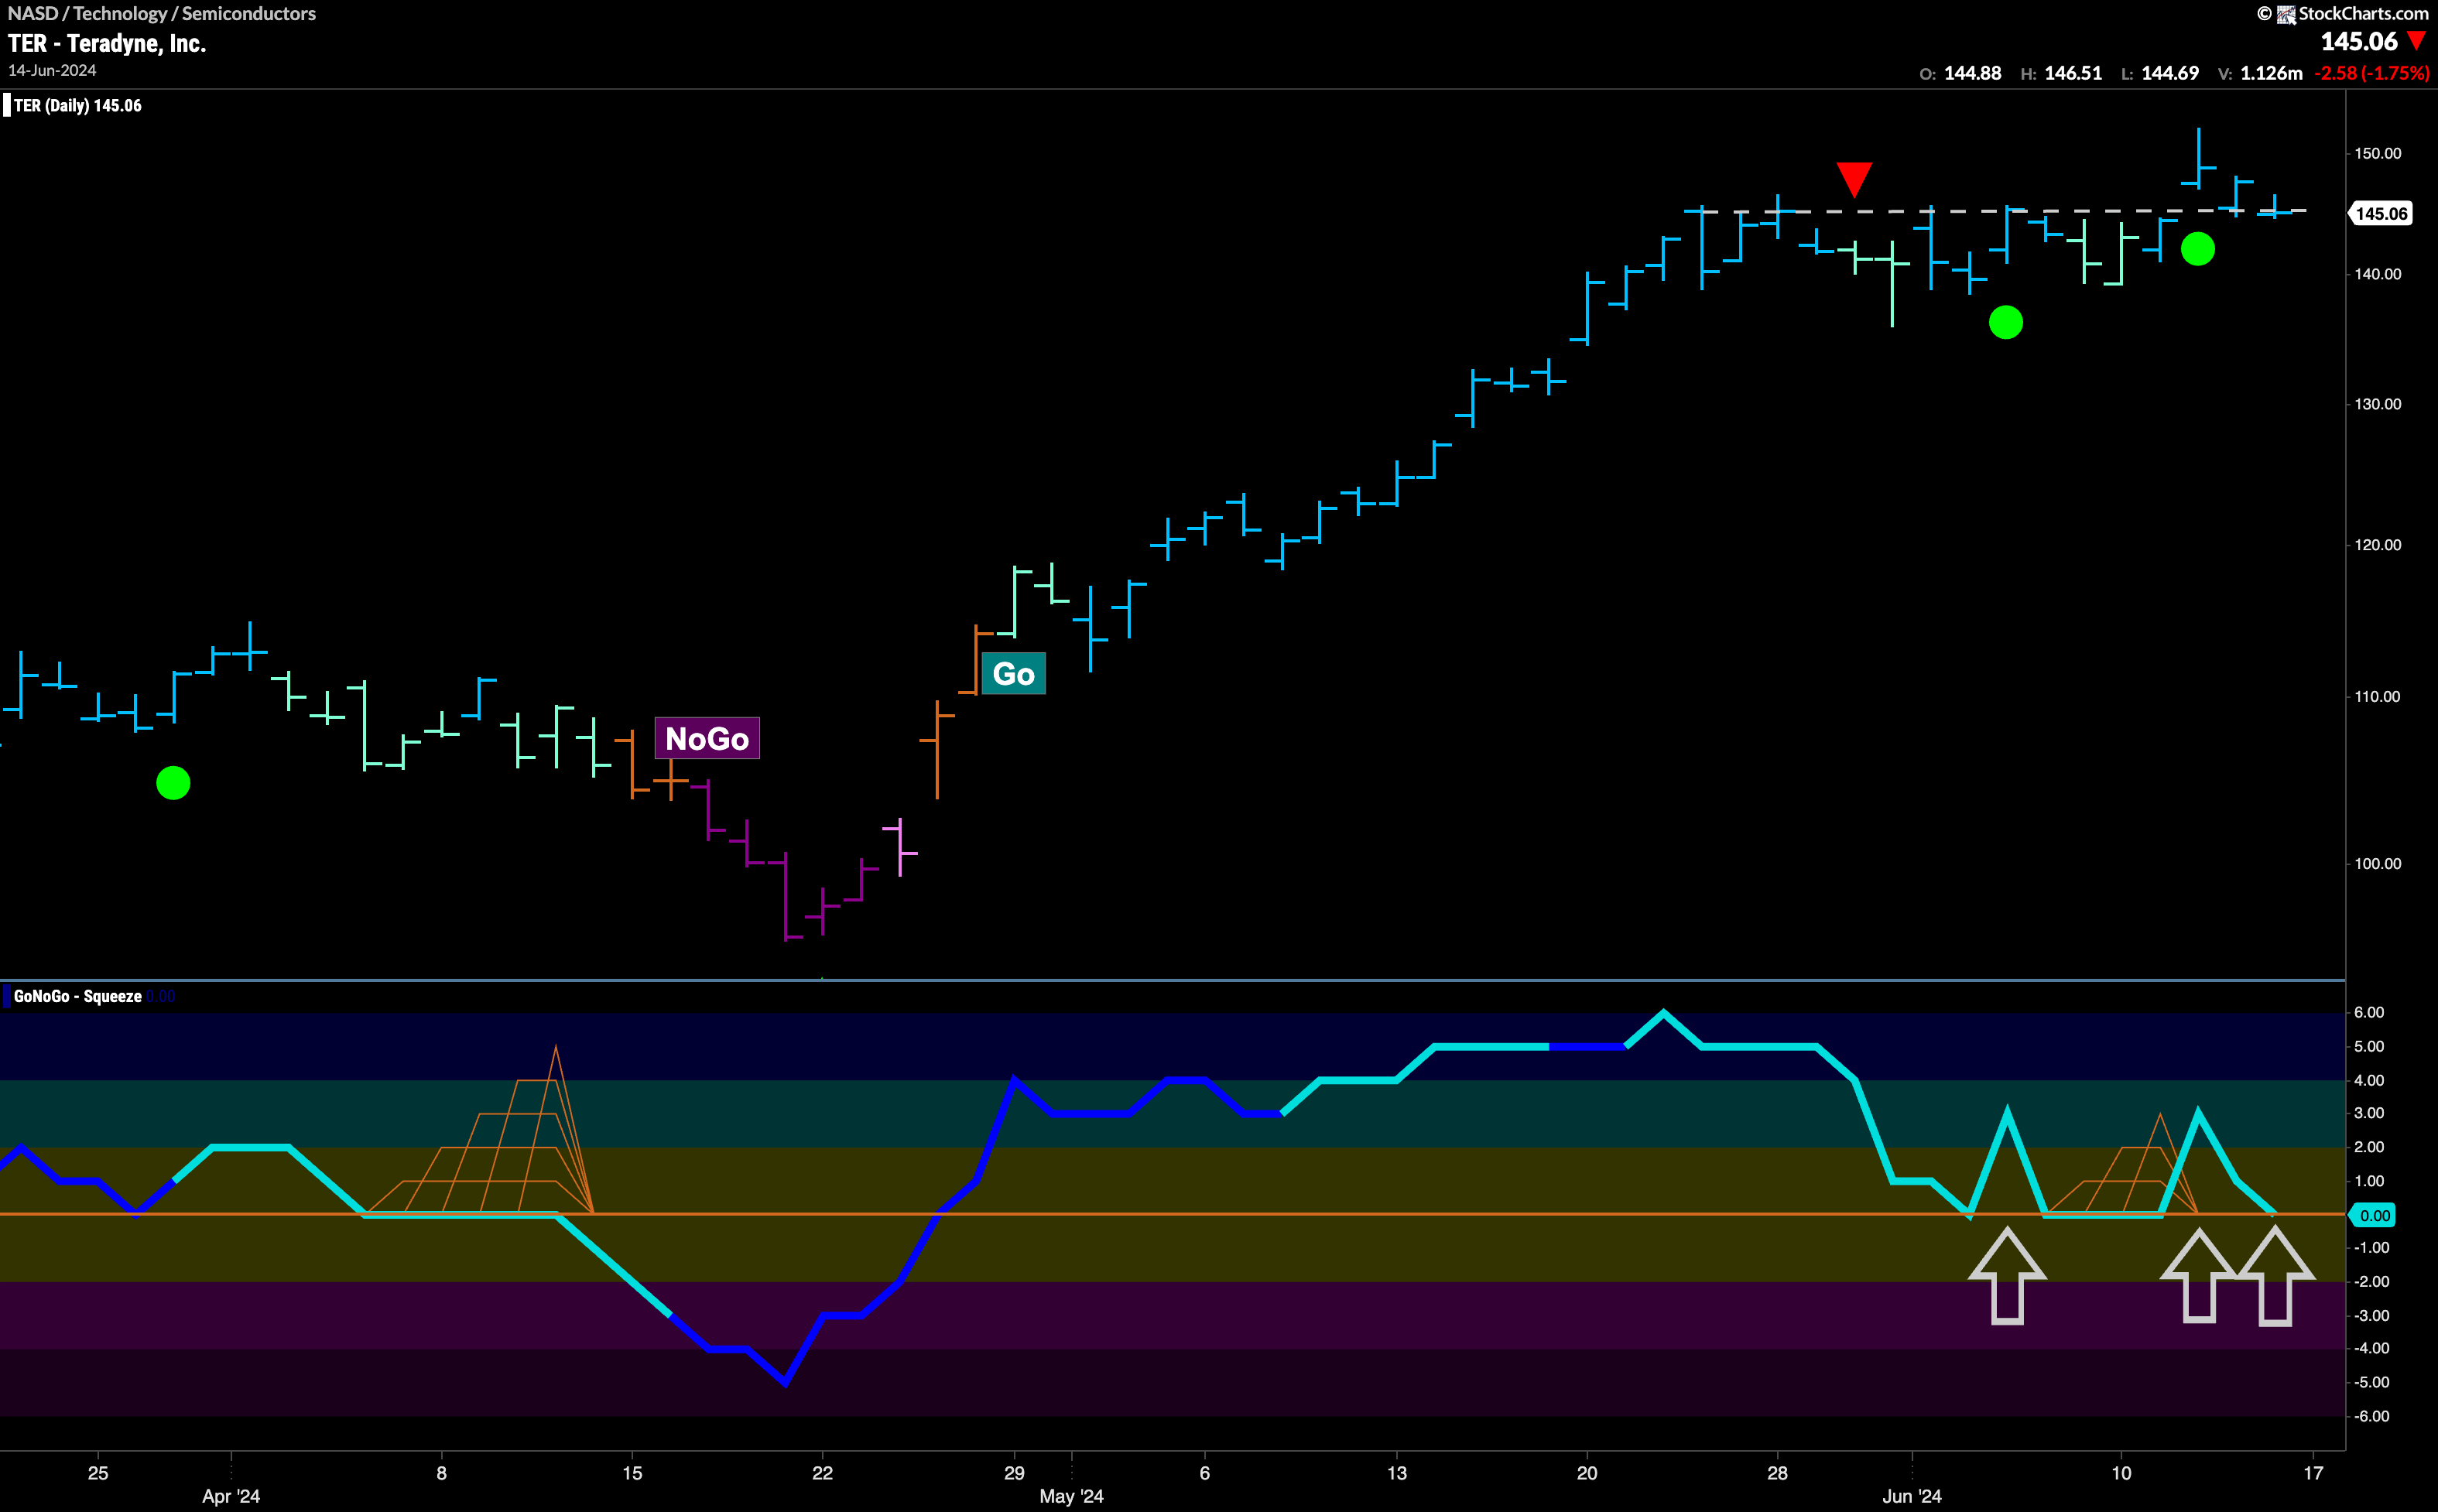
$TER
Teradyne, Inc has also been in a “Go” trend for over a month. We see that price has been moving mostly sideways since the highs at the end of May and GoNoGo Trend sprinkled in some weaker aqua bars after the Go Countertrend Correction Icon (red arrow) we saw just after the high. Looking at the oscillator panel we can see that GoNoGo Oscillator was able to find support several times at that level and is now testing zero once again. Price has been able to set a new higher high but needs to consolidate and find support here. We will watch to see if the oscillator uses the zero line as support again and rallies into positive territory. If it does, we would know that momentum is resurgent in the direction of the underlying “Go” trend and would expect price to climb again.
