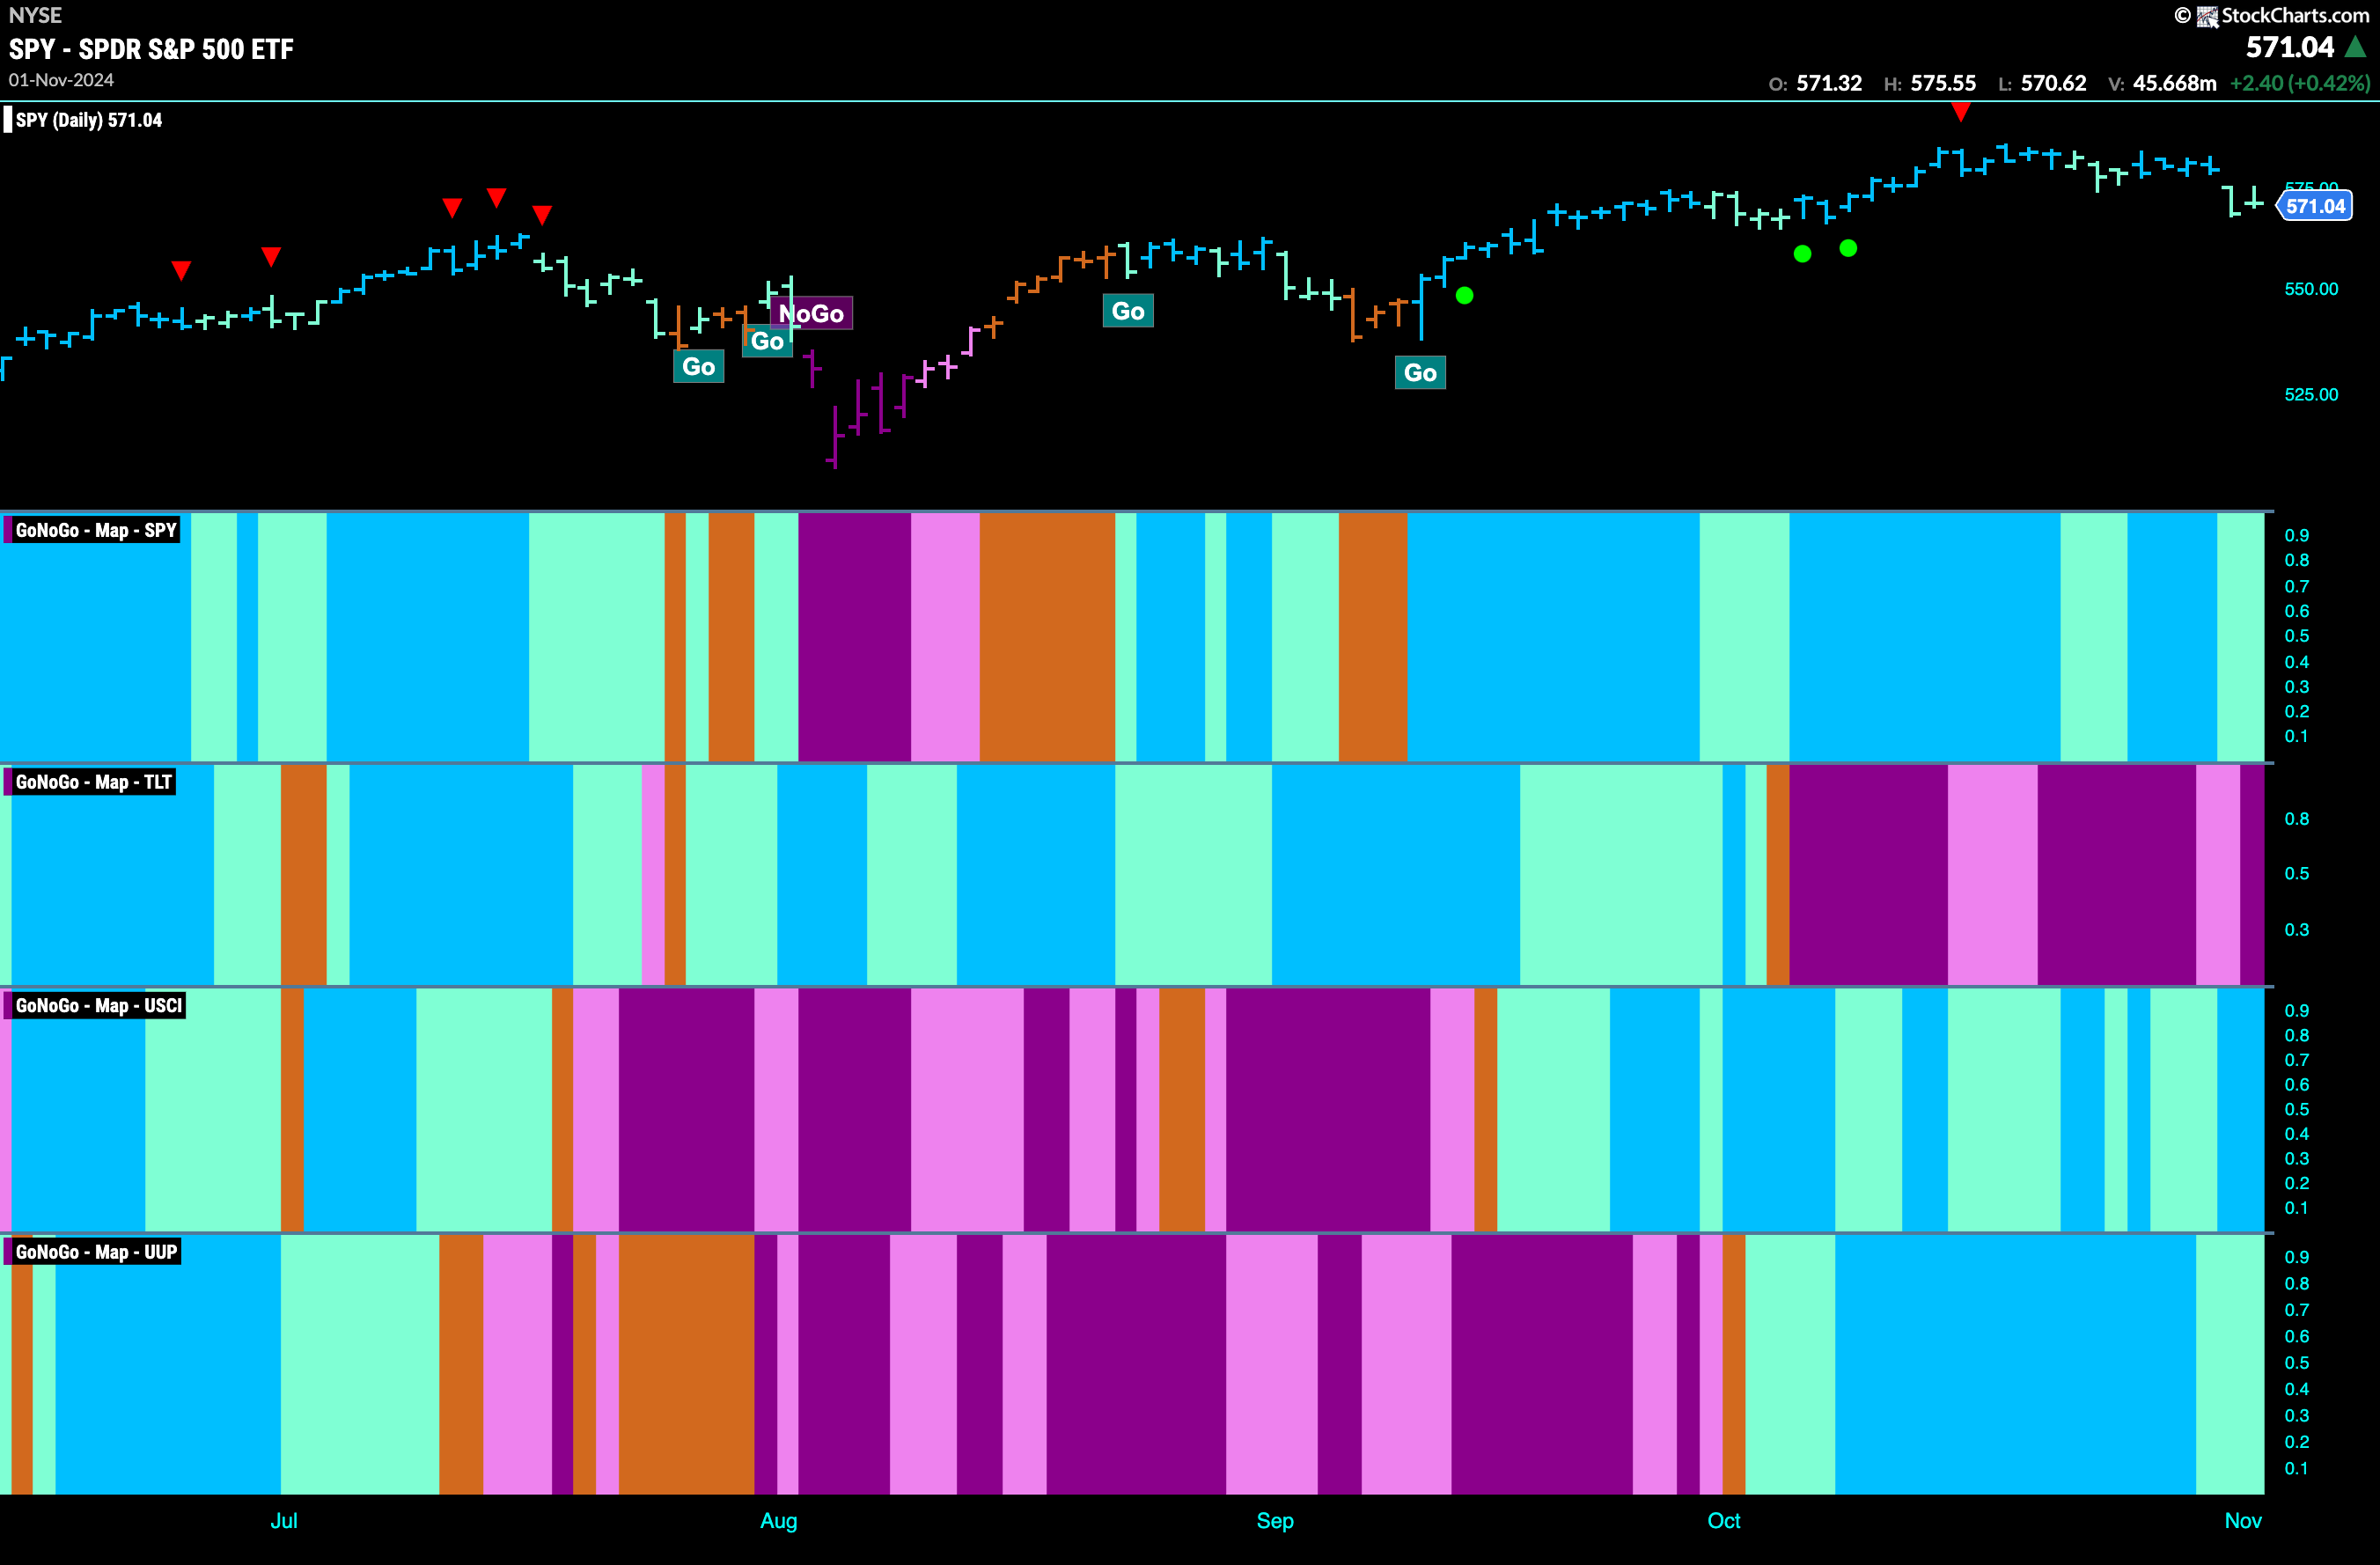
Good morning and welcome to this week’s Flight Path. Equities saw the “Go” trend remain in place this week but we saw weakness with a few aqua bars. GoNoGo Trend shows that the “NoGo” trend strengthened at the end of the week in treasury bond prices. U.S. commodities hung on to the “Go” trend and indeed we saw strength with bright blue bars. The U.S. dollar also remained in a “Go” trend but the indicator paints weakness with aqua bars.
$SPY Shows Weakness with a Pair of Aqua Bars
The GoNoGo chart below shows that we still have been unable to conquer the high from last month. This week saw price gap lower and weaker aqua bars return as price fell further. If we turn our attention to the oscillator panel we can see that after holding at the zero level for a few bars we have broken down into negative territory and volume has increased. We will watch closely to see if this further threatens the “Go” trend that is currently in place. 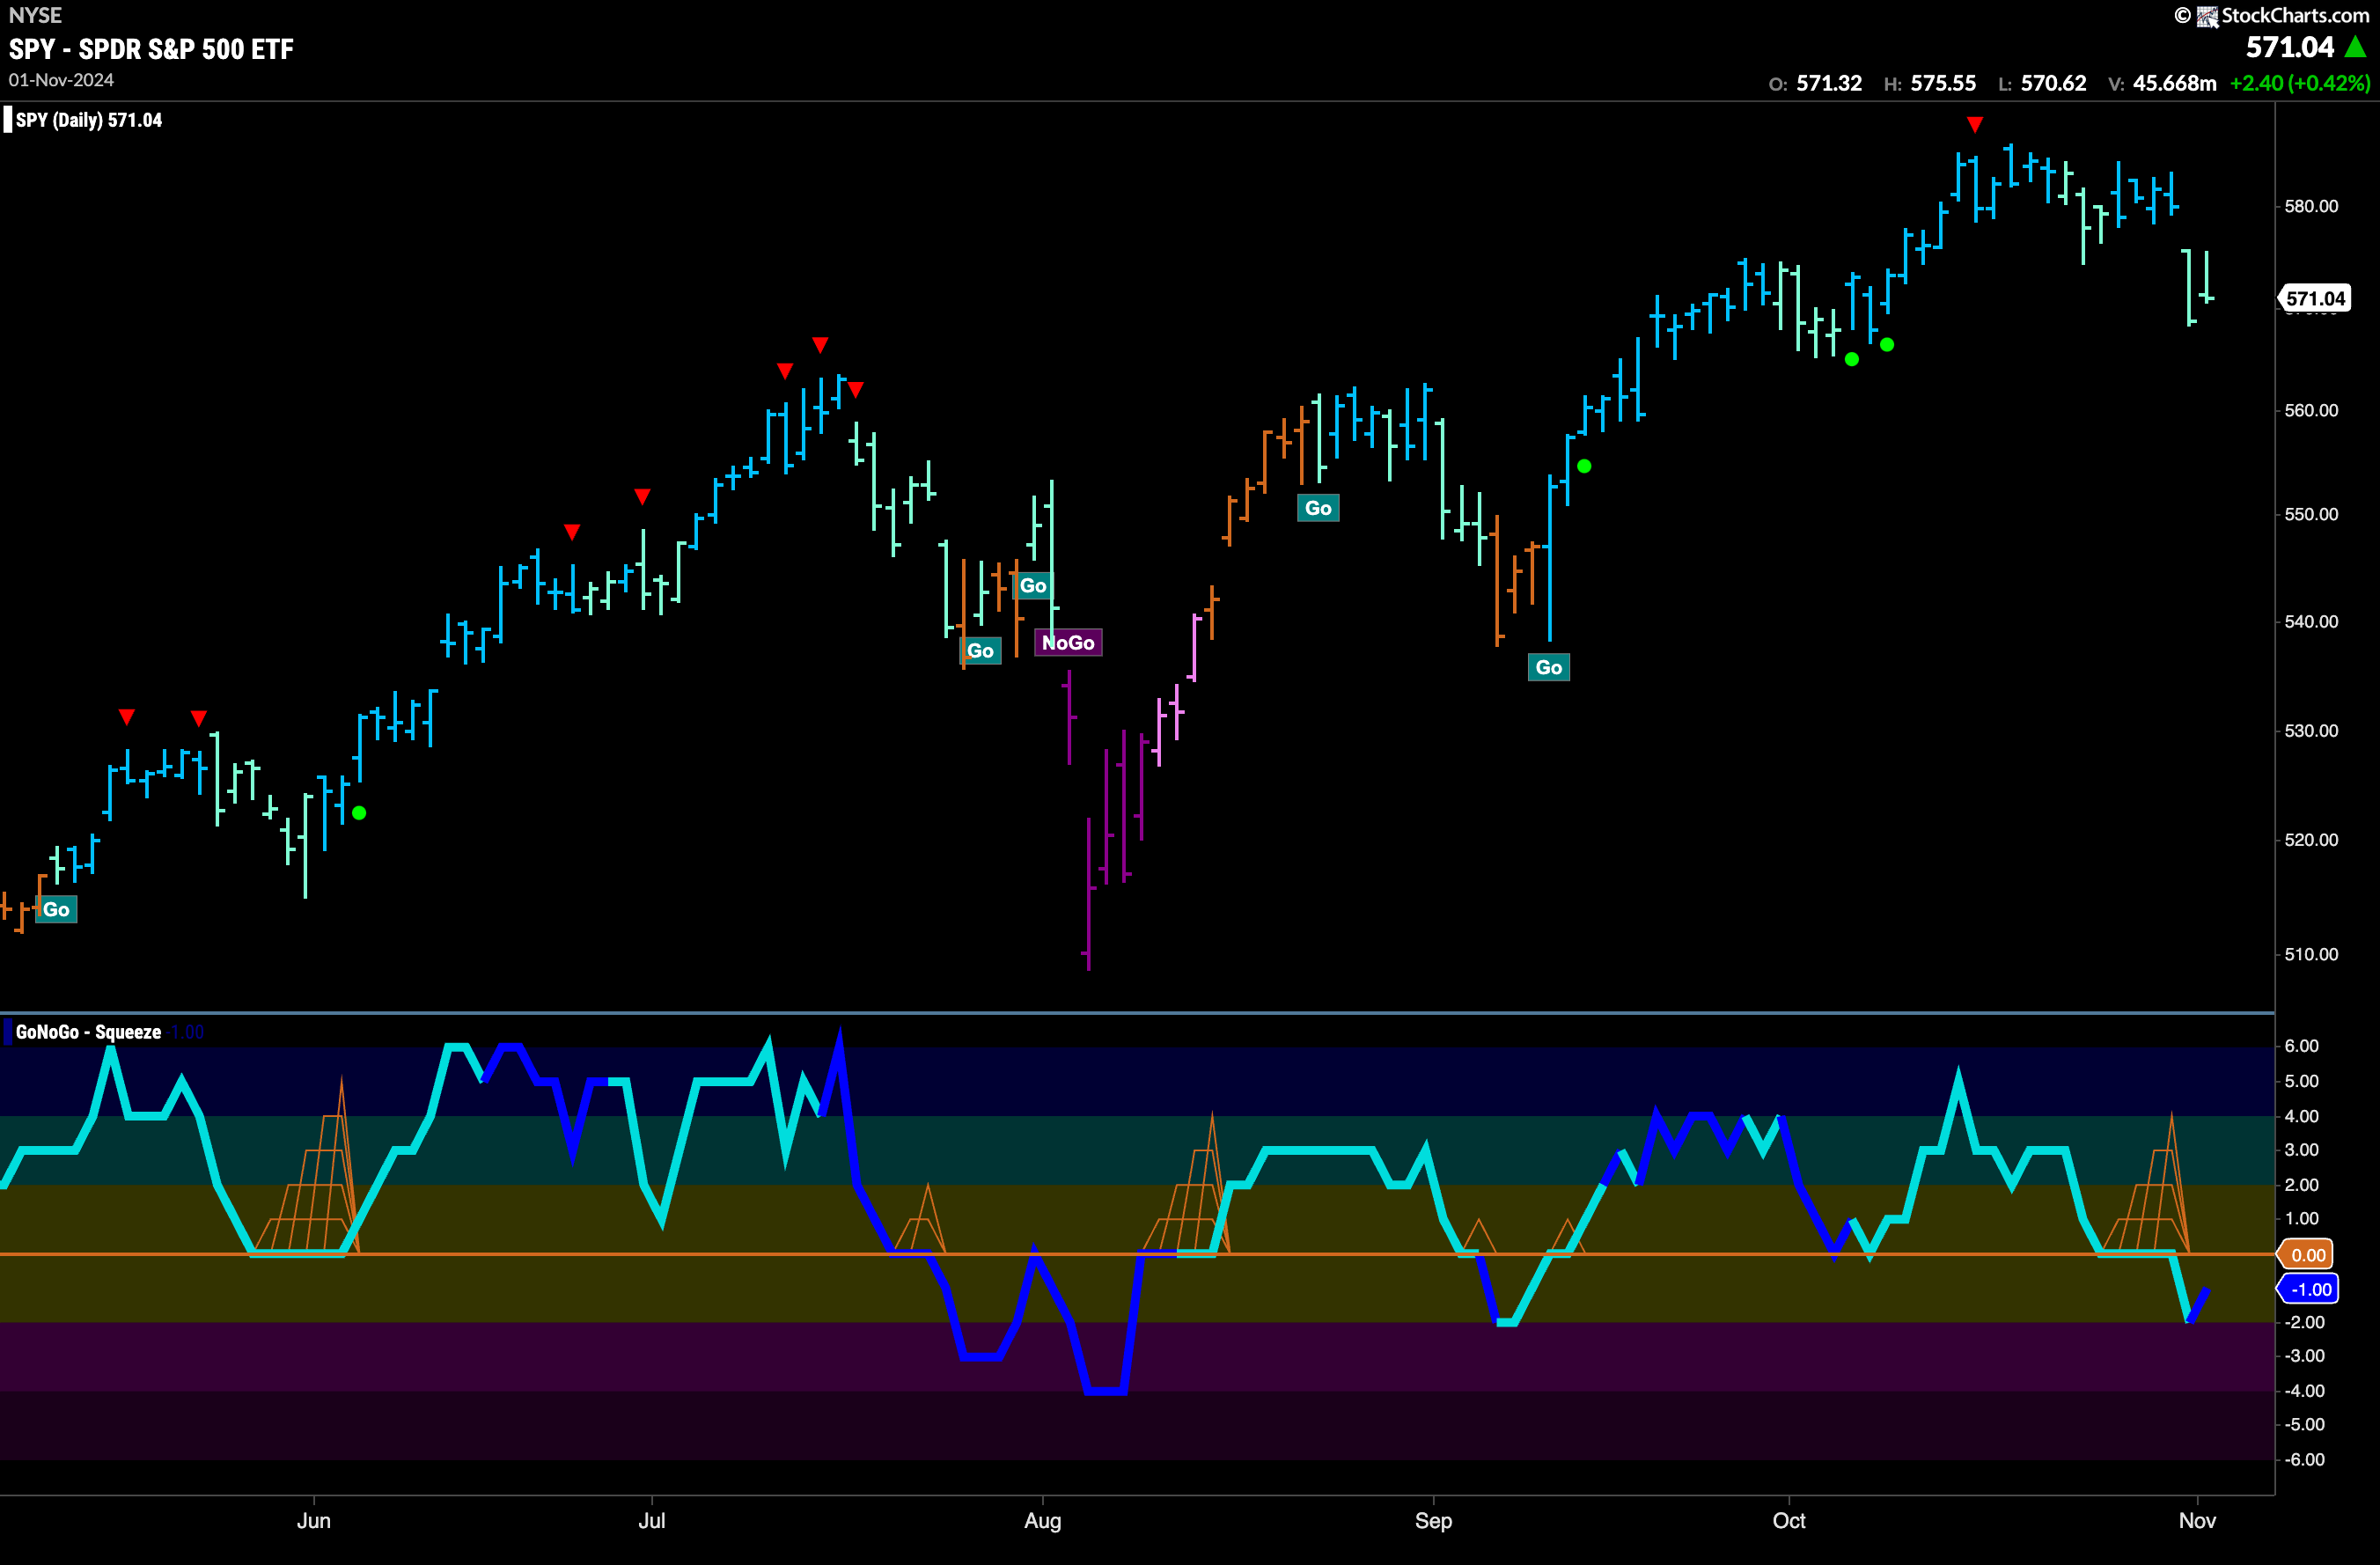
The longer time frame chart tells us that the trend remains strong but we see another lower weekly close this week after the Go Countertrend Correction Icon (red arrow) we recently noted above price. As price approaches the last high from the summer we will watch to see if it finds support. GoNoGo Oscillator is falling but still in positive territory so we will pay attention to what happens as it gets closer to the zero line.

Treasury Rates Remain in Strong “Go” Trend
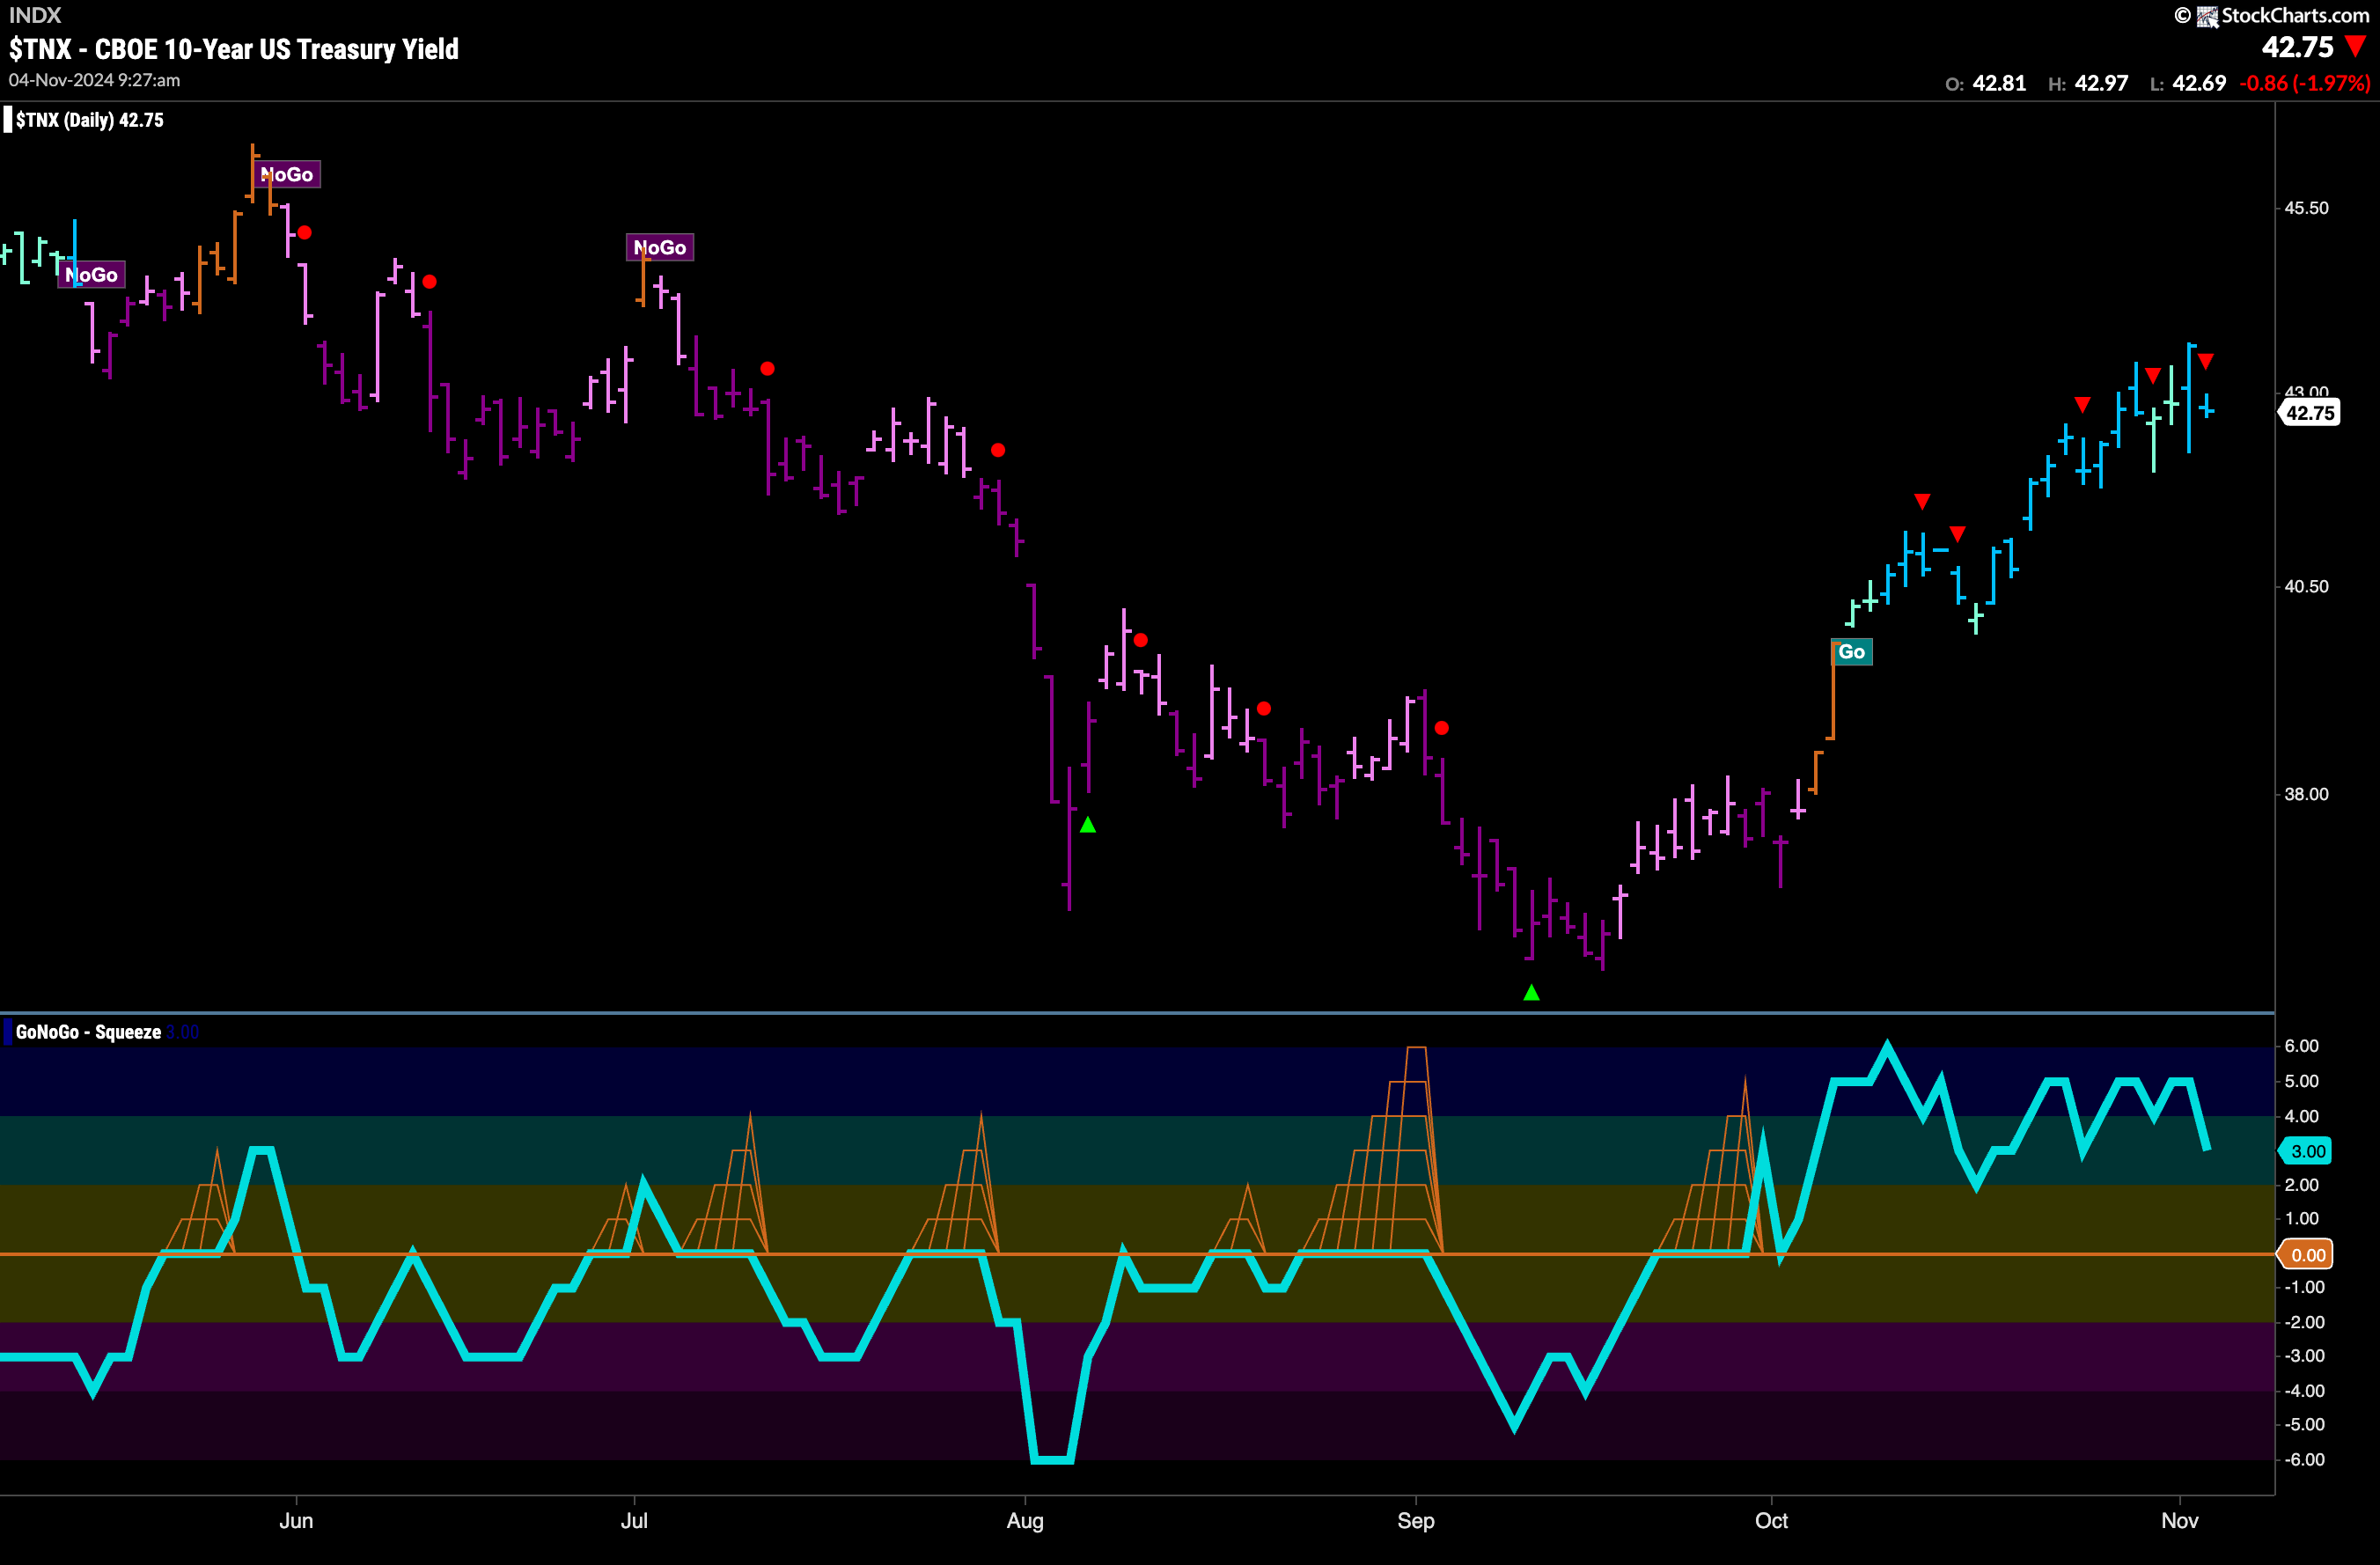
Treasury bond yields saw the “Go” trend continue this week and after a couple of weaker aqua bars the week closed with strong blue “Go” colors after price made another higher high this week. GoNoGo Oscillator shows that momentum is still in positive territory but no longer overbought as it falls to a value of 3. We will look for support at the zero level if and when it gets there.
The Dollar Sees Weakness in “Go” Trend
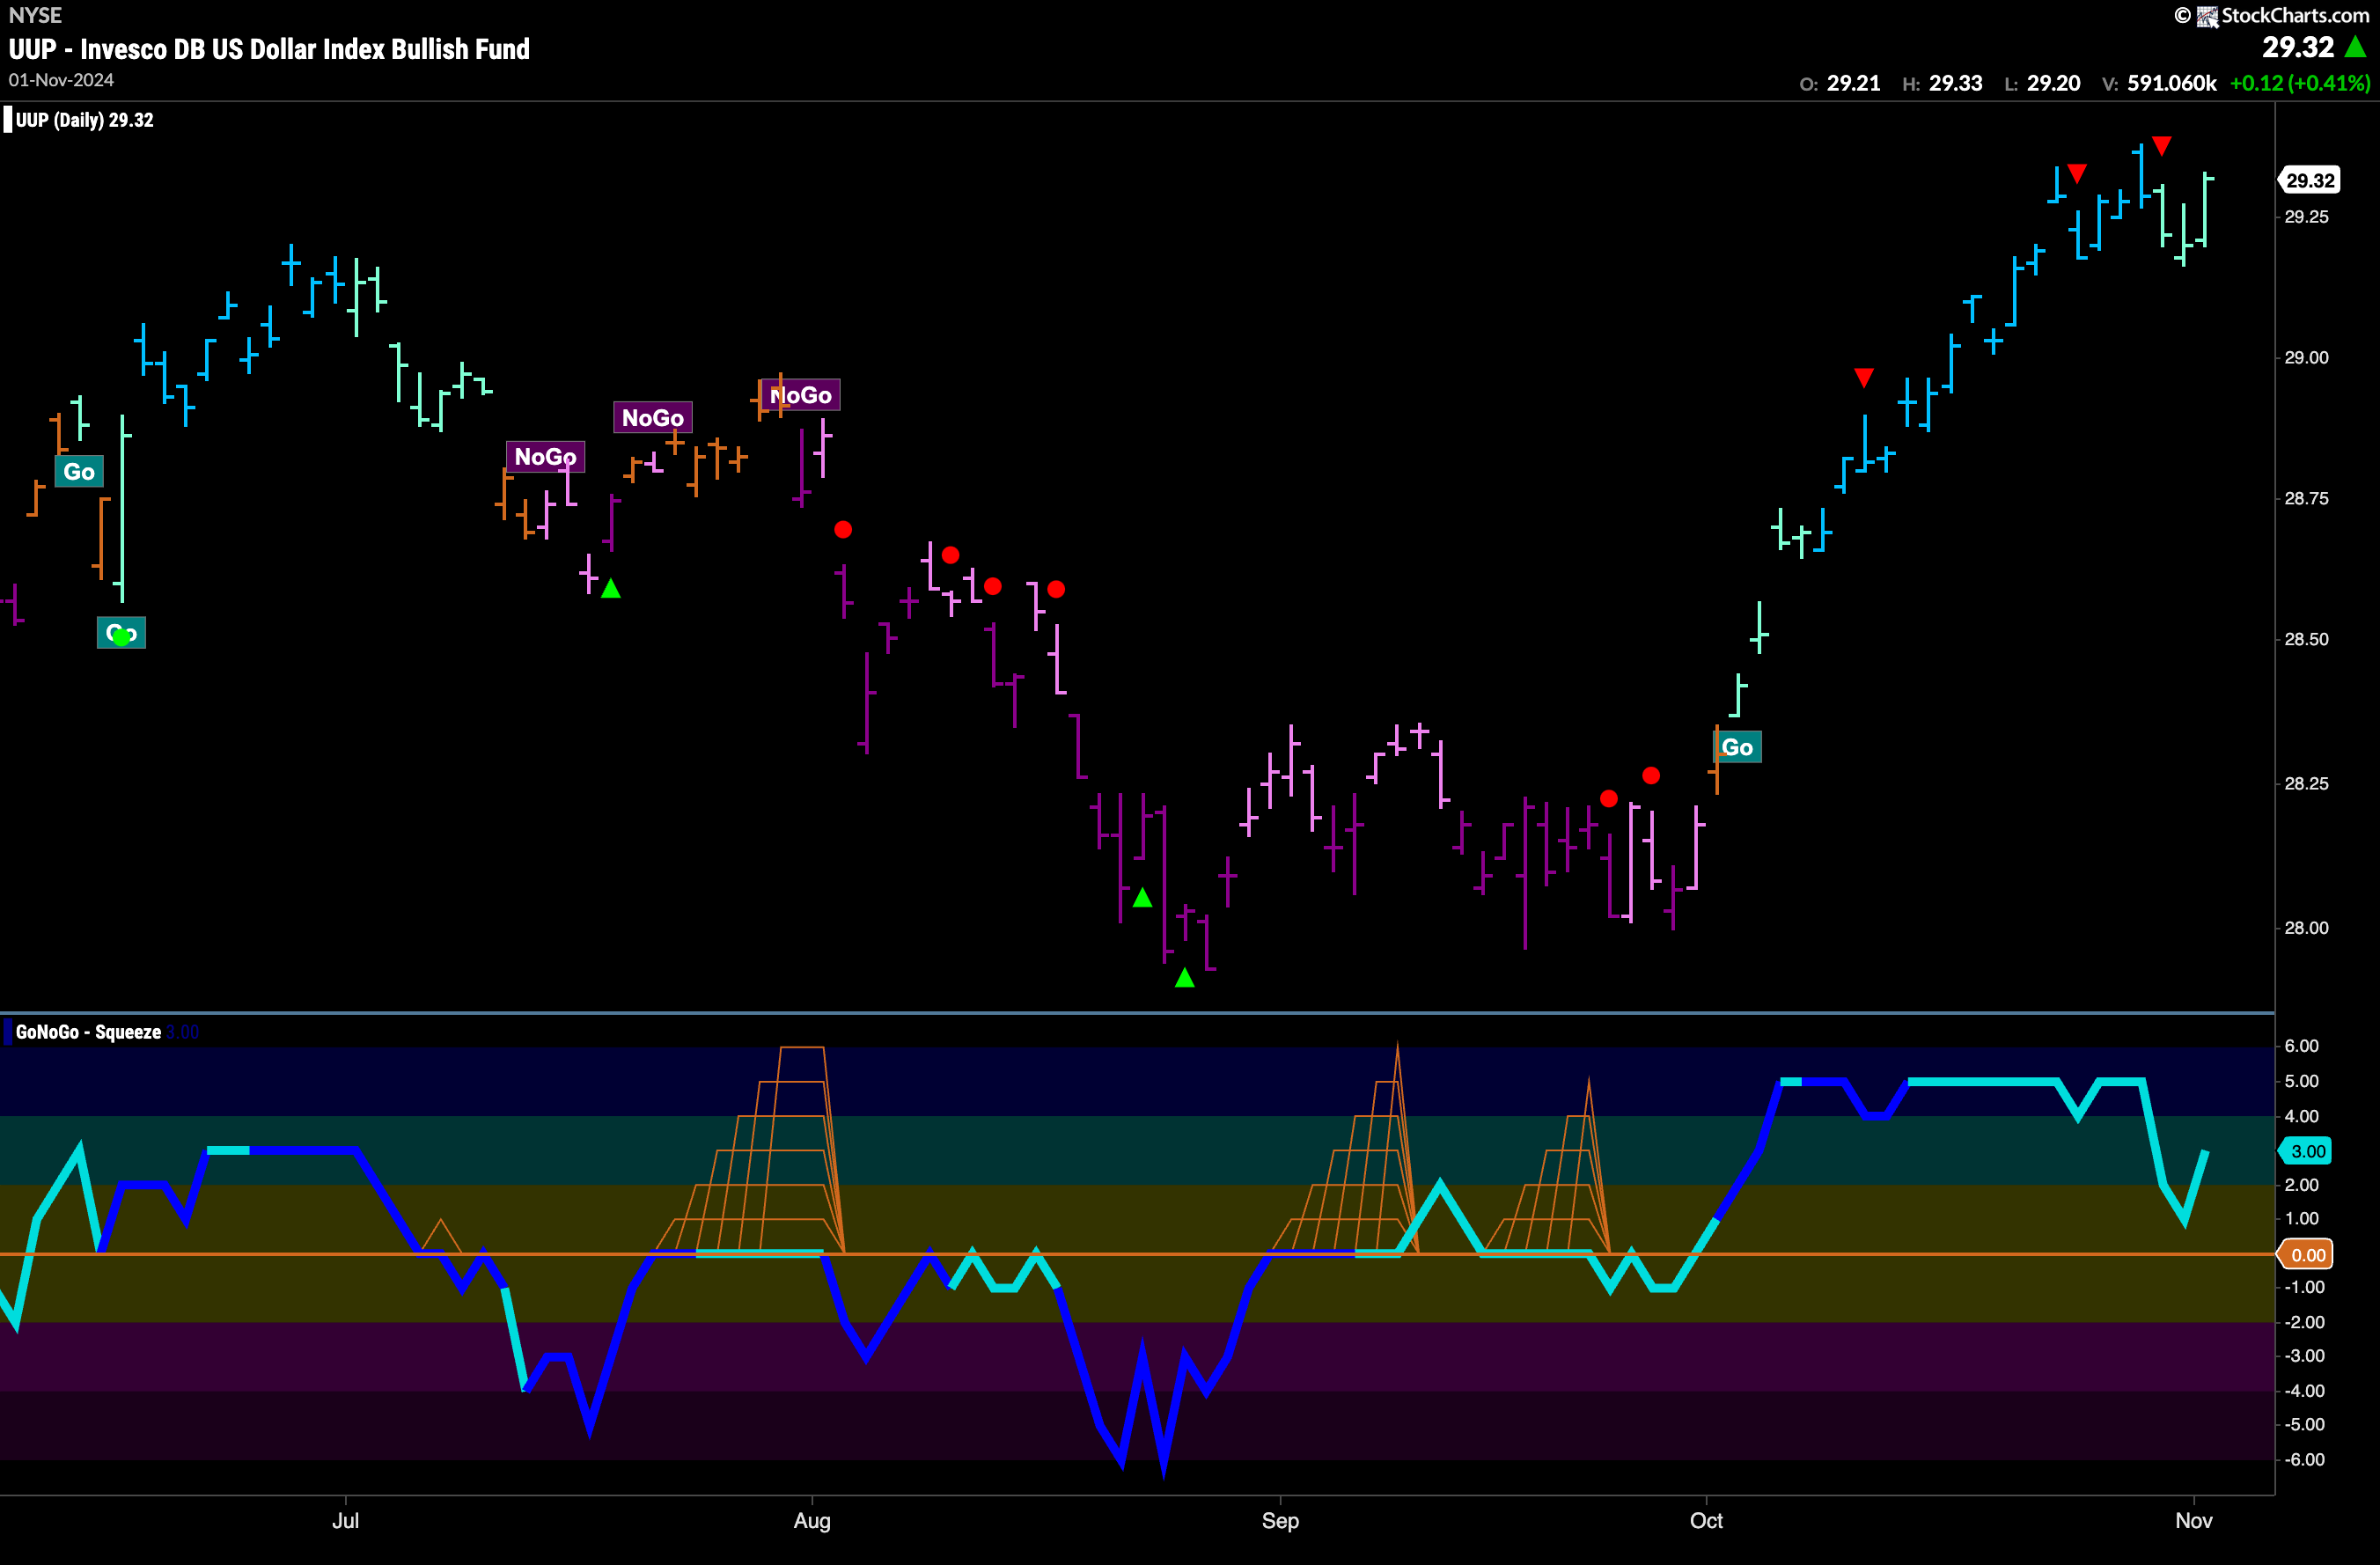
We saw another Go Countertrend Correction Icon (red arrow) this week right after price made a new high. Since then we have seen consecutive aqua bars that demonstrate some trend weakness. Price rebounded on Friday with a strong bar and so we will watch to see if the trend will strengthen as it approaches prior highs. GoNoGo Oscillator fell sharply but turned around at a value of 1 and so is now rising at a value of 3 confirming the “Go” trend in the price panel.
USO Struggles to Find Direction
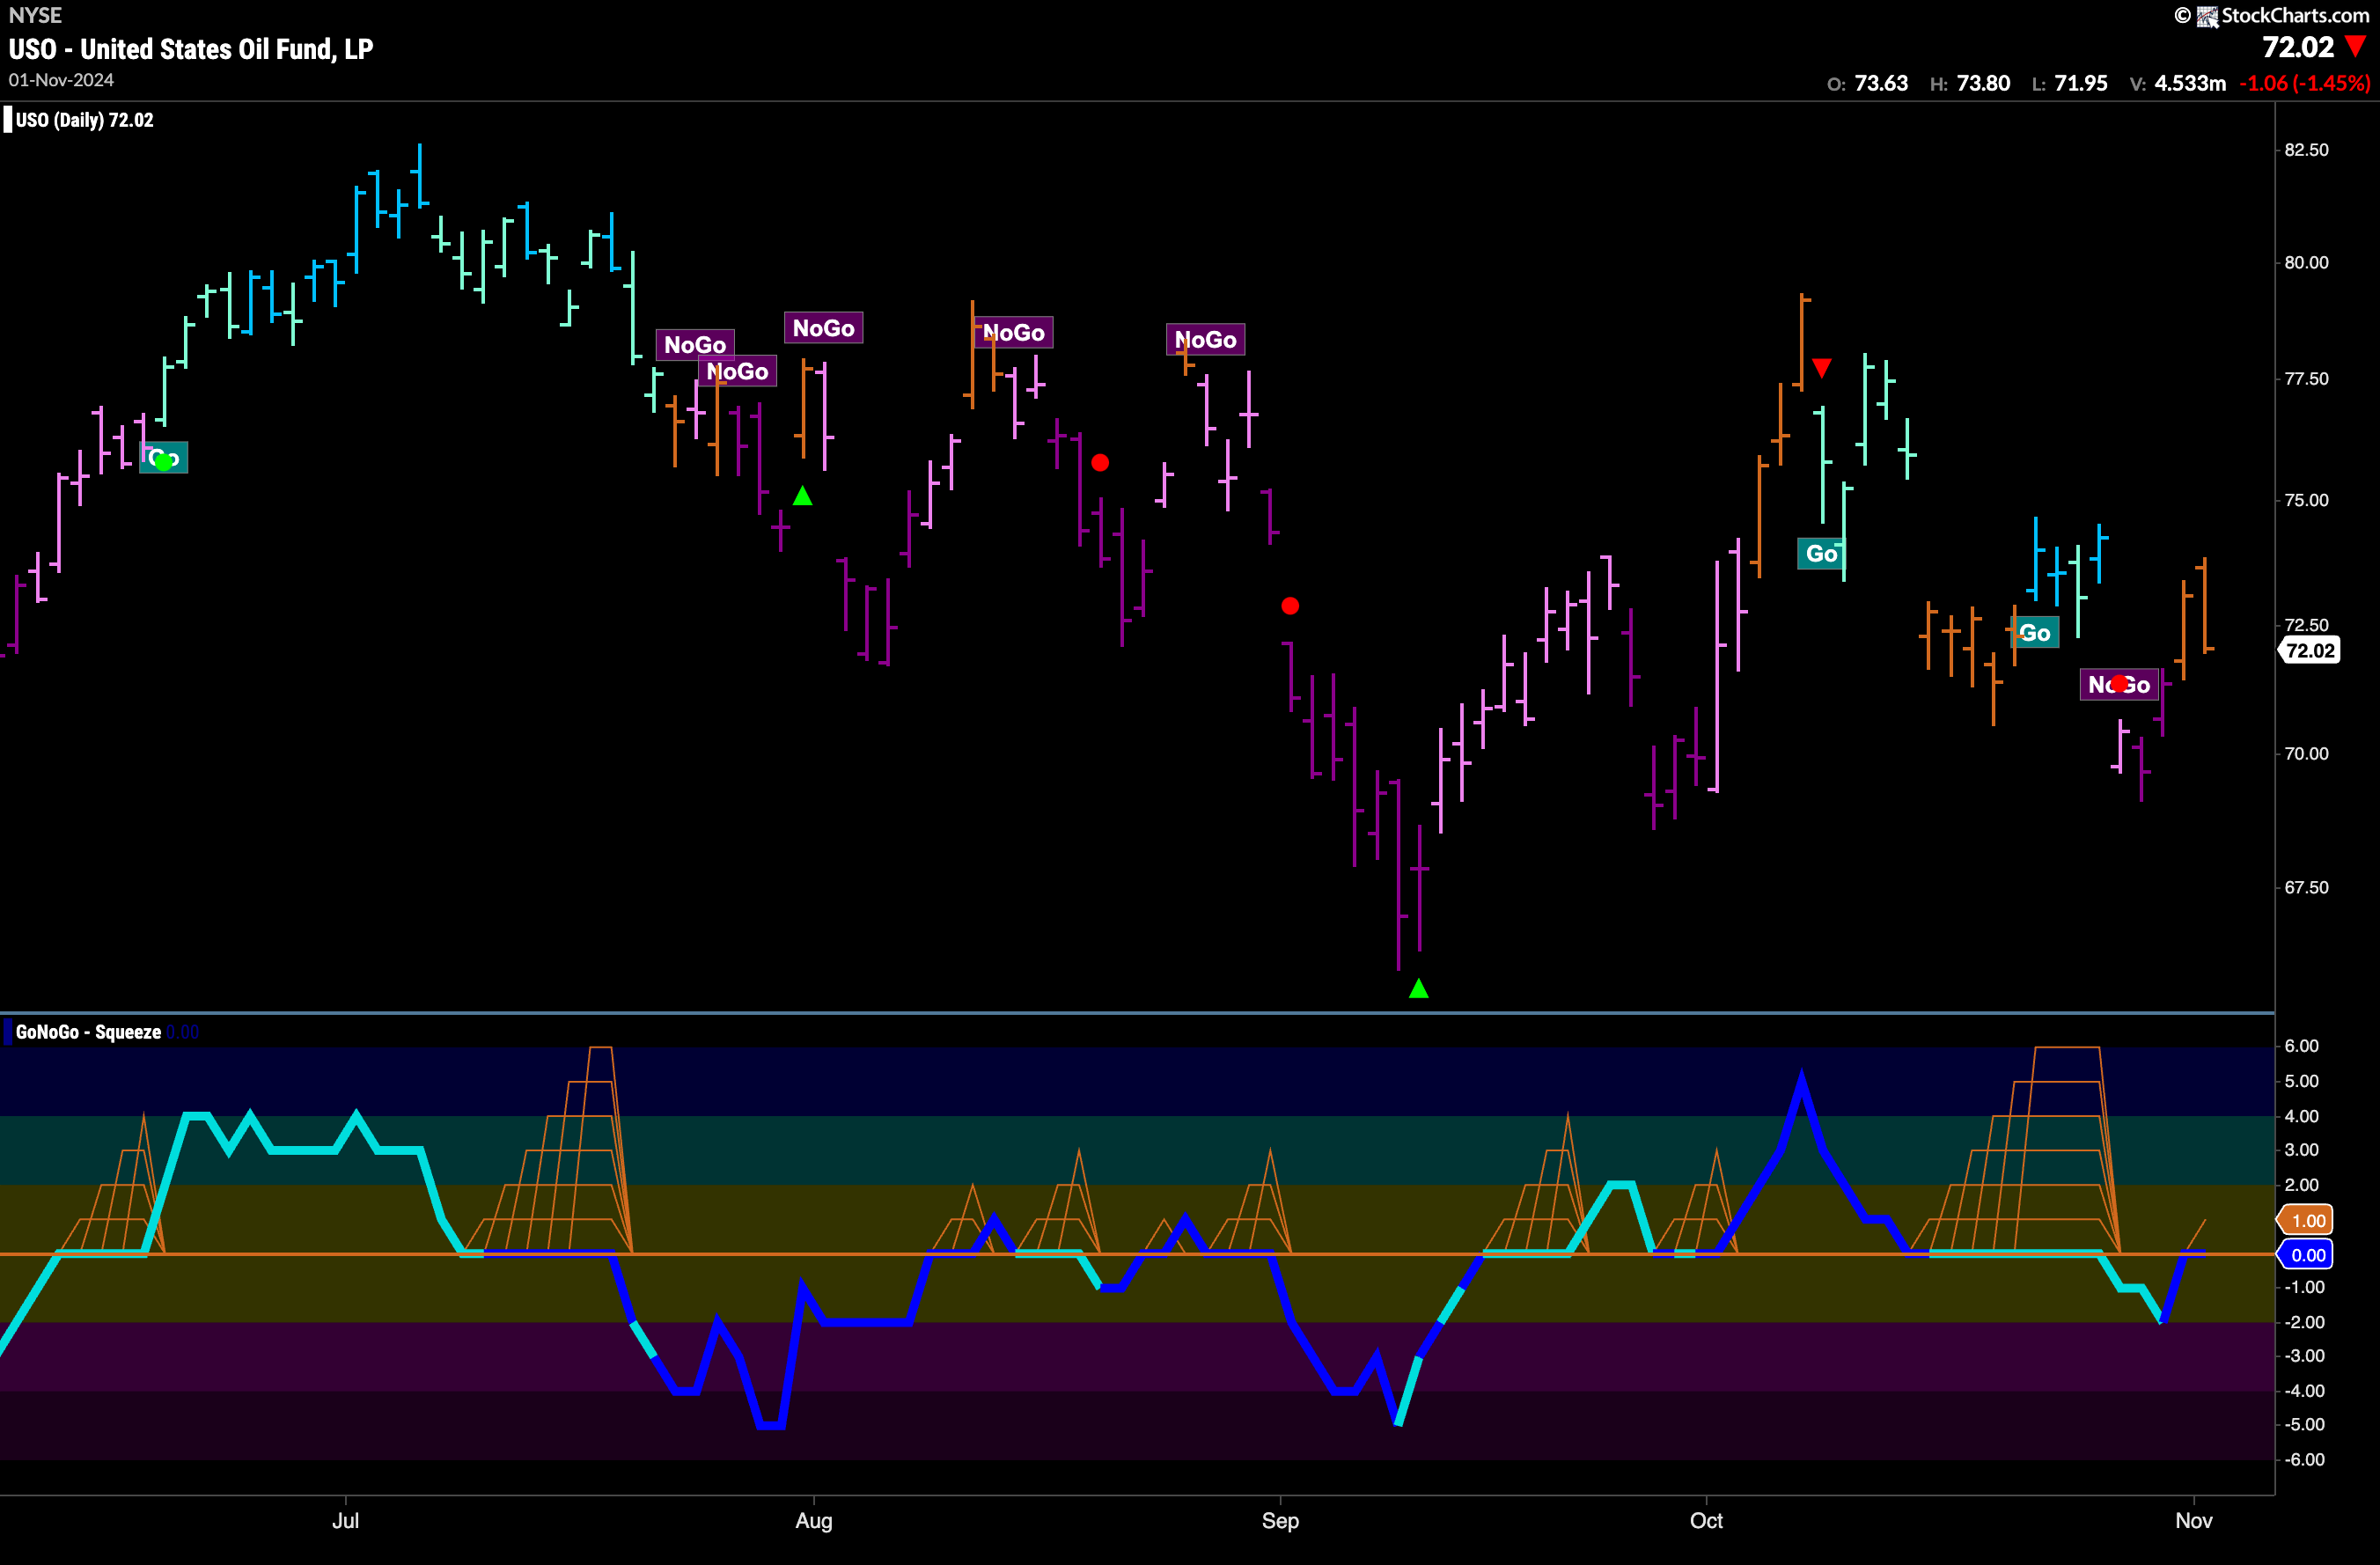
After a few “NoGo” bars we saw price rally and paint amber “Go Fish” bars of uncertainty at the end of last week. This continues a theme of choppiness that we have been noting for weeks now. GoNoGo Oscillator fell below the zero line and into negative territory last week out of a Max GoNoGo Squeeze but quickly reversed and is now back testing the zero level from below on heavy volume. It will be important to note the direction of the oscillator from here.
Gold Prices Cool but Stay in “Go” Trend
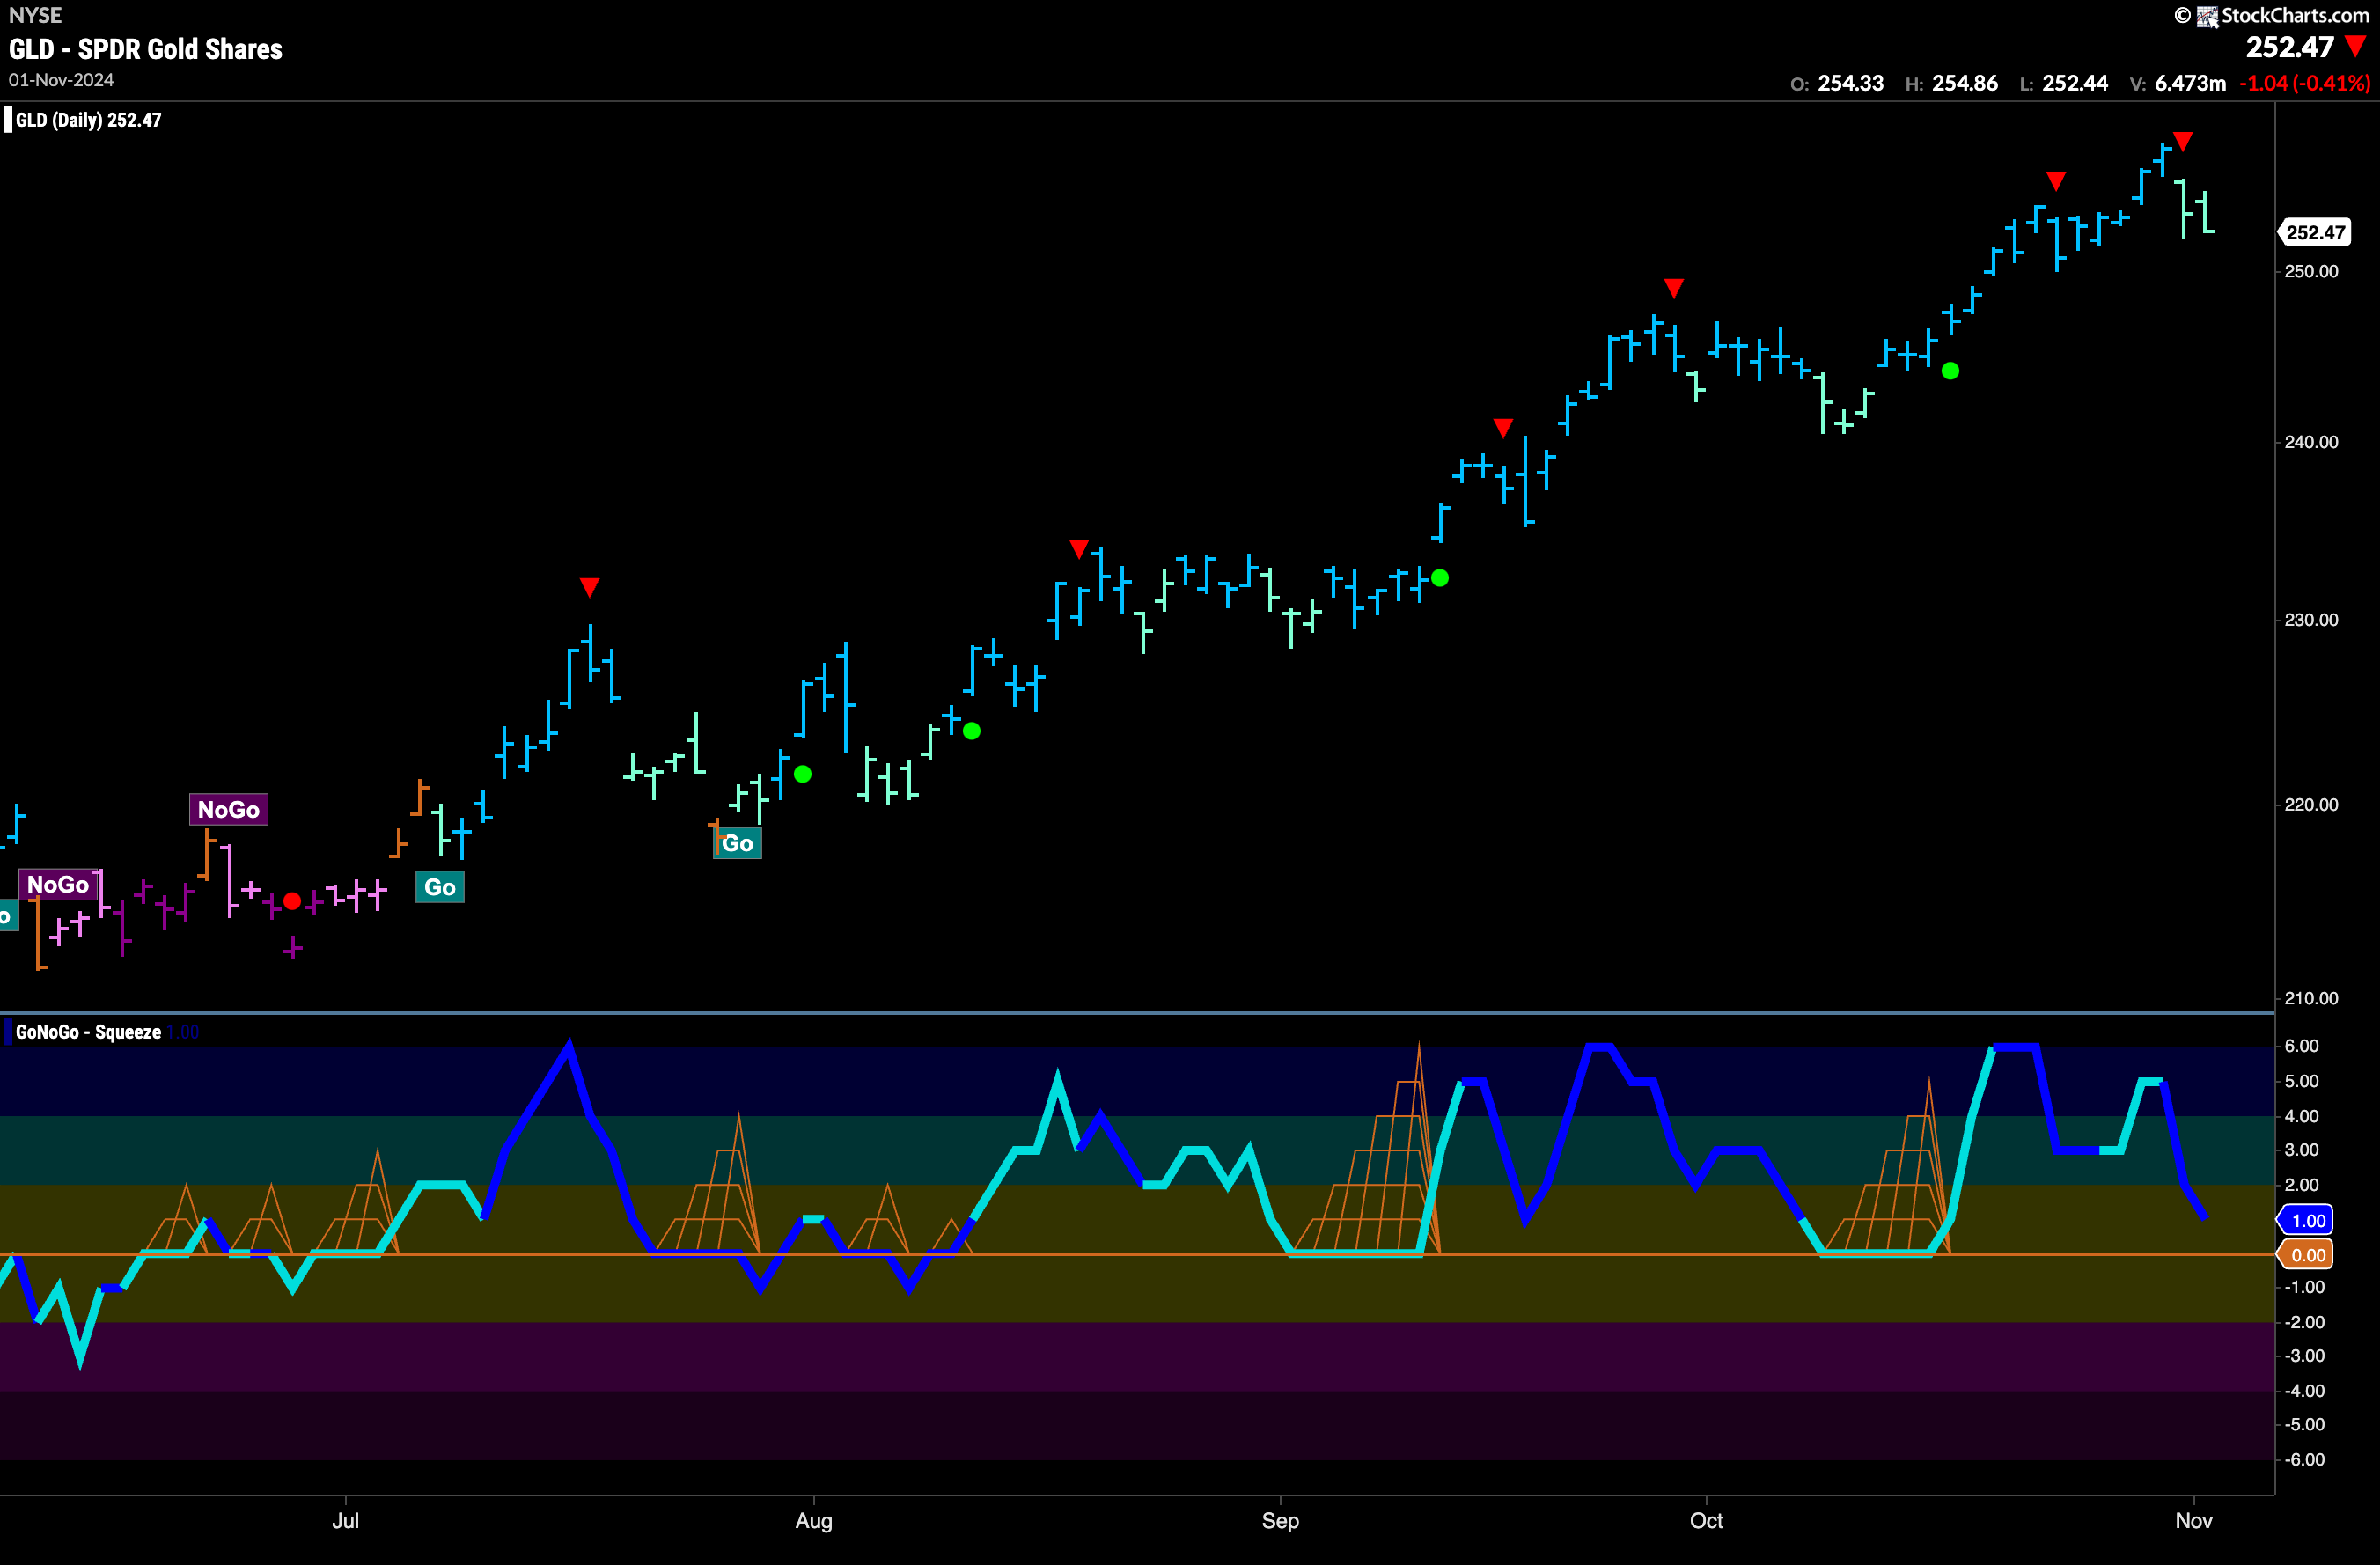
GoNoGo Trend paints weaker aqua “Go” bars as price fell from its most recent high at the end of the week. This happened after we saw a Go Countertrend Correction Icon (red arrow) indicating that price may struggle to go higher in the short term. Now, GoNoGo Oscillator is falling toward the zero line and volume is heavy. For this trend to continue we will look for the oscillator to find support at zero. This would tell us that momentum is still on the side of the “Go” trend.
Sector RelMap
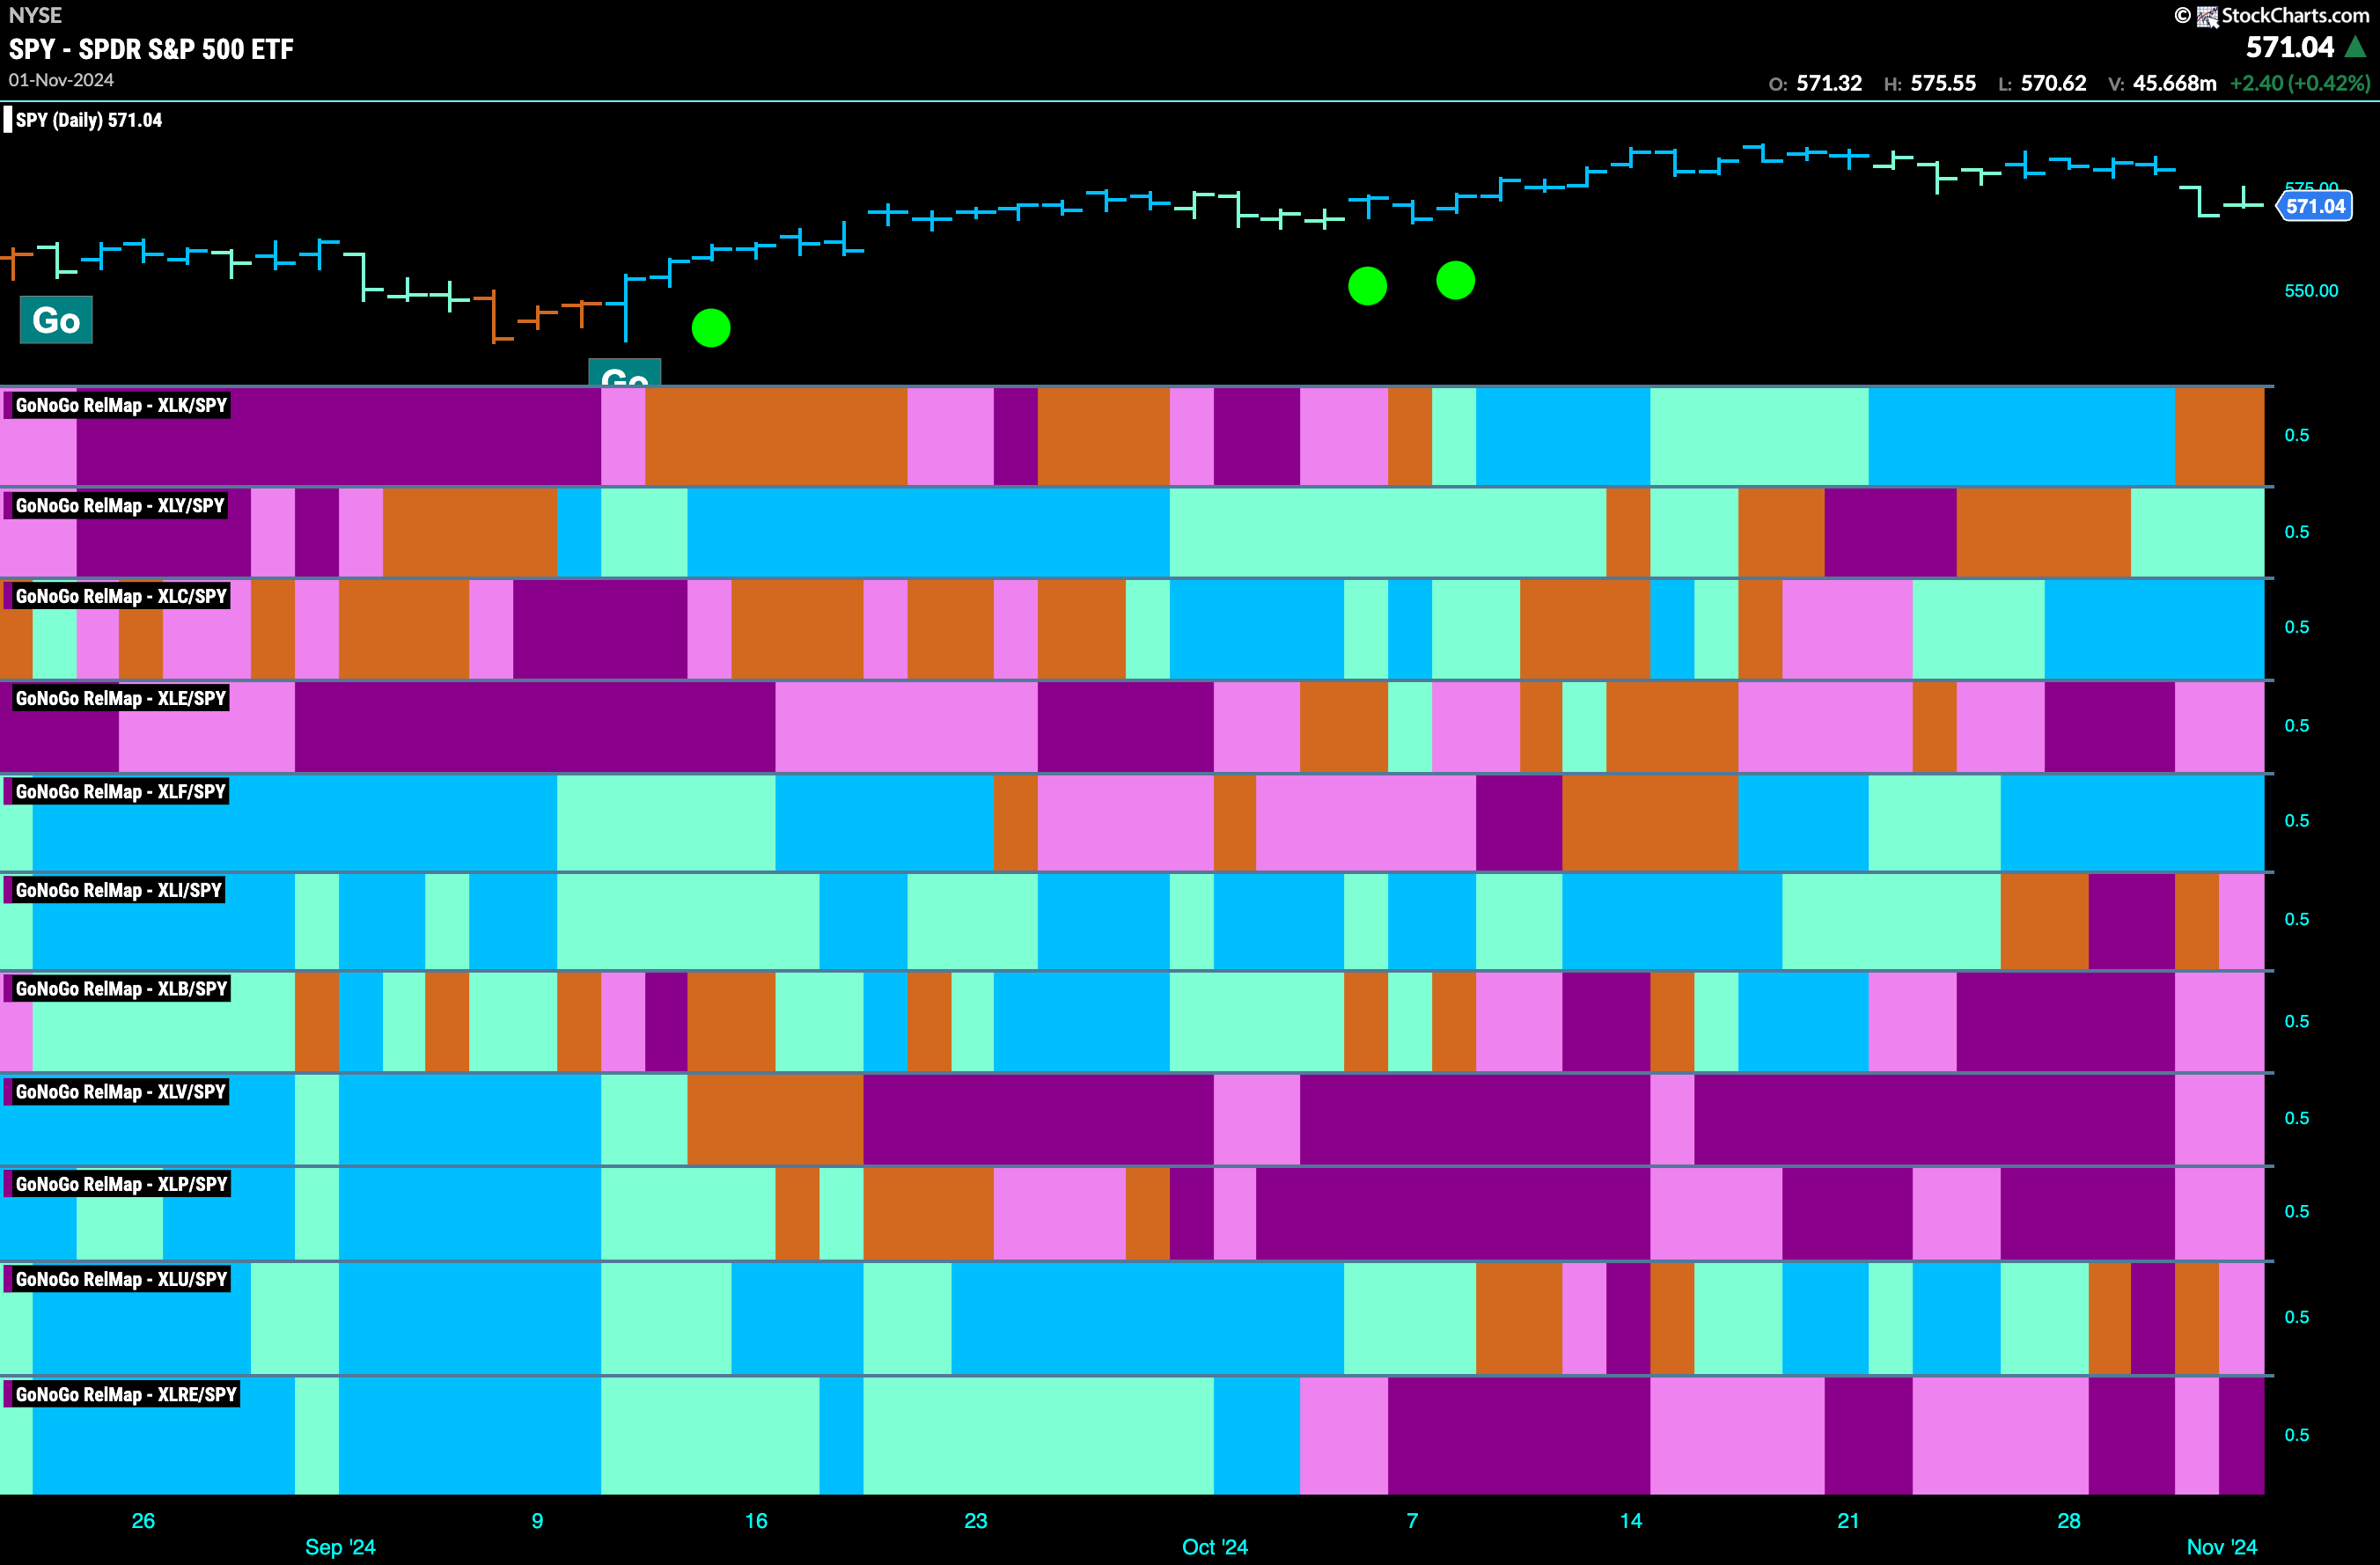
Below is the GoNoGo Sector RelMap. This GoNoGo RelMap applies the GoNoGo Trend to the relative strength ratios of the sectors to the base index. With this view we can get a sense of the relative out performance and relative underperformance of the sectors. 3 sectors are in relative “Go” trends. $XLY, $XLC, and $XLF are painting relative “Go” bars.
Communications Sub-Group RelMap
The chart below shows a relative trend breakdown of the sub groups within the communications sector. The Sub-Group RelMap plots the GoNoGo Trend of each sub index to the $XLC. We saw in the above GoNoGo Sector RelMap that $XLC is performing strongly relatively to the $SPY, with GoNoGo Trend painting strong blue “Go” bars. If we look at the breakdown of the groups in the map below we can see where that outperformance is coming from. Returning to a “Go” trend in the top panel with aqua bars is the Internet Index. 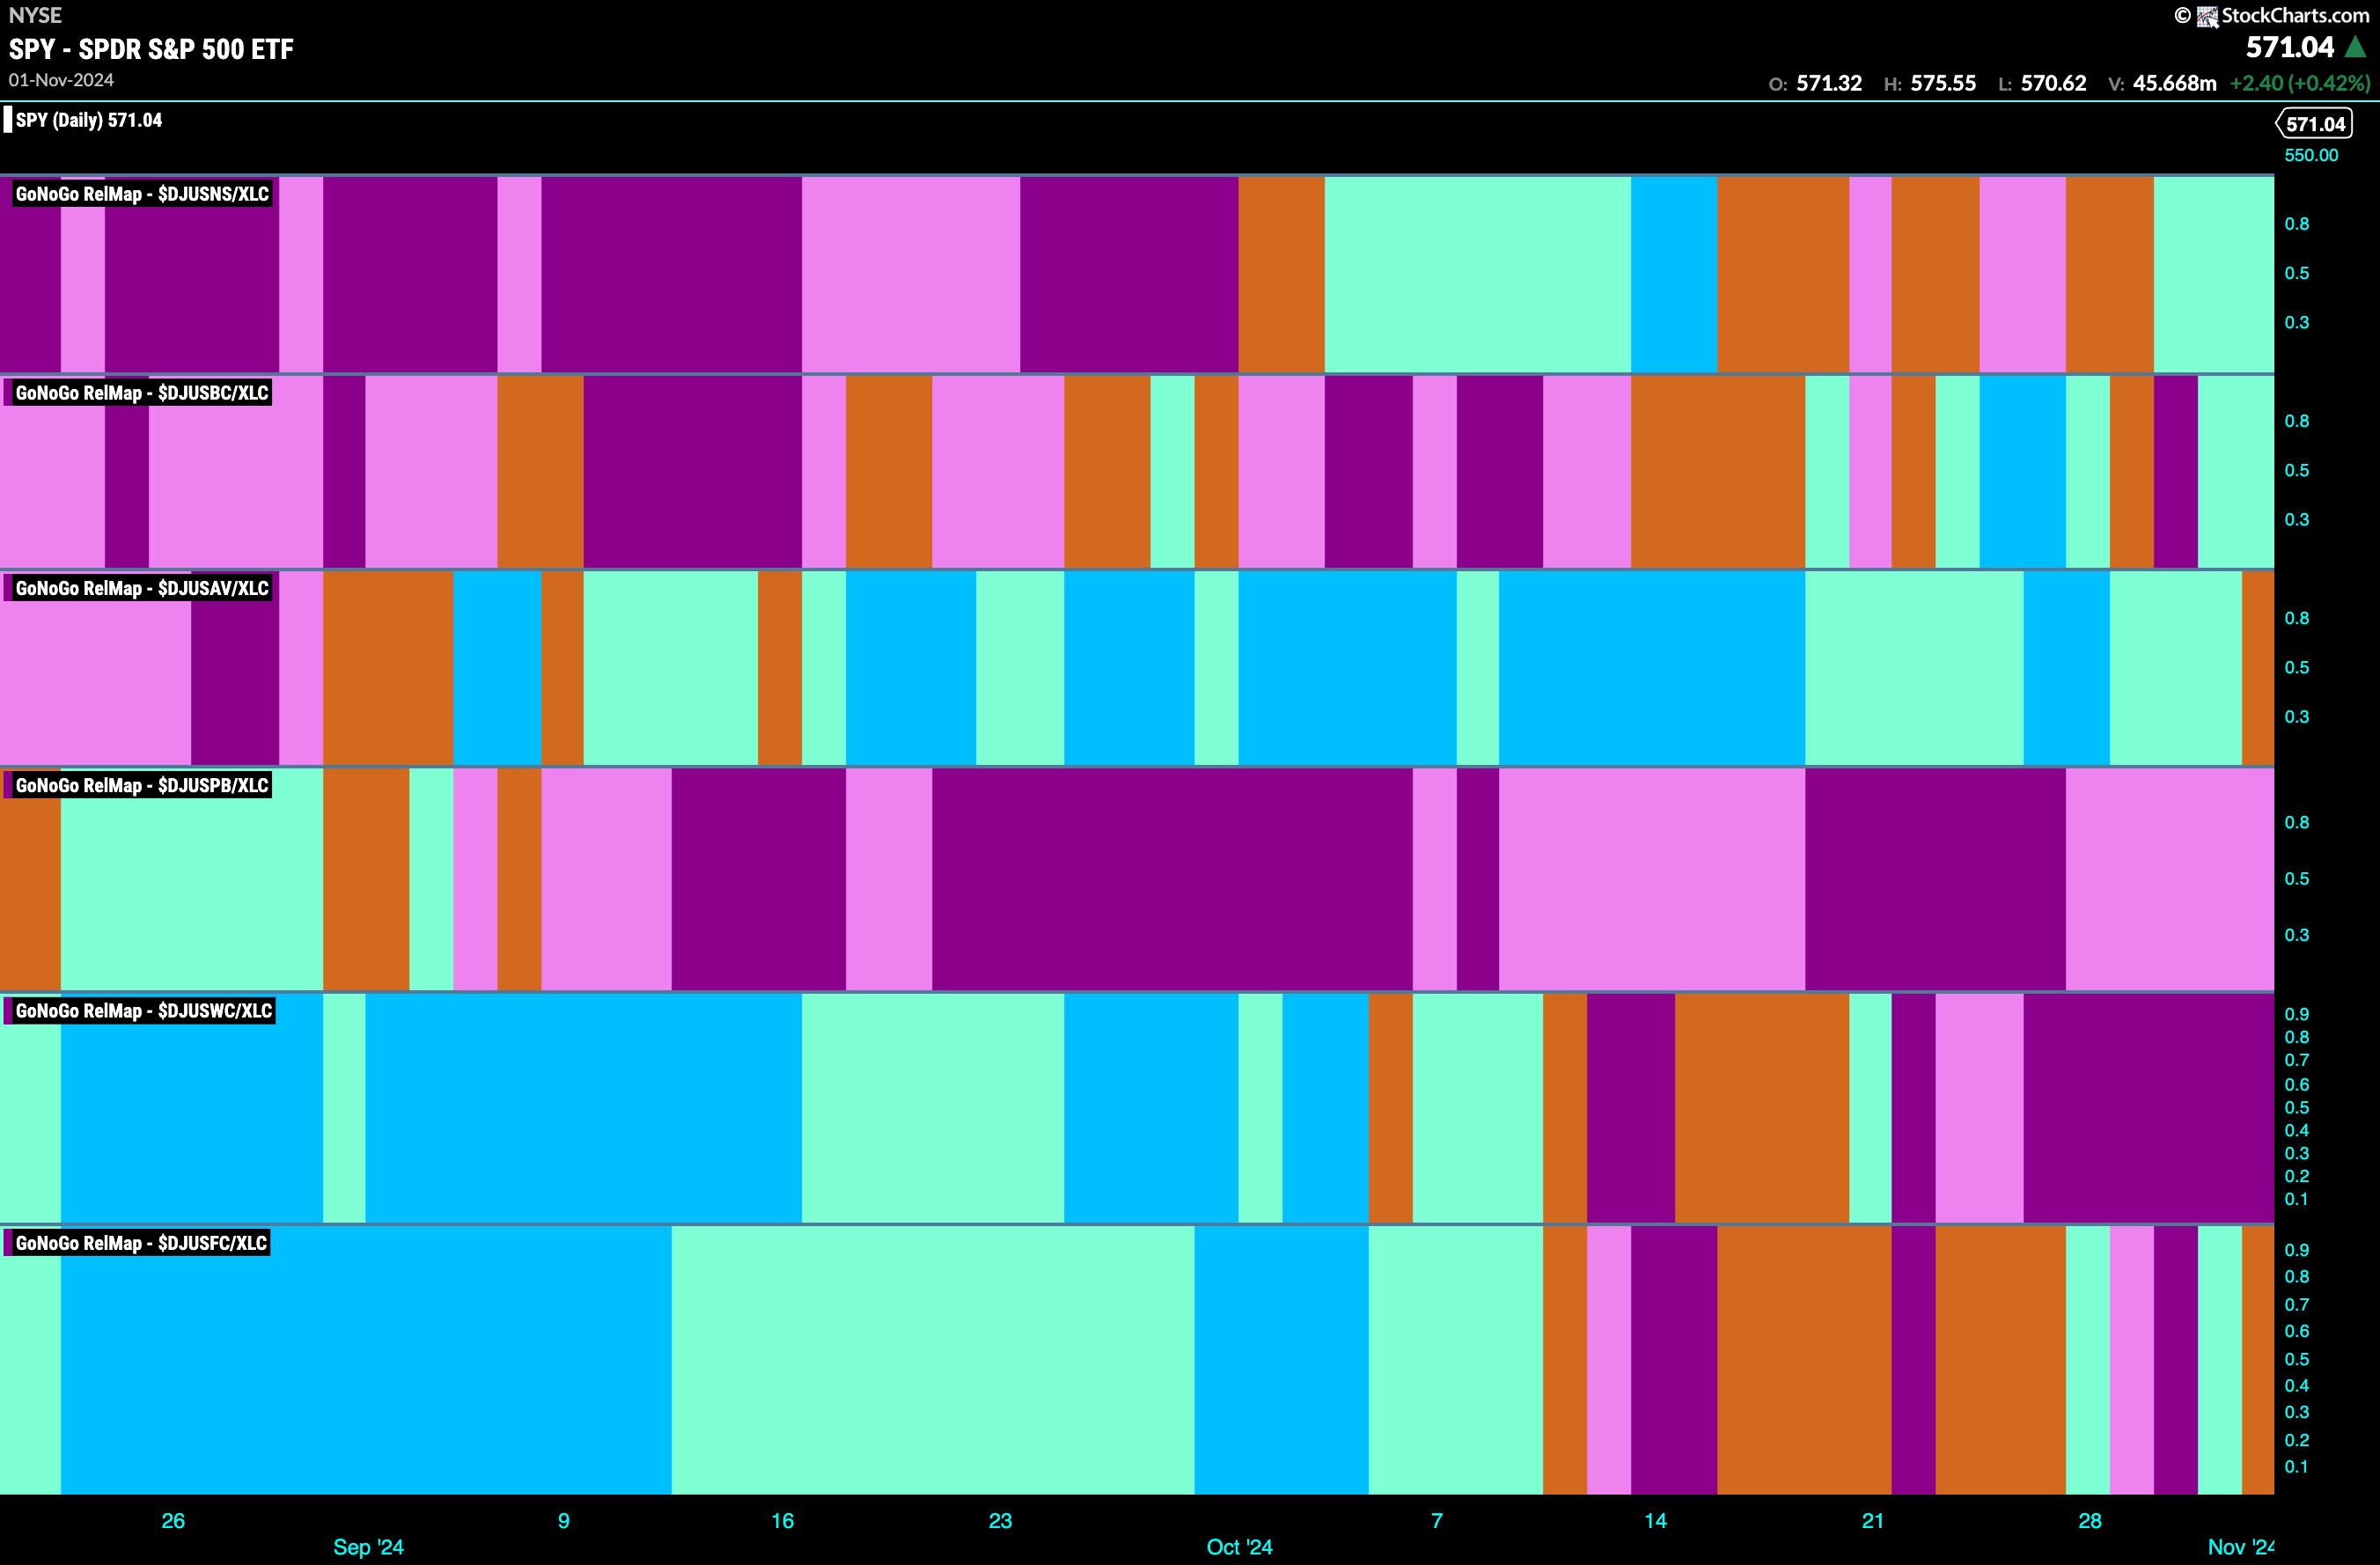
$CXDO Consolidates after High
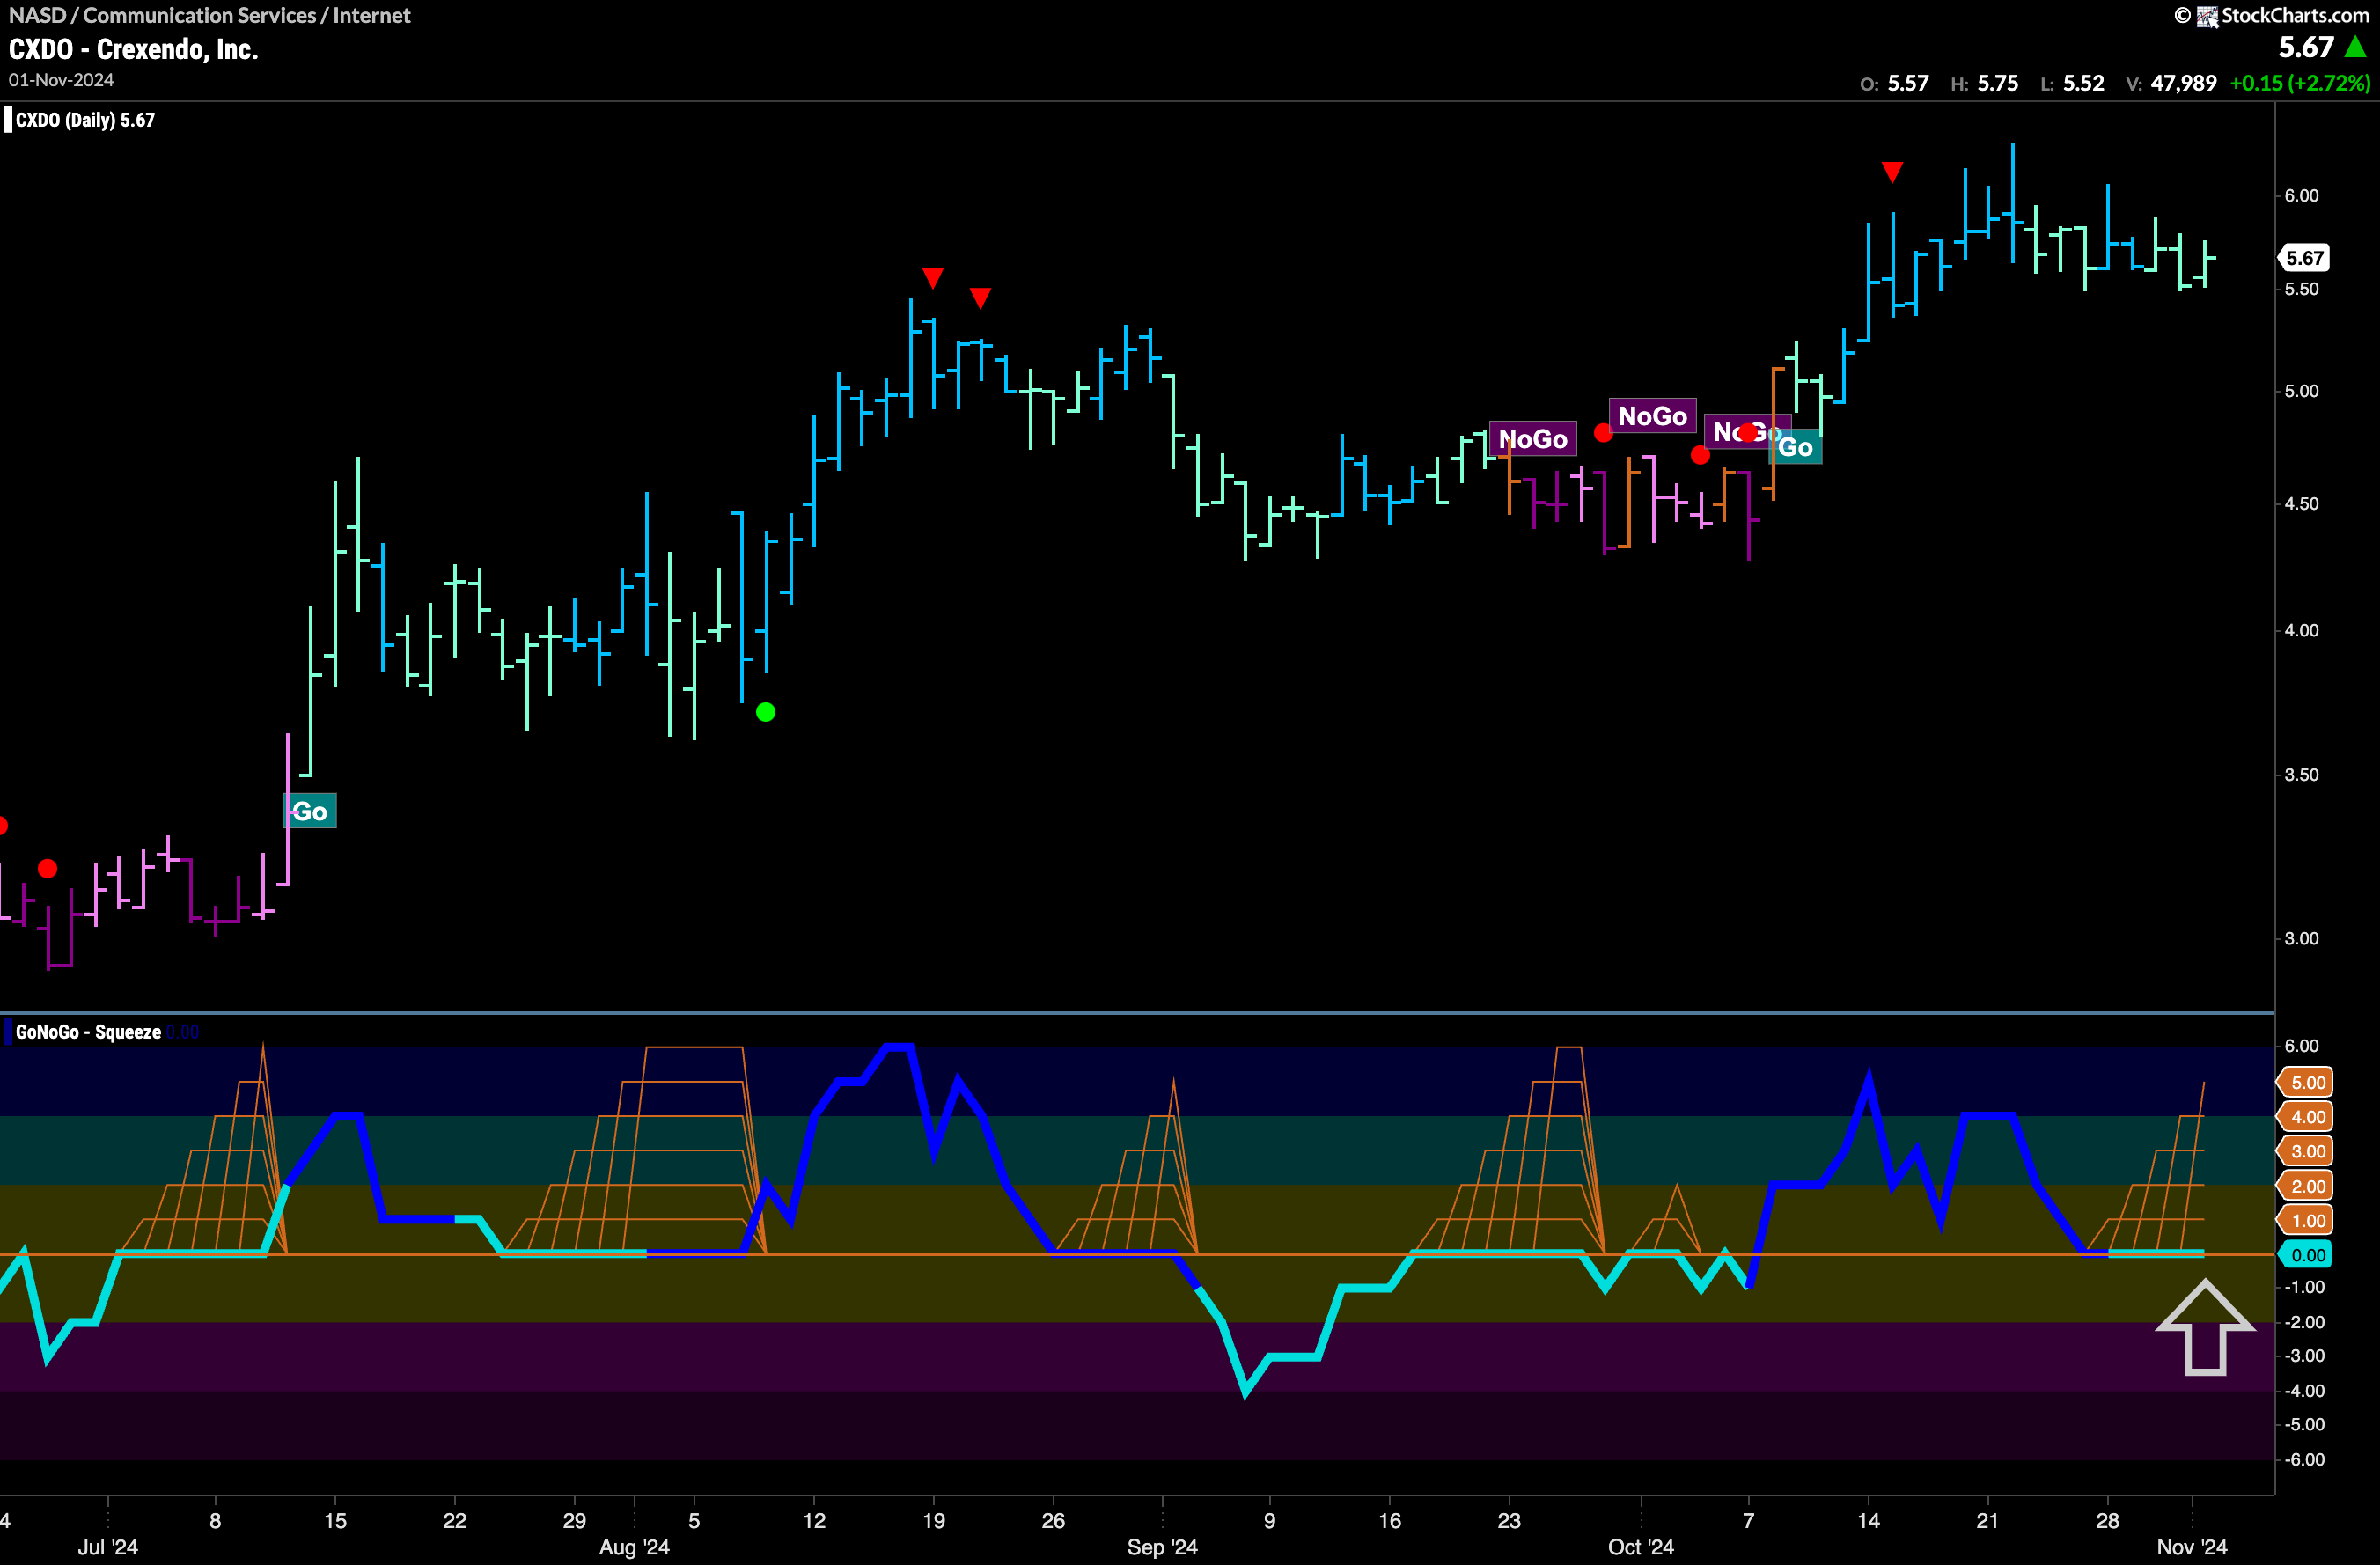
After hitting a new higher high over a week ago, we see that price has moved mostly sideways and GoNoGo Trend has painted a lot of weaker aqua bars. As price rests, GoNoGo Oscillator has fallen to the zero line and has remained there now for several bars. This has caused the climbing grid of GoNoGo Squeeze to rise close to its Max showing the tug of war between buyers and sellers at this level. We will watch to see the direction of the Squeeze break. If the oscillator breaks out of the GoNoGo Squeeze into positive territory we will know that momentum is resurgent in the direction of the “Go” trend and we will look for price to make an attack on new highs.
$HEPS Looks for Support at Top of Gap
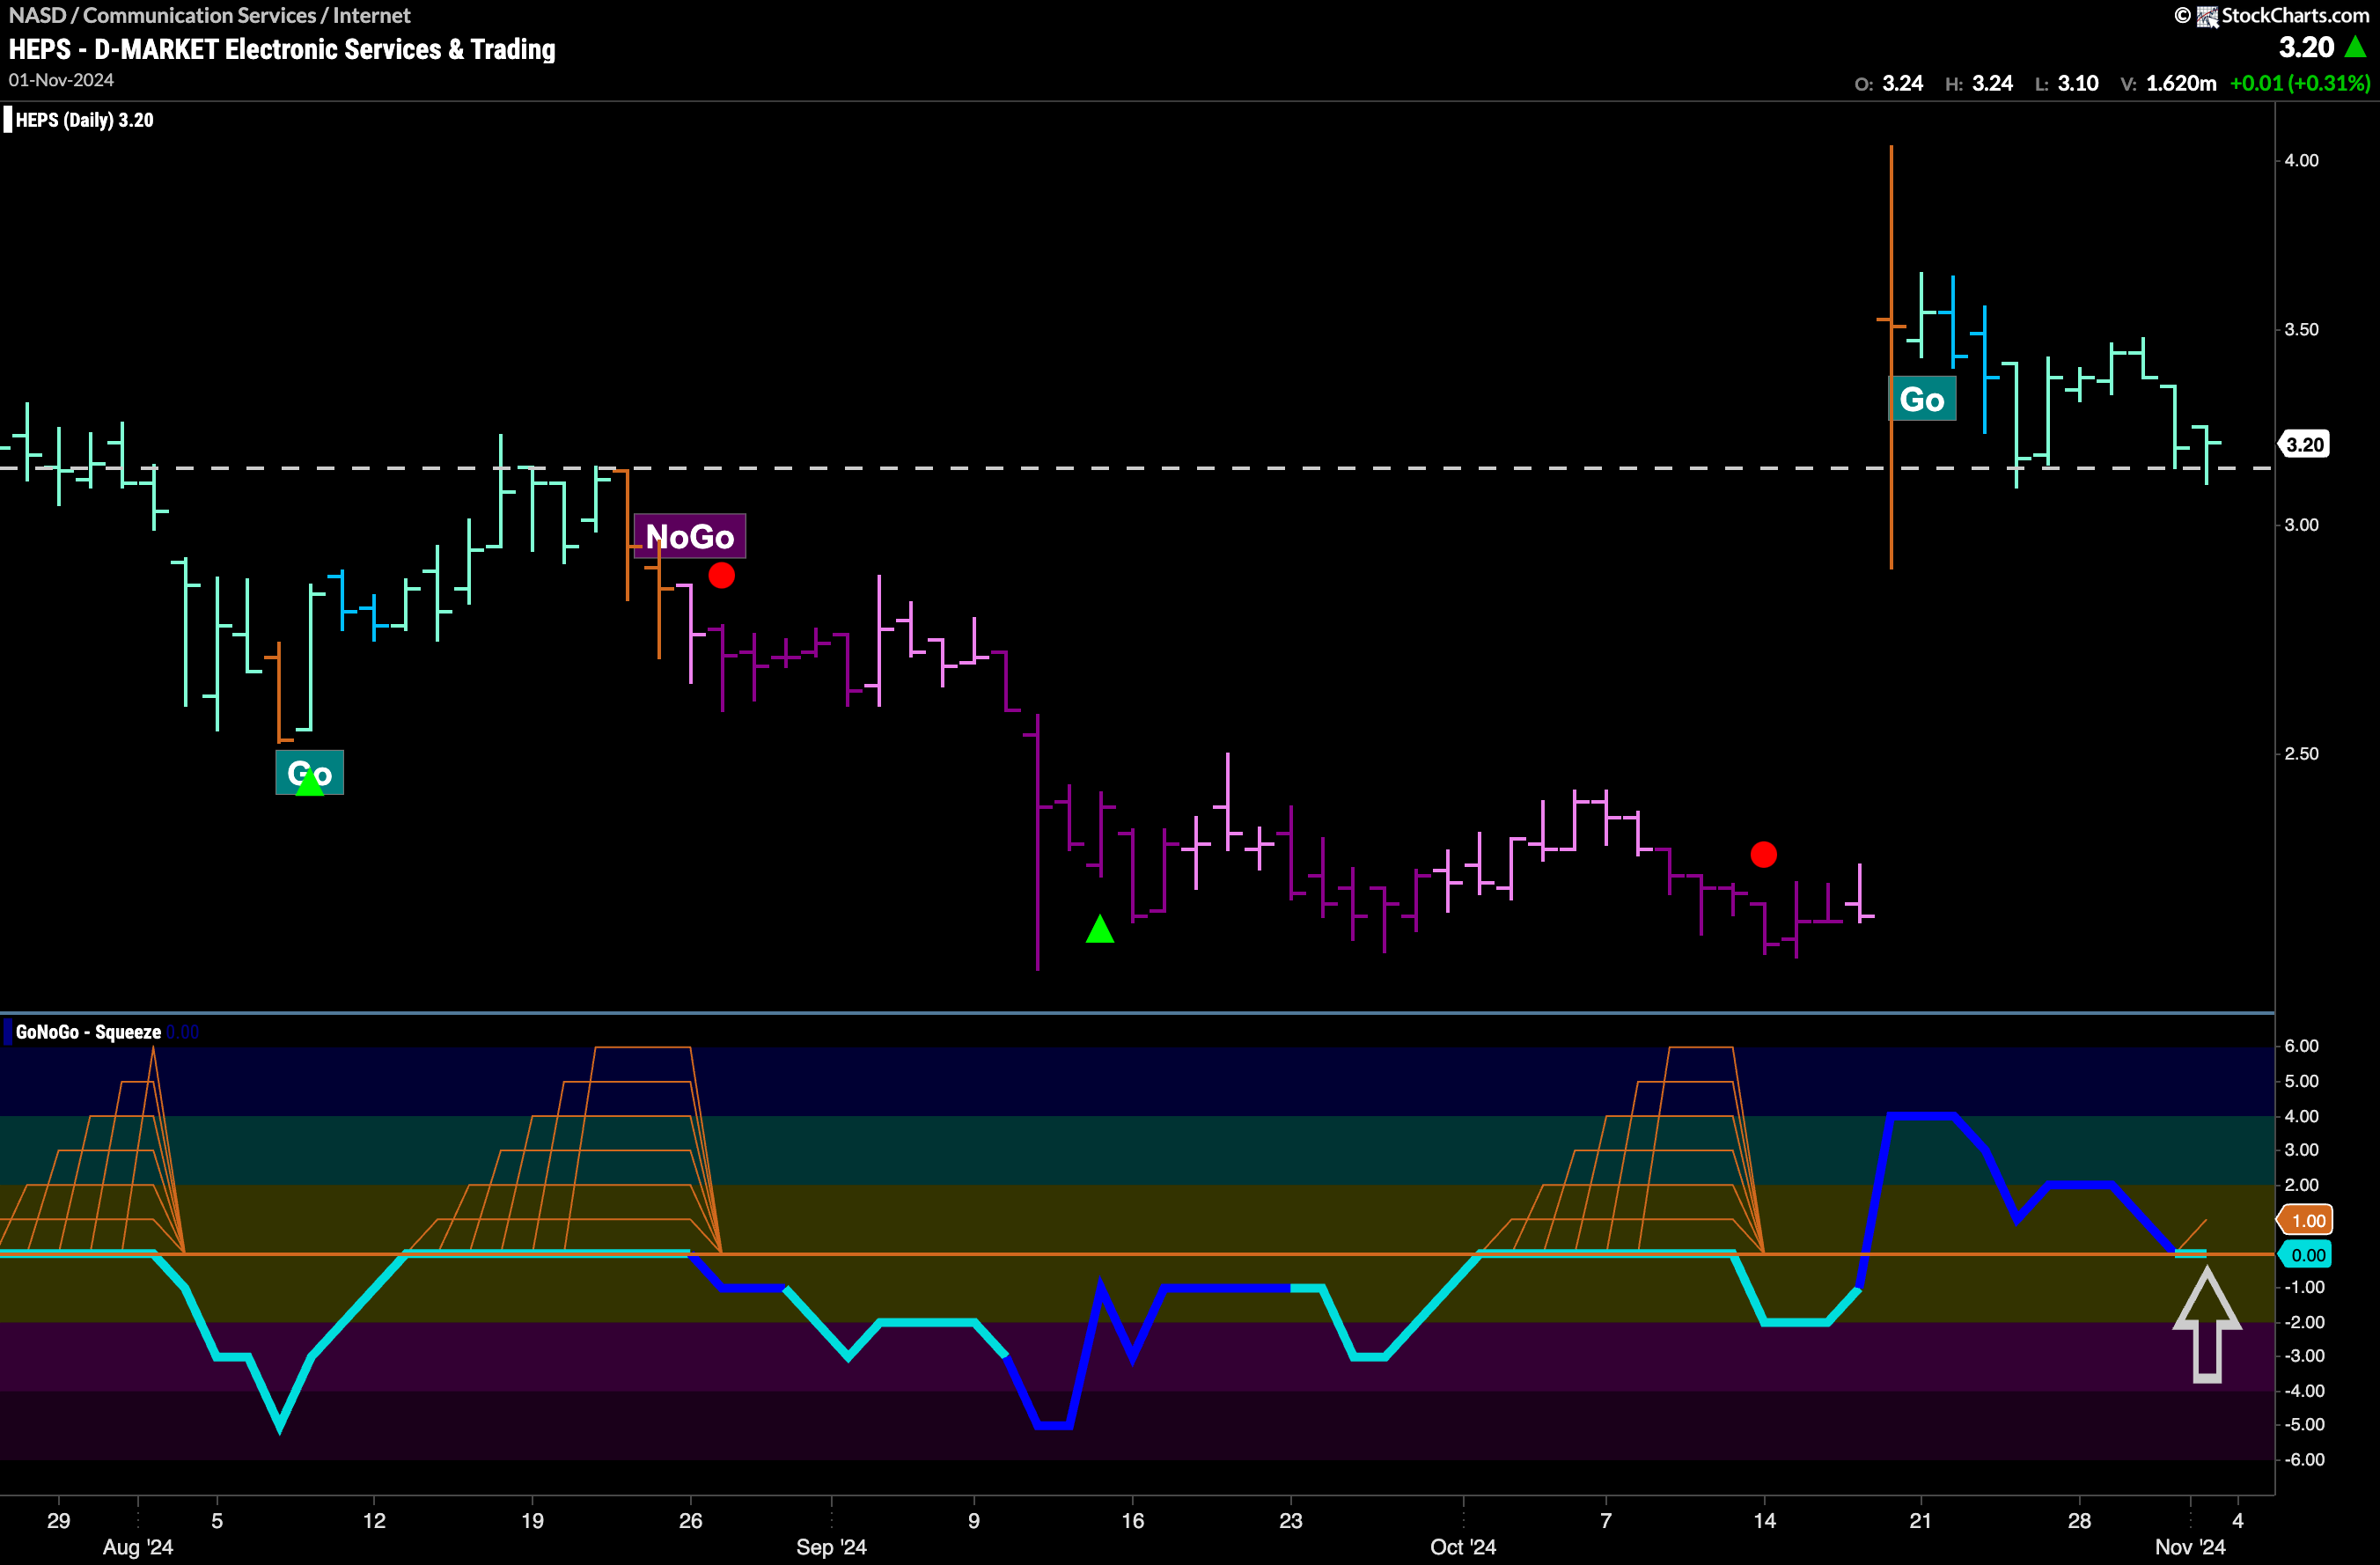
$HEPS gapped higher a few weeks ago and since then price has fallen back to test the upper bound of that gap. This area of potential support lines up with prior highs on the chart and so we will look to see if support continues to be found at this level. GoNoGo Oscillator has fallen to test the zero line from above and so we will watch to see if this also provides momentum support. If the oscillator can rally back into positive territory it will indicate resurgent momentum in the direction of the “Go” trend and we will look for price to move higher from here.
