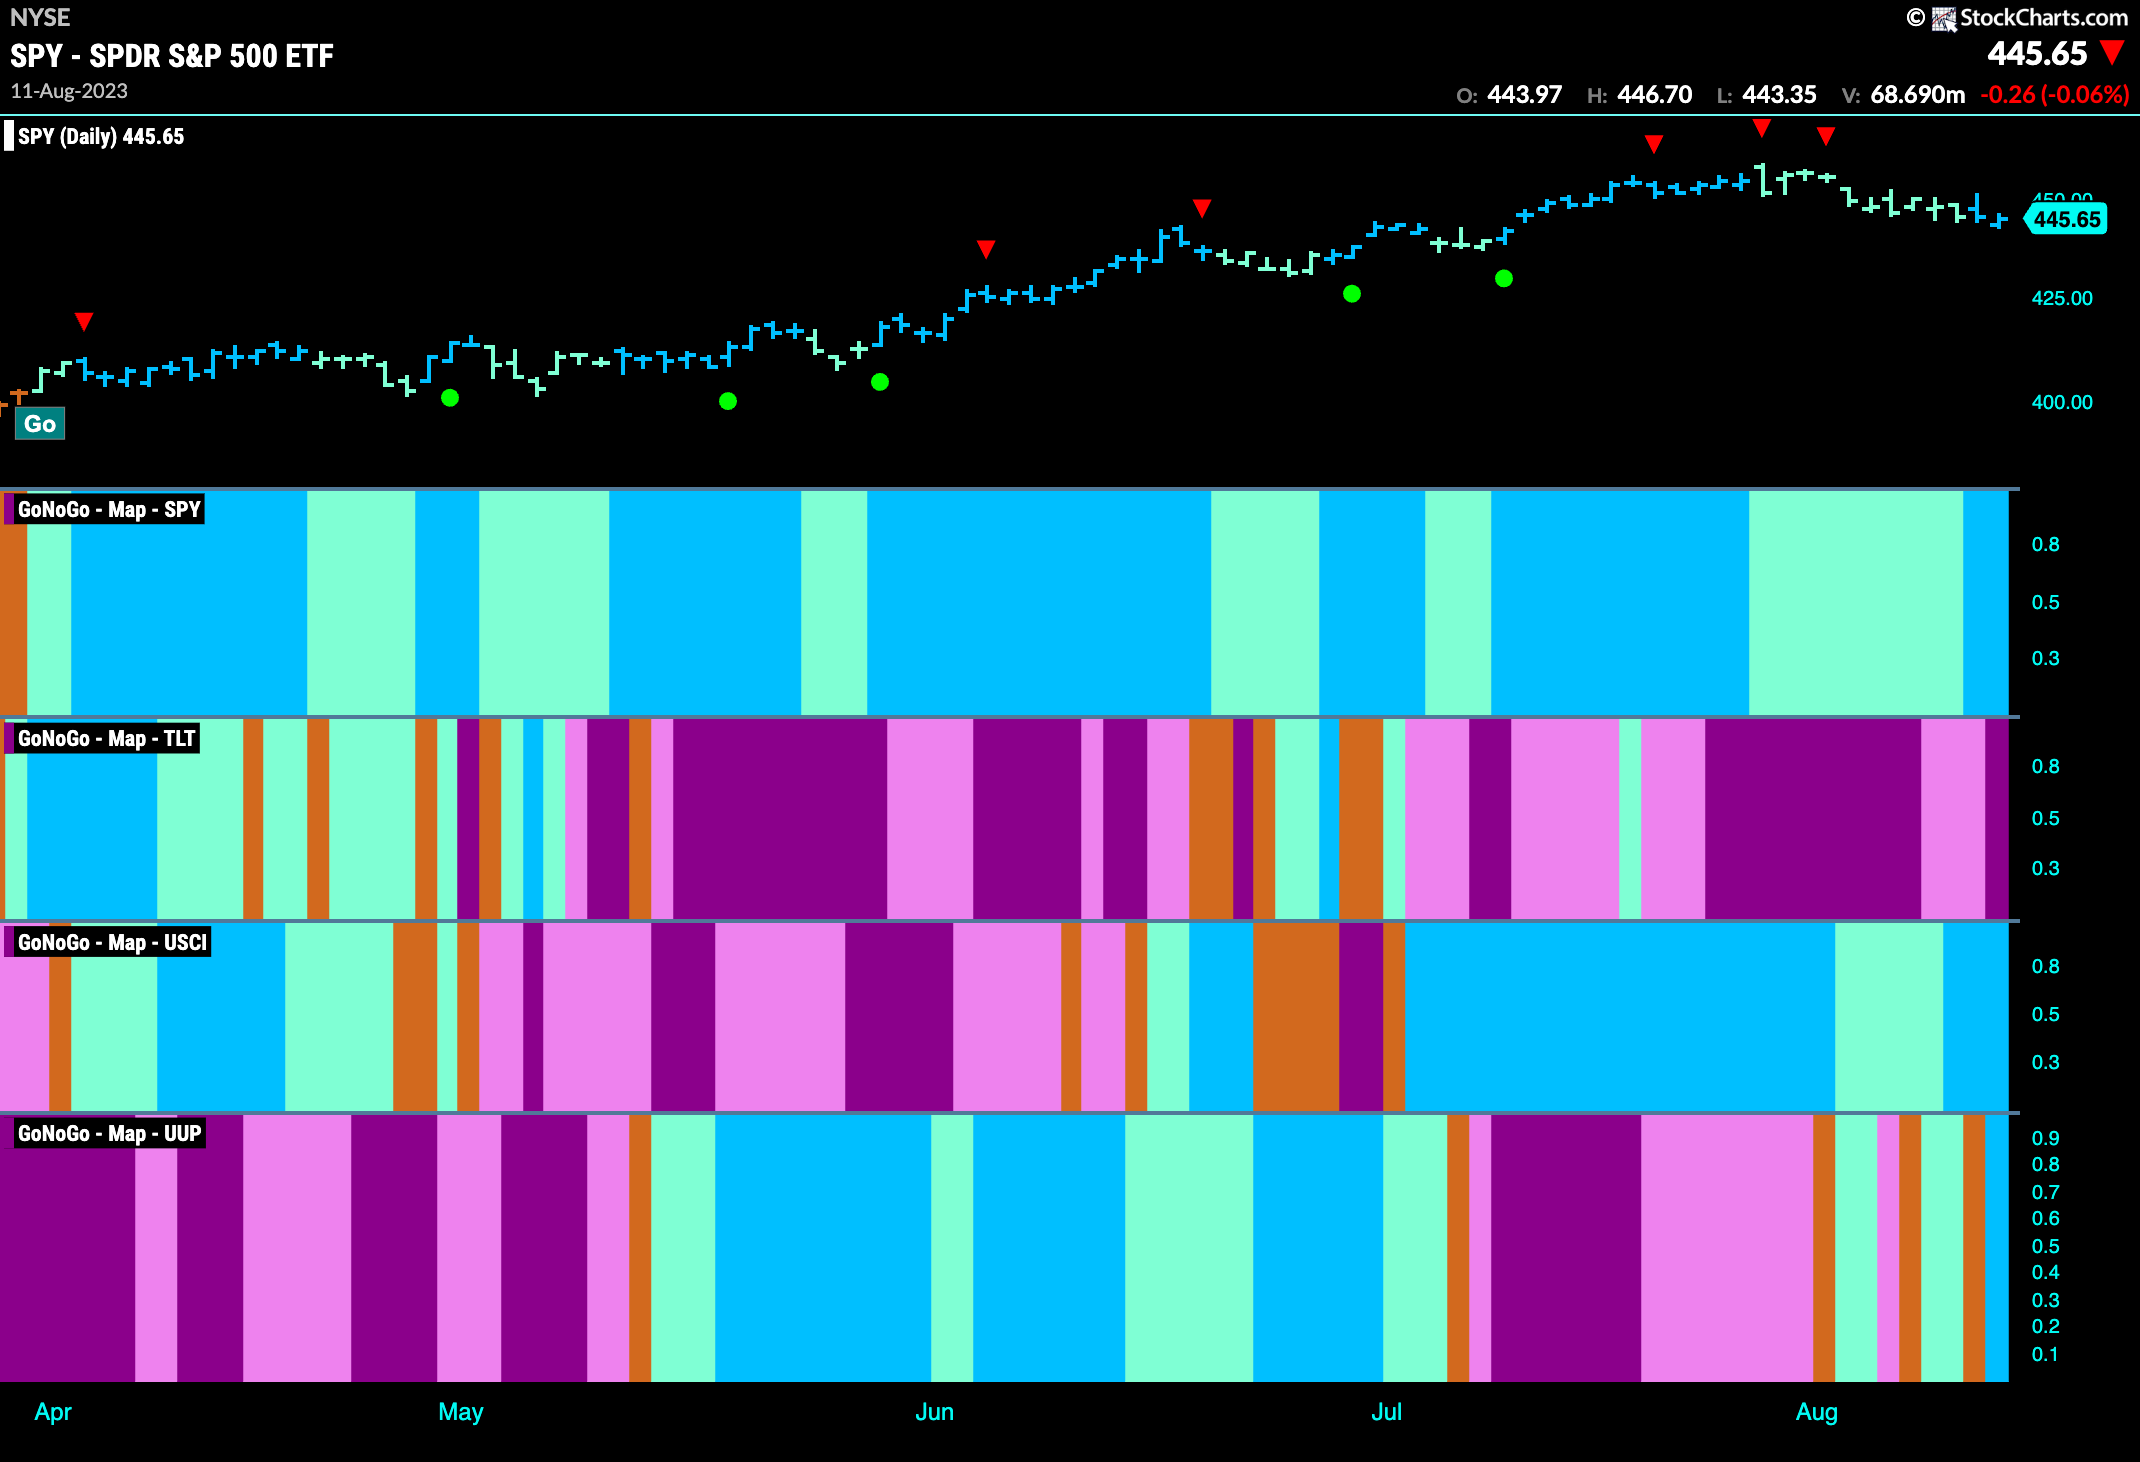
Good morning and welcome to this week’s Flight Path. The heat map shows that equities have been able to maintain the “Go” trend. Treasury bond prices stay in a “NoGo” and commodities hold on to their strong “Go” trend. The dollar is showing some fluctuations as it tries to solidify a trend. The week ended with a “Go” bar.
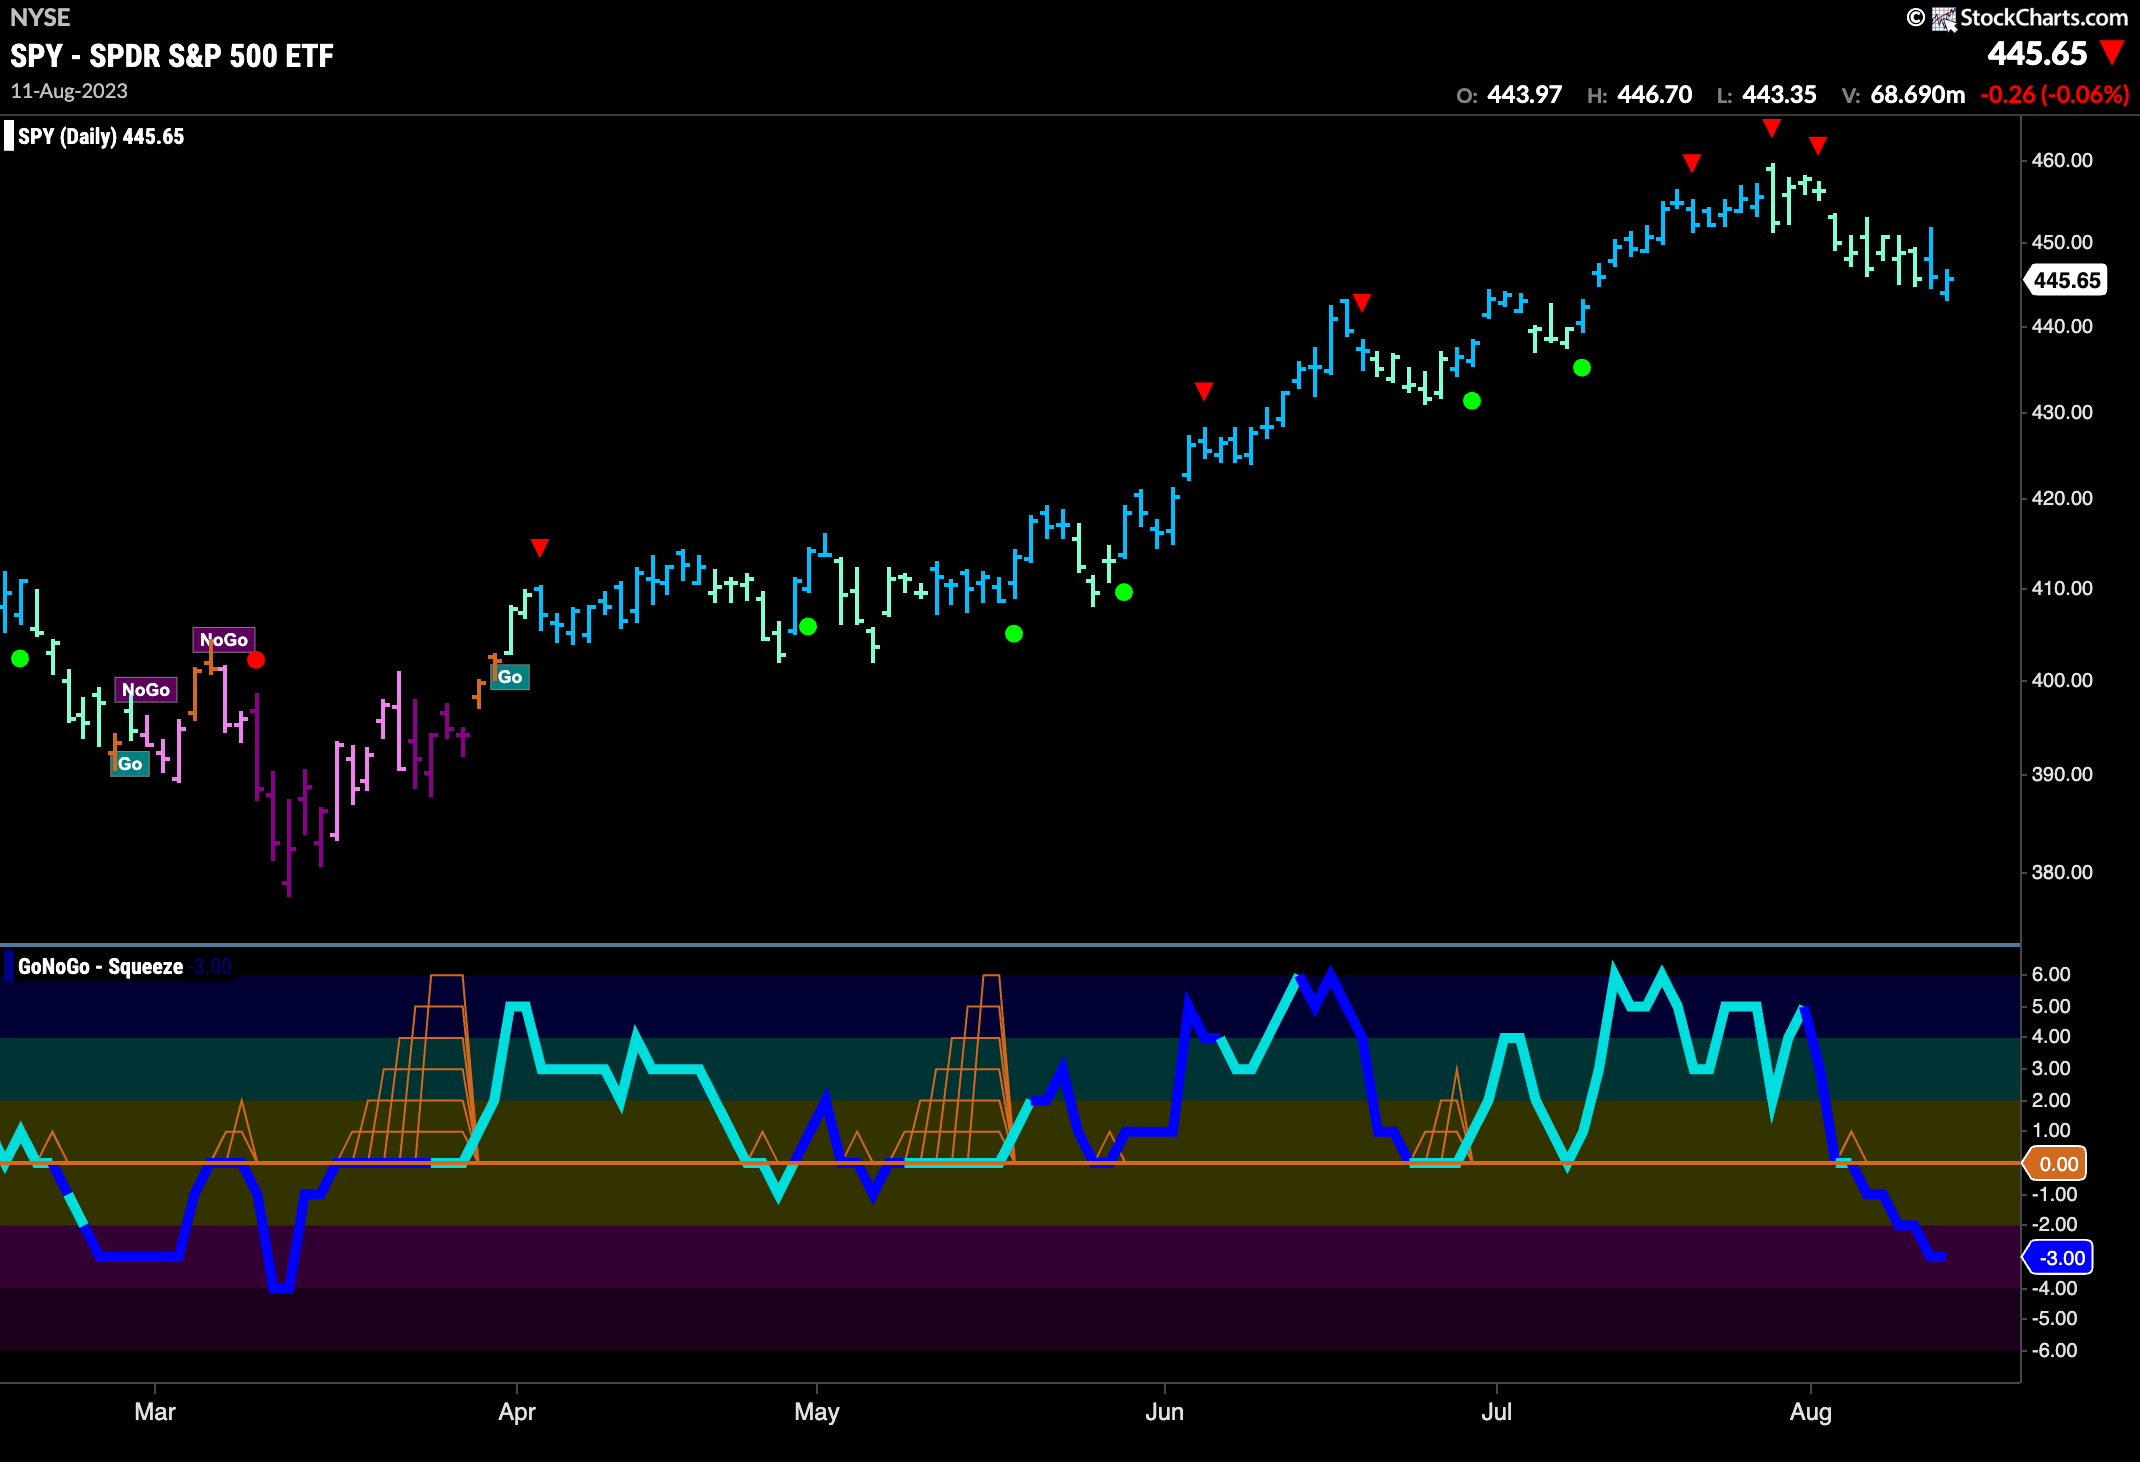
Equities Continue Correction
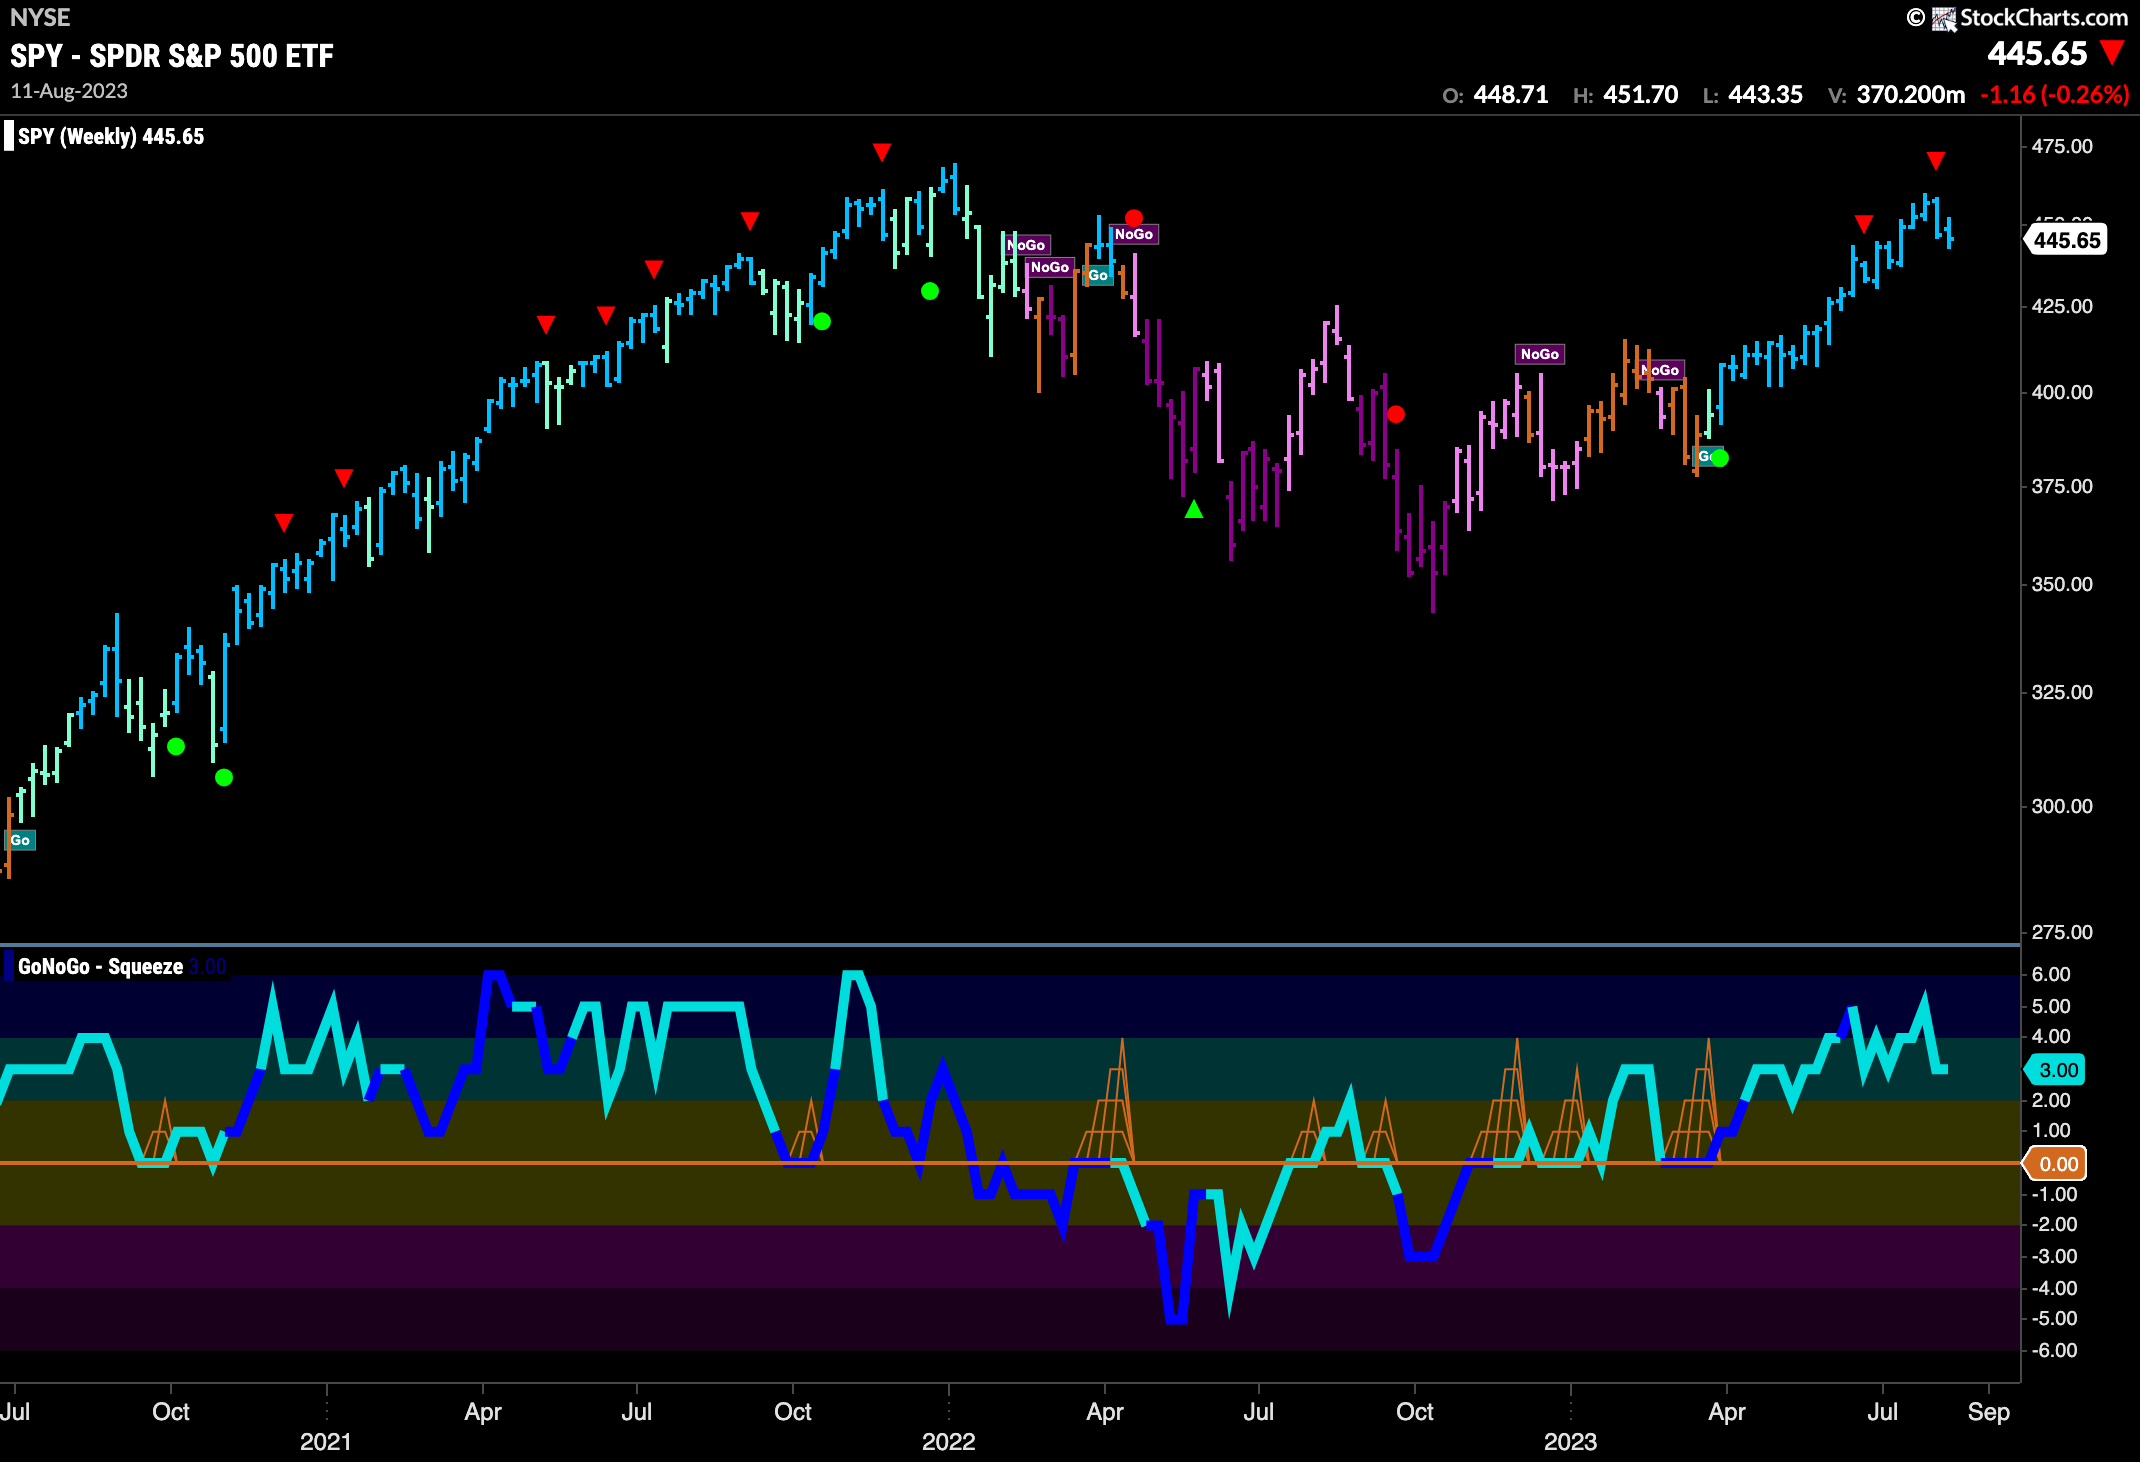
Prices continued to correct from the recent highs. GoNoGo Oscillator has been in negative territory and falling this entire week. Volume is also heavy, telling us that the market is participating in this movement lower. We will watch to see if the oscillator stays firmly in negative territory this week or if price will find some support here.
The longer term weekly chart remains in a “Go” trend. We can see that GoNoGo Oscillator has come off overbought levels and is now in positive territory but not at extremes. We will look for the zero line to provide an objective level of support going forward should it need to.
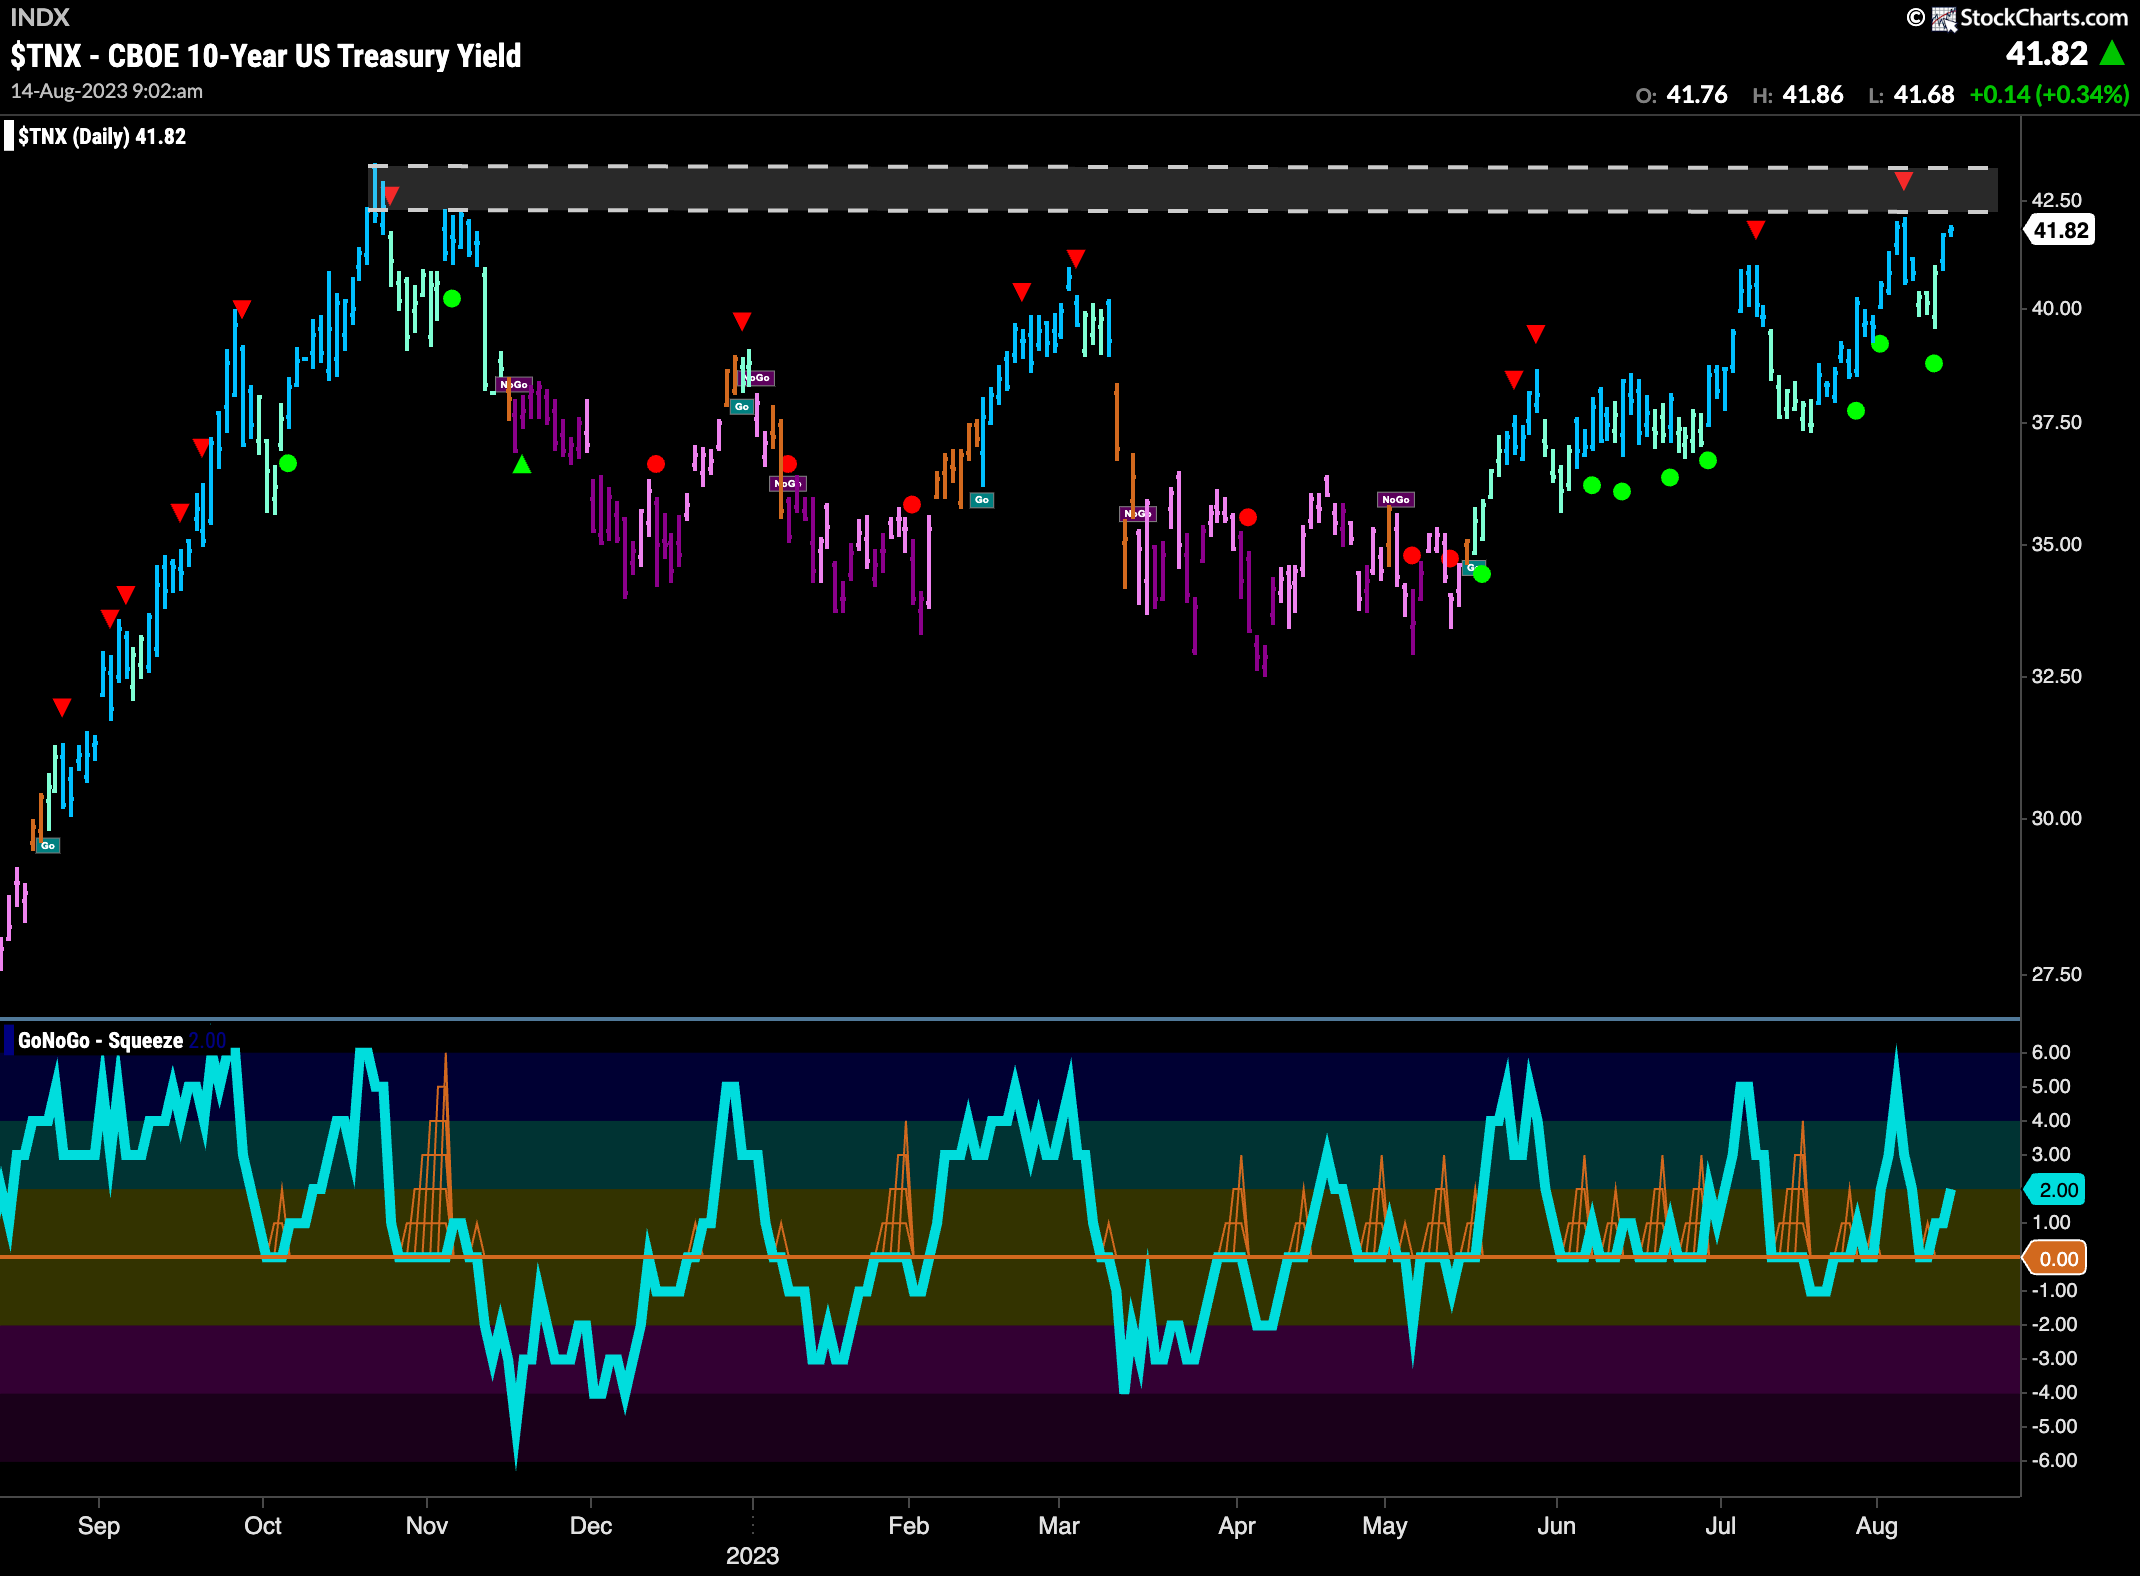
Treasury Rates Hitting Resistance
Treasury bond rates rallied into the end of the week and are now back to levels that have been resistance several times. This is an important level as we can see price hasn’t moved higher since 2022. If price can climb through this resistance it could really hinder equity prices as we would then be back in a rising rate environment.
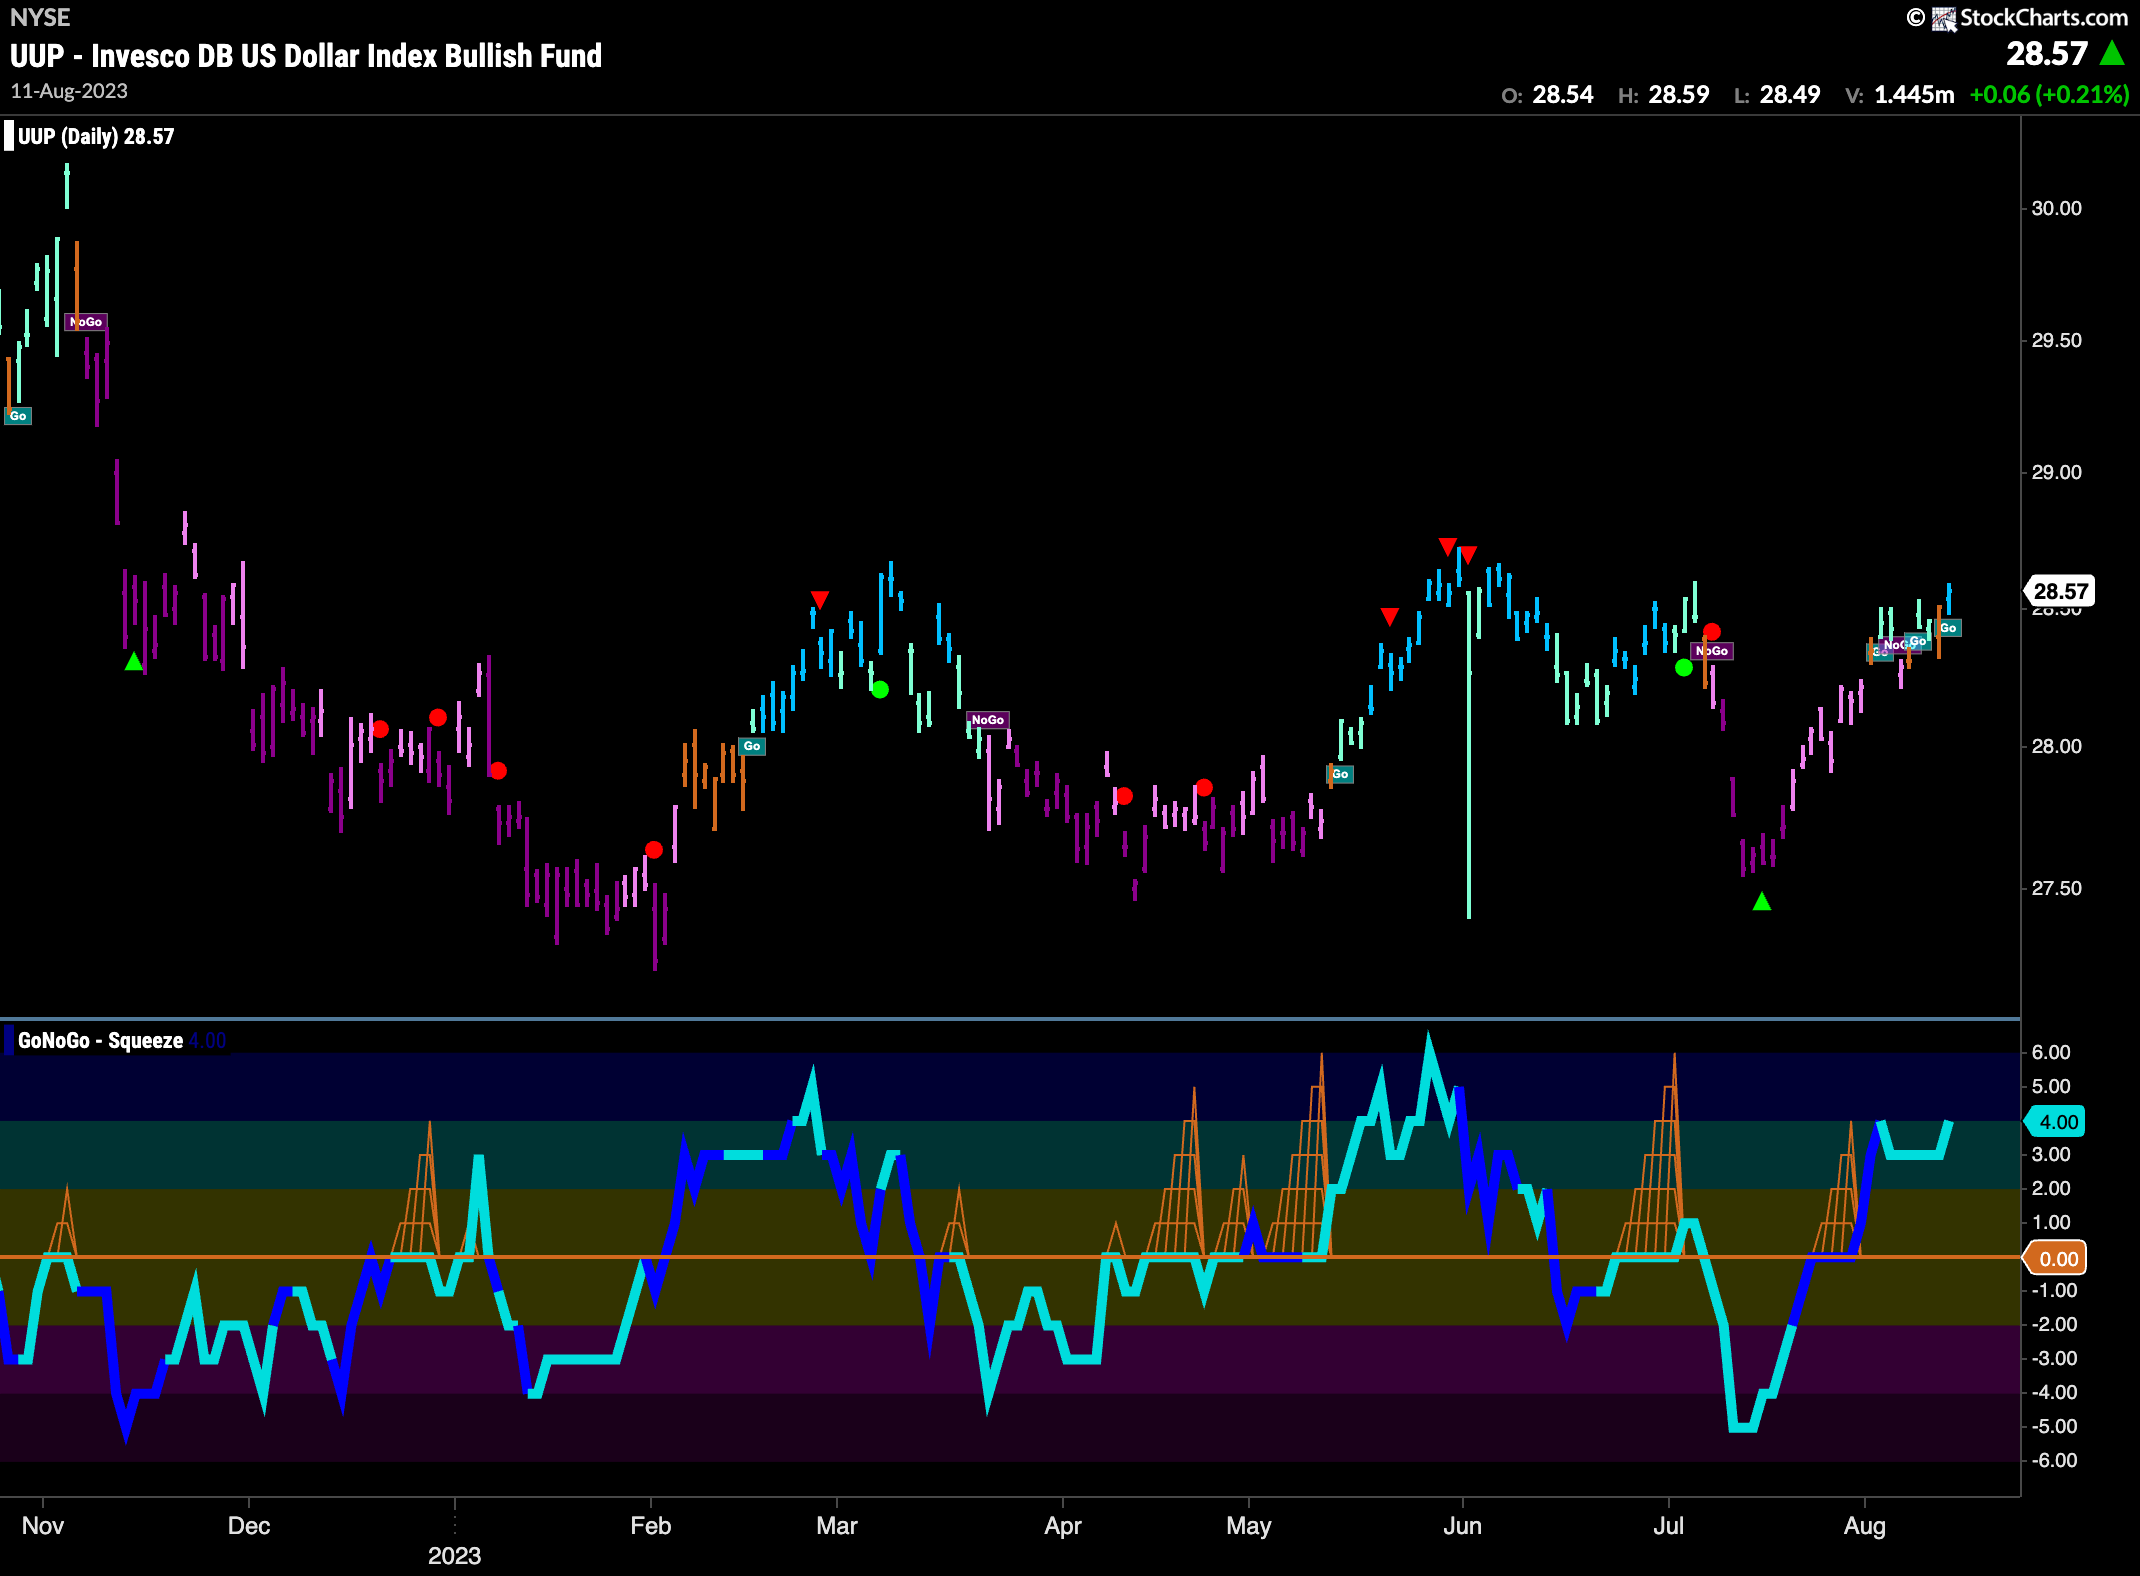
Dollar Tries to Paint “Go” Bars
The dollar is also struggling with levels that have been resistance over the past year. However, GoNoGo Trend painted another “Go” bar at the end of the week as GoNoGo Oscillator is clearly in positive territory but not overbought. A stronger dollar could also put pressure on stocks so it will be interesting to see if the greenback can hold on to this “Go” trend or if it rolls over again.
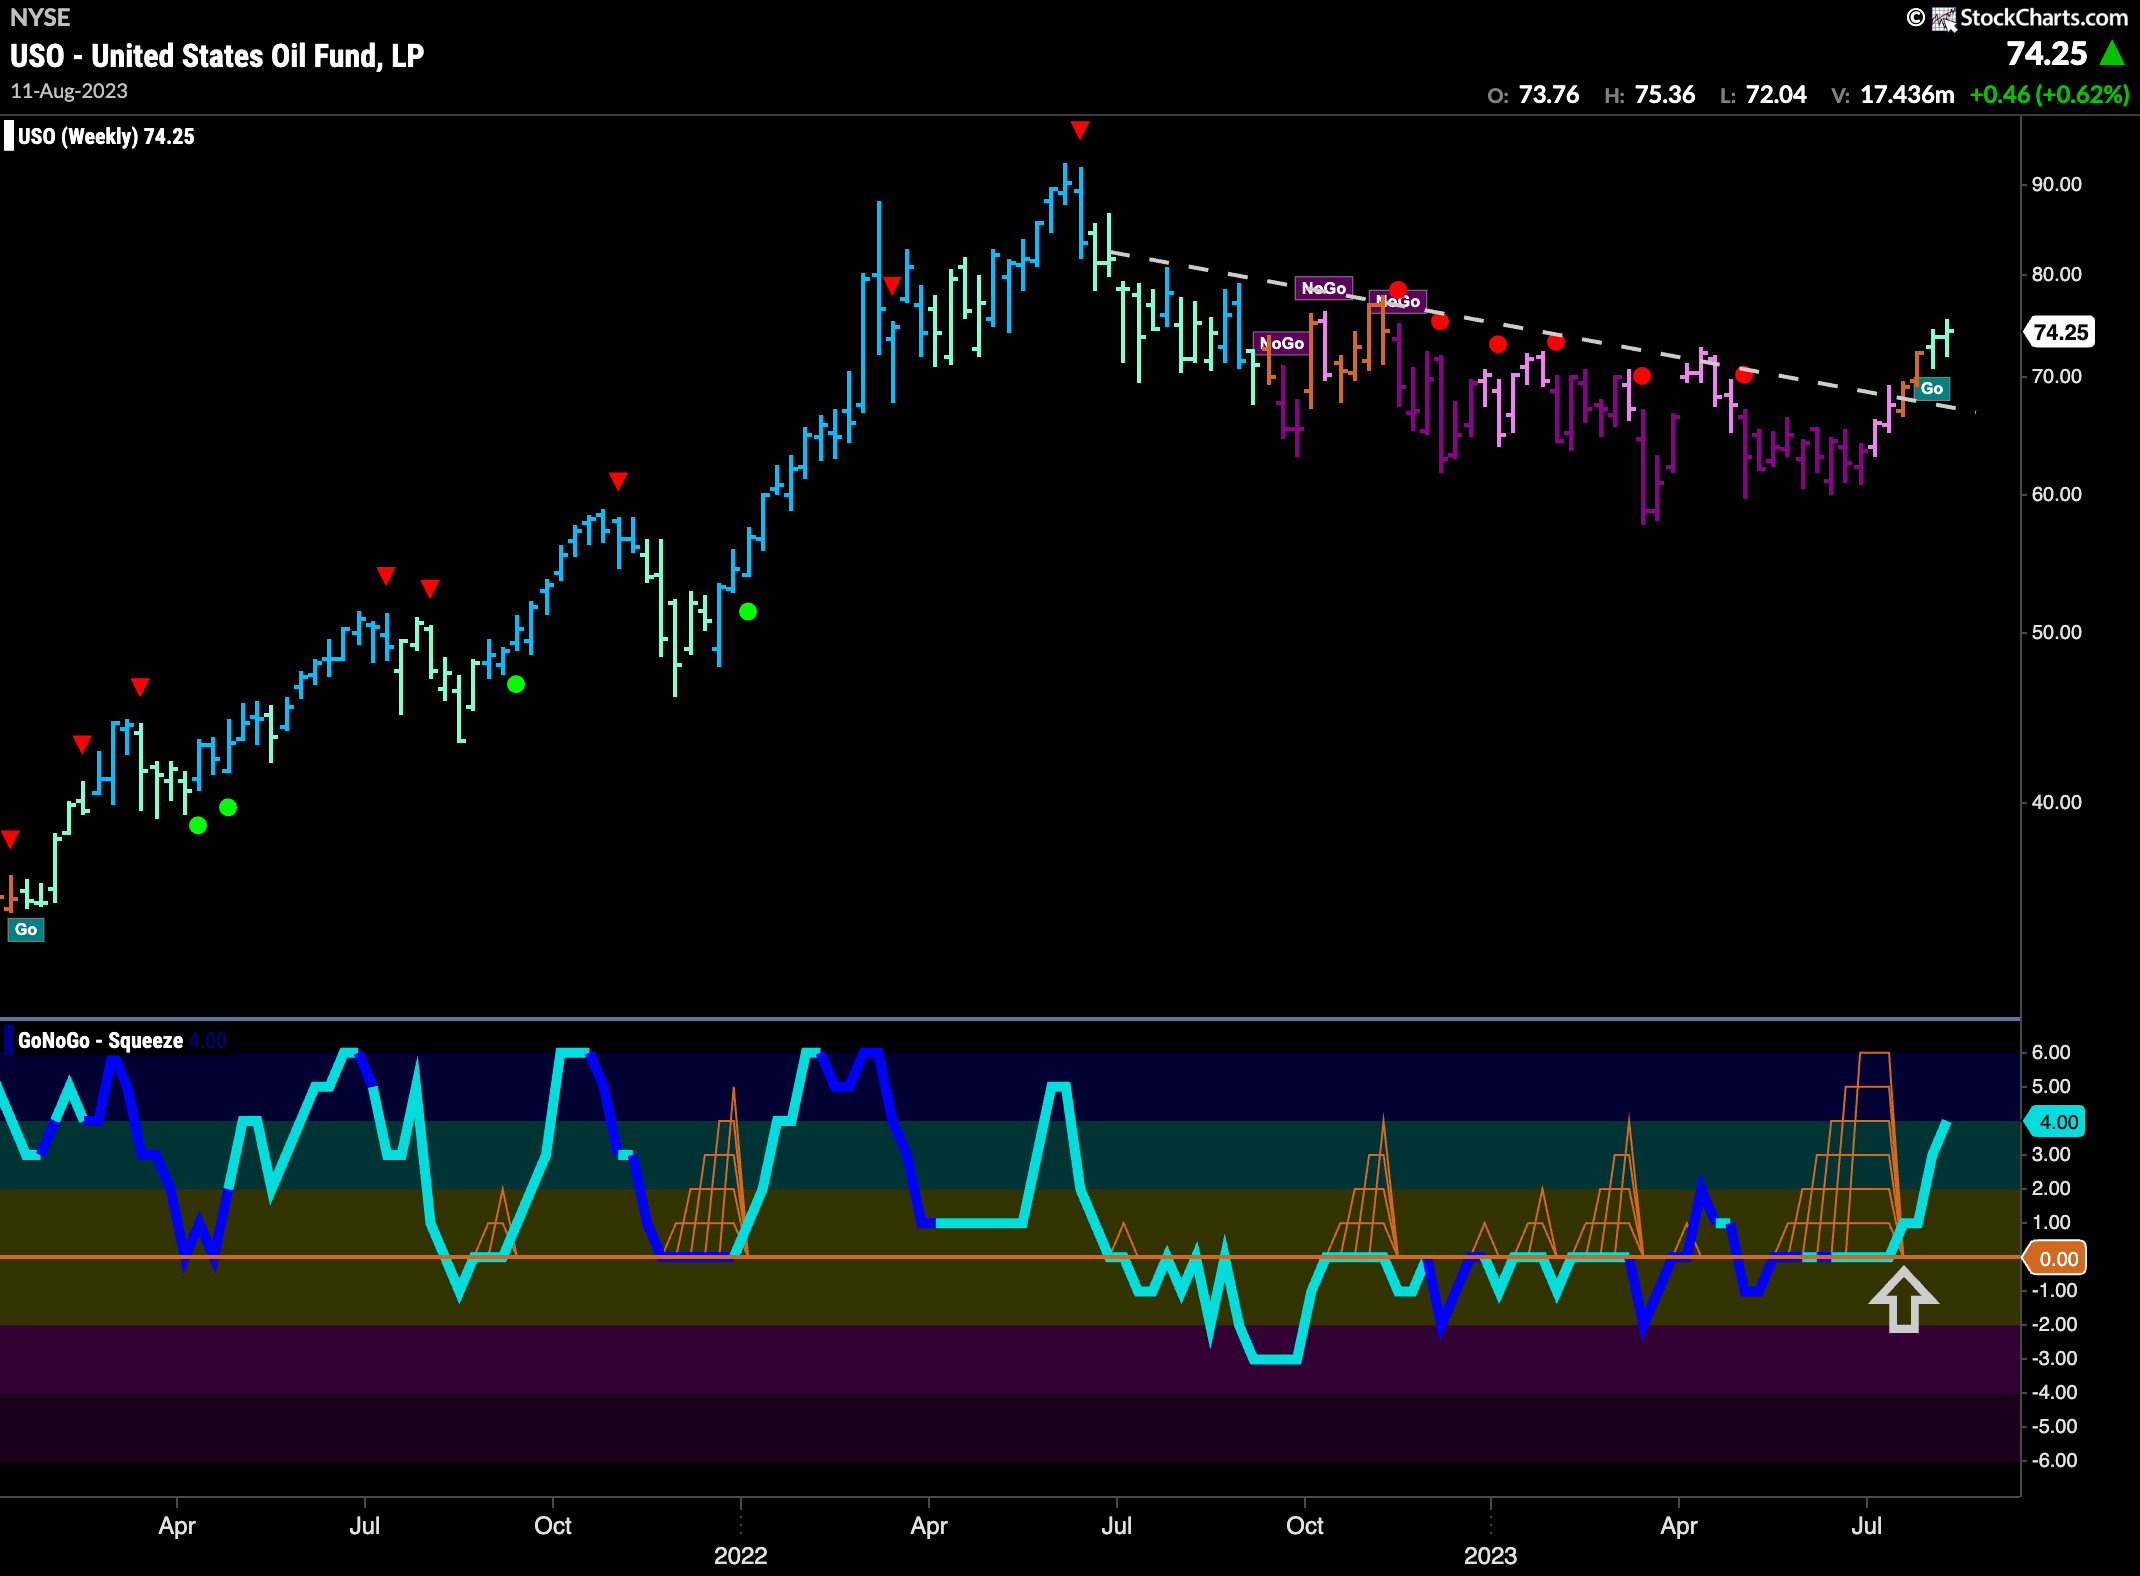
Oil Has Done it!
Oil prices saw GoNoGo Trend paint a second aqua “Go” bar as the indicator was able to maintain the trend. Price is free from the downward sloping trend that it was in for about a year. GoNoGo Oscillator has broken out of the Max GoNoGo Squeeze and is now clearly in positive territory but not yet overbought.
Gold Continues to Struggle
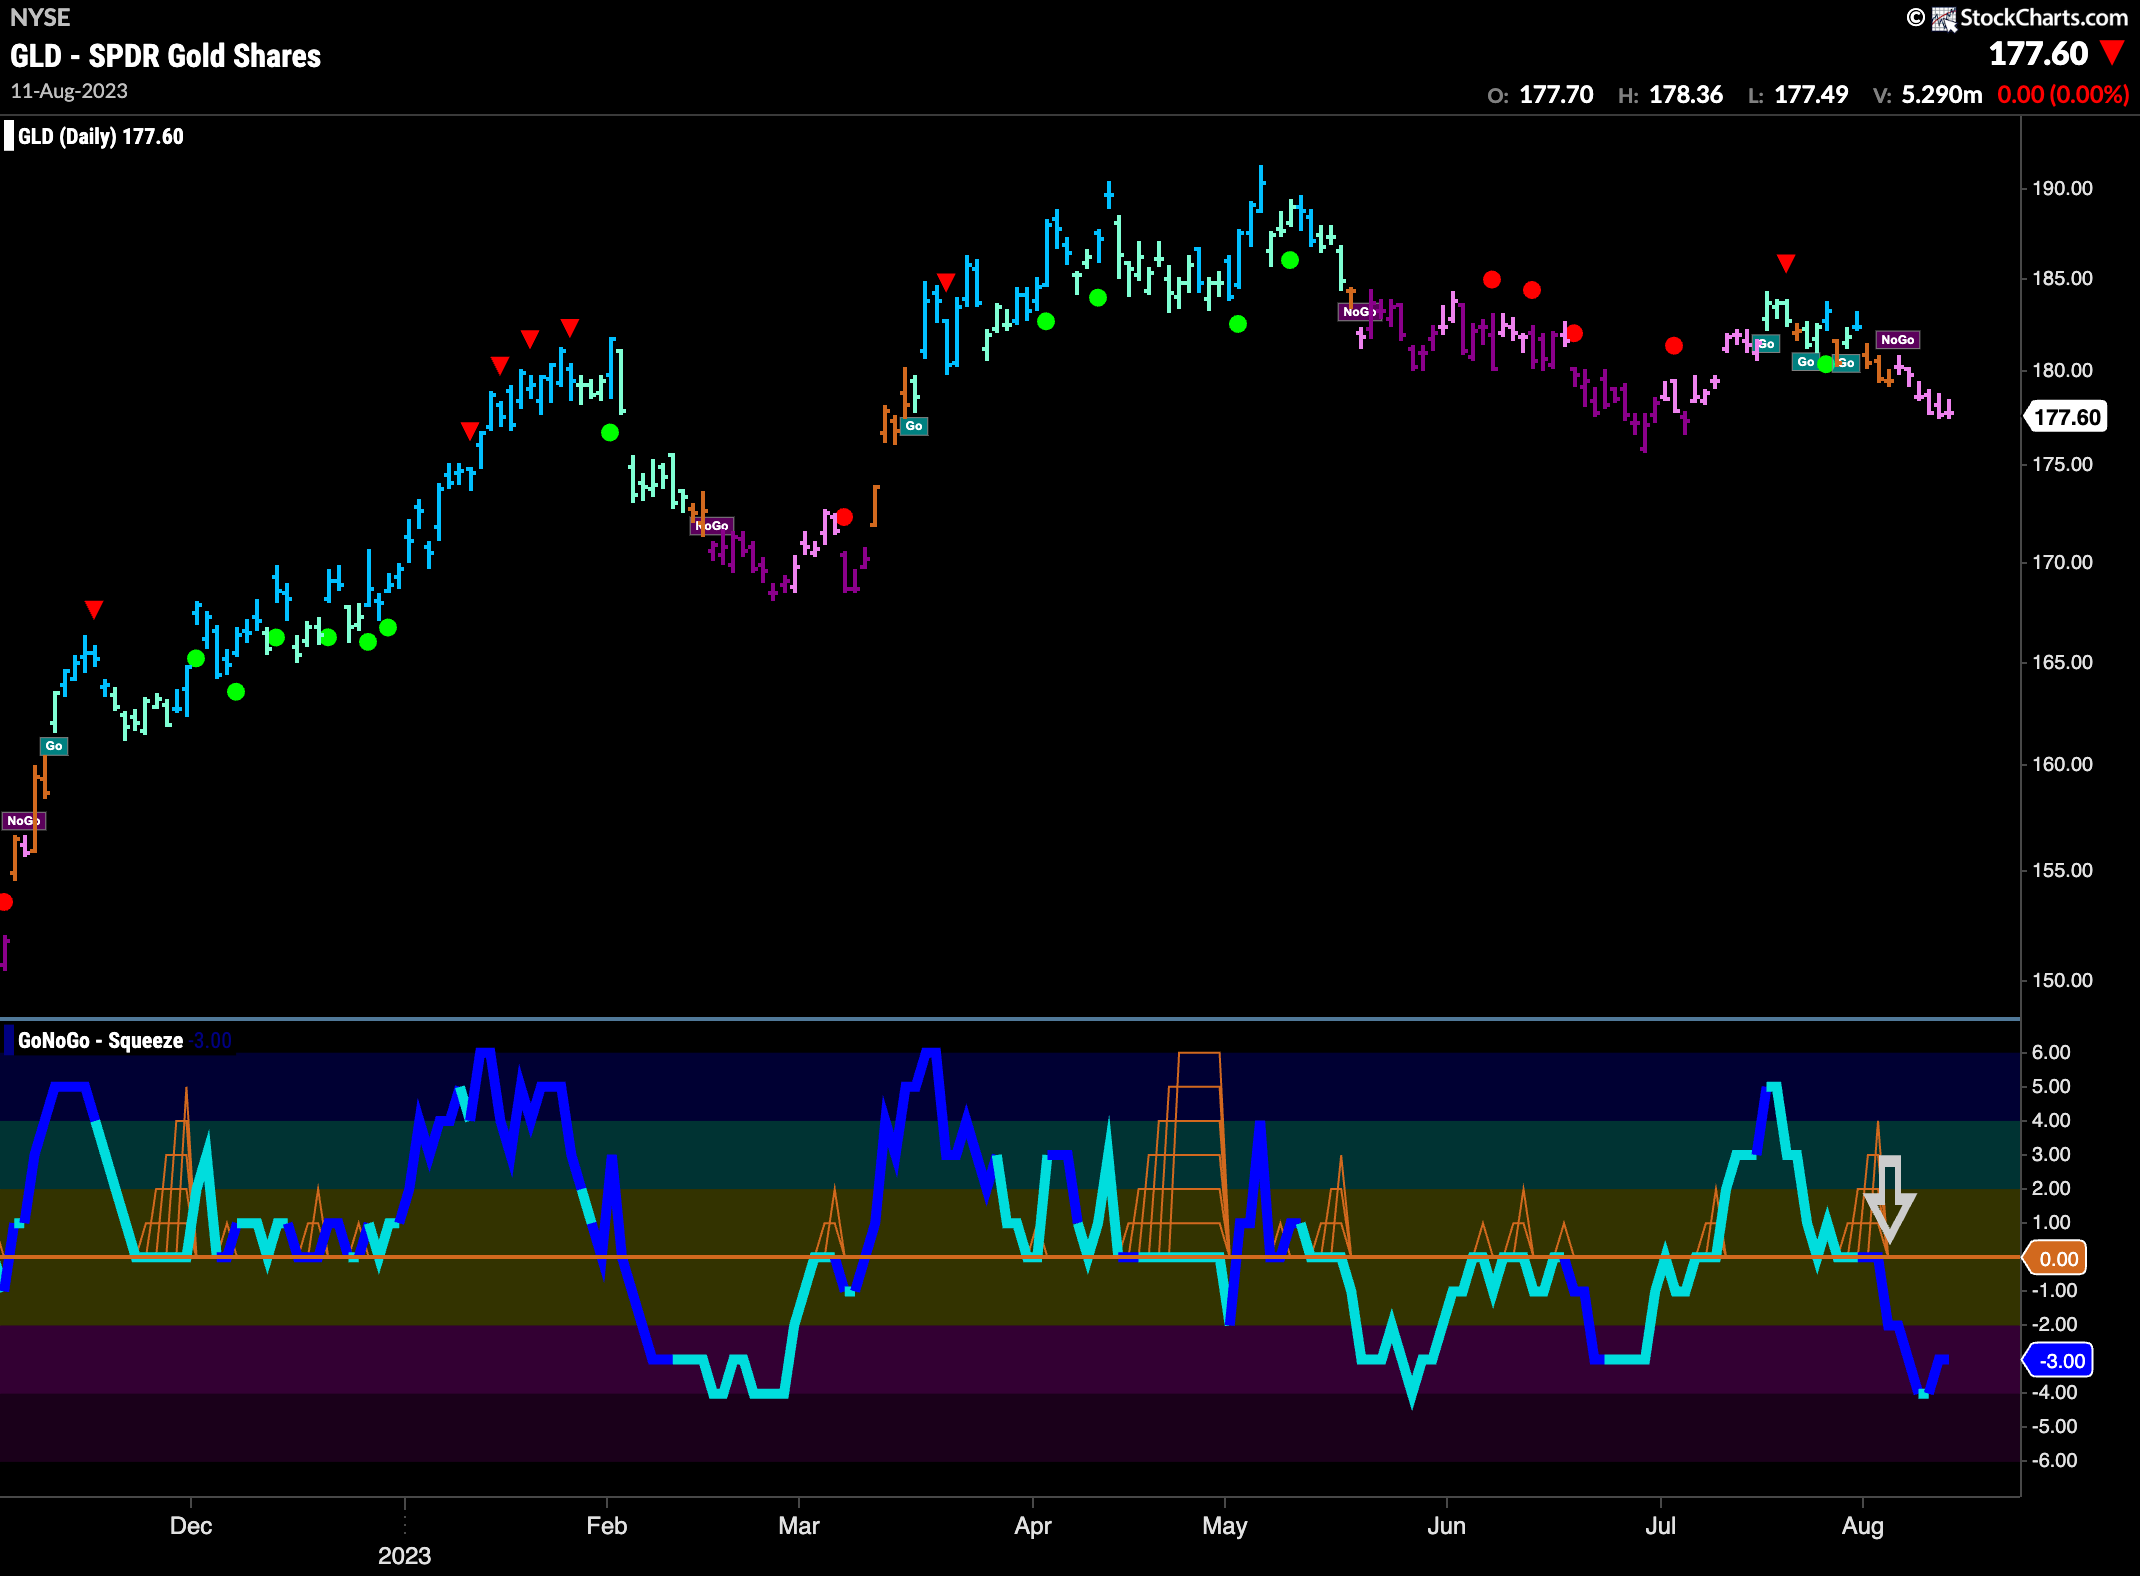
GoNoGo Trend consecutive pink “NoGo” bars this week as price meandered lower. We do see natural area of support close by from prior lows. GoNoGo Oscillator fell further into negative territory after breaking through the zero line last week and we see that volume is heavy.
Sector RelMap
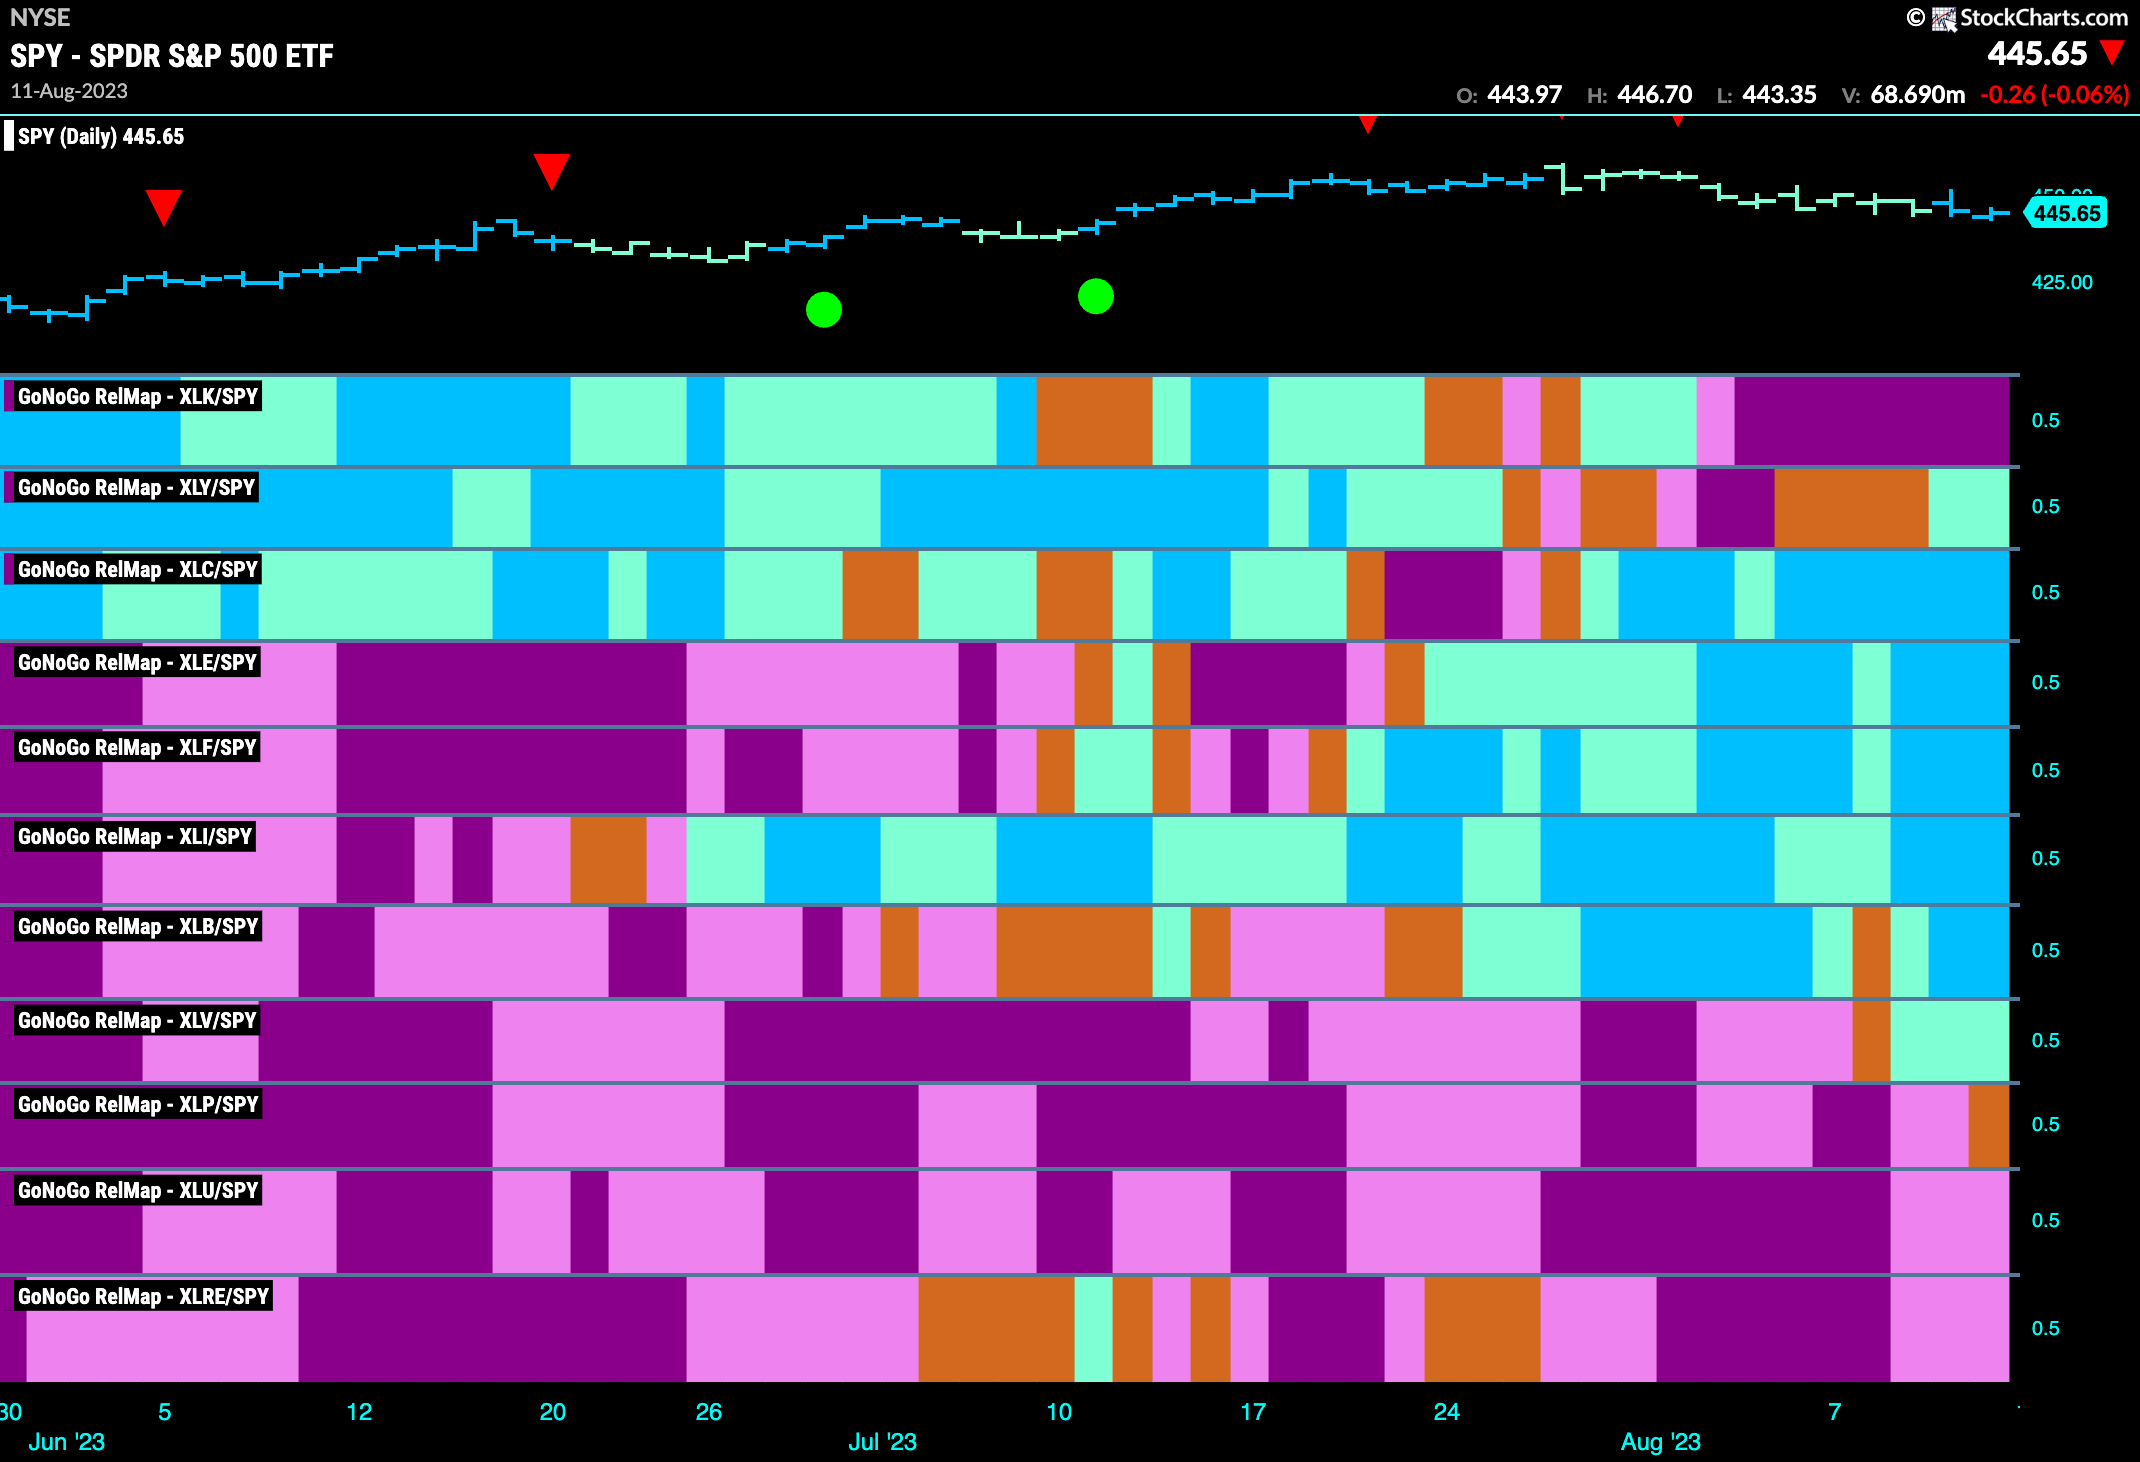
Below is the GoNoGo Sector RelMap. This GoNoGo RelMap applies the GoNoGo Trend to the relative strength ratios of the sectors to the base index. Looking at this map, we can quickly see where the relative outperformance is coming from as well as which sectors are lagging on a relative basis. 7 sectors are outperforming the base index this week. $XLY, $XLC, $XLE, $XLF, $XLI, $XLB and $XLV are painting “Go” bars.
Industrials in Relative “Go” Trend
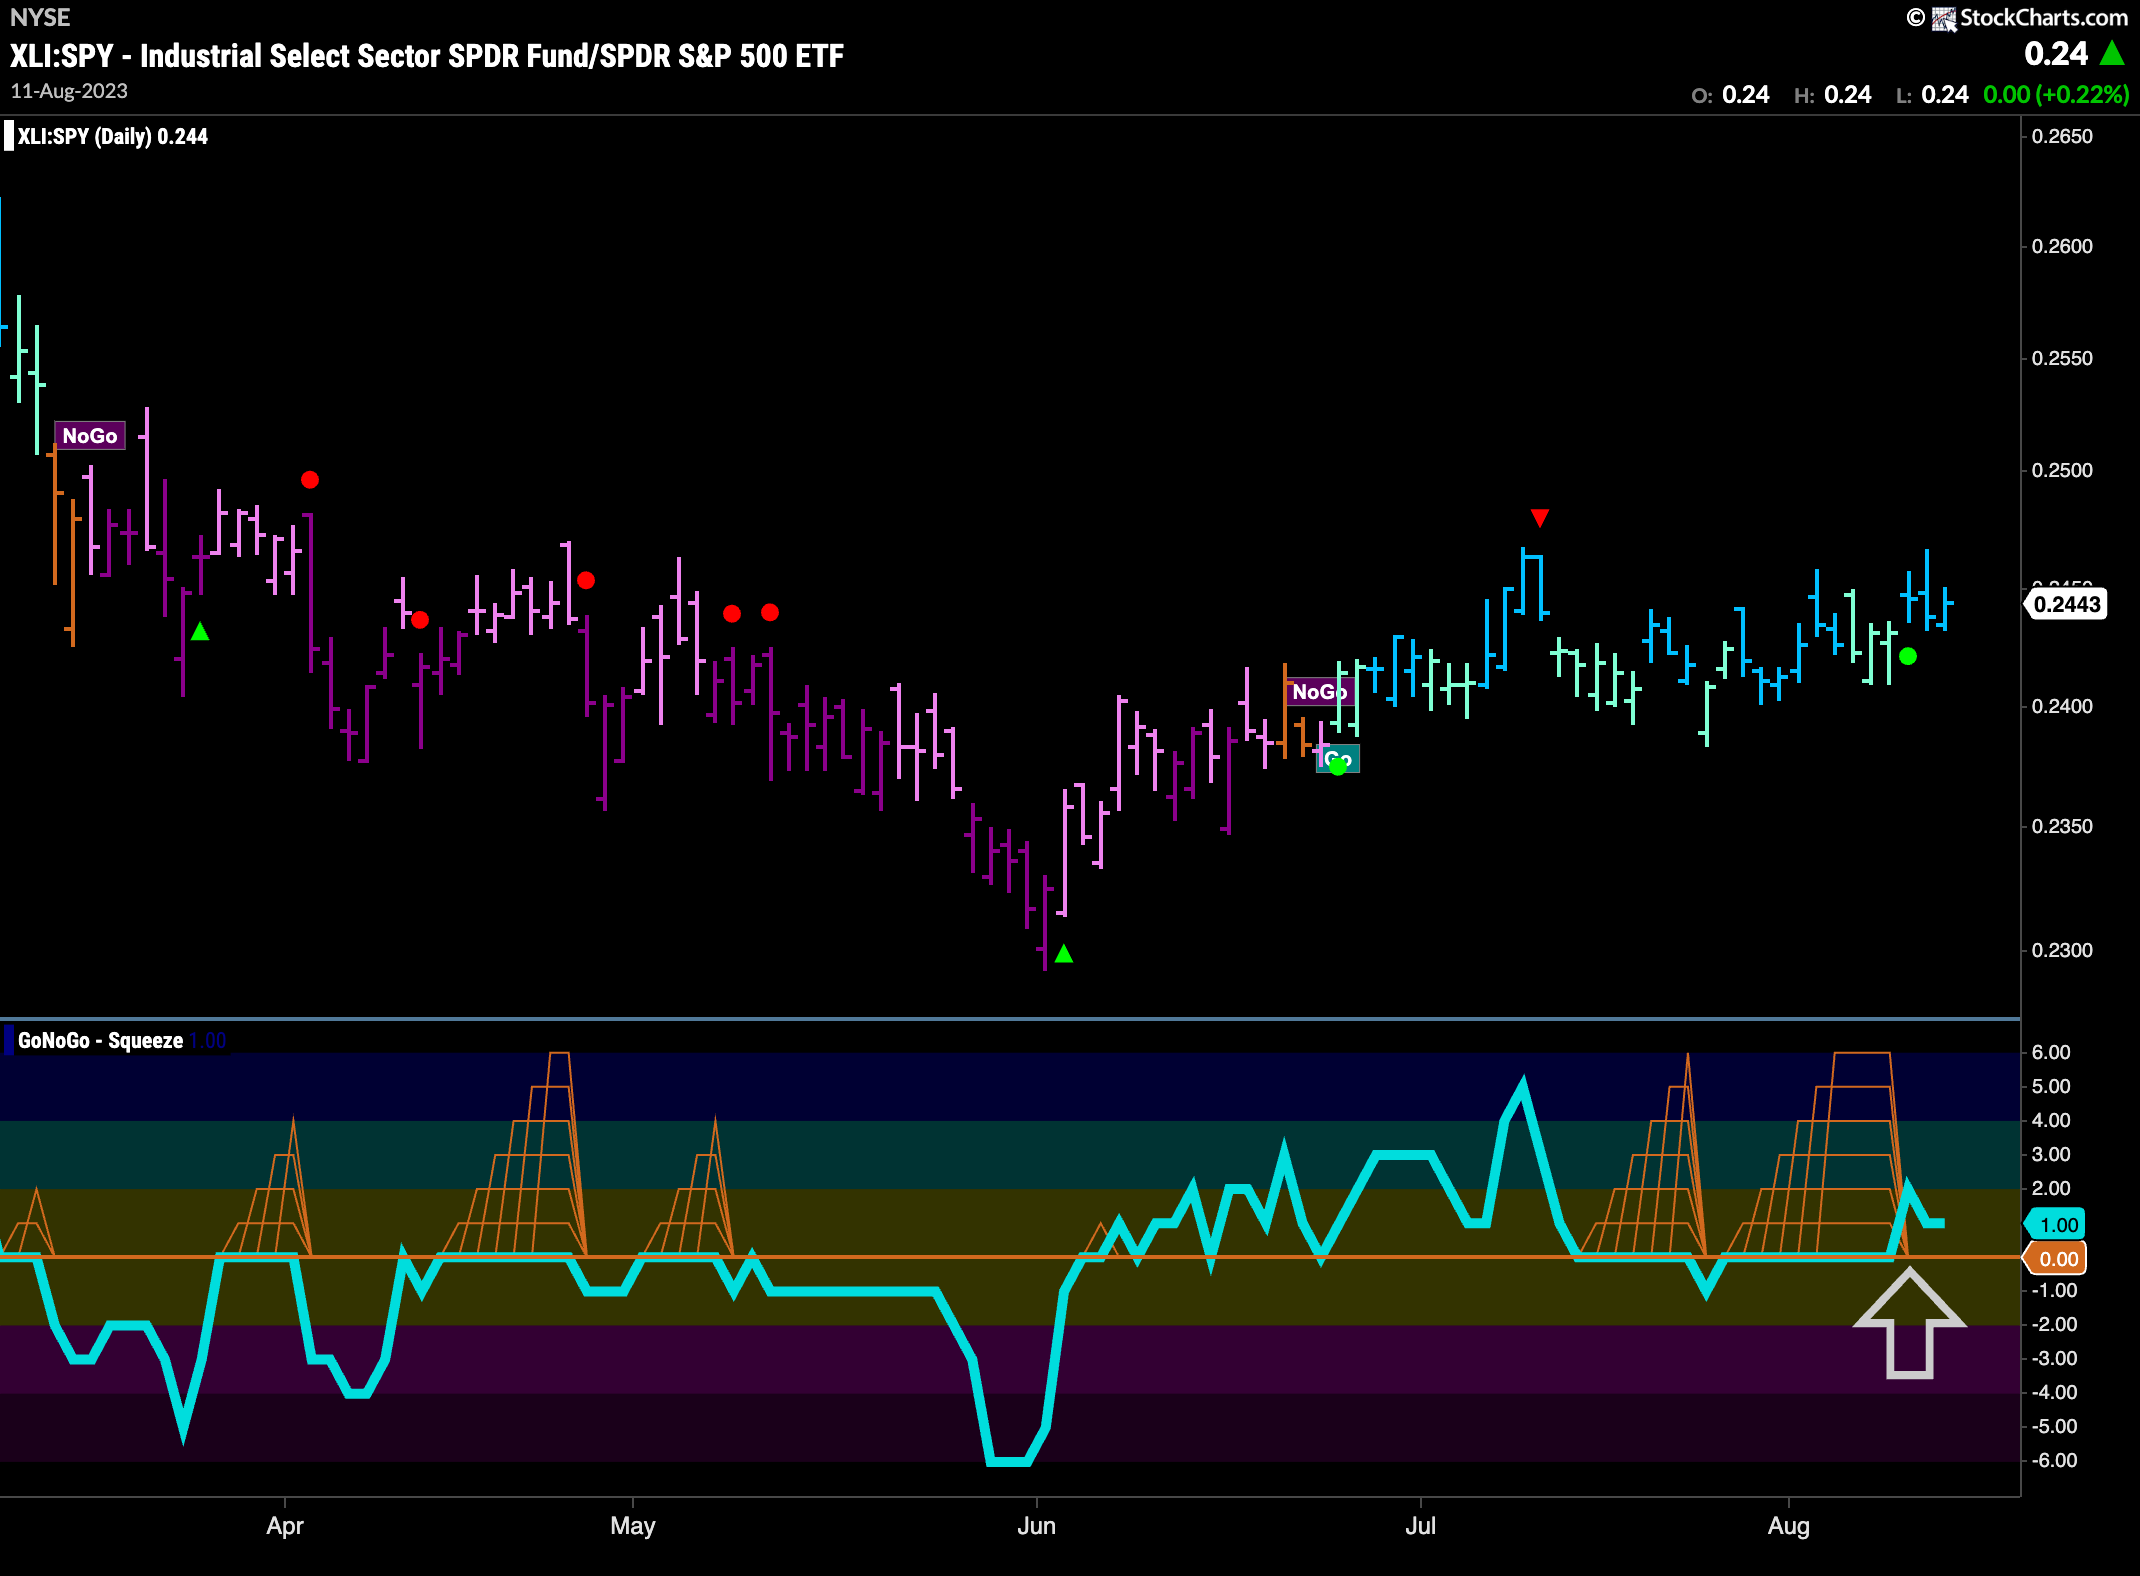
The Sector RelMap above showed that Industrials has been a strong out-performer for some weeks now and if we take a look at that relative strength ratio using the full suite of GoNoGo tools we can see that the “Go” trend is painting strong blue bars. GoNoGo Oscillator is breaking out of a Max GoNoGo Squeeze into positive territory and this leads us to believe that this relative out-performance is likely to continue.
Industrials Sub Group RelMap
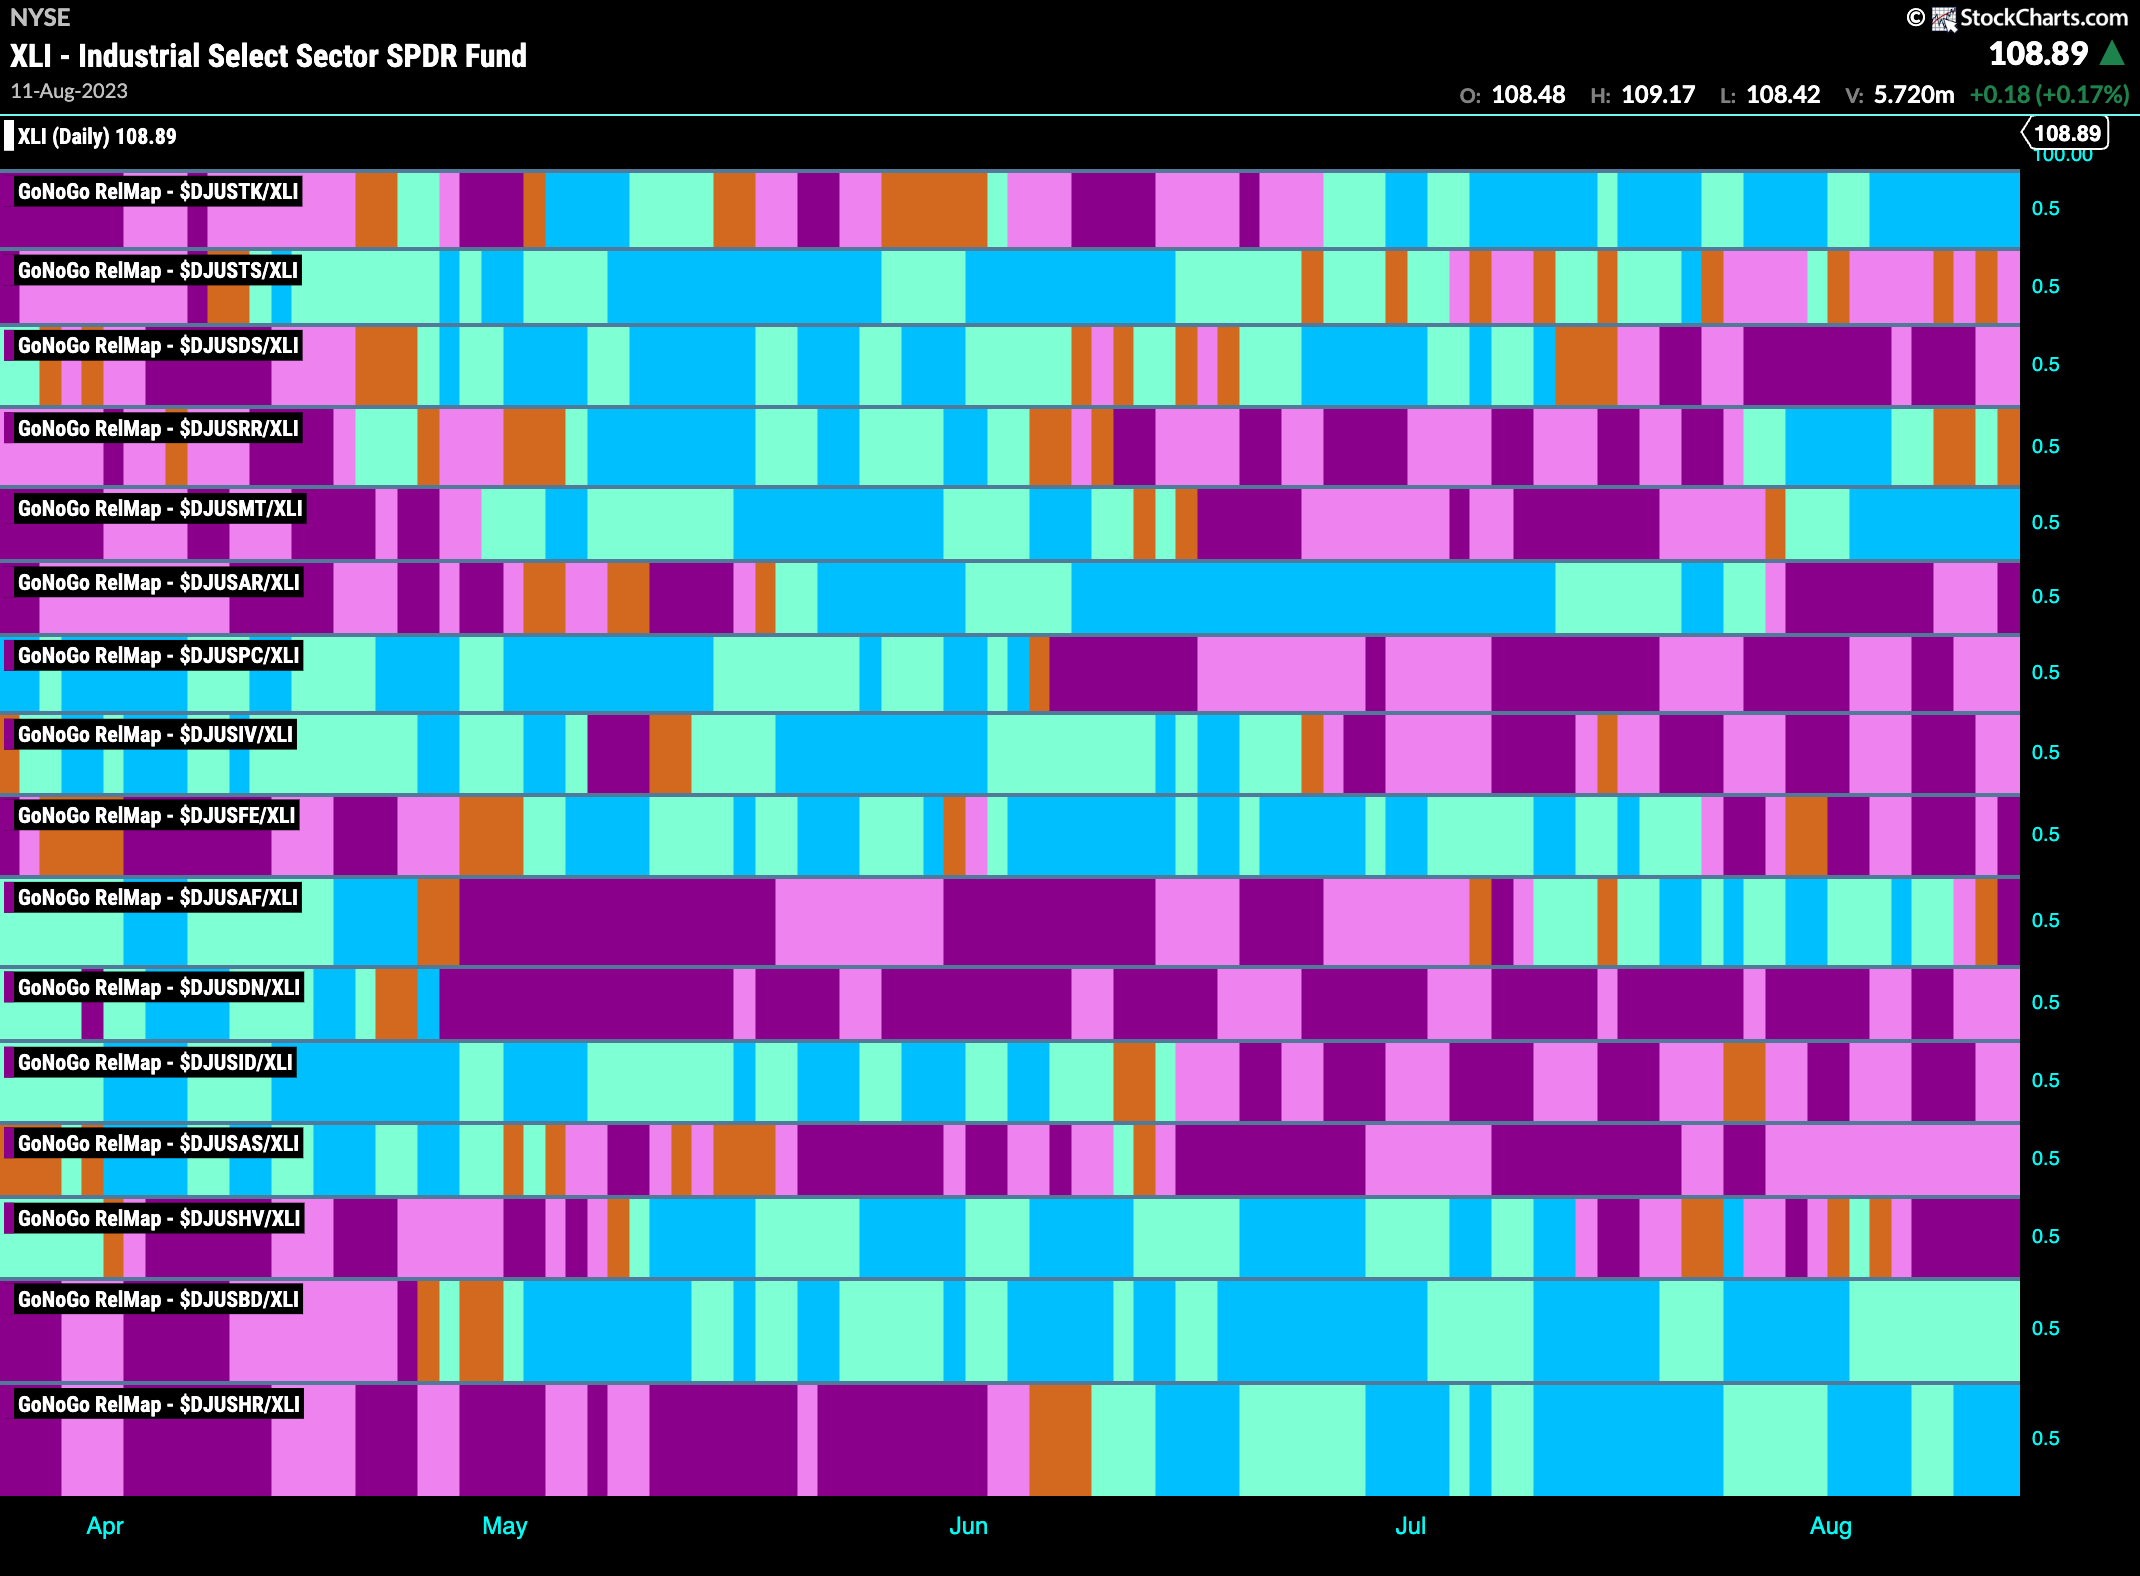
Given the strength of the industrials sector, we can take a look at the sub groups to see where opportunities may lie. Several sub groups are in relative “Go” trends to the larger sector. Three that are painting strong blue “Go” bars are trucking, marine transportation and commercial vehicles.
$ODFL looks for Trend Continuation
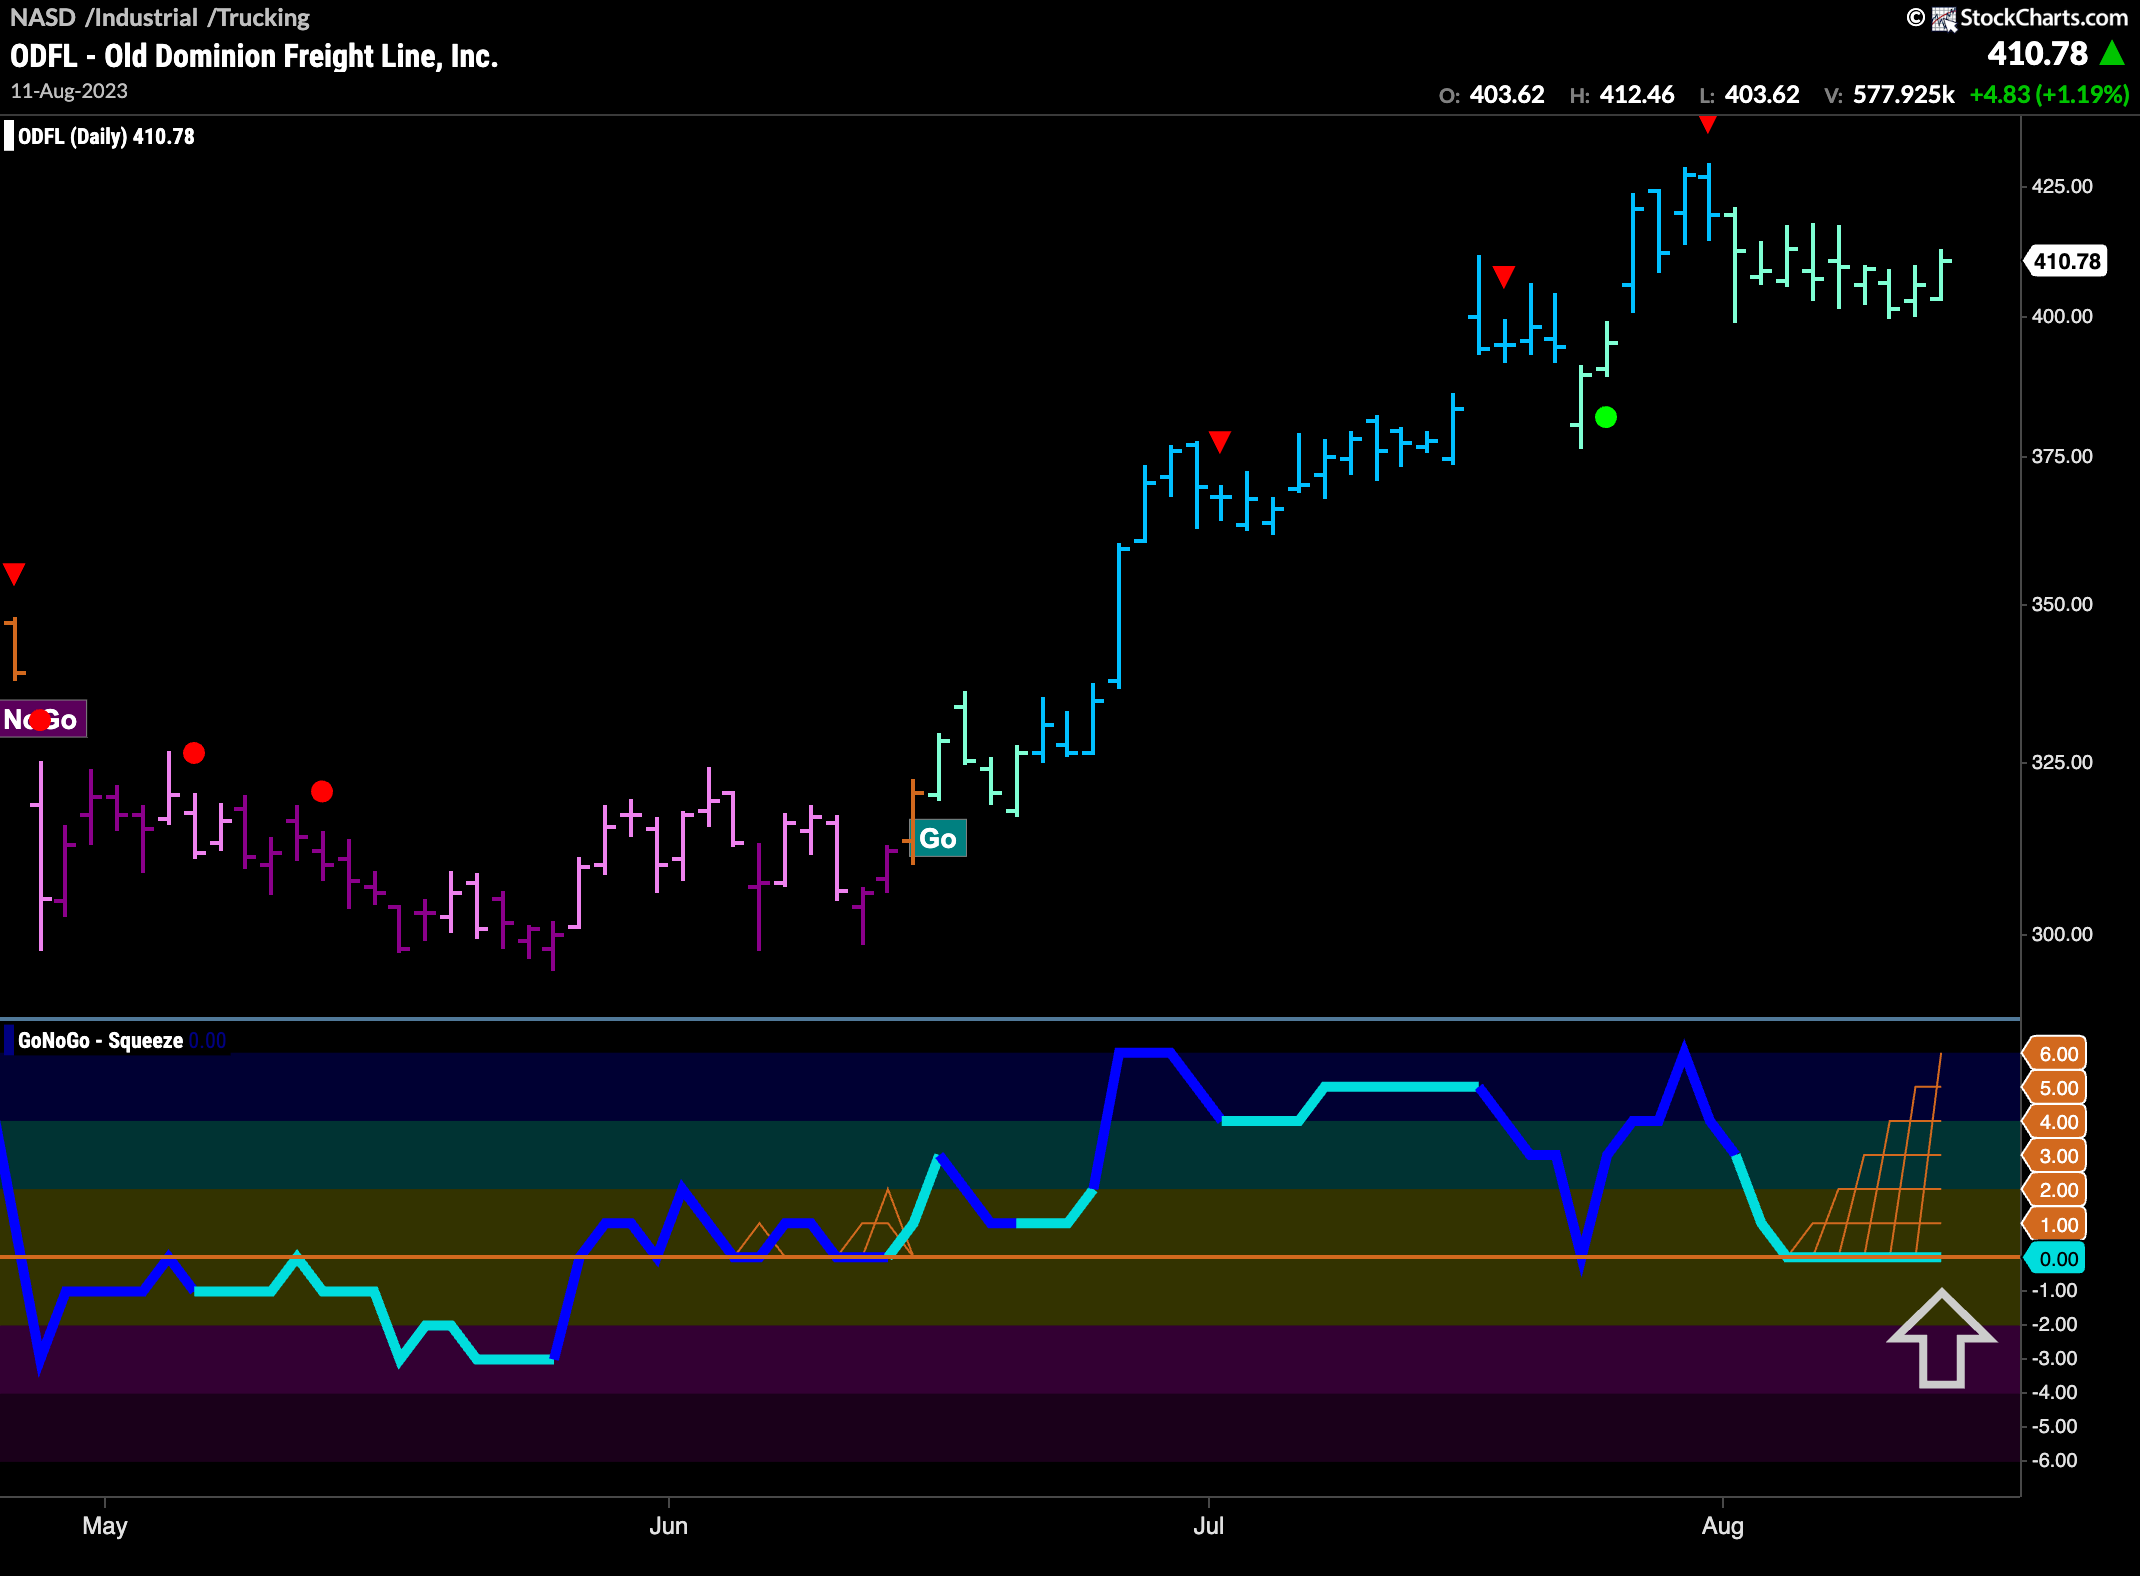
Within the trucking sub group, Old Dominion Freight Line, Inc is already in an established “Go” trend, but has seen price pull back and GoNoGo Trend paint a series of weaker aqua bars. Could this be a buy the dip opportunity? We look to the GoNoGo Oscillator for confirmation of trend continuation. Currently, the oscillator is riding the zero line where a Max GoNoGo Squeeze is in play. We will watch for the break of the Squeeze, and if it is into positive territory then we will be able to say that momentum is resurgent in the direction of the “Go” trend and will expect an attempt at a new higher high.
$PLOW Looking for Support
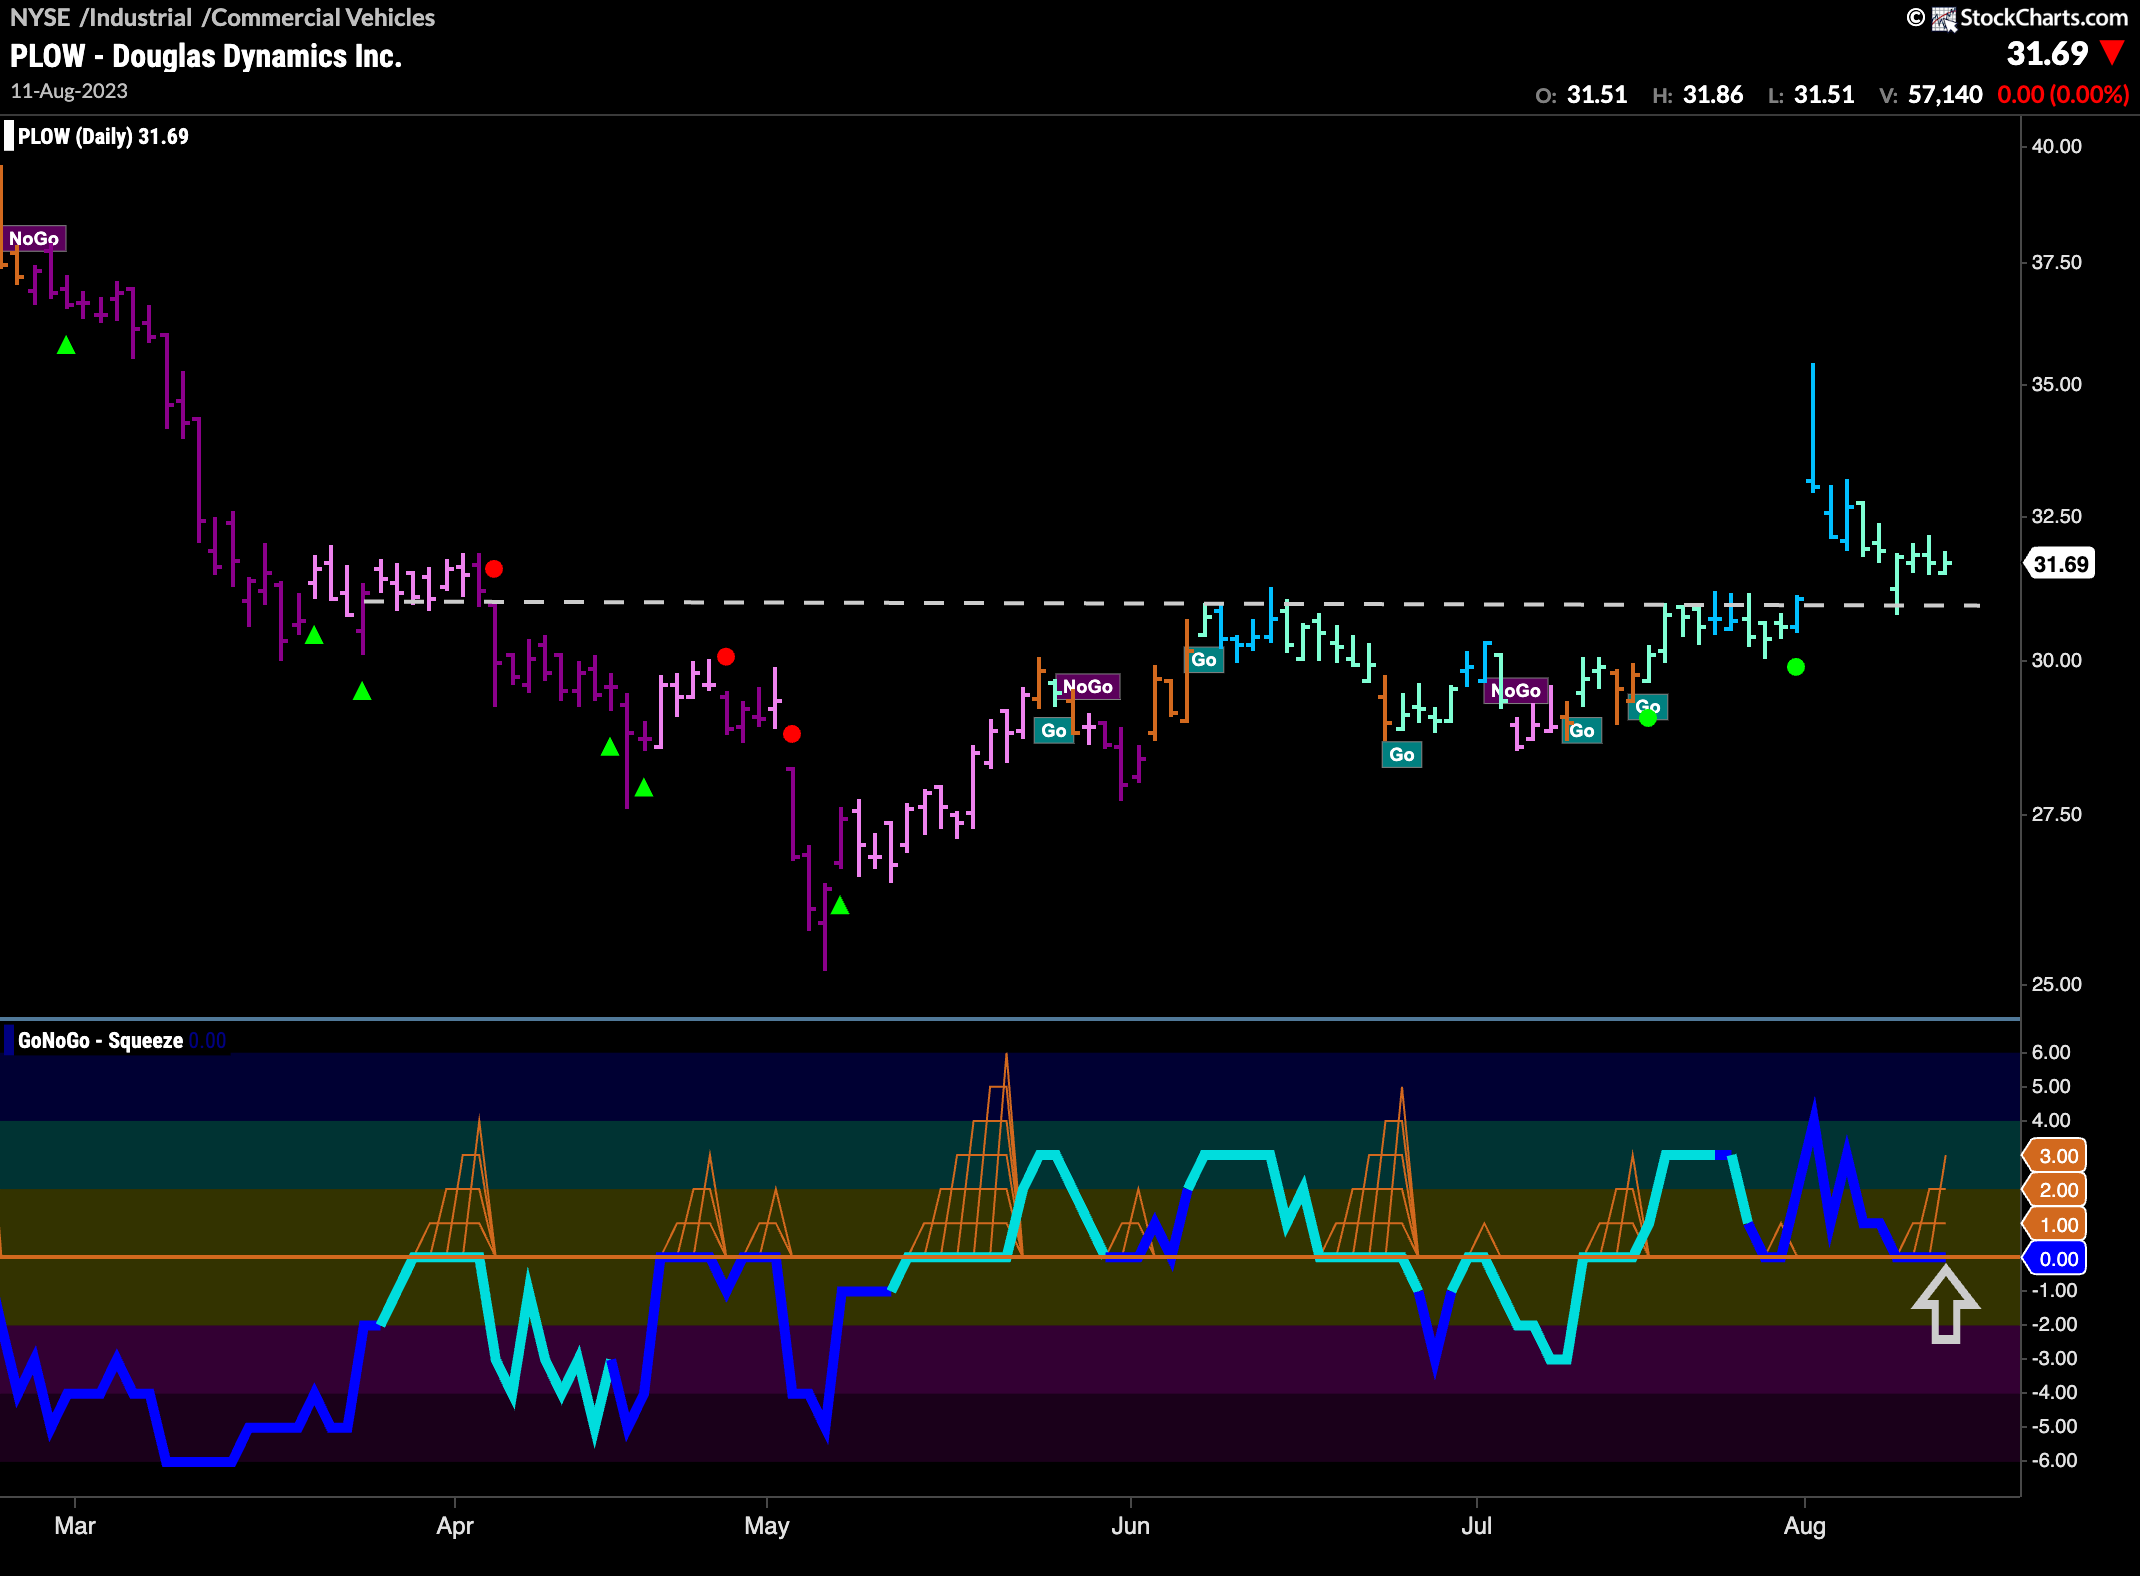
The chart below shows the price chart of $PLOW, in the commercial vehicles space. We can see that it has not taken off yet and the “Go” trend is still looking for support at the bottom of the gap. We see the concept of polarity in play here as levels that were resistance earlier in the chart are becoming support. GoNoGo Oscillator is also testing the zero line from above where we will watch to see if it finds support. Volume is heavy, telling us that there is good market participation.
$TRMD in New “Go” Trend
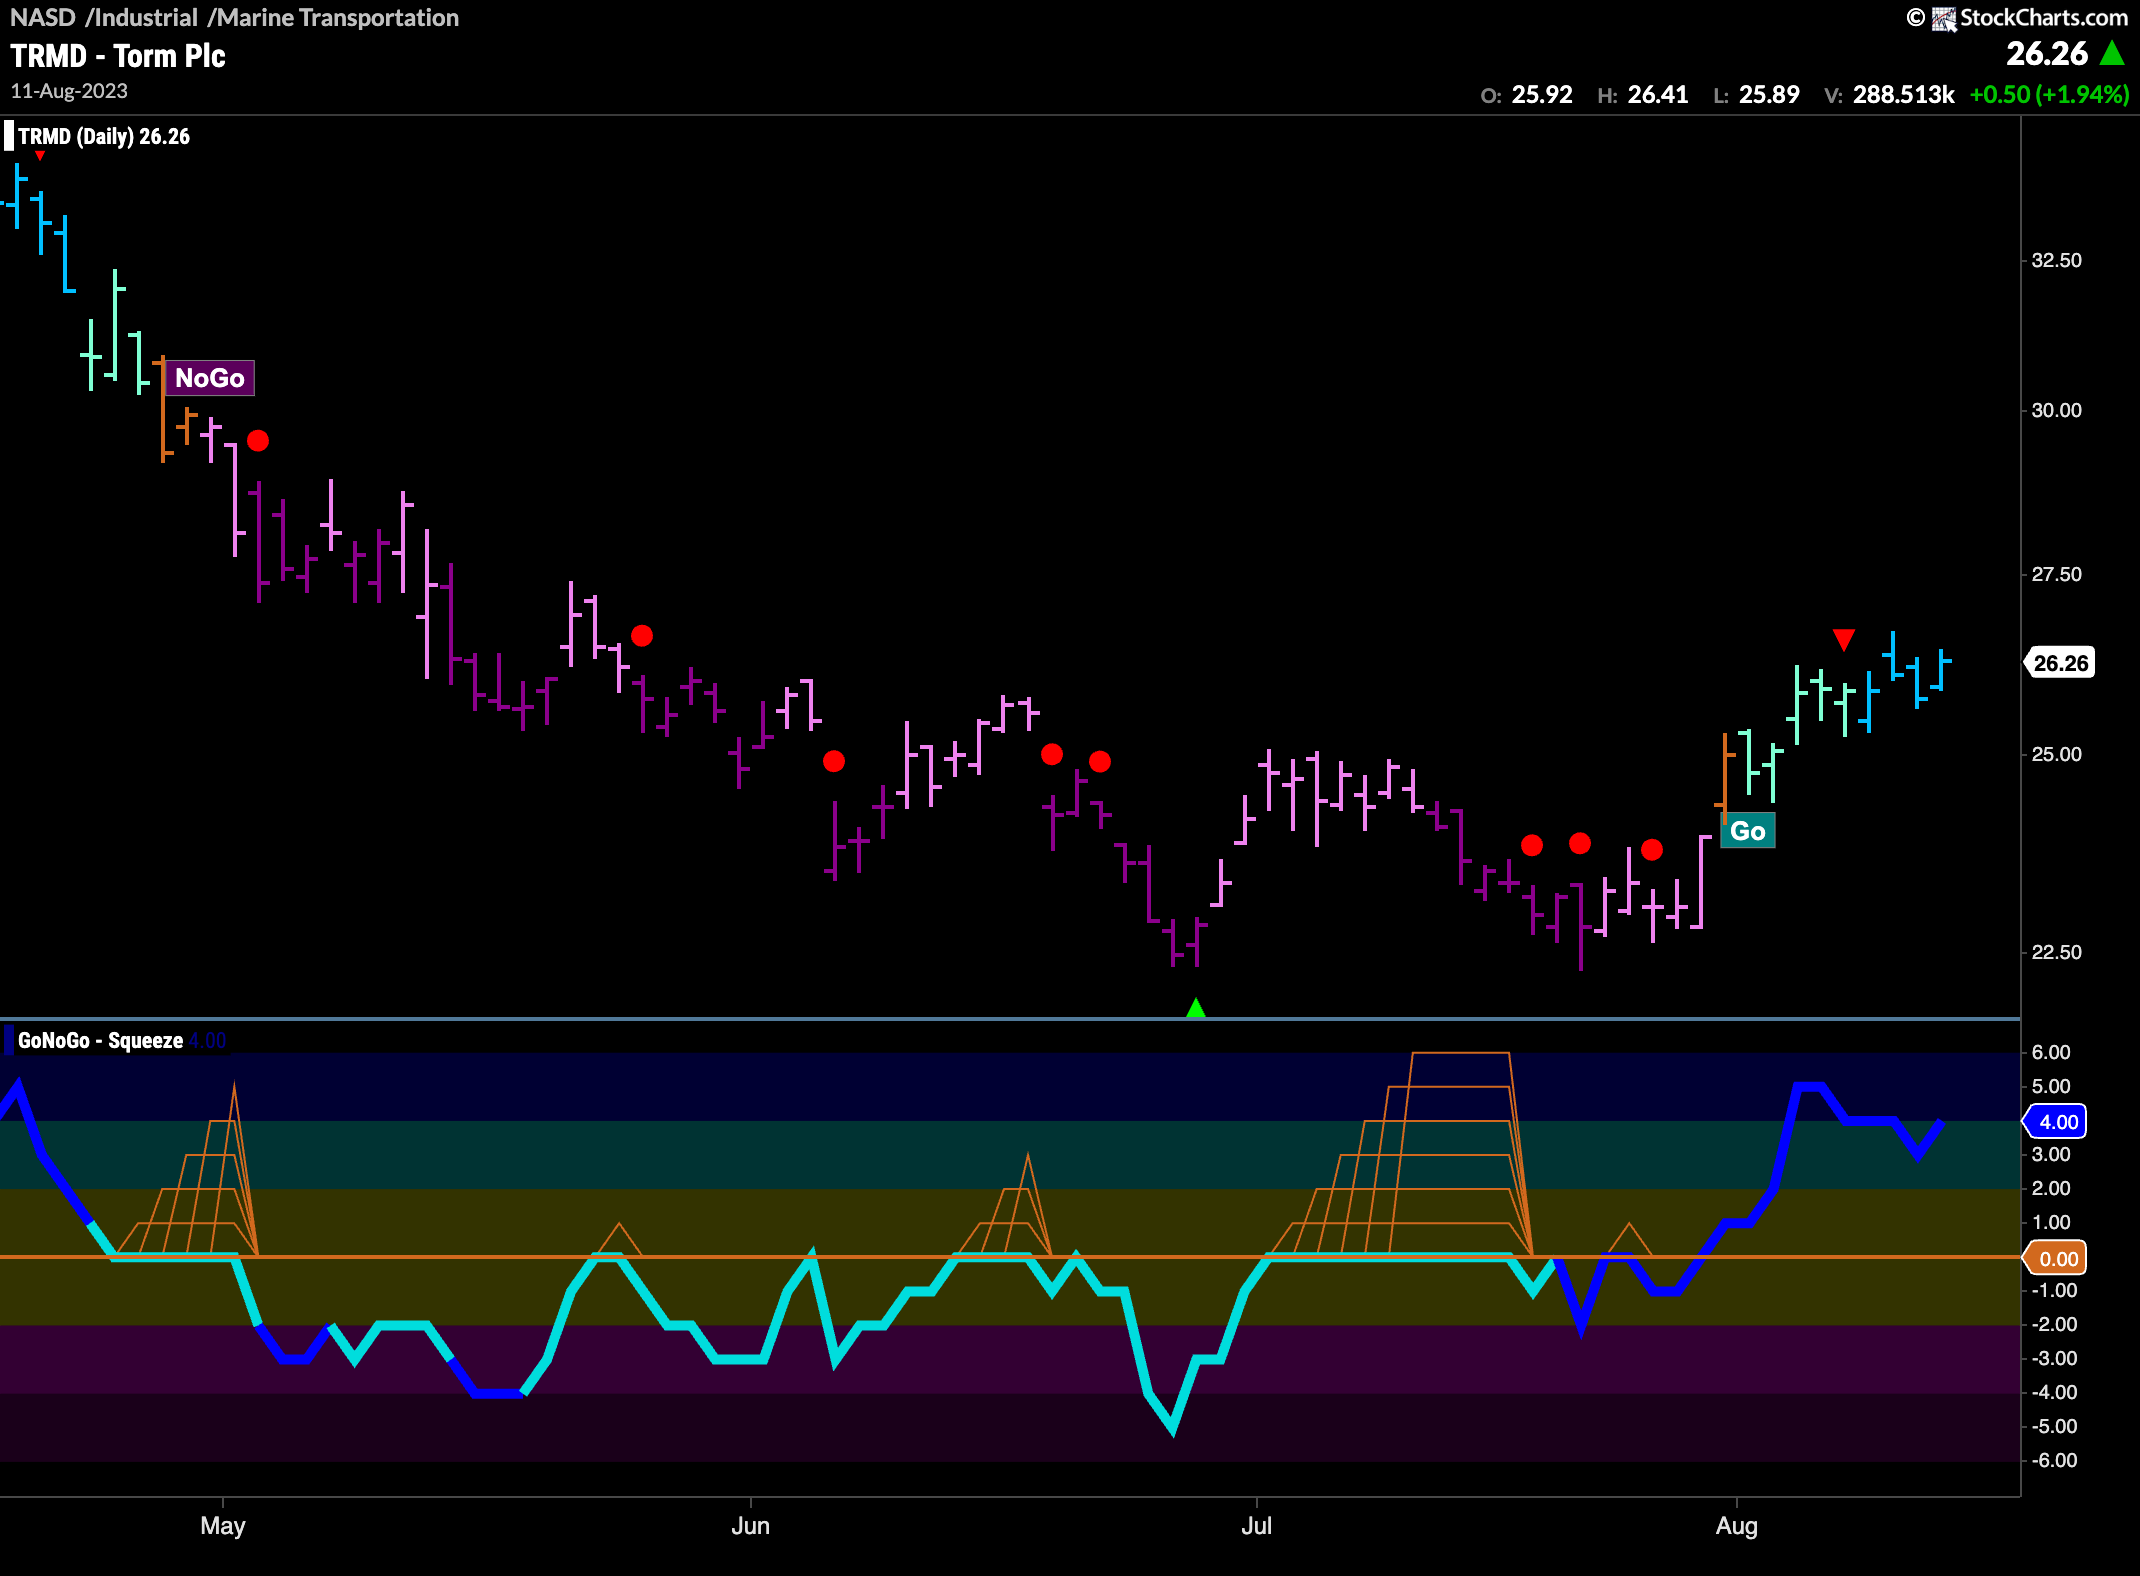
The chart below is that of $TRMD which is a company in the marine transportation space, another that we saw was an out-performer on the industrials sub group map. This could be a nice opportunity to get in to a trend early, as it has just recently started painting “Go” bars after rallying off the lows. GoNoGo Oscillator has also been in positive territory since breaking above the zero line in confirmation of the new “Go” trend. Volume has also been heavy for the entire move, showing market confirmation as well.
