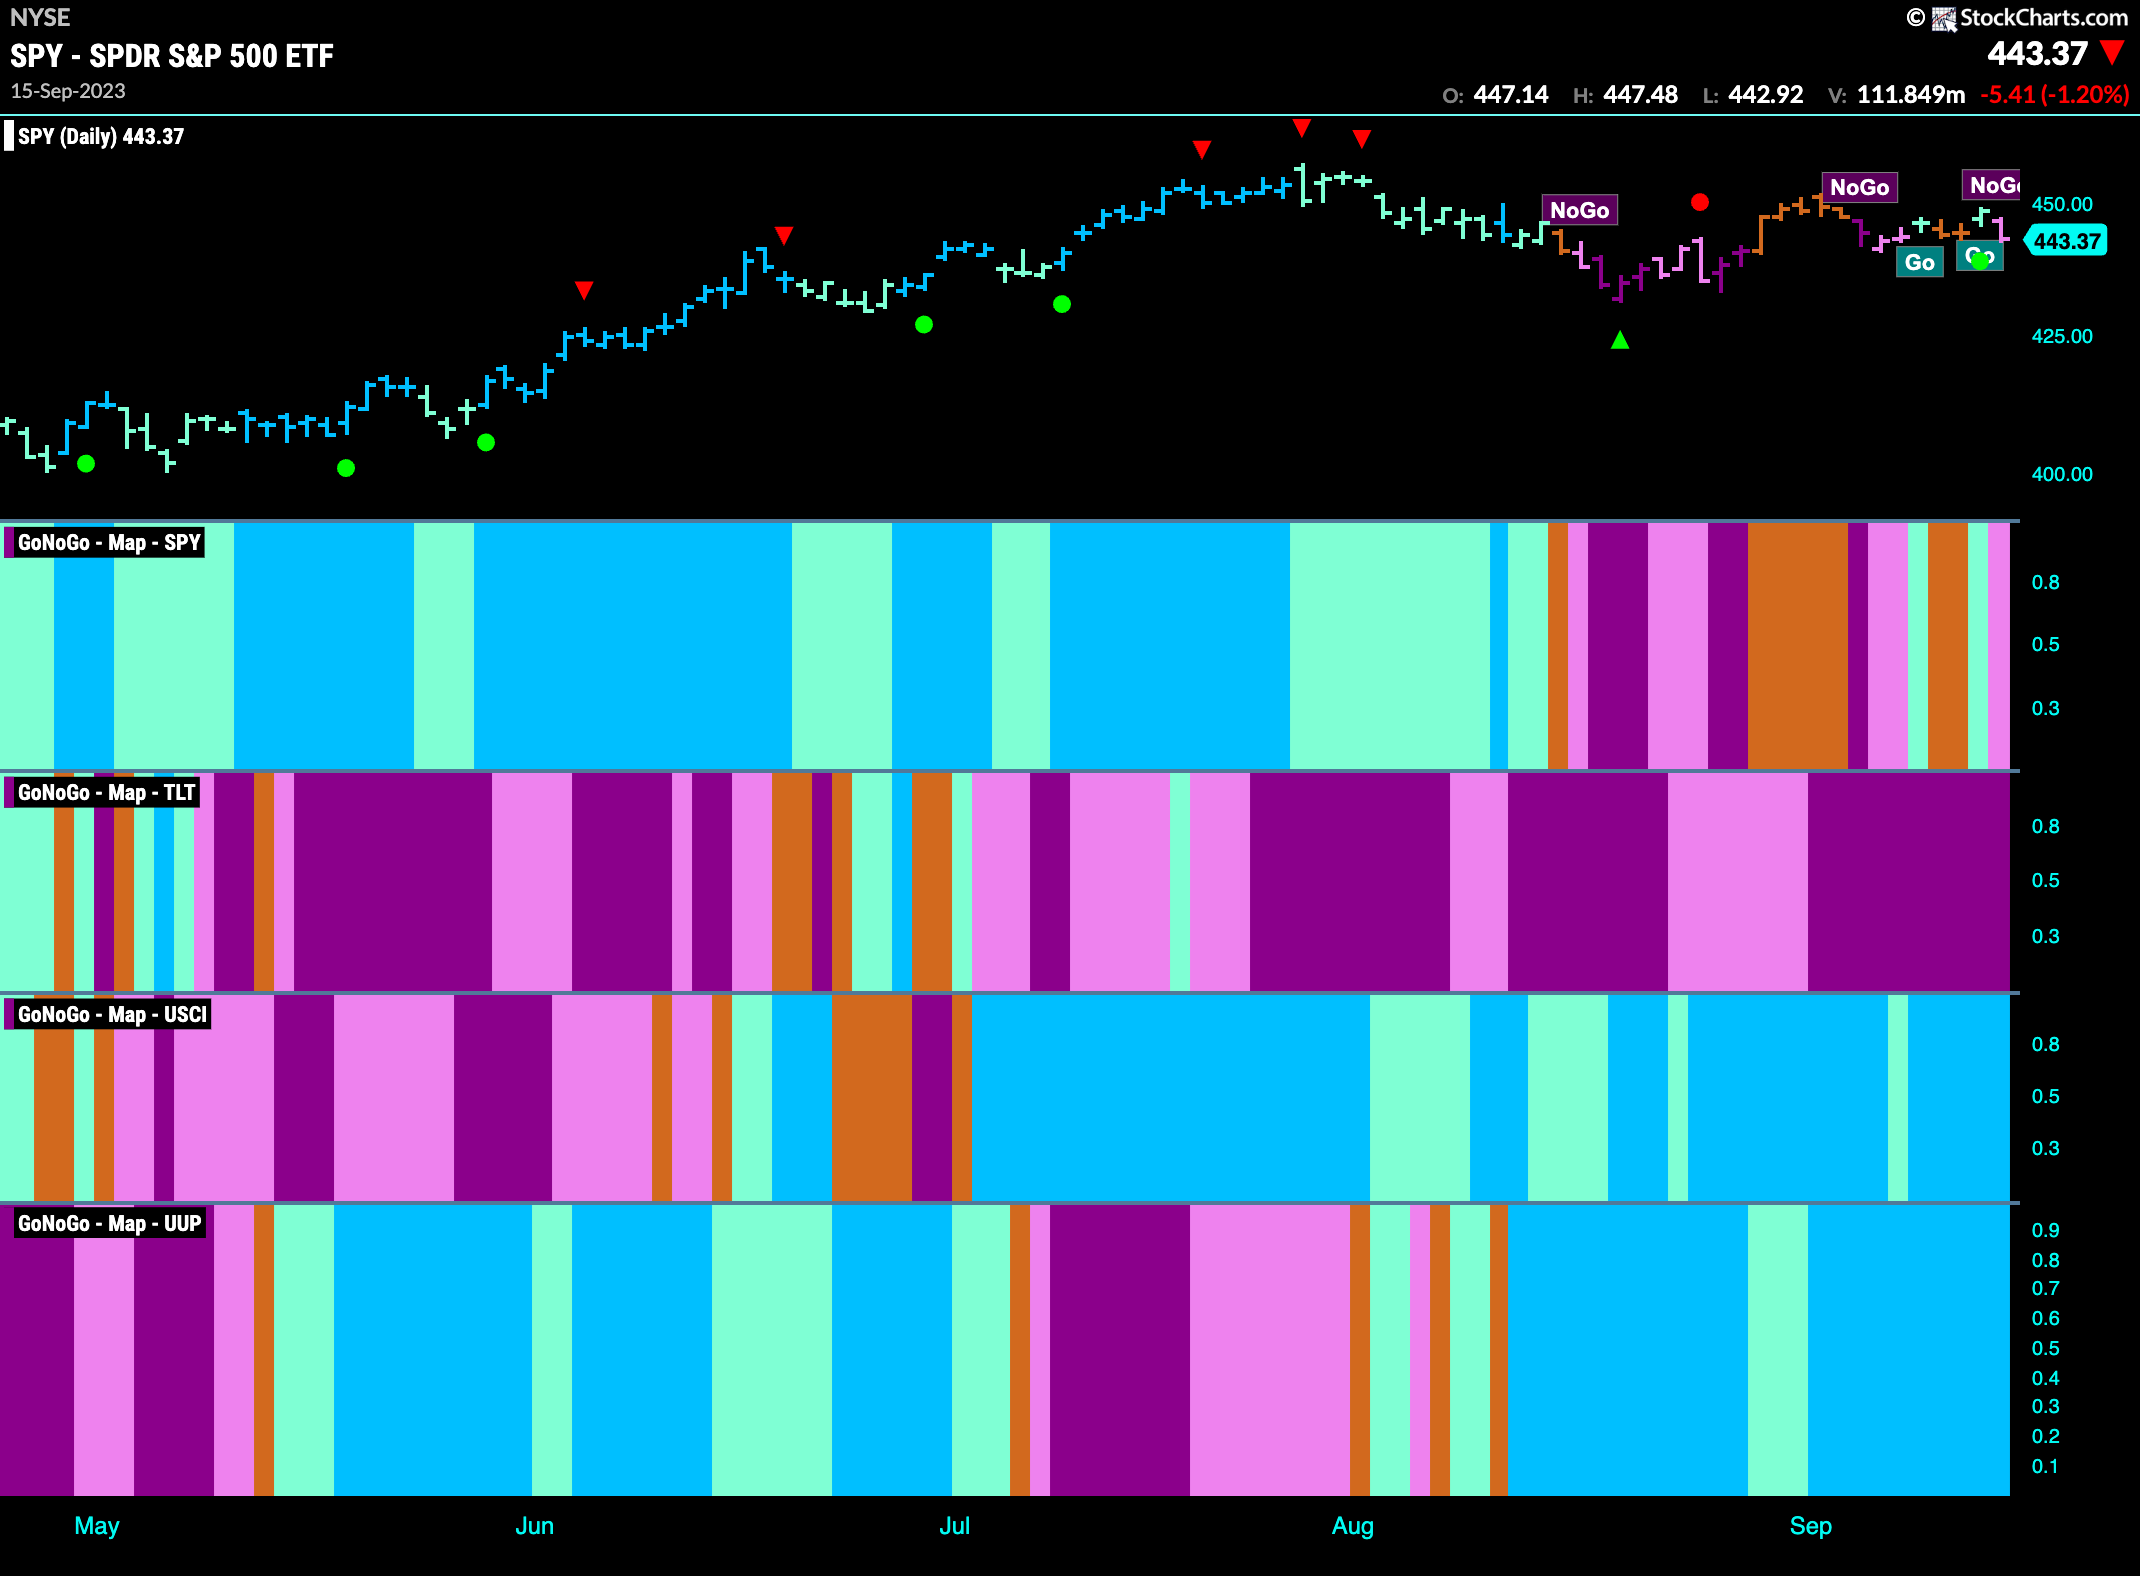
Good morning and welcome to this week’s Flight Path. Chop abounds this past week as we saw GoNoGo Trend move from aqua “Go” colors to amber “Go Fish” and finally a pink “NoGo” bar to end the week for U.S. equities. We saw the trends for the other major markets remain in place this week as treasury bond prices painted strong “NoGo” bars, commodities held on to a strong “Go” trend and the U.S. dollar painted more blue “Go” bars.
Choppy Conditions for Equities
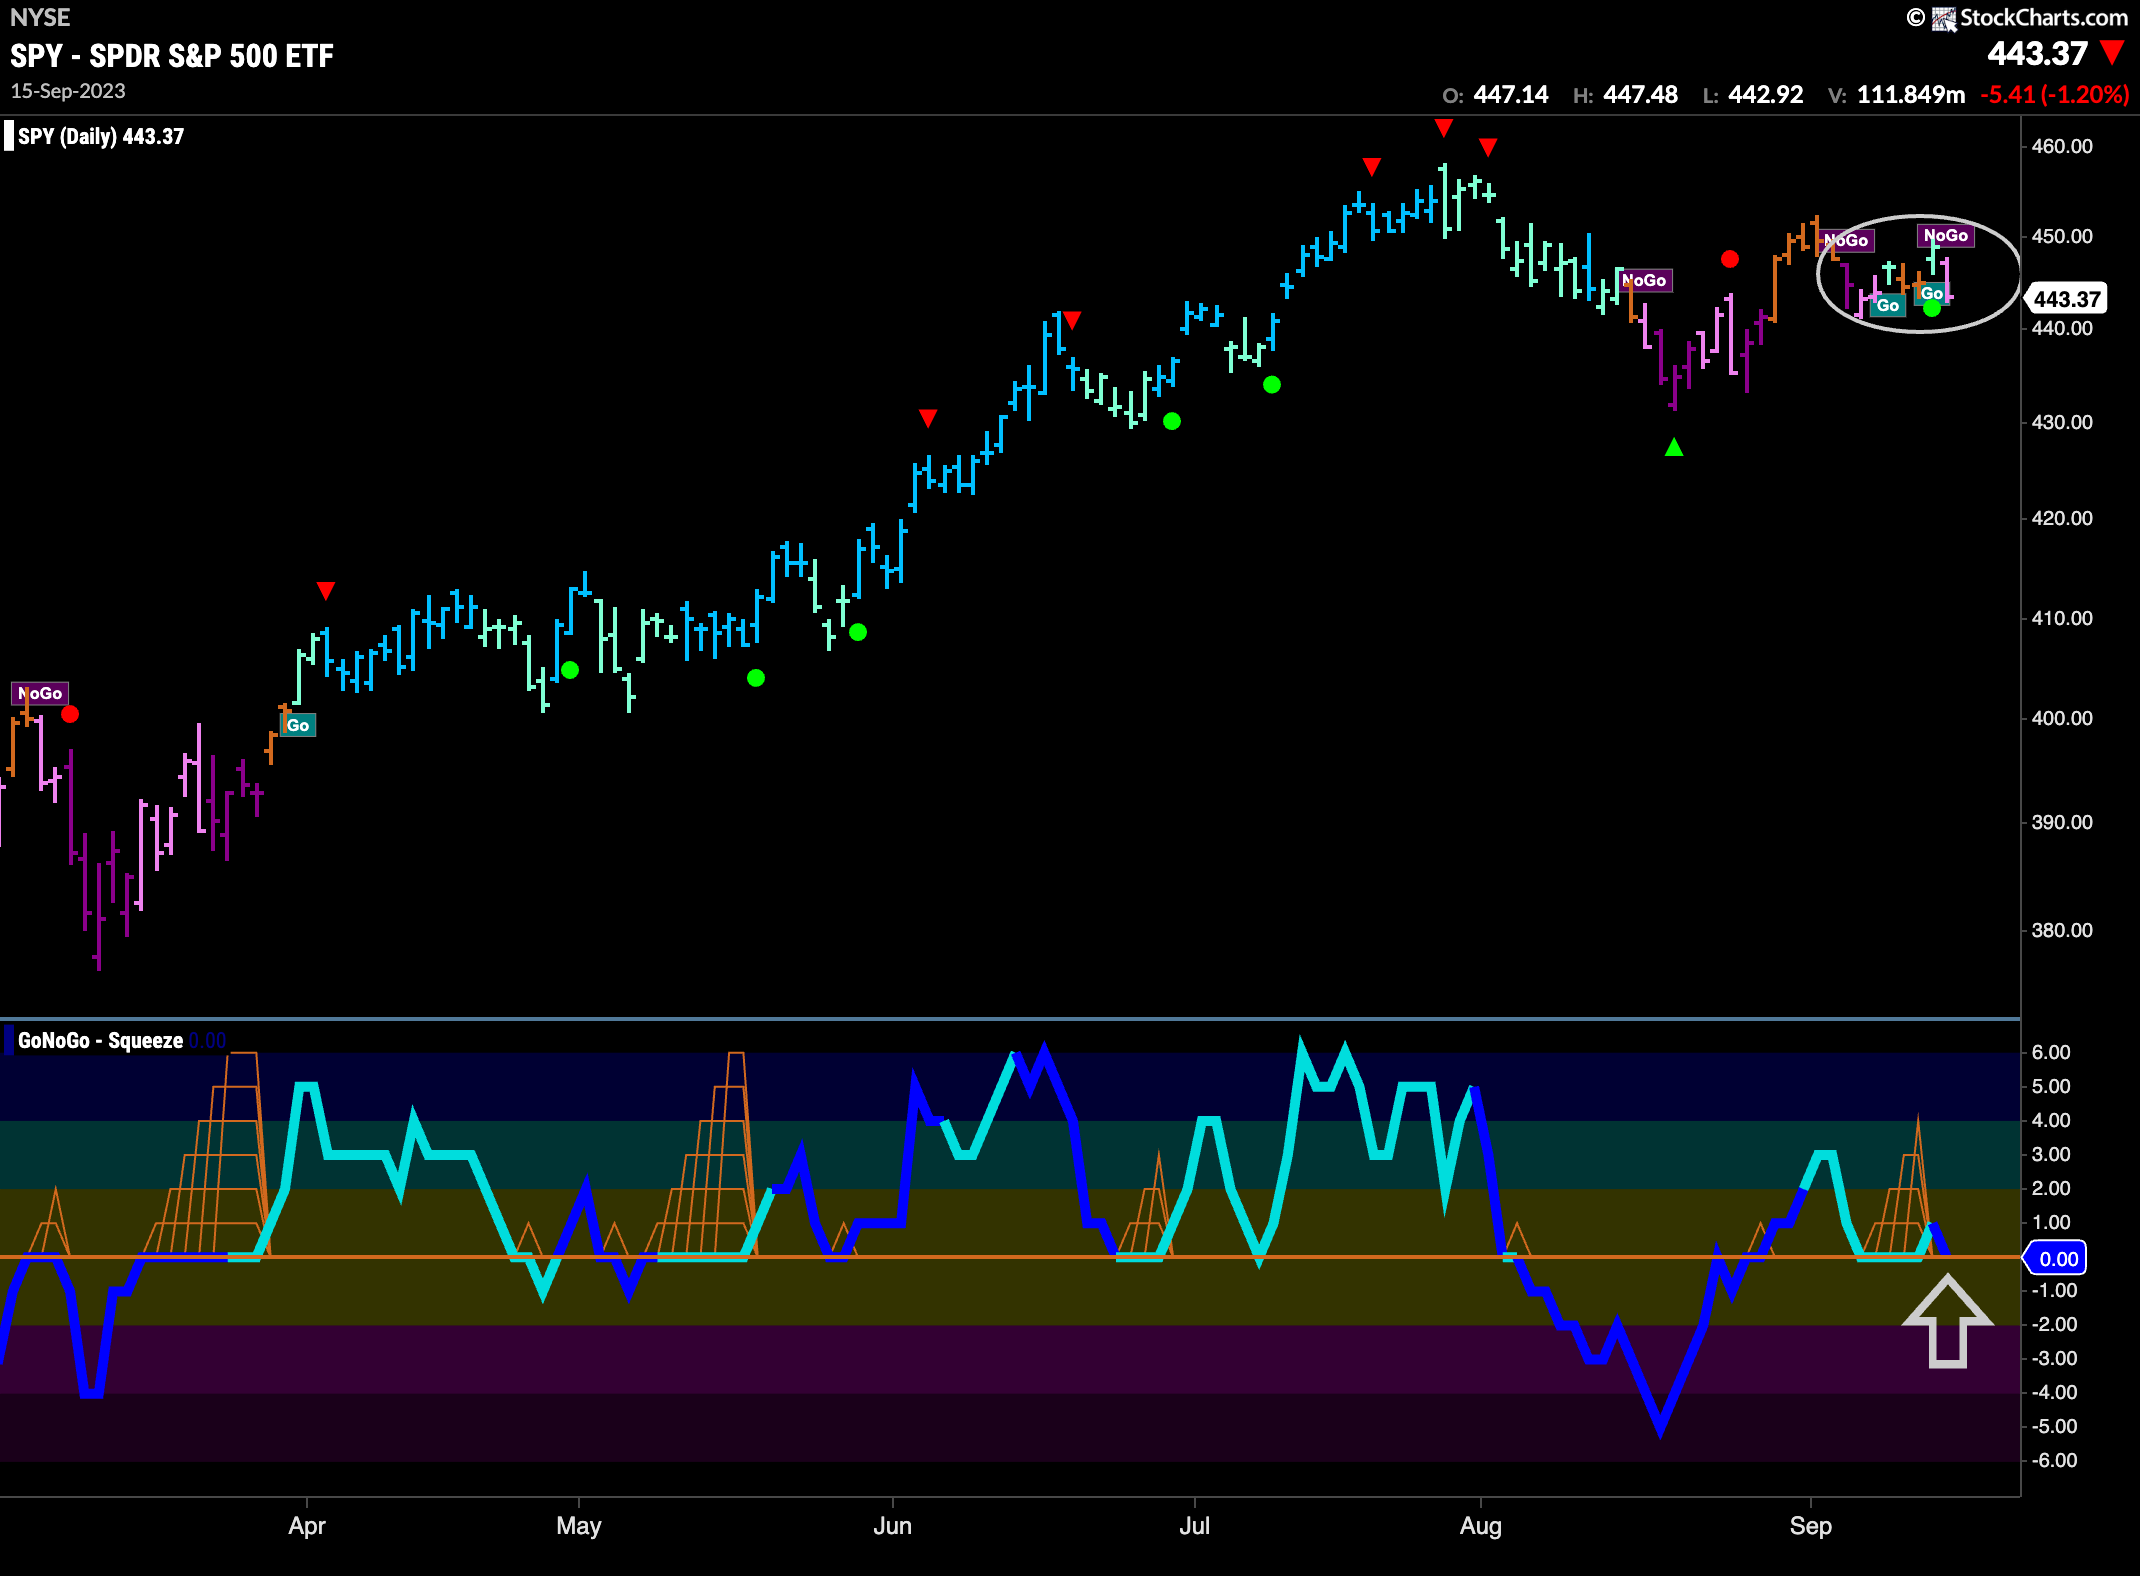
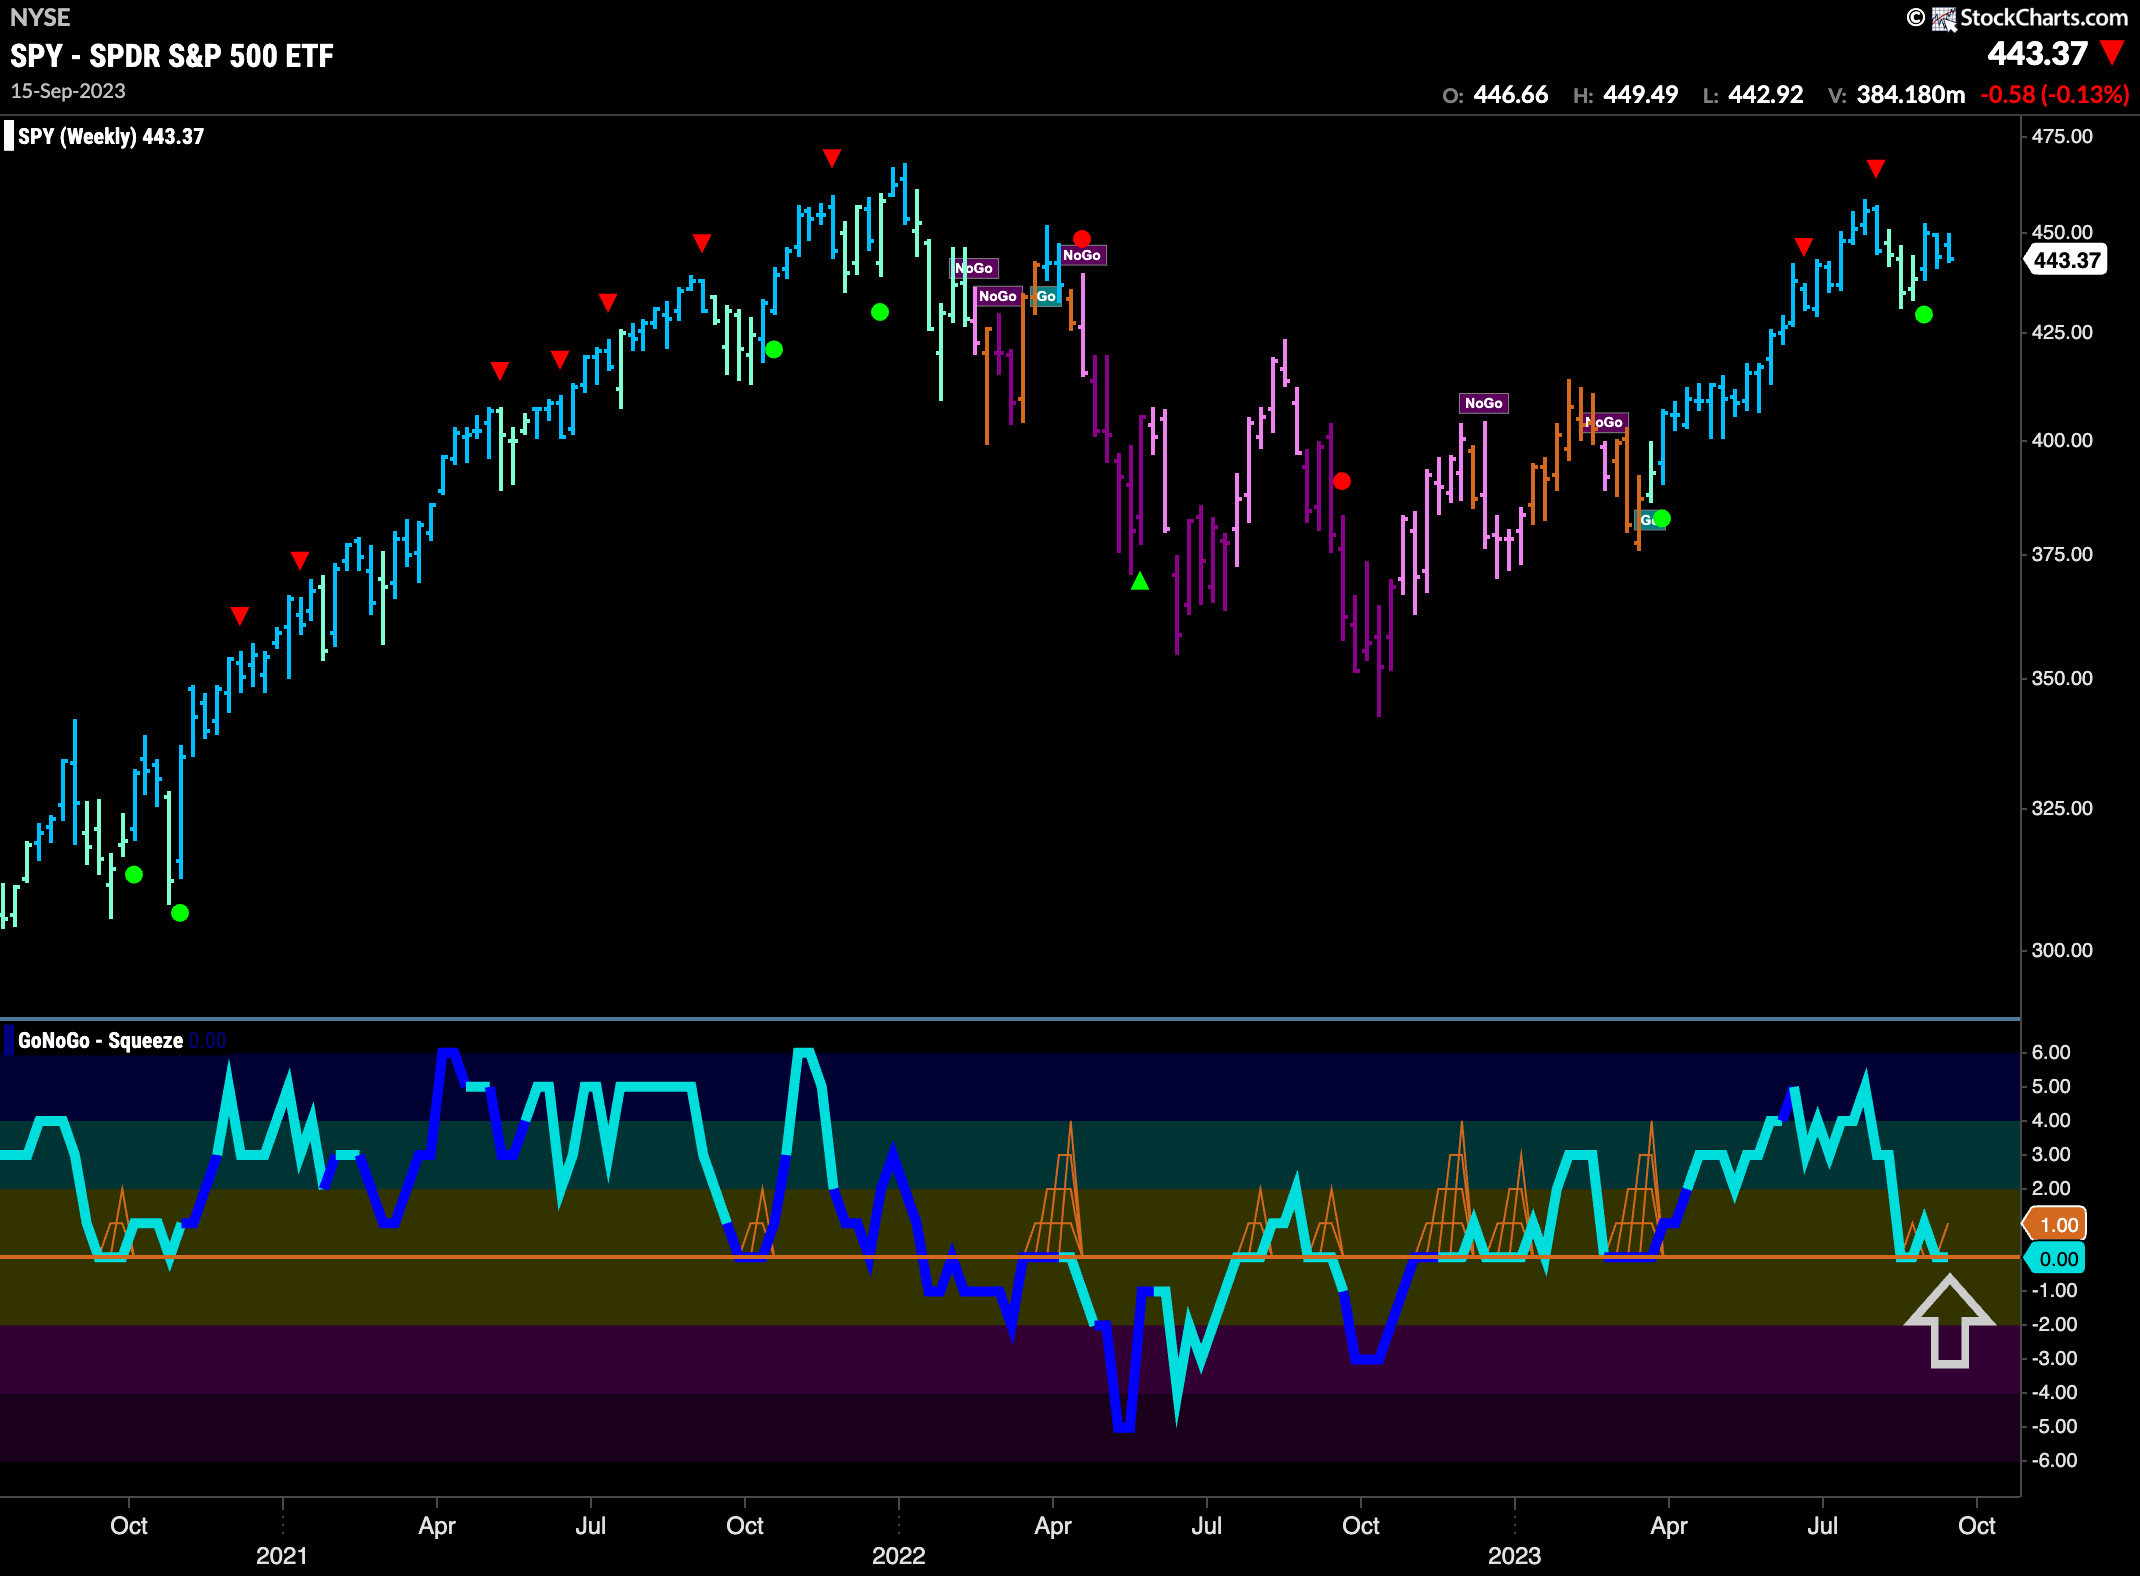
The last bar of the week saw a pink “NoGo” bar after the $SPY had cycled through aqua “Go” and amber “Go Fish” colors. This is definitely a period of uncertainty as the market makes up its mind. We see that GoNoGo Oscillator for the time being is holding the zero line for support and is right back at that level again. This will be important. If the oscillator can continue to find support at zero that would be a positive for price.
The longer term weekly chart remains in a “Go” trend. Although price recently failed at prior highs we can see that another higher low has been set. With the last few weeks allowing the GoNoGo Trend to paint strong blue bars we can say that the larger time frame trend remains in place. Turning our eye to the oscillator in the lower panel, we can see that it is testing the zero line from above. We will watch to see if it can find support at this level and that would give price some help in its efforts to remain in trend.
Treasury Rates Continue to Threaten New Highs
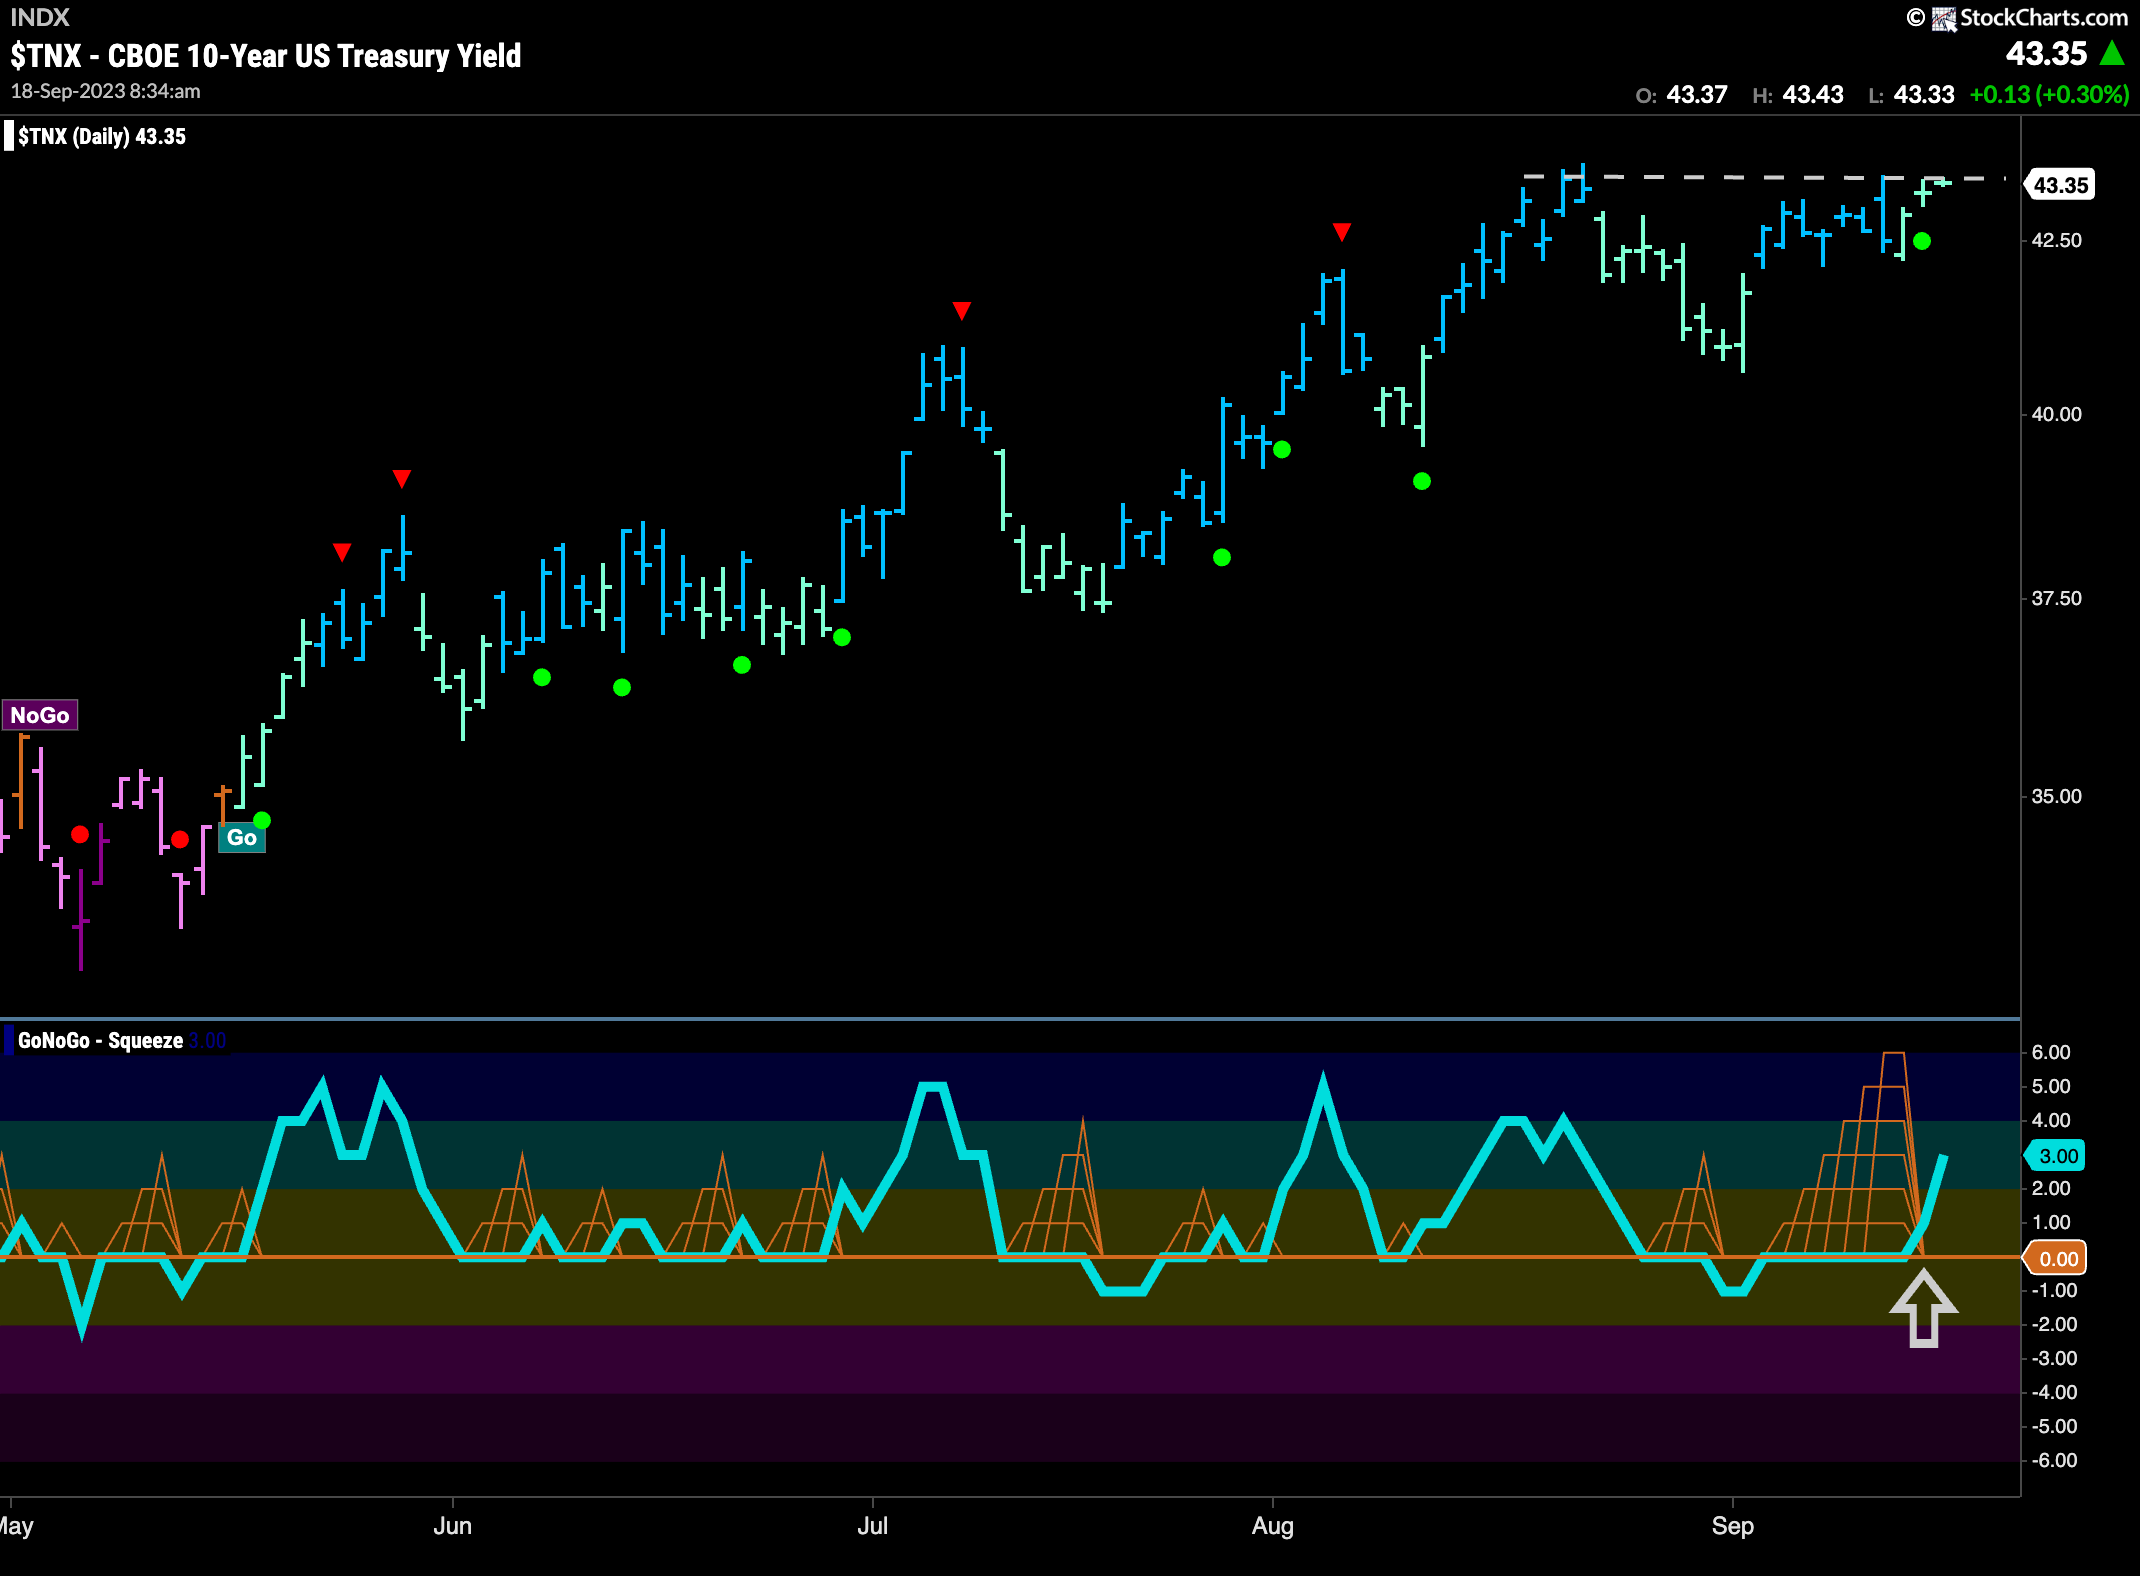
Treasury bond rallied again this week as price butts up against resistance from prior highs. Any further gains and we would be able to say that the trend had put in a new higher high. GoNoGo Oscillator in the lower panel has broken out of a Max GoNoGo Squeeze into positive territory and that is giving price the push it needs to make another attack on that new high. With the oscillator still not in overbought territory there is perhaps still some room to run.
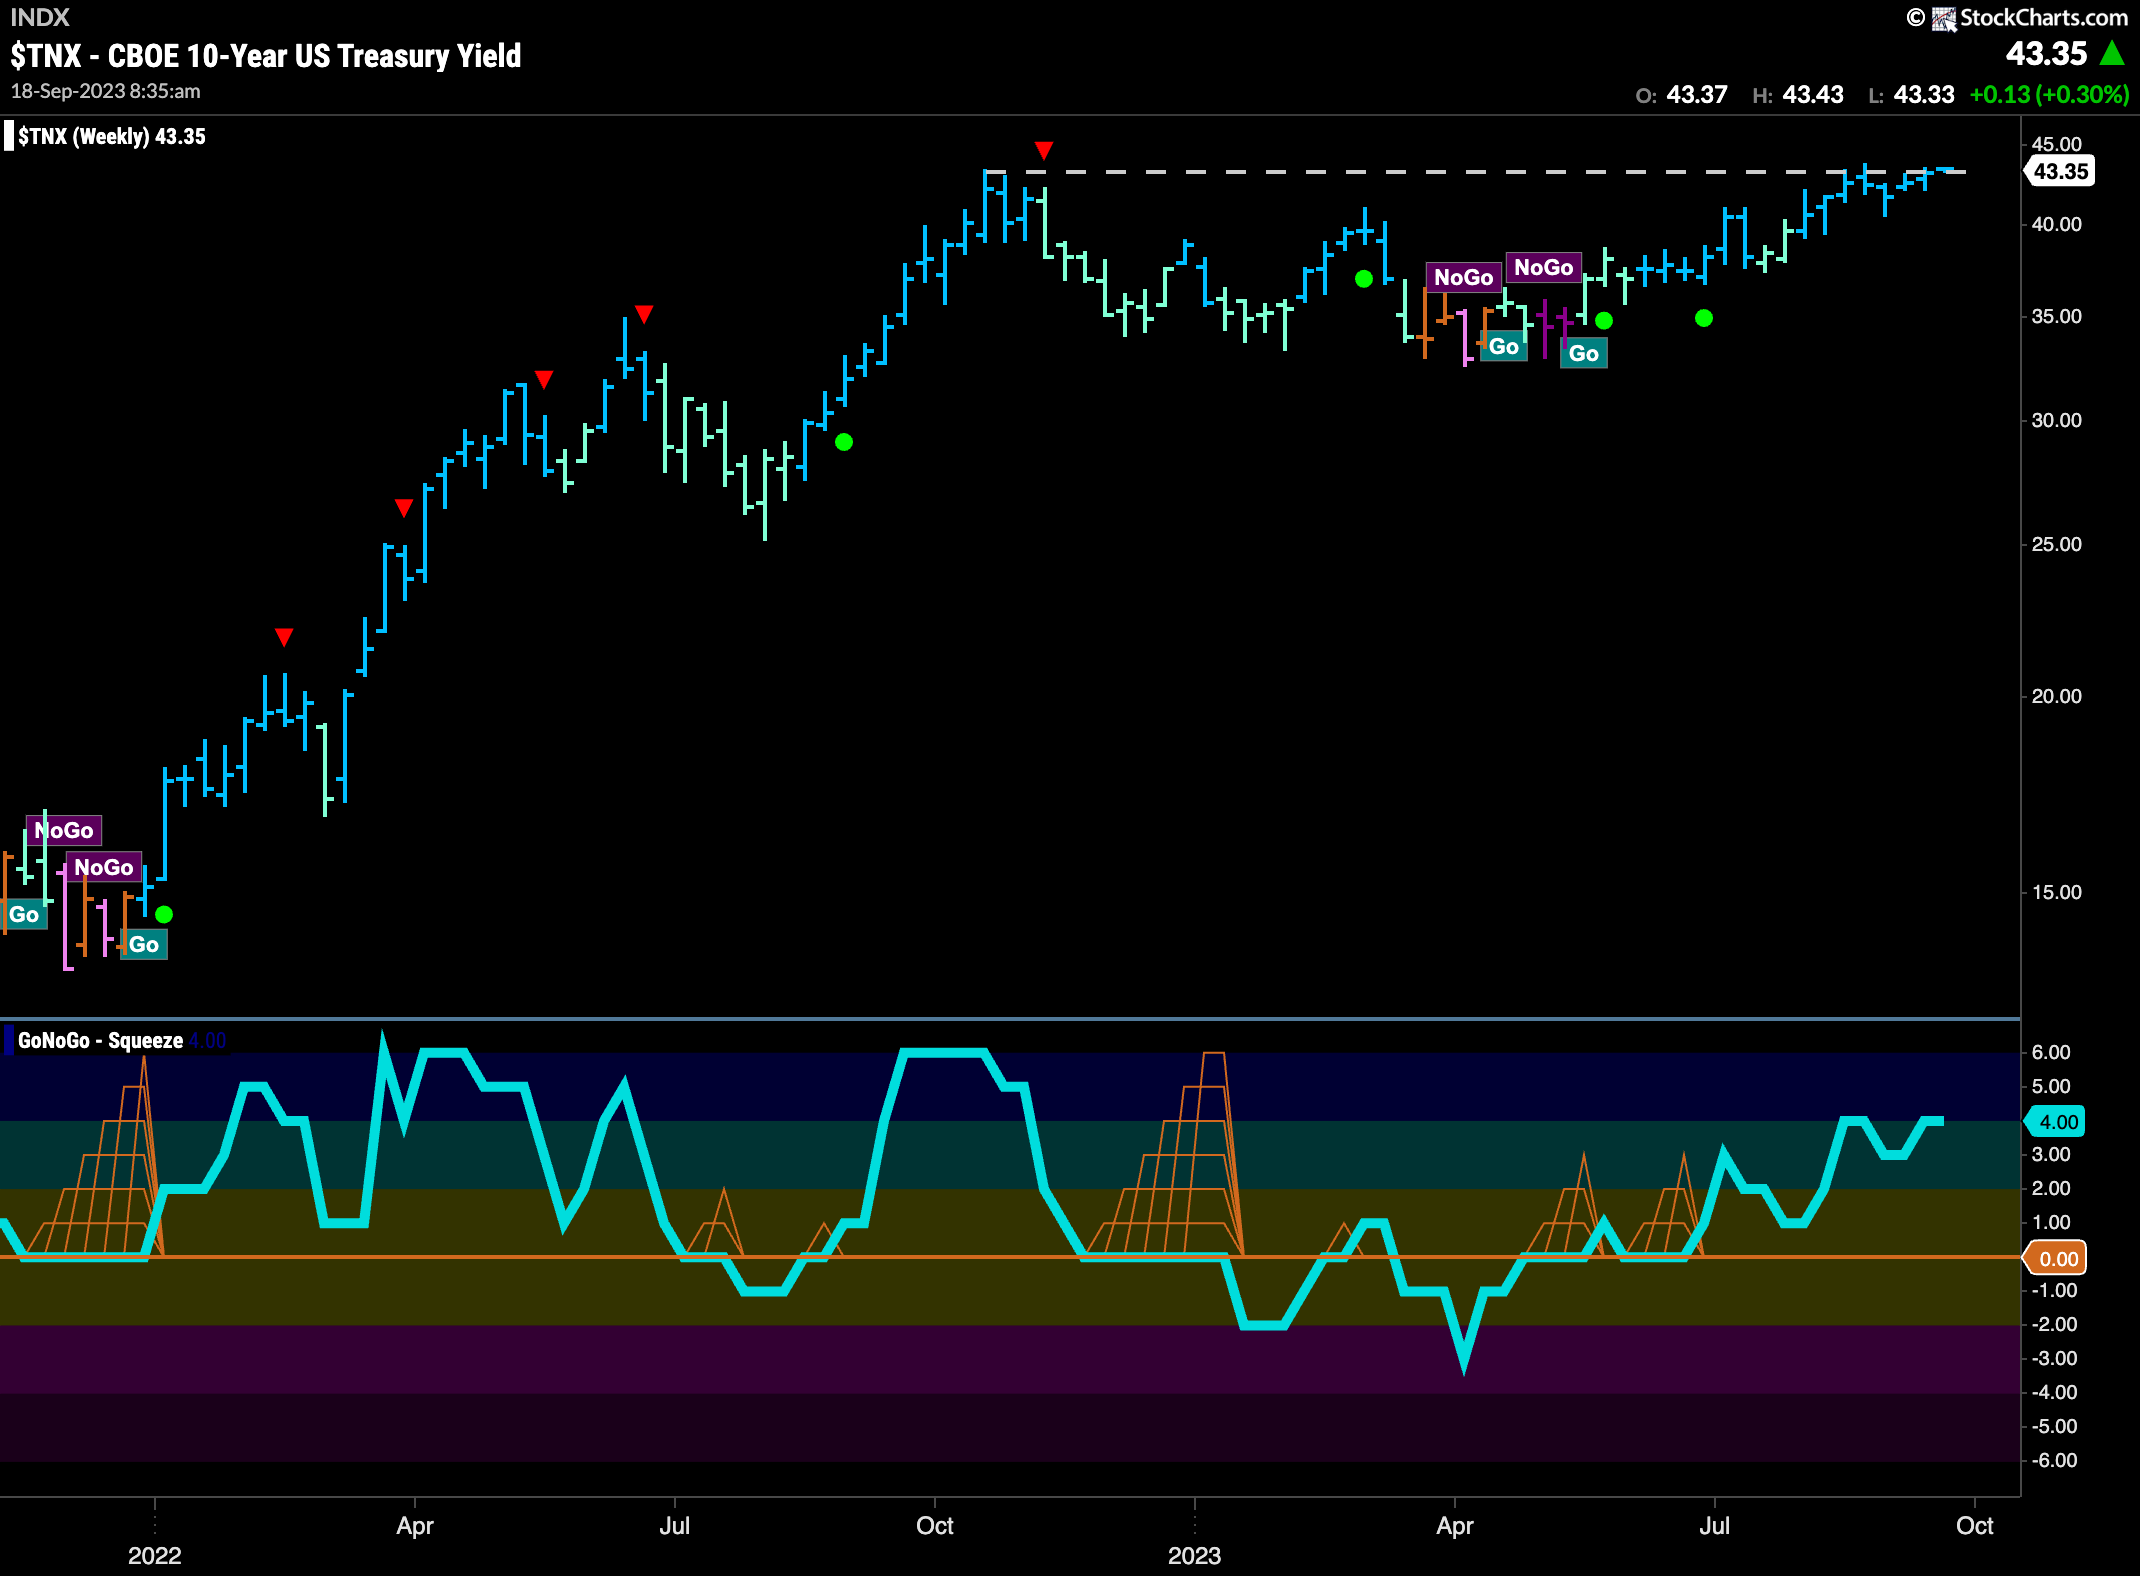
The weekly chart continues to tell us that it wont be easy to go higher as resistance is coming from almost a year ago. However, with strong “Go” bars for another week, and GoNoGo Oscillator in positive territory but not yet overbought, we will continue to pay close attention to price as it tries to break through overhead supply.
Dollar Trend Continues
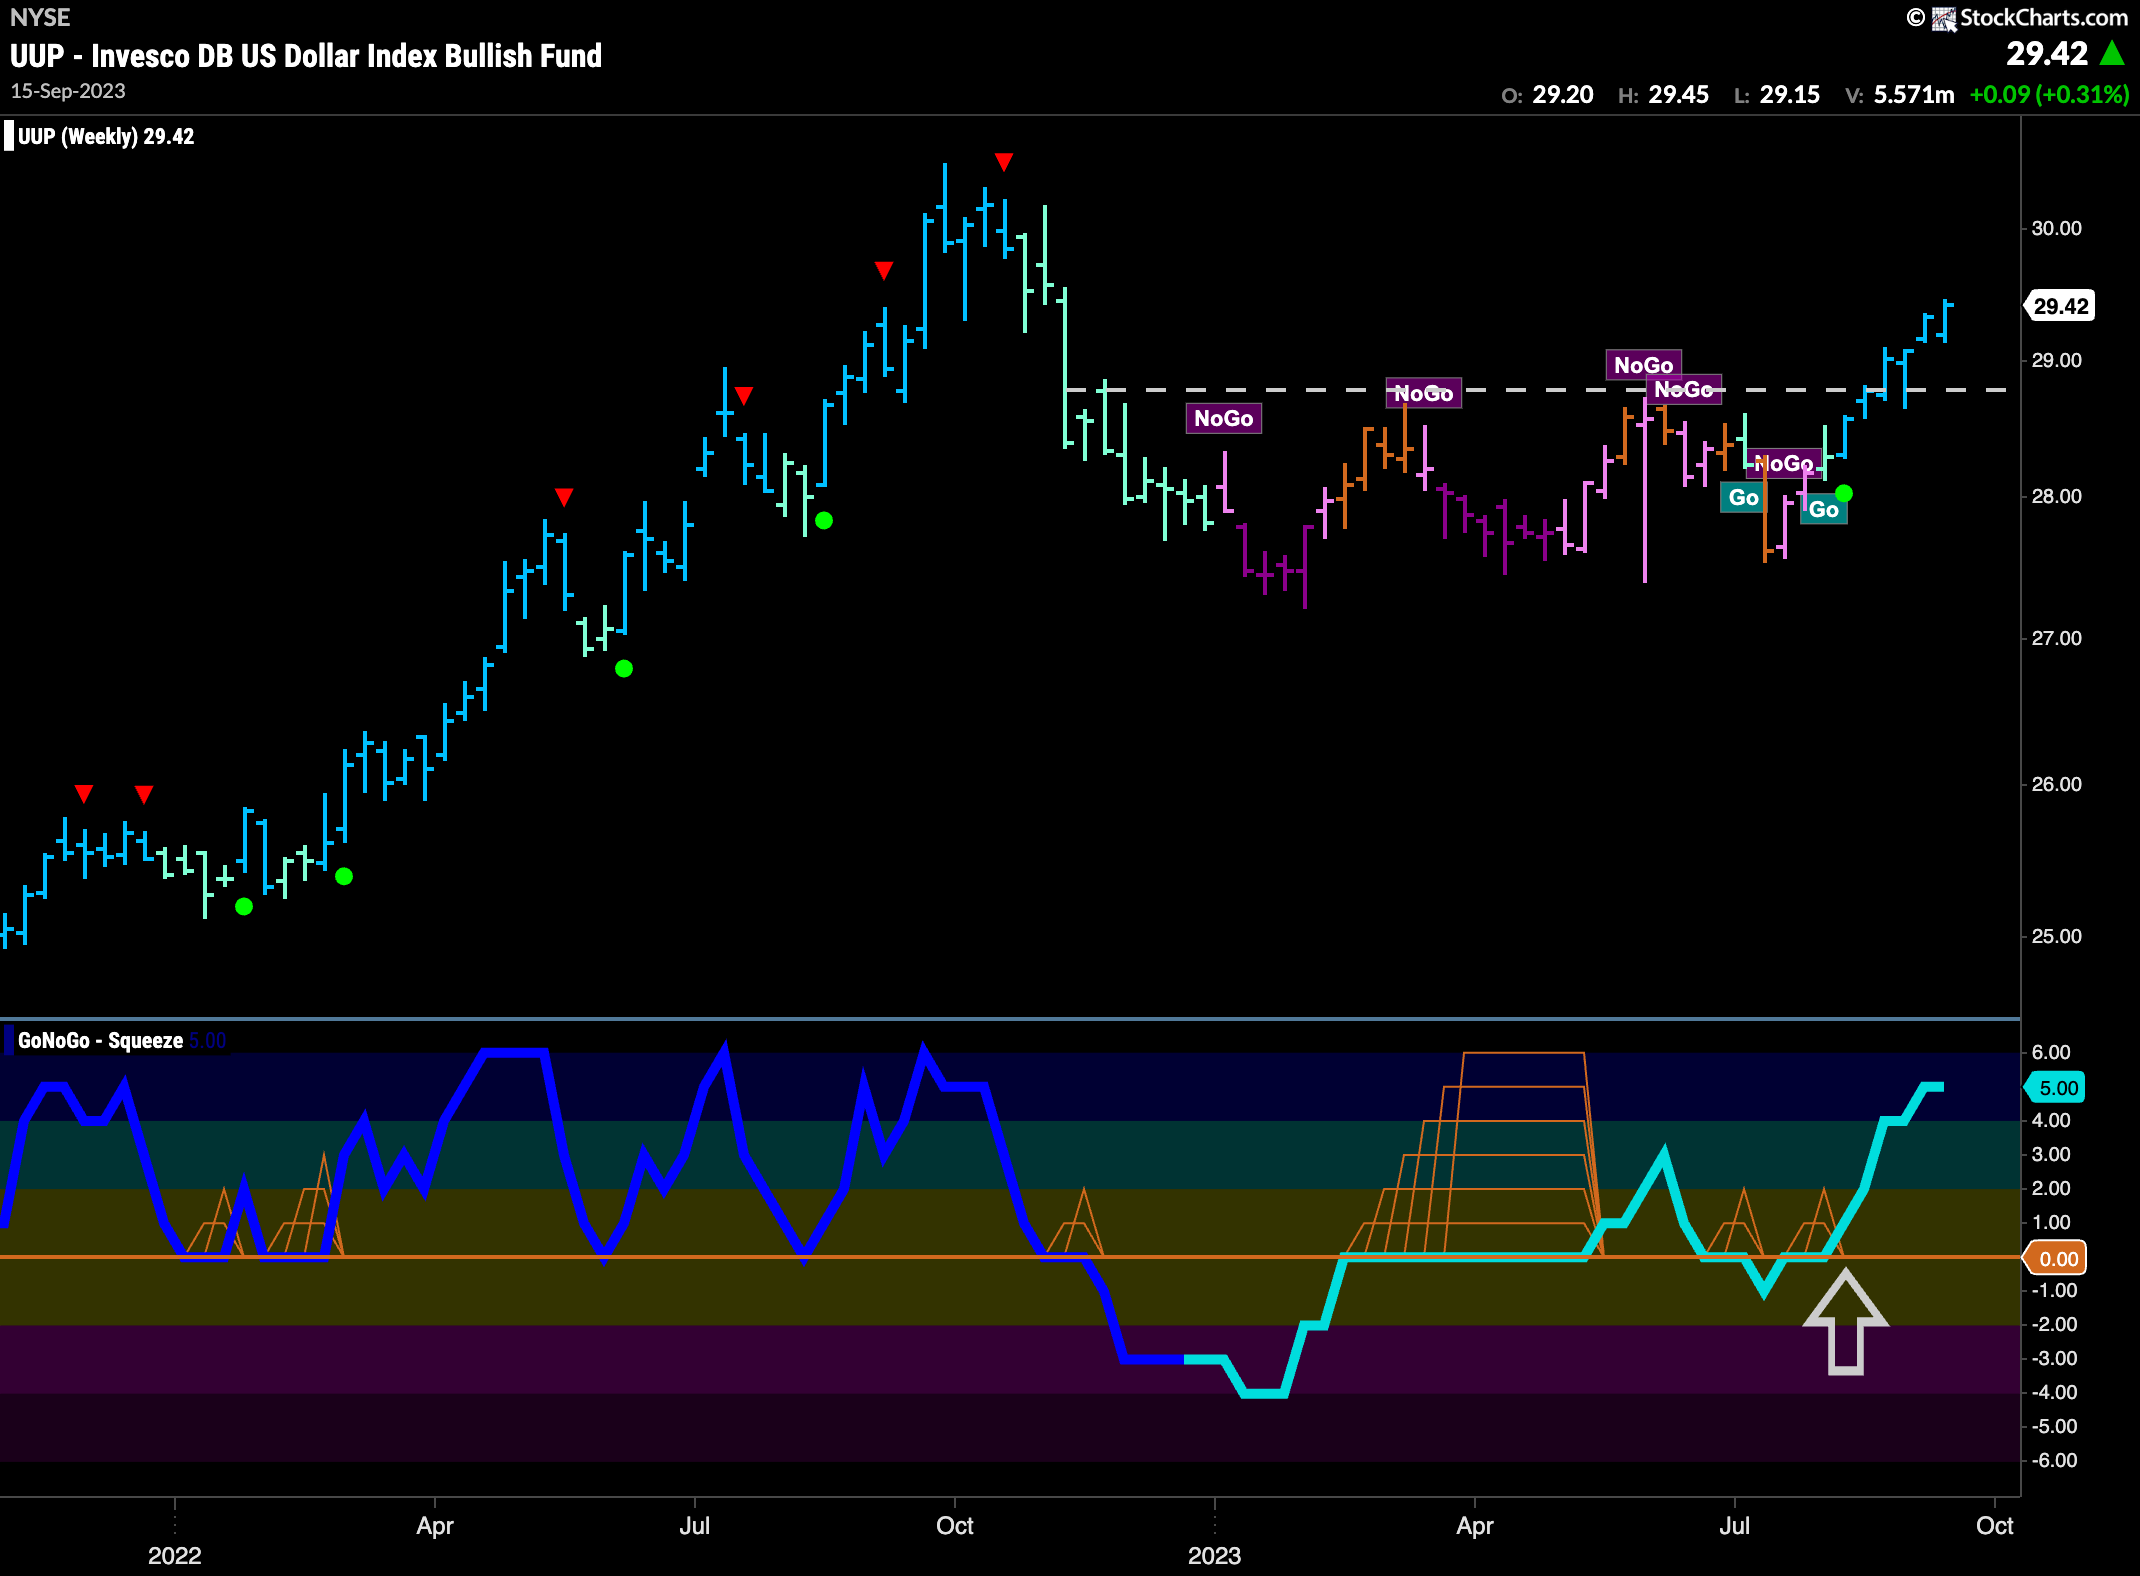
Looking at the weekly chart of the dollar we see that there is no slowing down for the greenback. Another strong blue “Go” bar as GoNoGo Trend shows that all of the evidence continues to tell us we are strongly trending. GoNoGo Oscillator since finding support at the zero line has race higher and is now entering overbought territory.
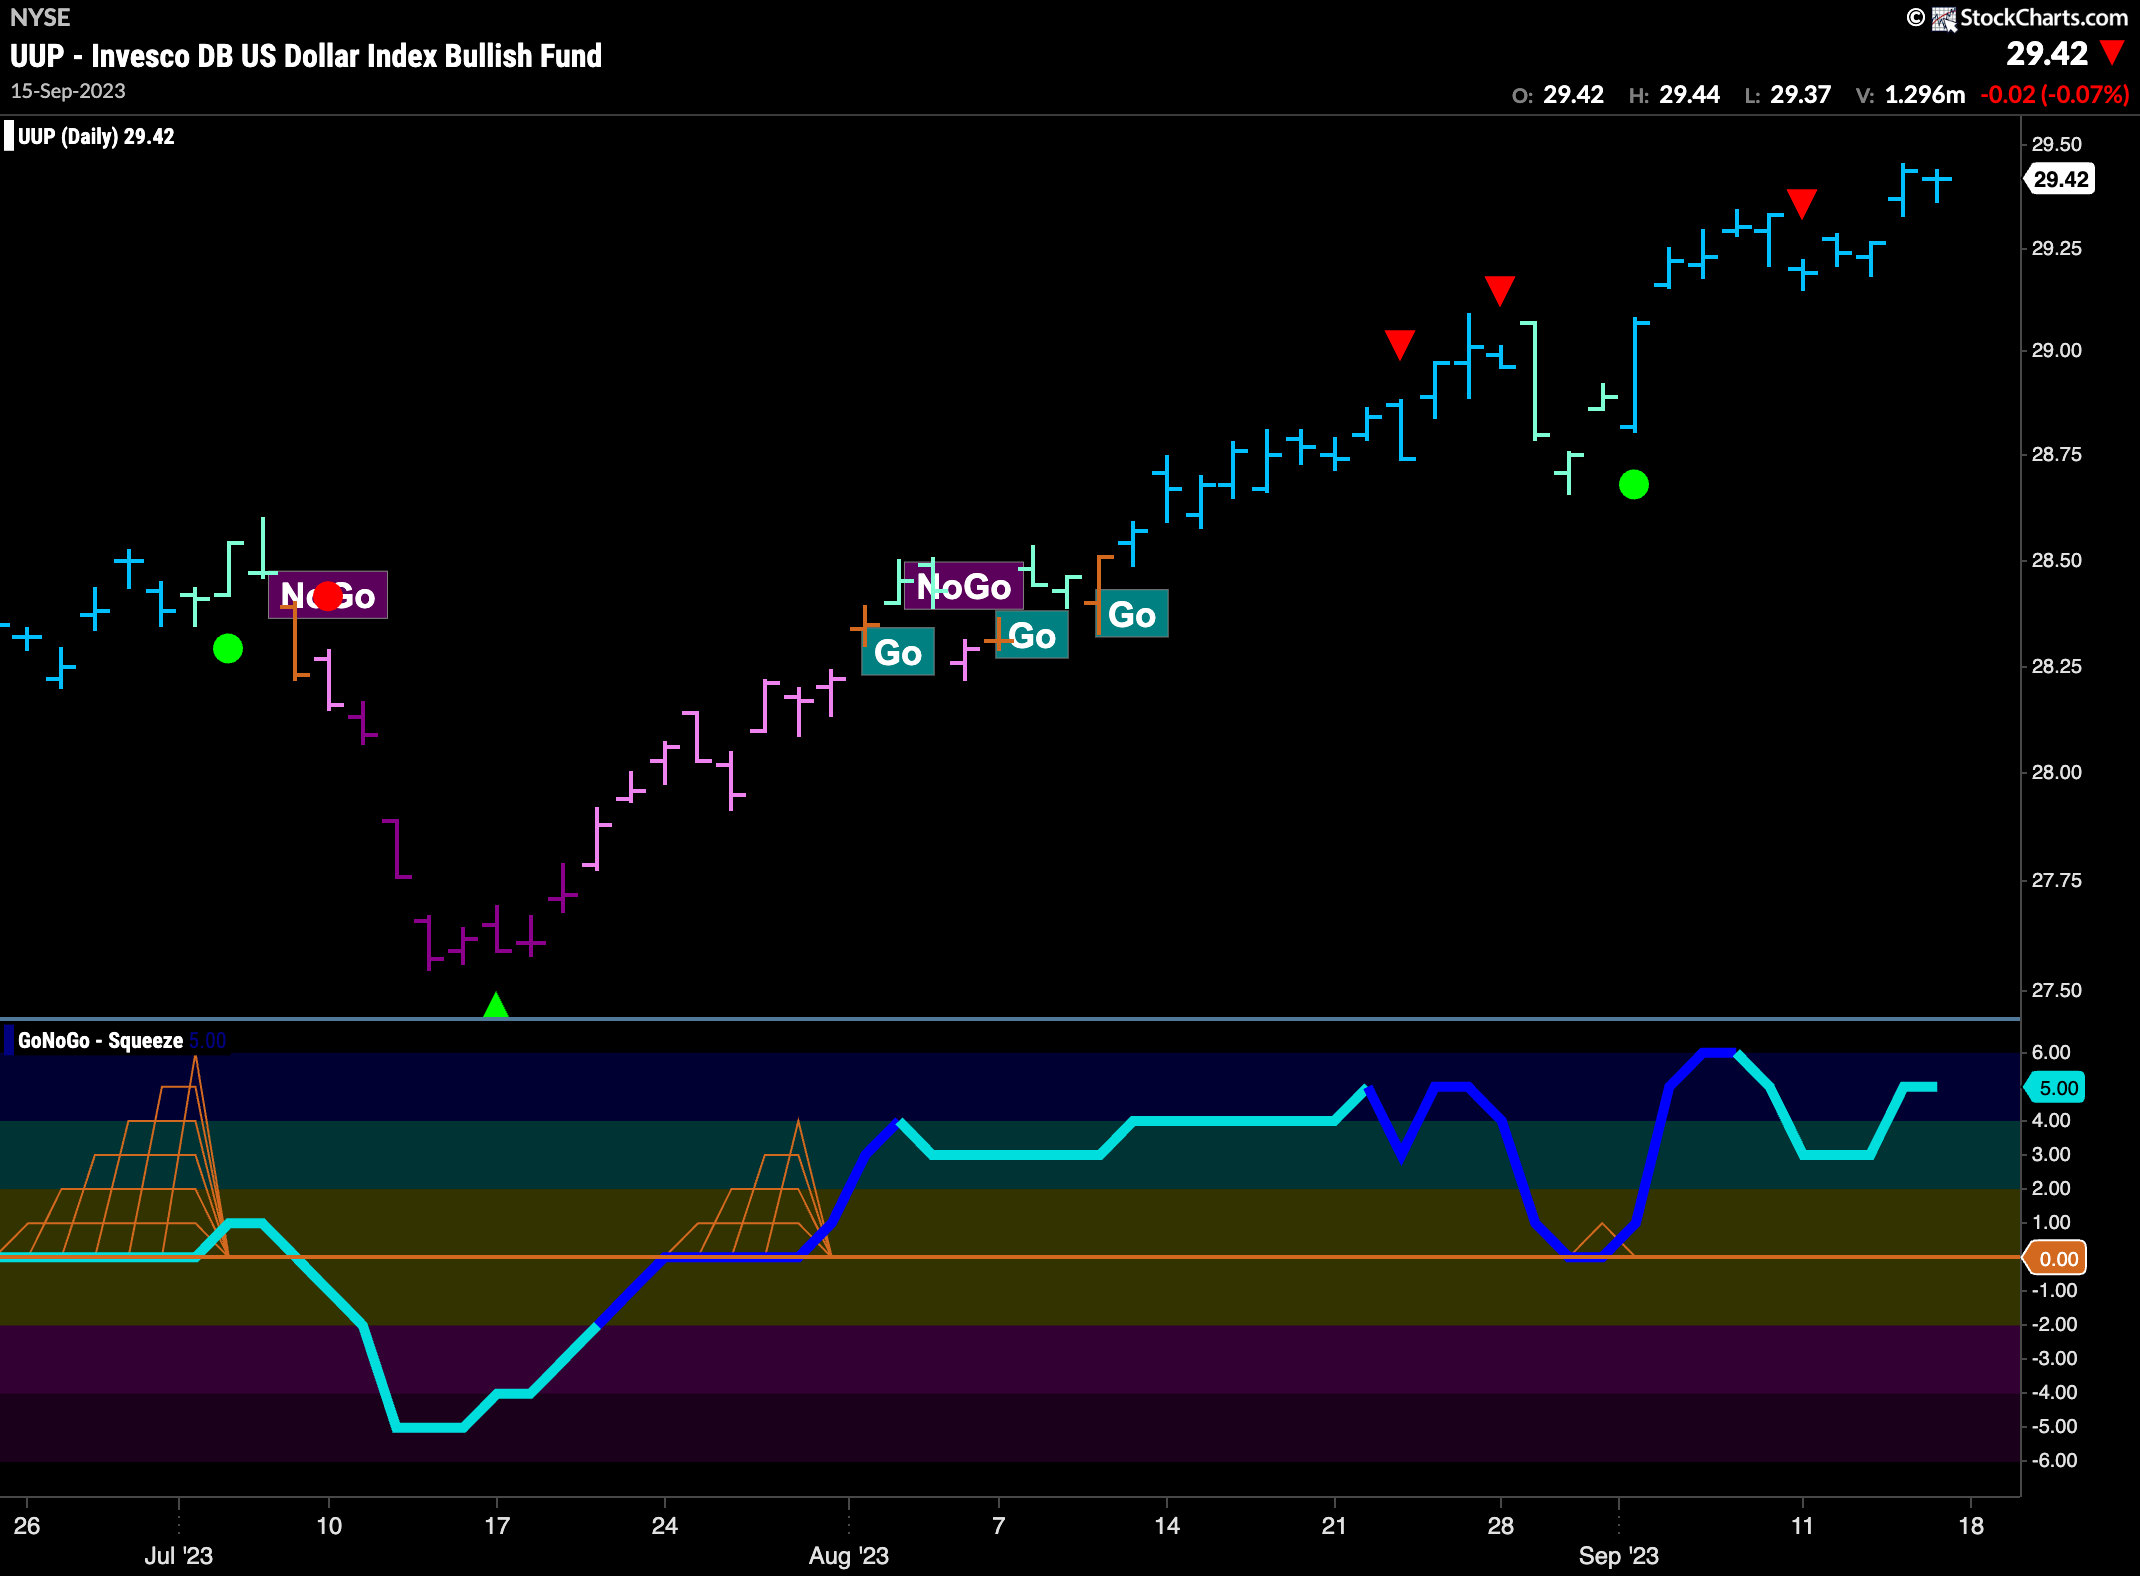
The daily chart below shows just how strong the trend is. Having found trend continuation as the oscillator bounced off zero (green circle), price has moved quickly higher and is painting strong blue “Go” bars at new highs. GoNoGo Oscillator is in positive territory but not overbought.
No Slowing Oil as it Moves Higher
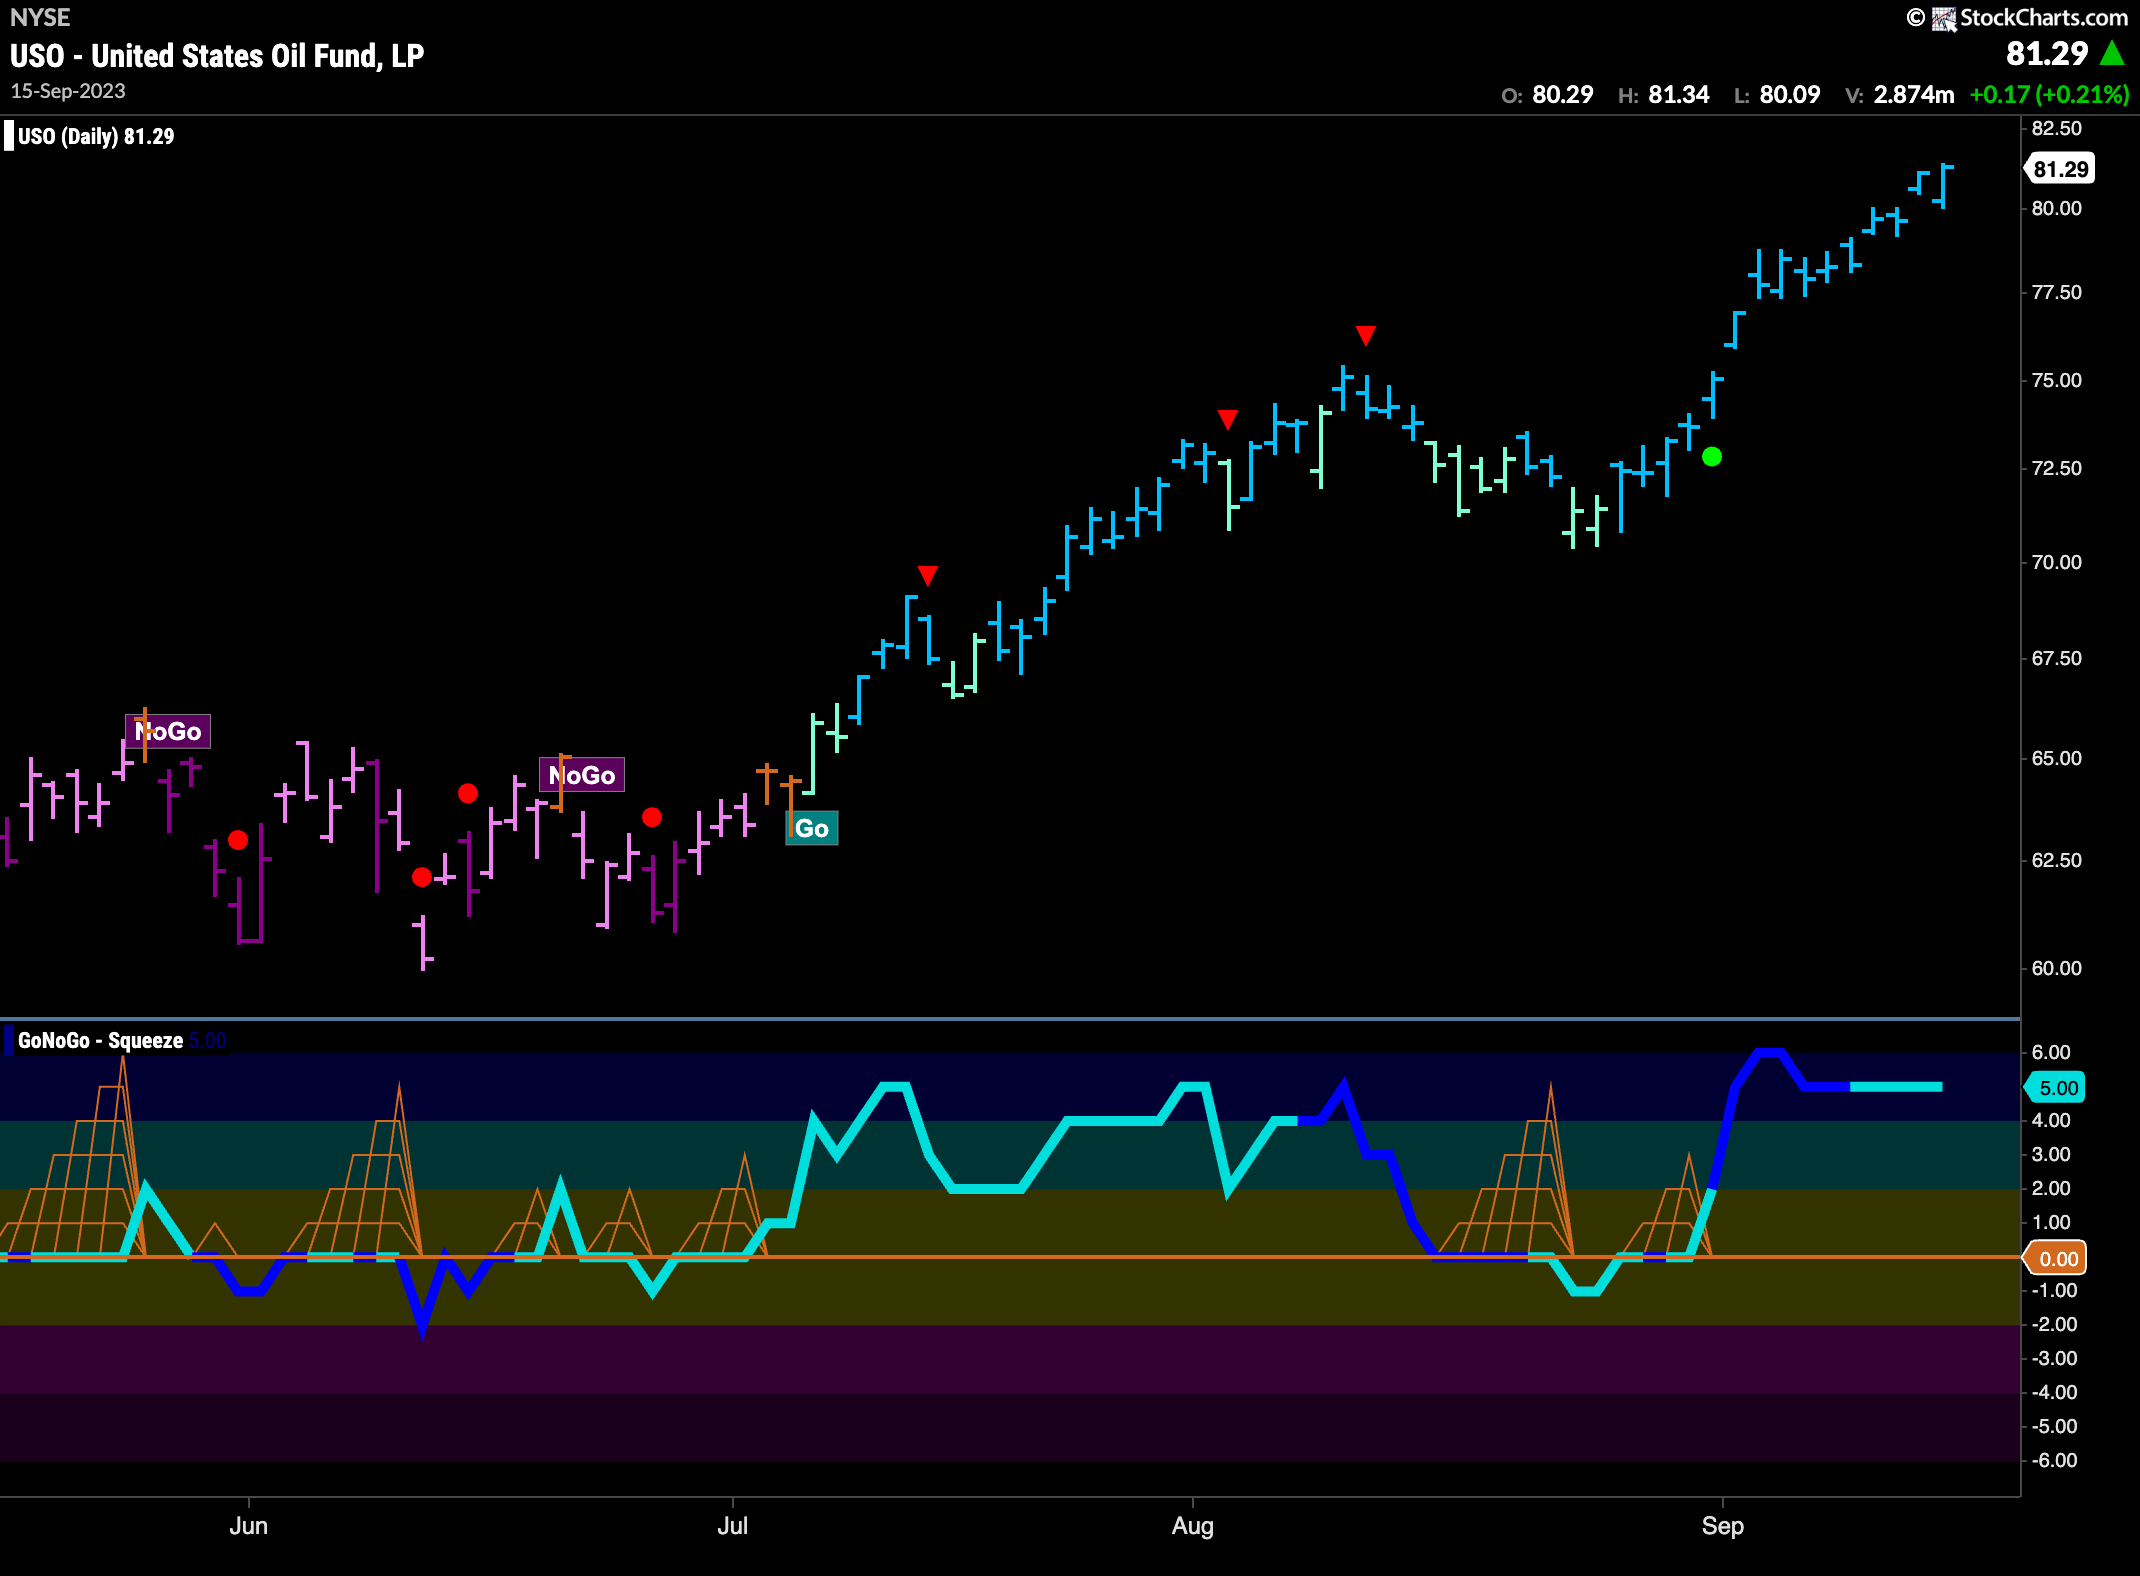
The chart below shows daily prices for $USO and we can see that we have seen nothing but strong blue “Go” bars for several weeks. With price at new highs, GoNoGo Oscillator is in overbought territory and has remained there for a while. This is a very strong looking chart of $USO. If the oscillator moves lower, we will get a Go Countertrend Correction Icon (red arrow) as momentum cools.
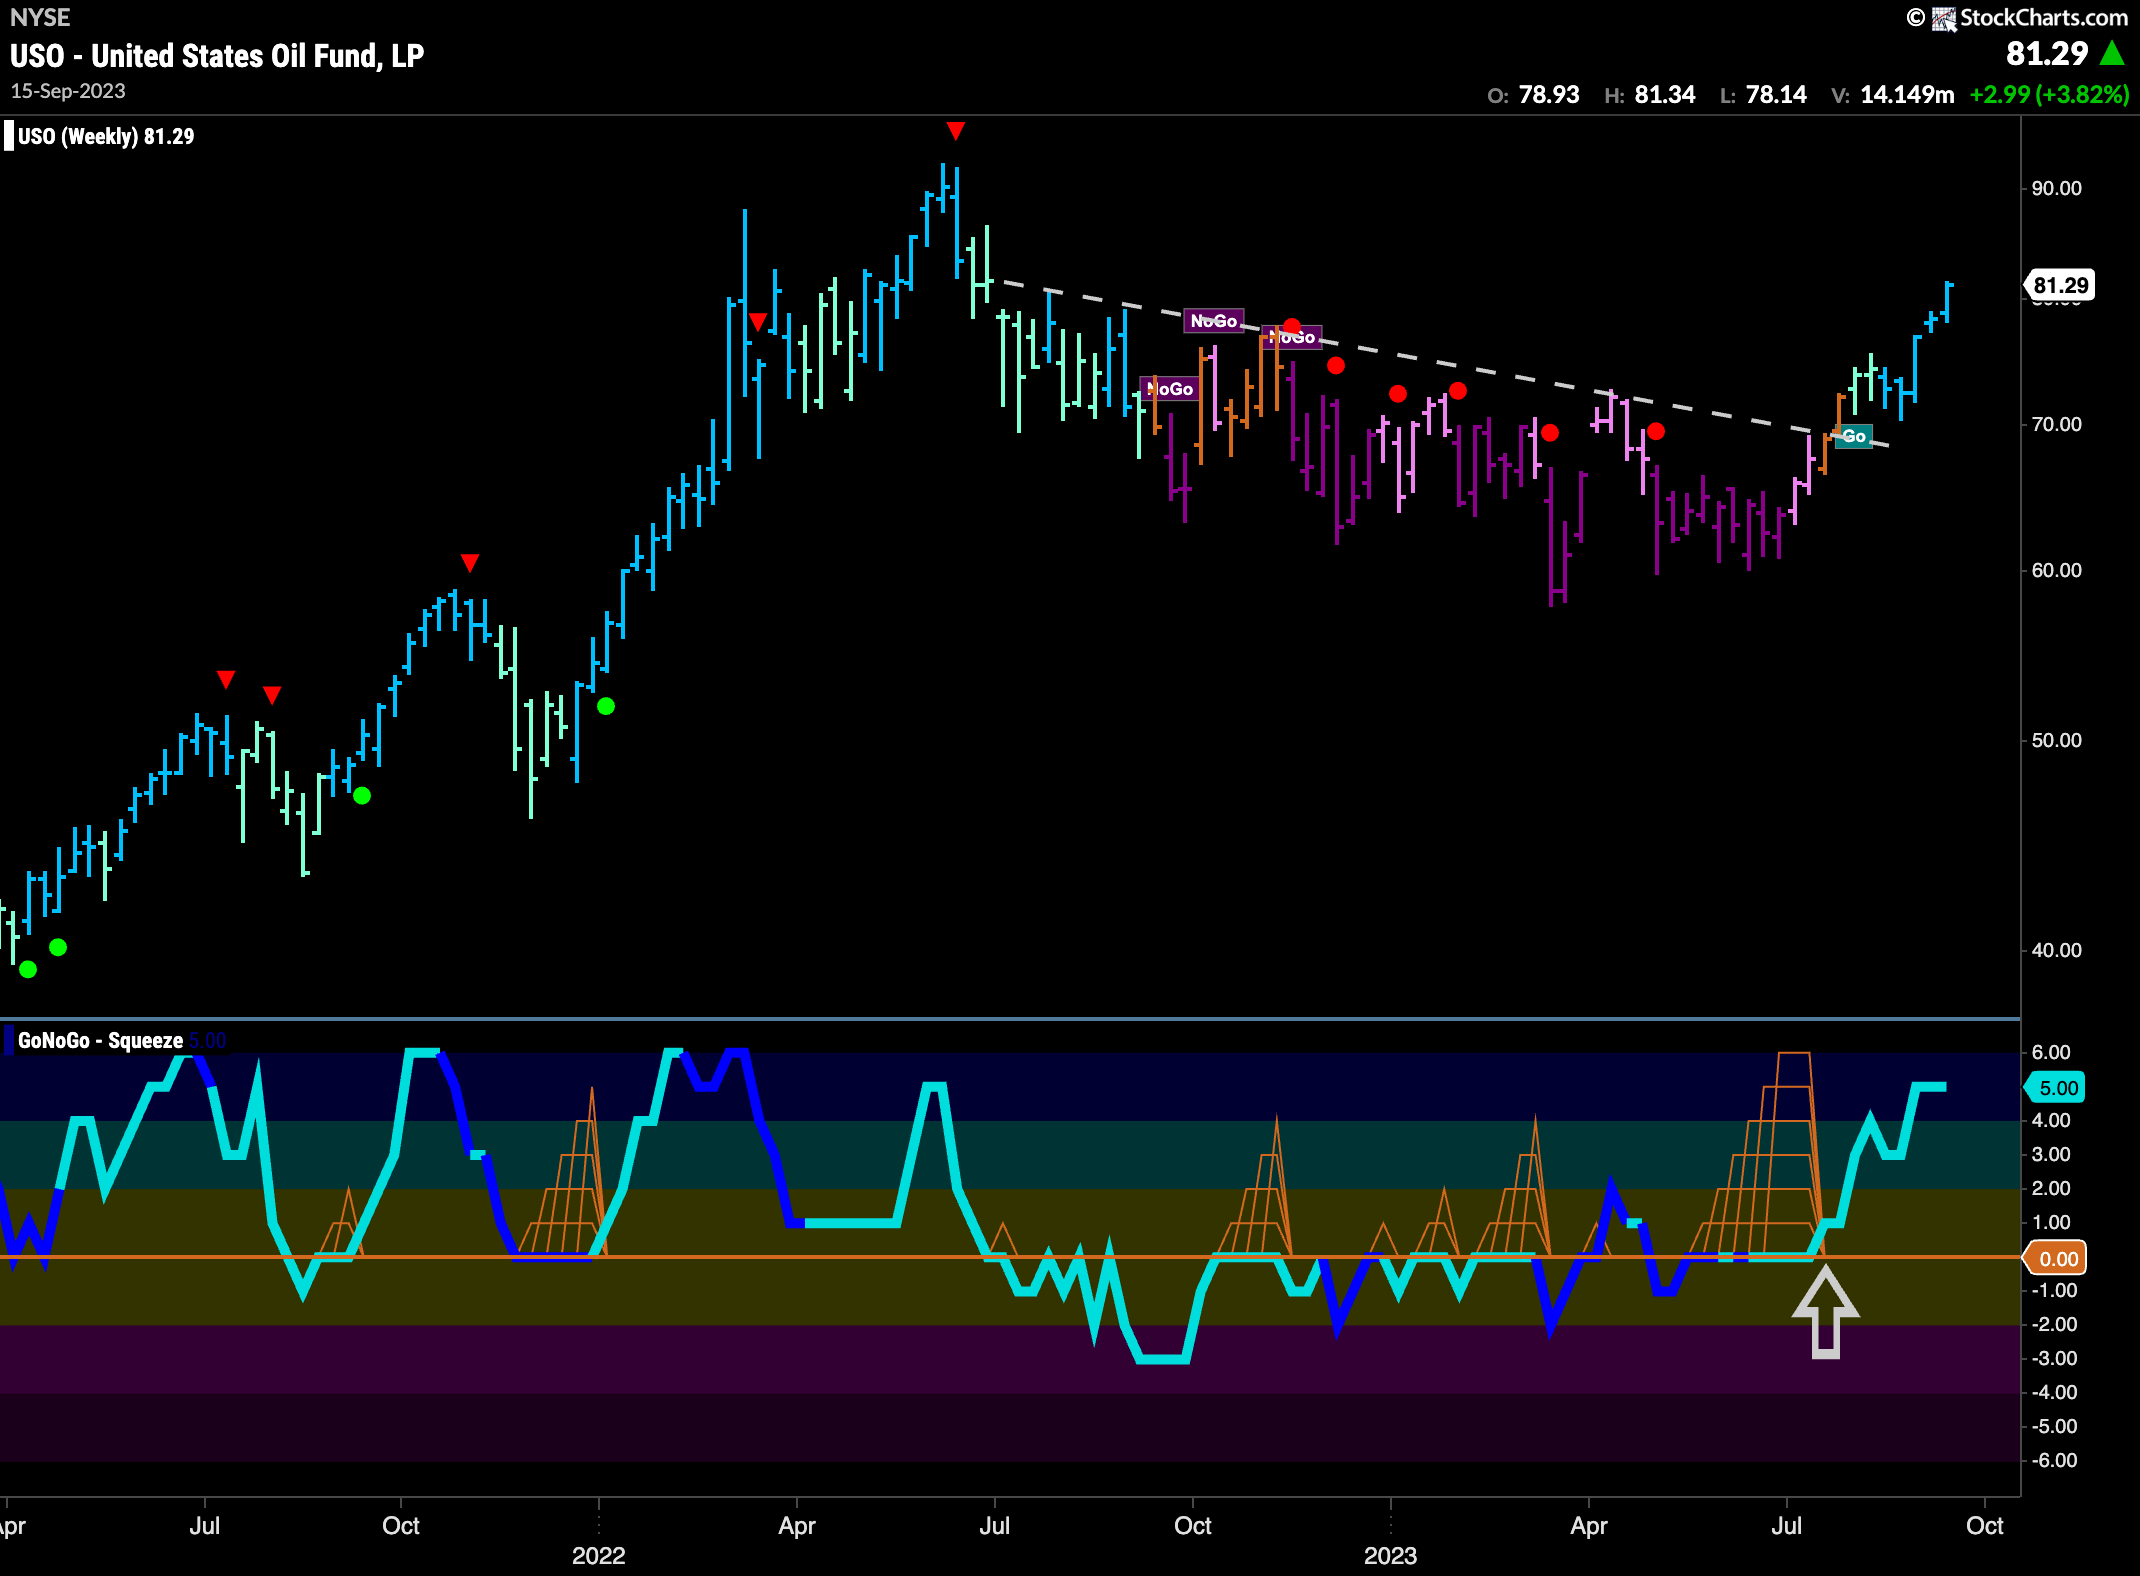
What a breakout we see on the weekly chart. After moving above resistance and painting “Go” bars, price has seen the trend strengthen and now we are into our 5 consecutive strong “Go” bar at new highs. GoNoGo Oscillator shows how quickly price has moved since breaking out of the Max GoNoGo Squeeze. Now price is entering overbought territory and so we will watch to see how long it can remain there.
Gold Stays in “NoGo” as Momentum tests Zero
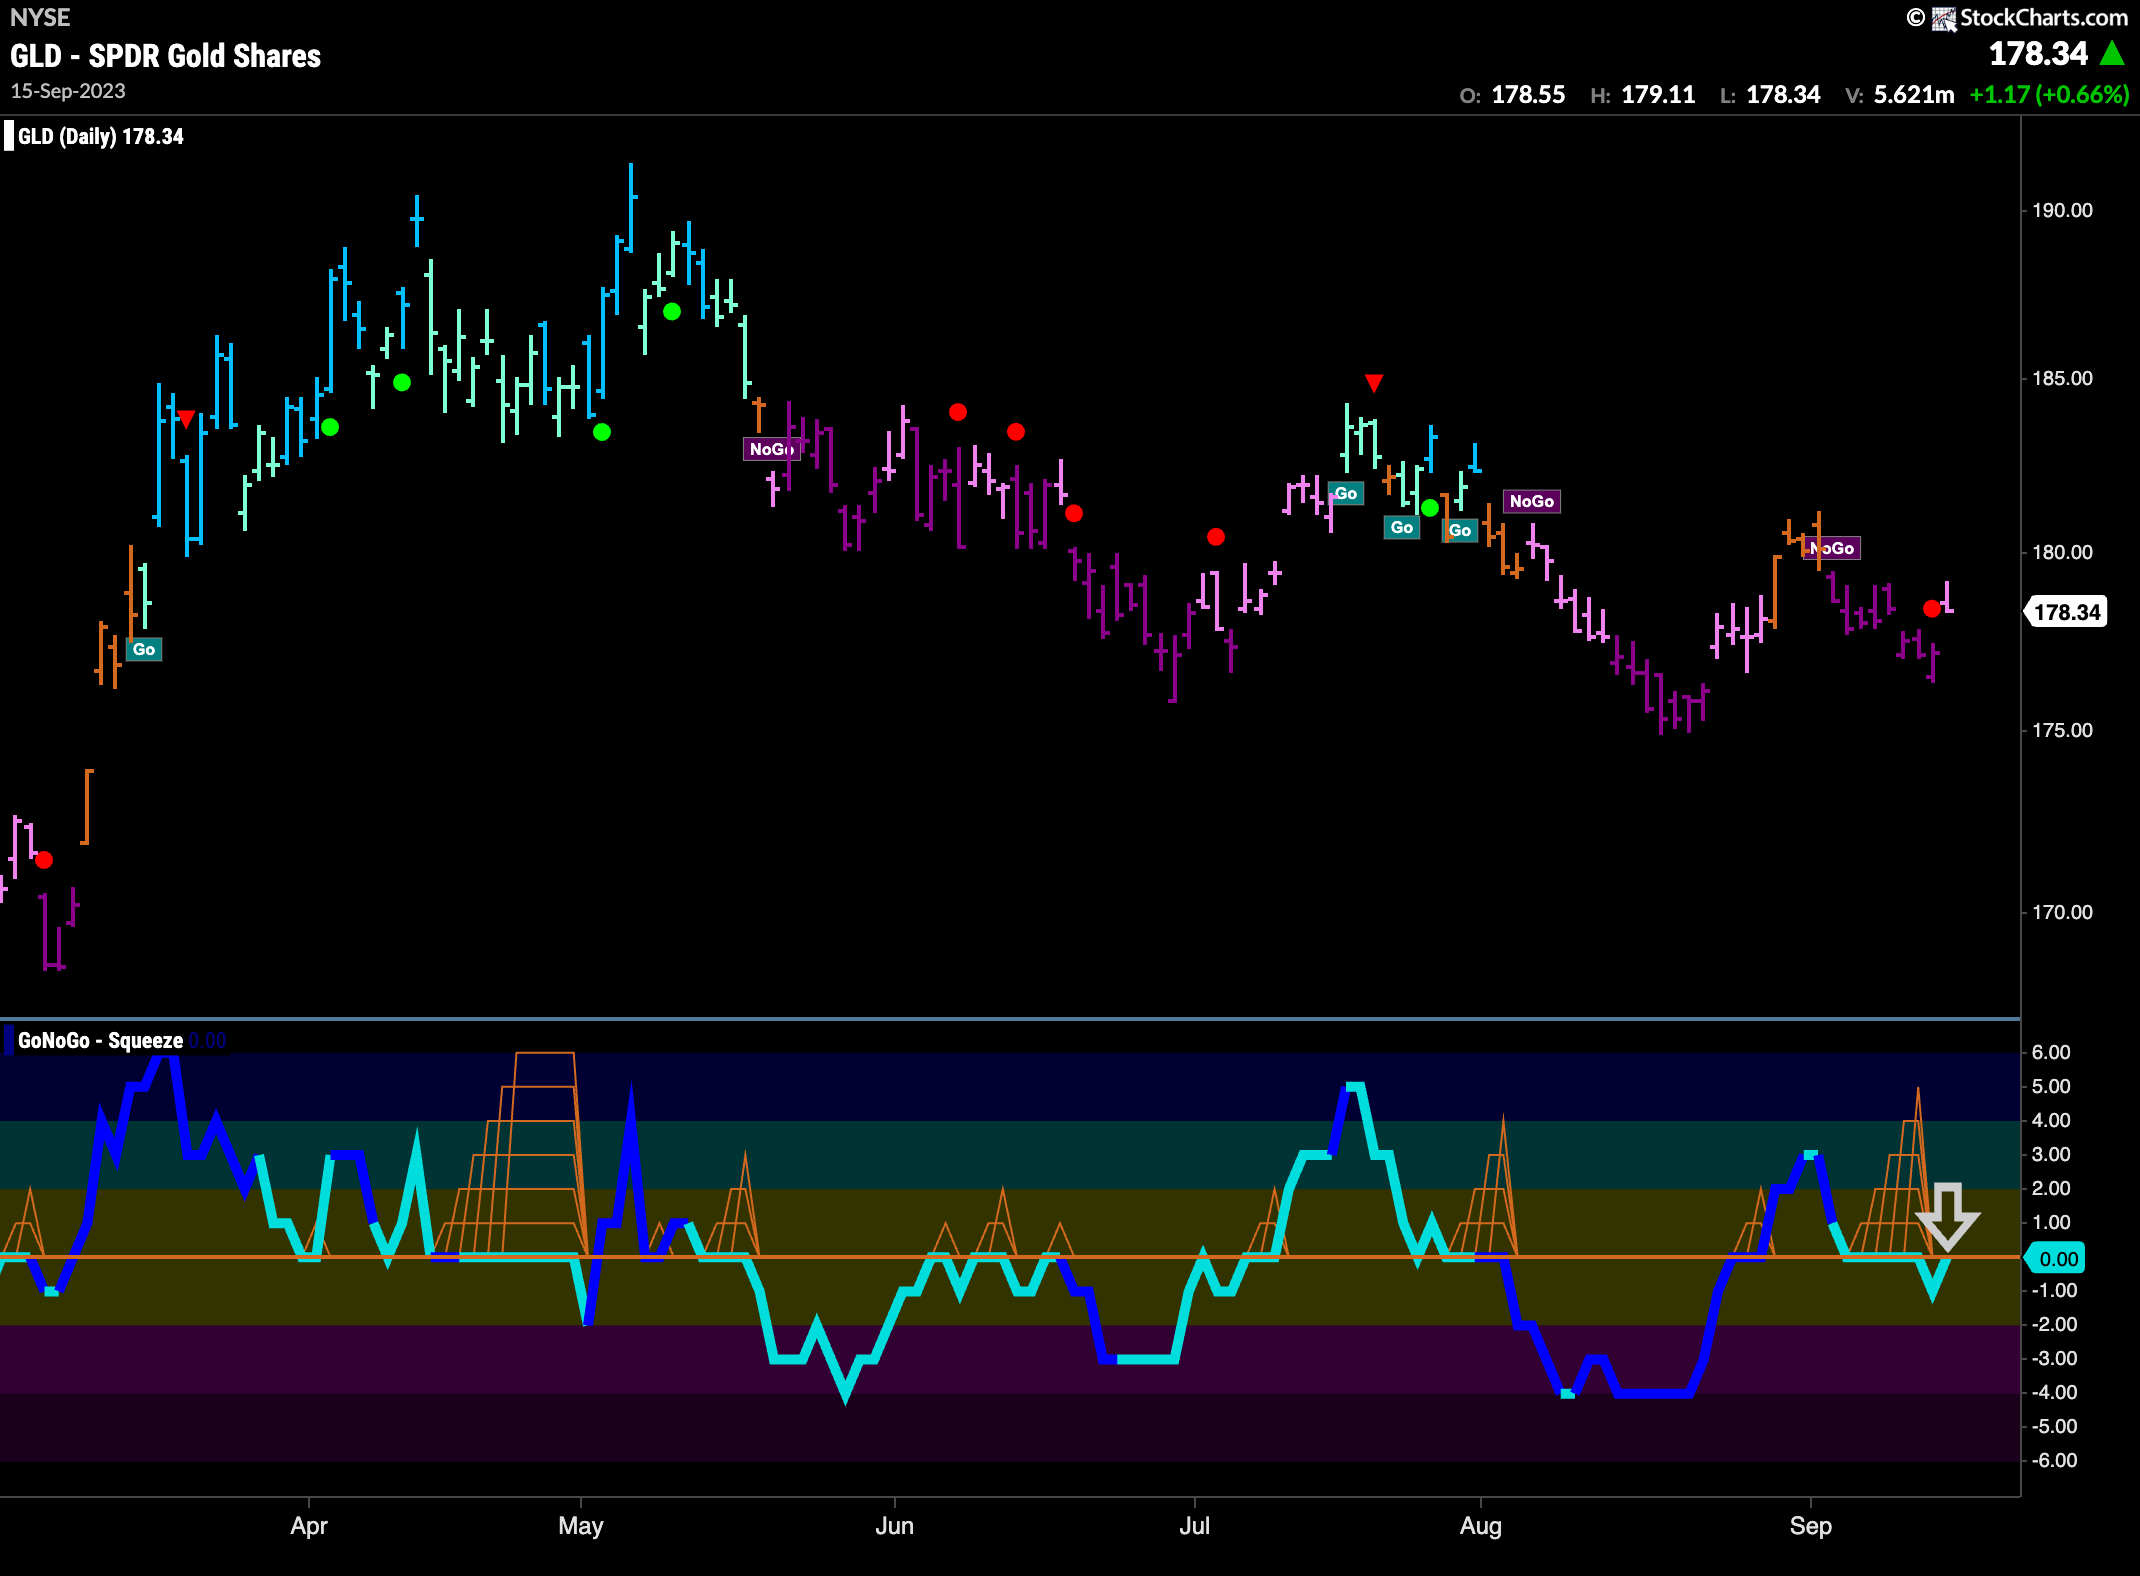
$GLD has remained in a “NoGo” trend but we can see that on the last bar of the week it painted a weaker pink bar. GoNoGo Oscillator had broken out of a Max GoNoGo Squeeze into negative territory but is quickly back testing that level from below. We will watch to see if it gets rejected here. If it does, we will look for price to move lower again.
Sector RelMap
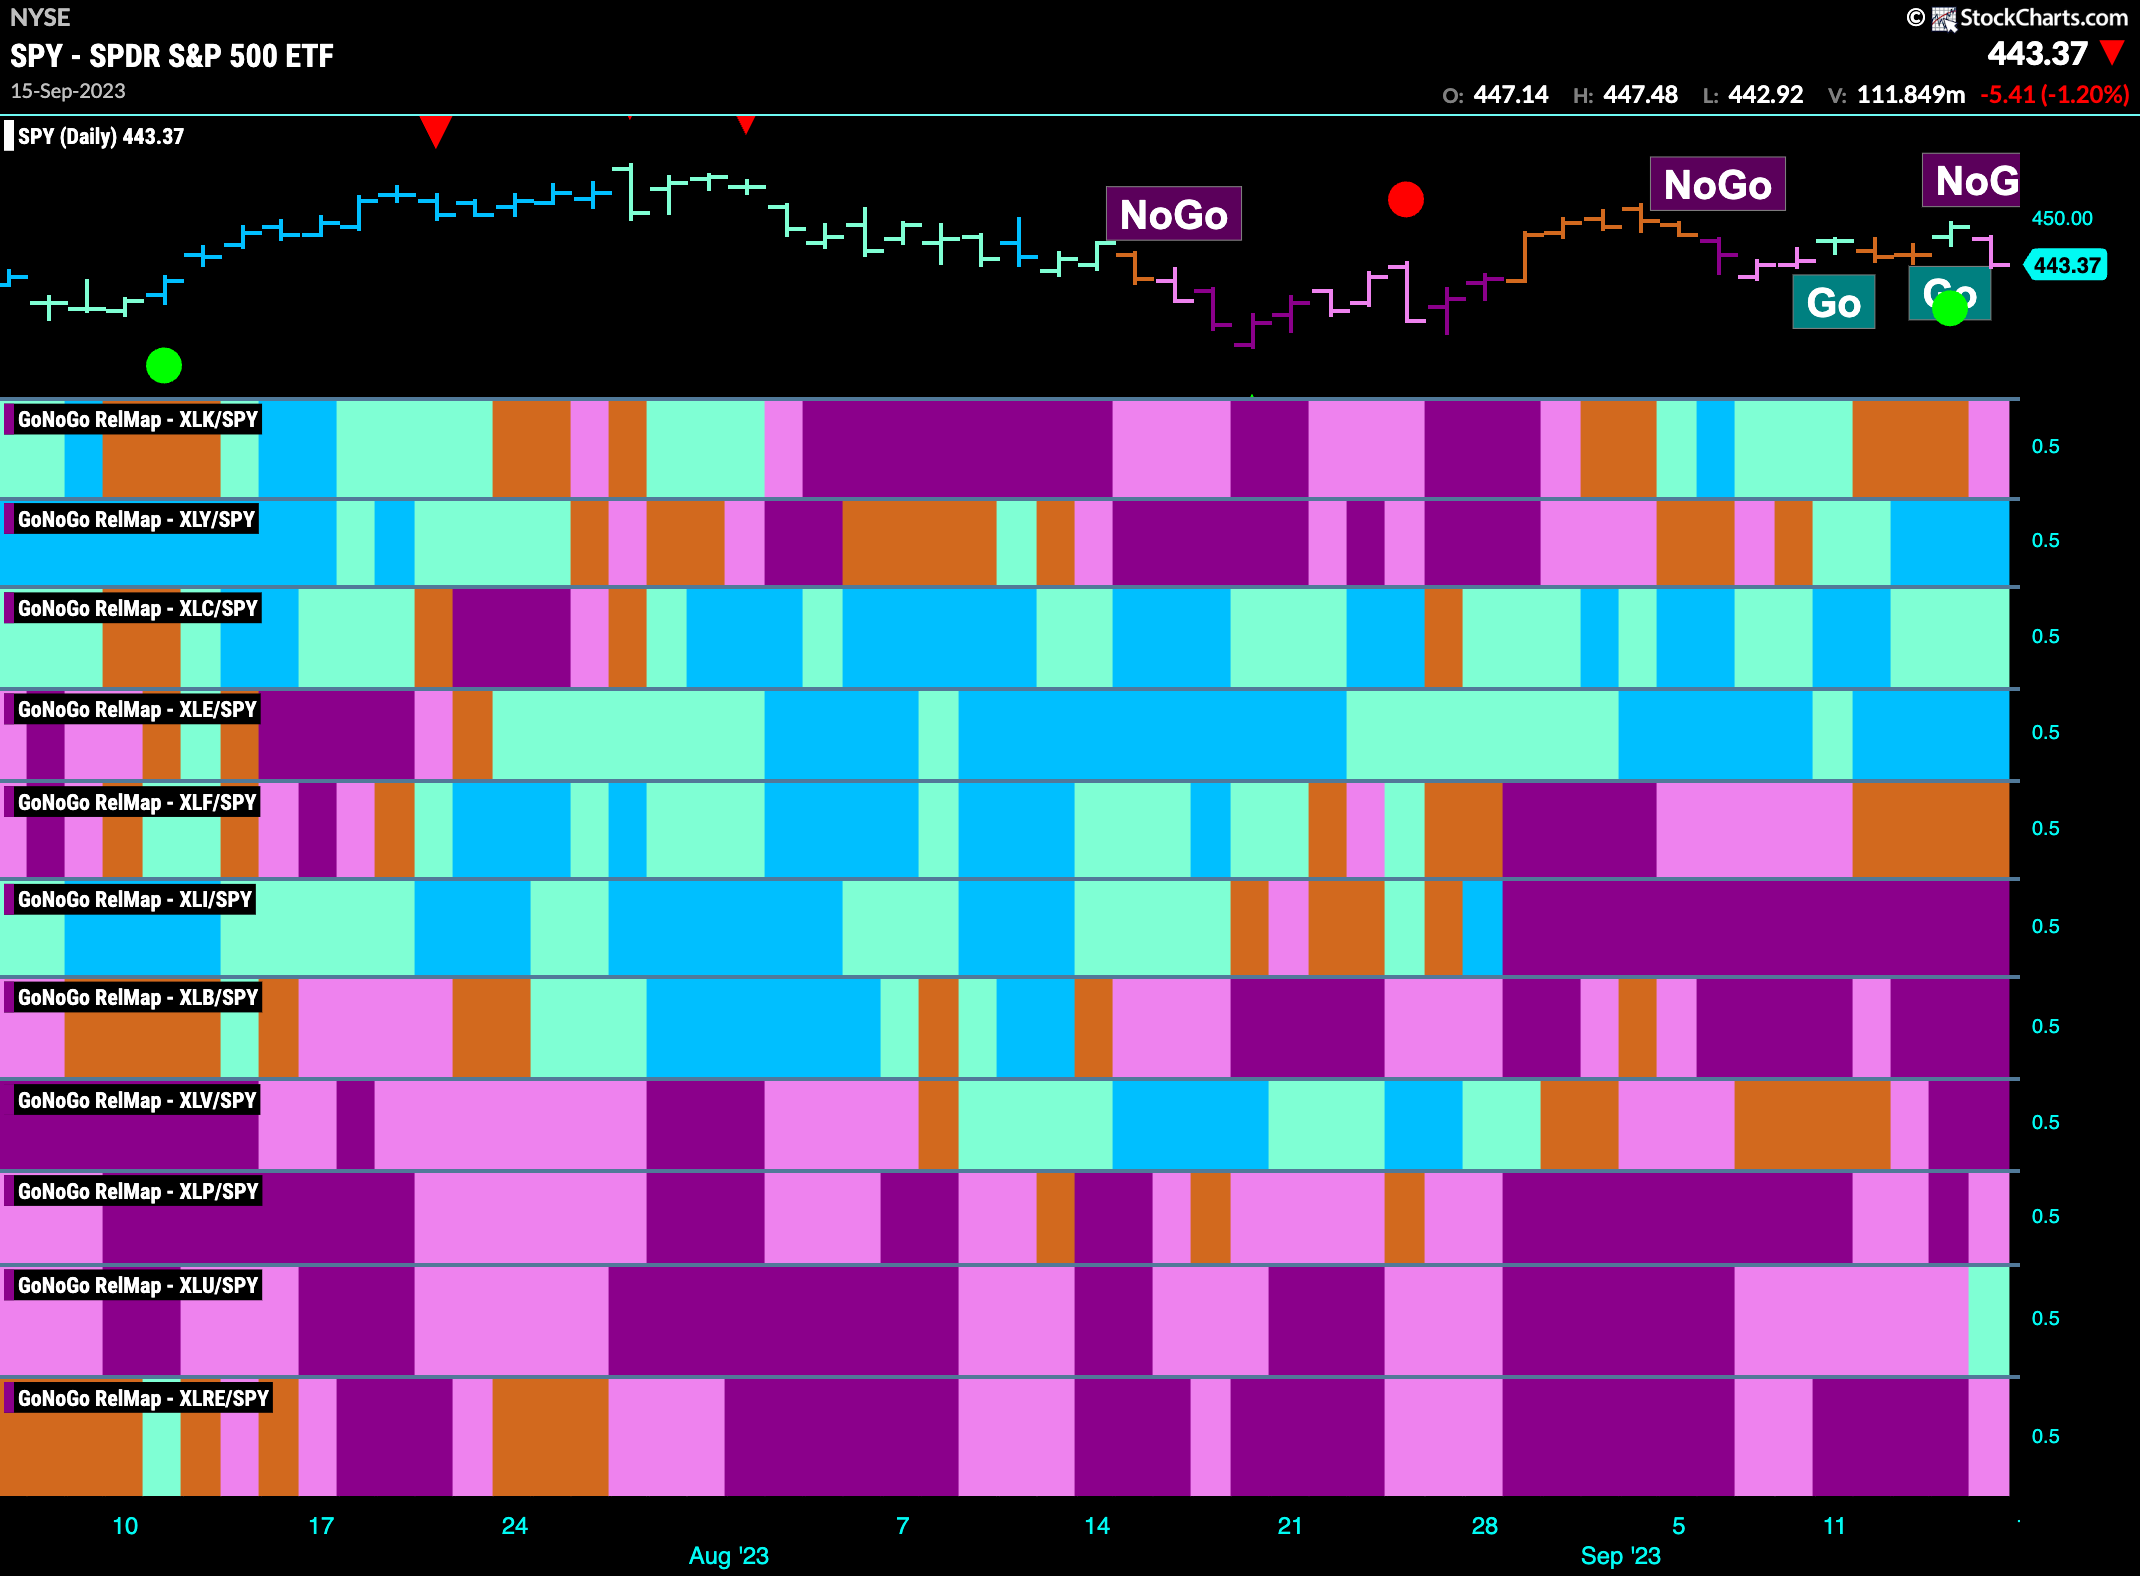
Below is the GoNoGo Sector RelMap. This GoNoGo RelMap applies the GoNoGo Trend to the relative strength ratios of the sectors to the base index. Looking at this map, we can quickly see where the relative outperformance is coming from as well as which sectors are lagging on a relative basis. 4 sectors are outperforming the base index this week. $XLY, $XLC, $XLE and $XLU are painting “Go” bars.
Use Your Discretion This Week!
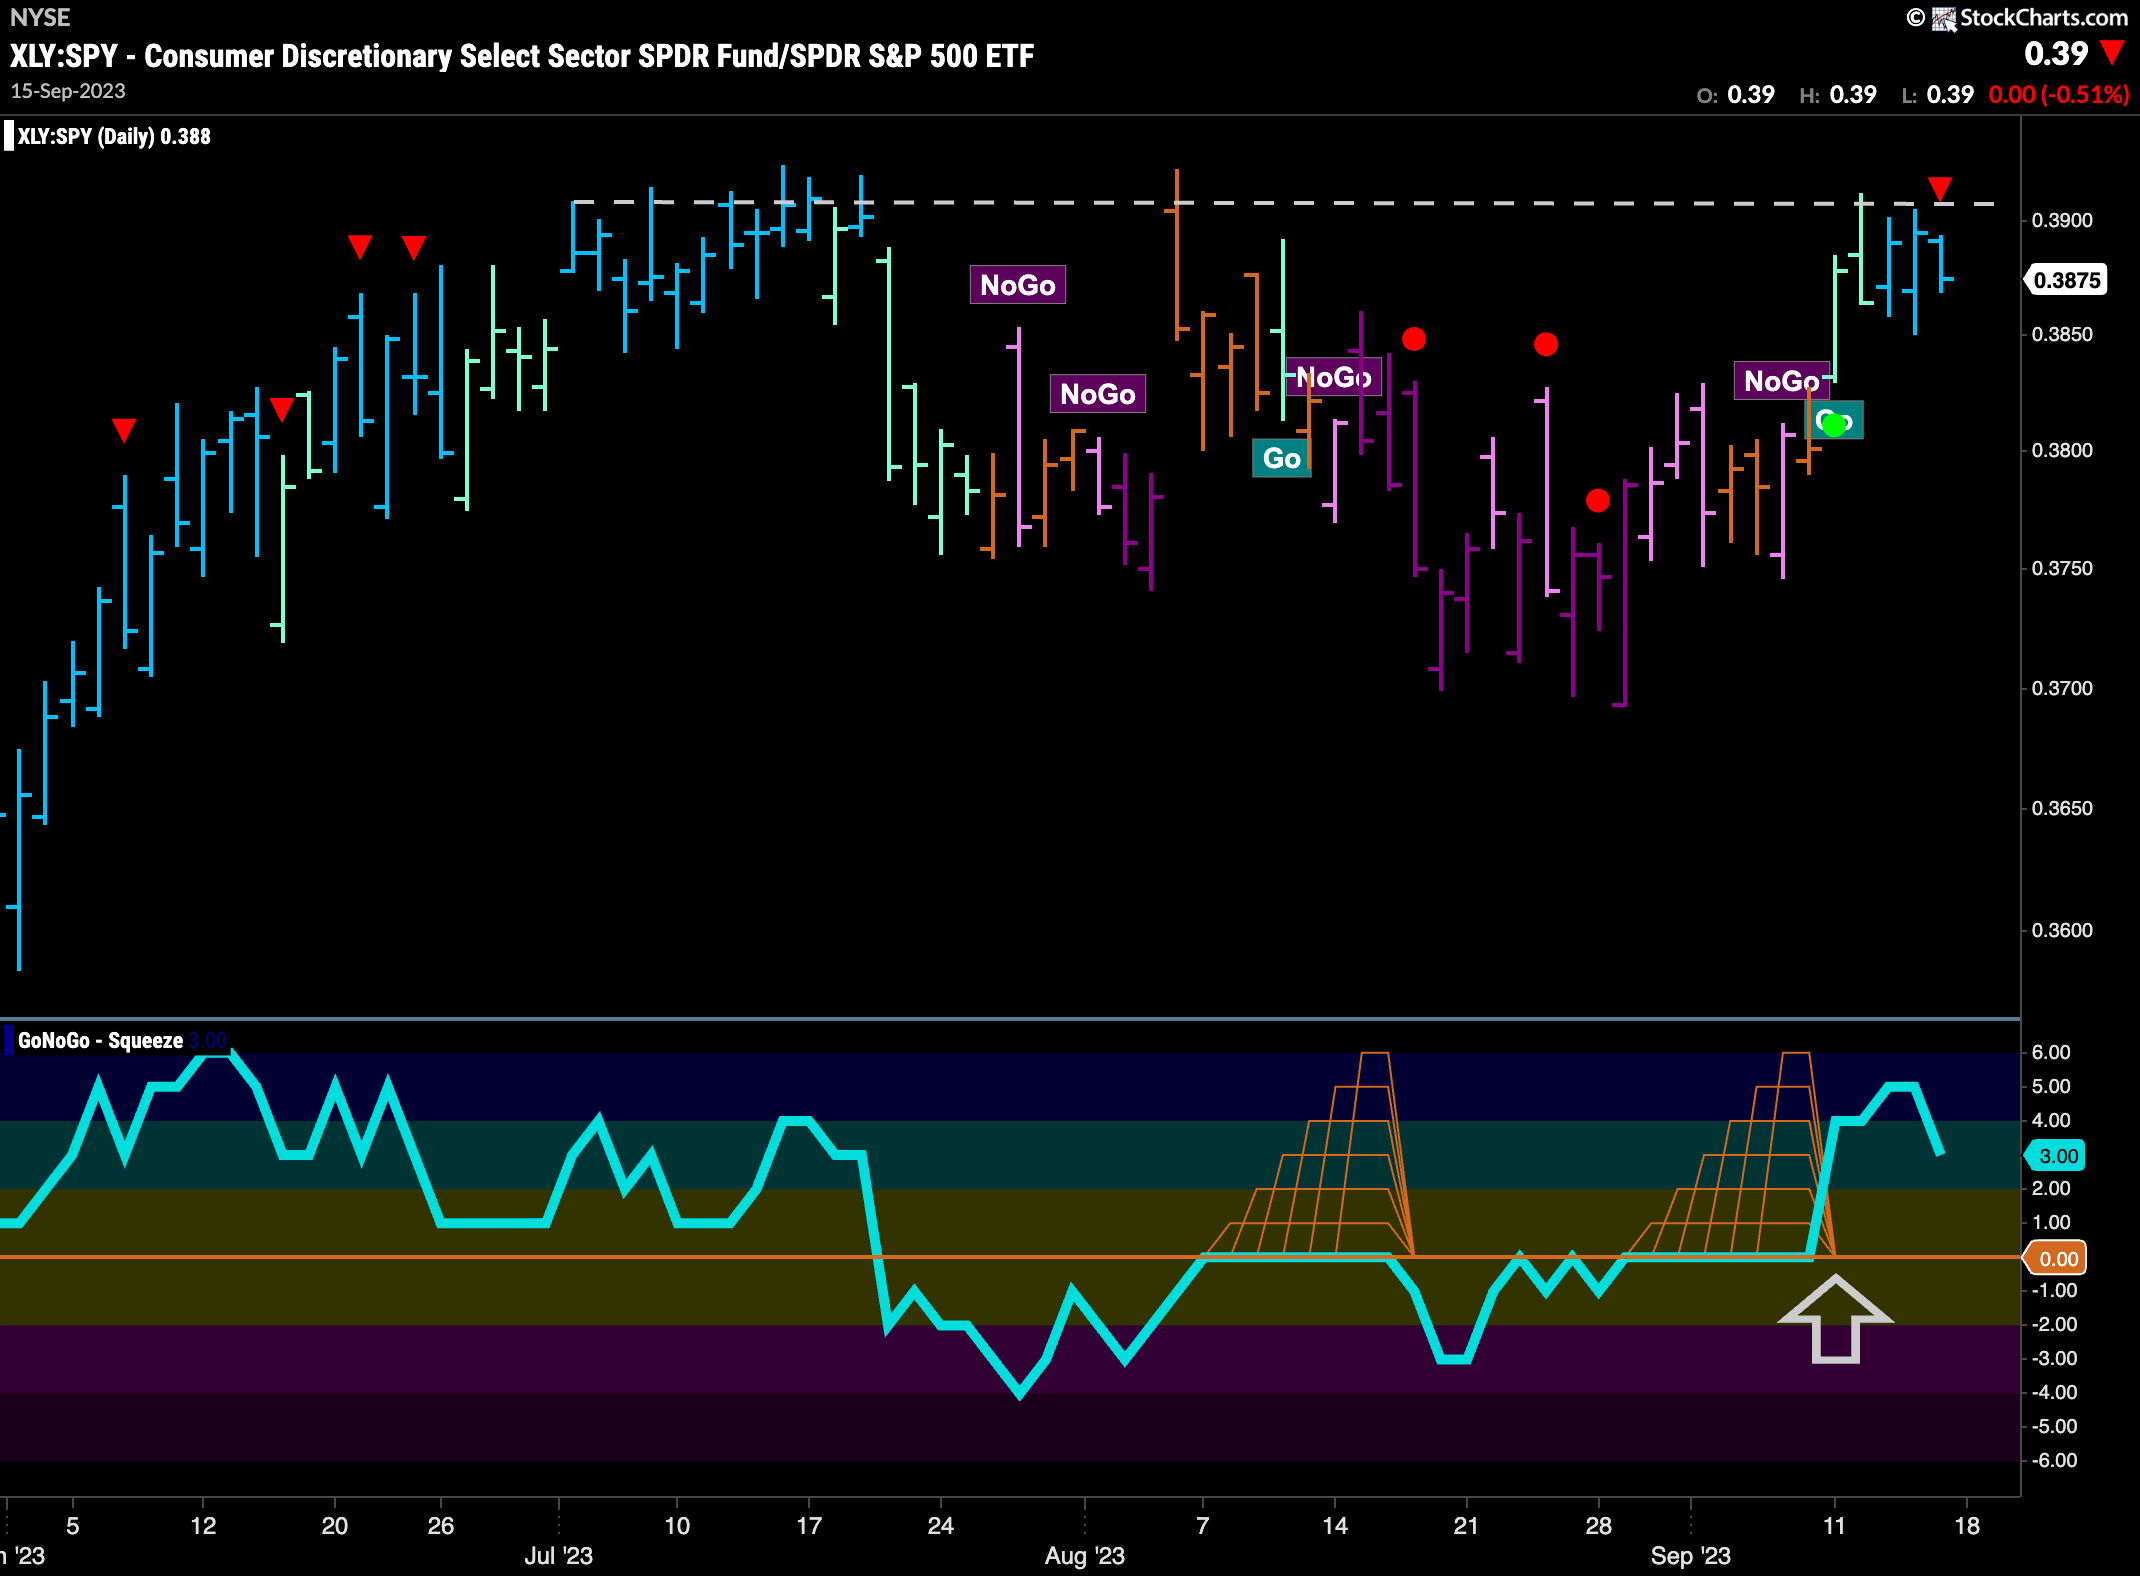
The GoNoGo Sector RelMap above shows that consumer discretionary was an outperformer this past week and the relative trend strengthened to paint strong blue “Go” bars. We can see this on the chart below of $XLY:$SPY. While we see strength in this ratio and leadership, we must note the overhead resistance that it will have to break through for the trend to continue higher.
Discretionary Sector Looking for Long Term Support
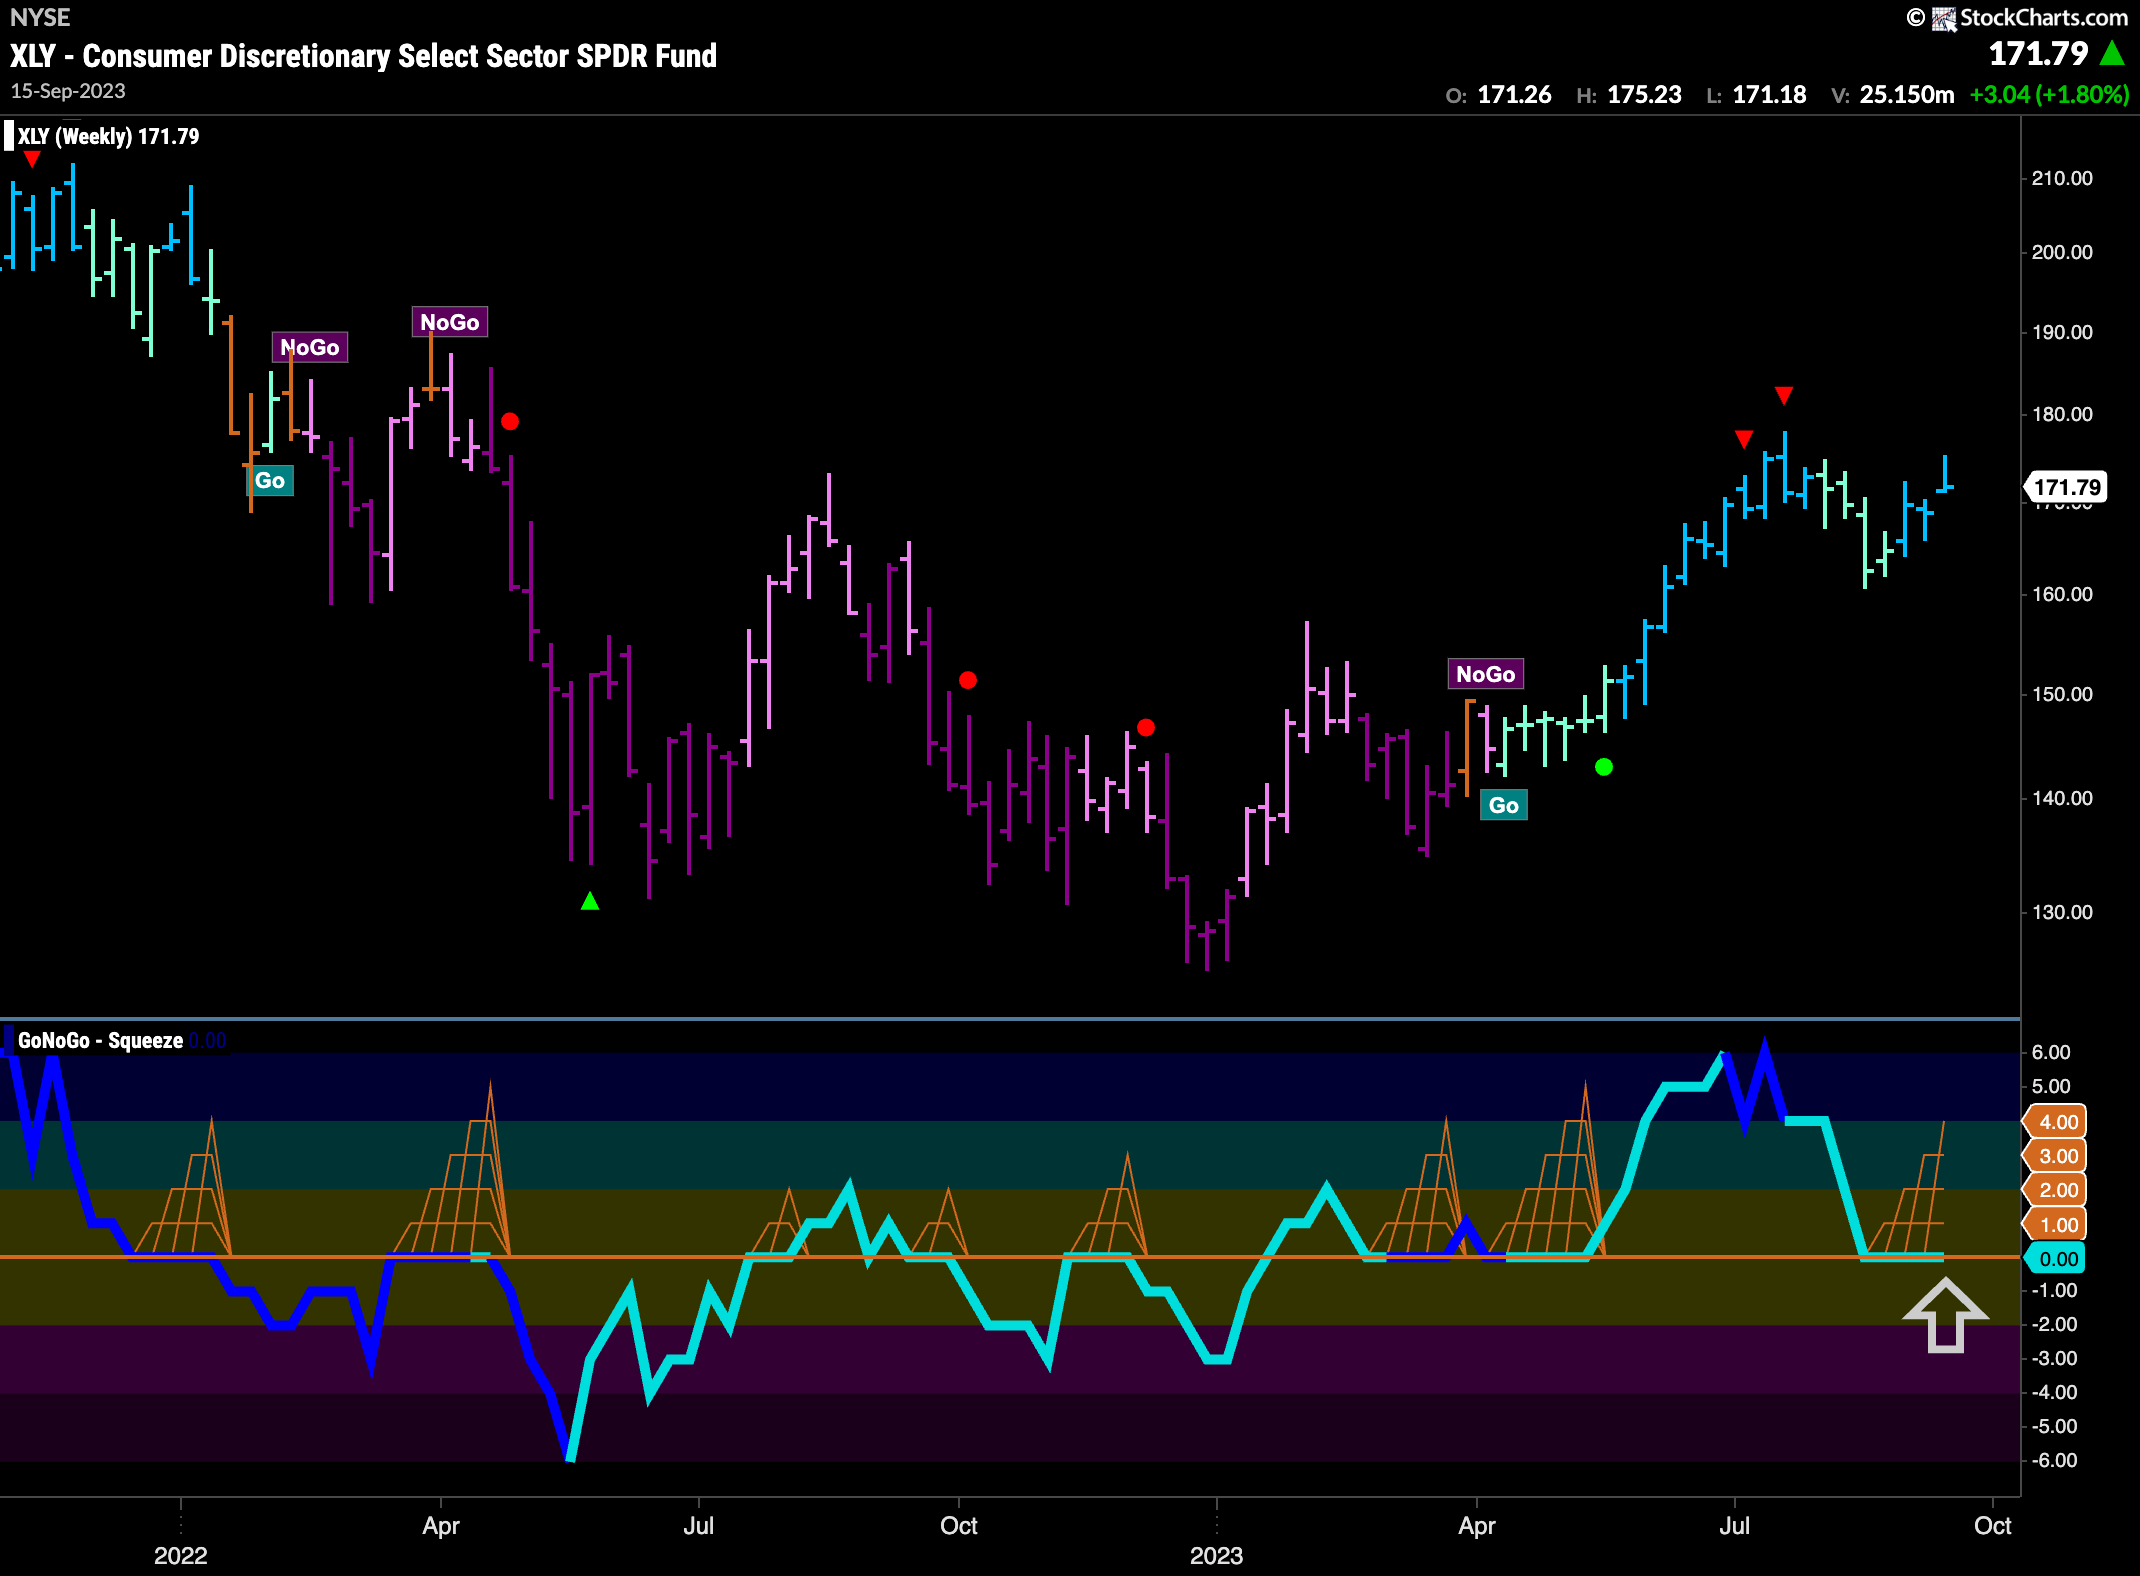
If the relative outperformance we are seeing in the $XLY is to continue then it will be important that the sector remain in a weekly “Go” trend. The chart below shows that GoNoGo Trend is painting strong blue “Go” bars as the weight of the evidence suggests that it is in a strong trend. Having pulled back from recent highs after the Go Countertrend Correction Icons (red arrows) we can see that it is searching for oscillator support in the lower panel. GoNoGo Oscillator is riding the zero line where the climbing grid of GoNoGo Squeeze is starting to build. We will look for a breakout of the squeeze into positive territory which might give price the push it needs to make a new higher high.
$XPEV Looking for New Highs
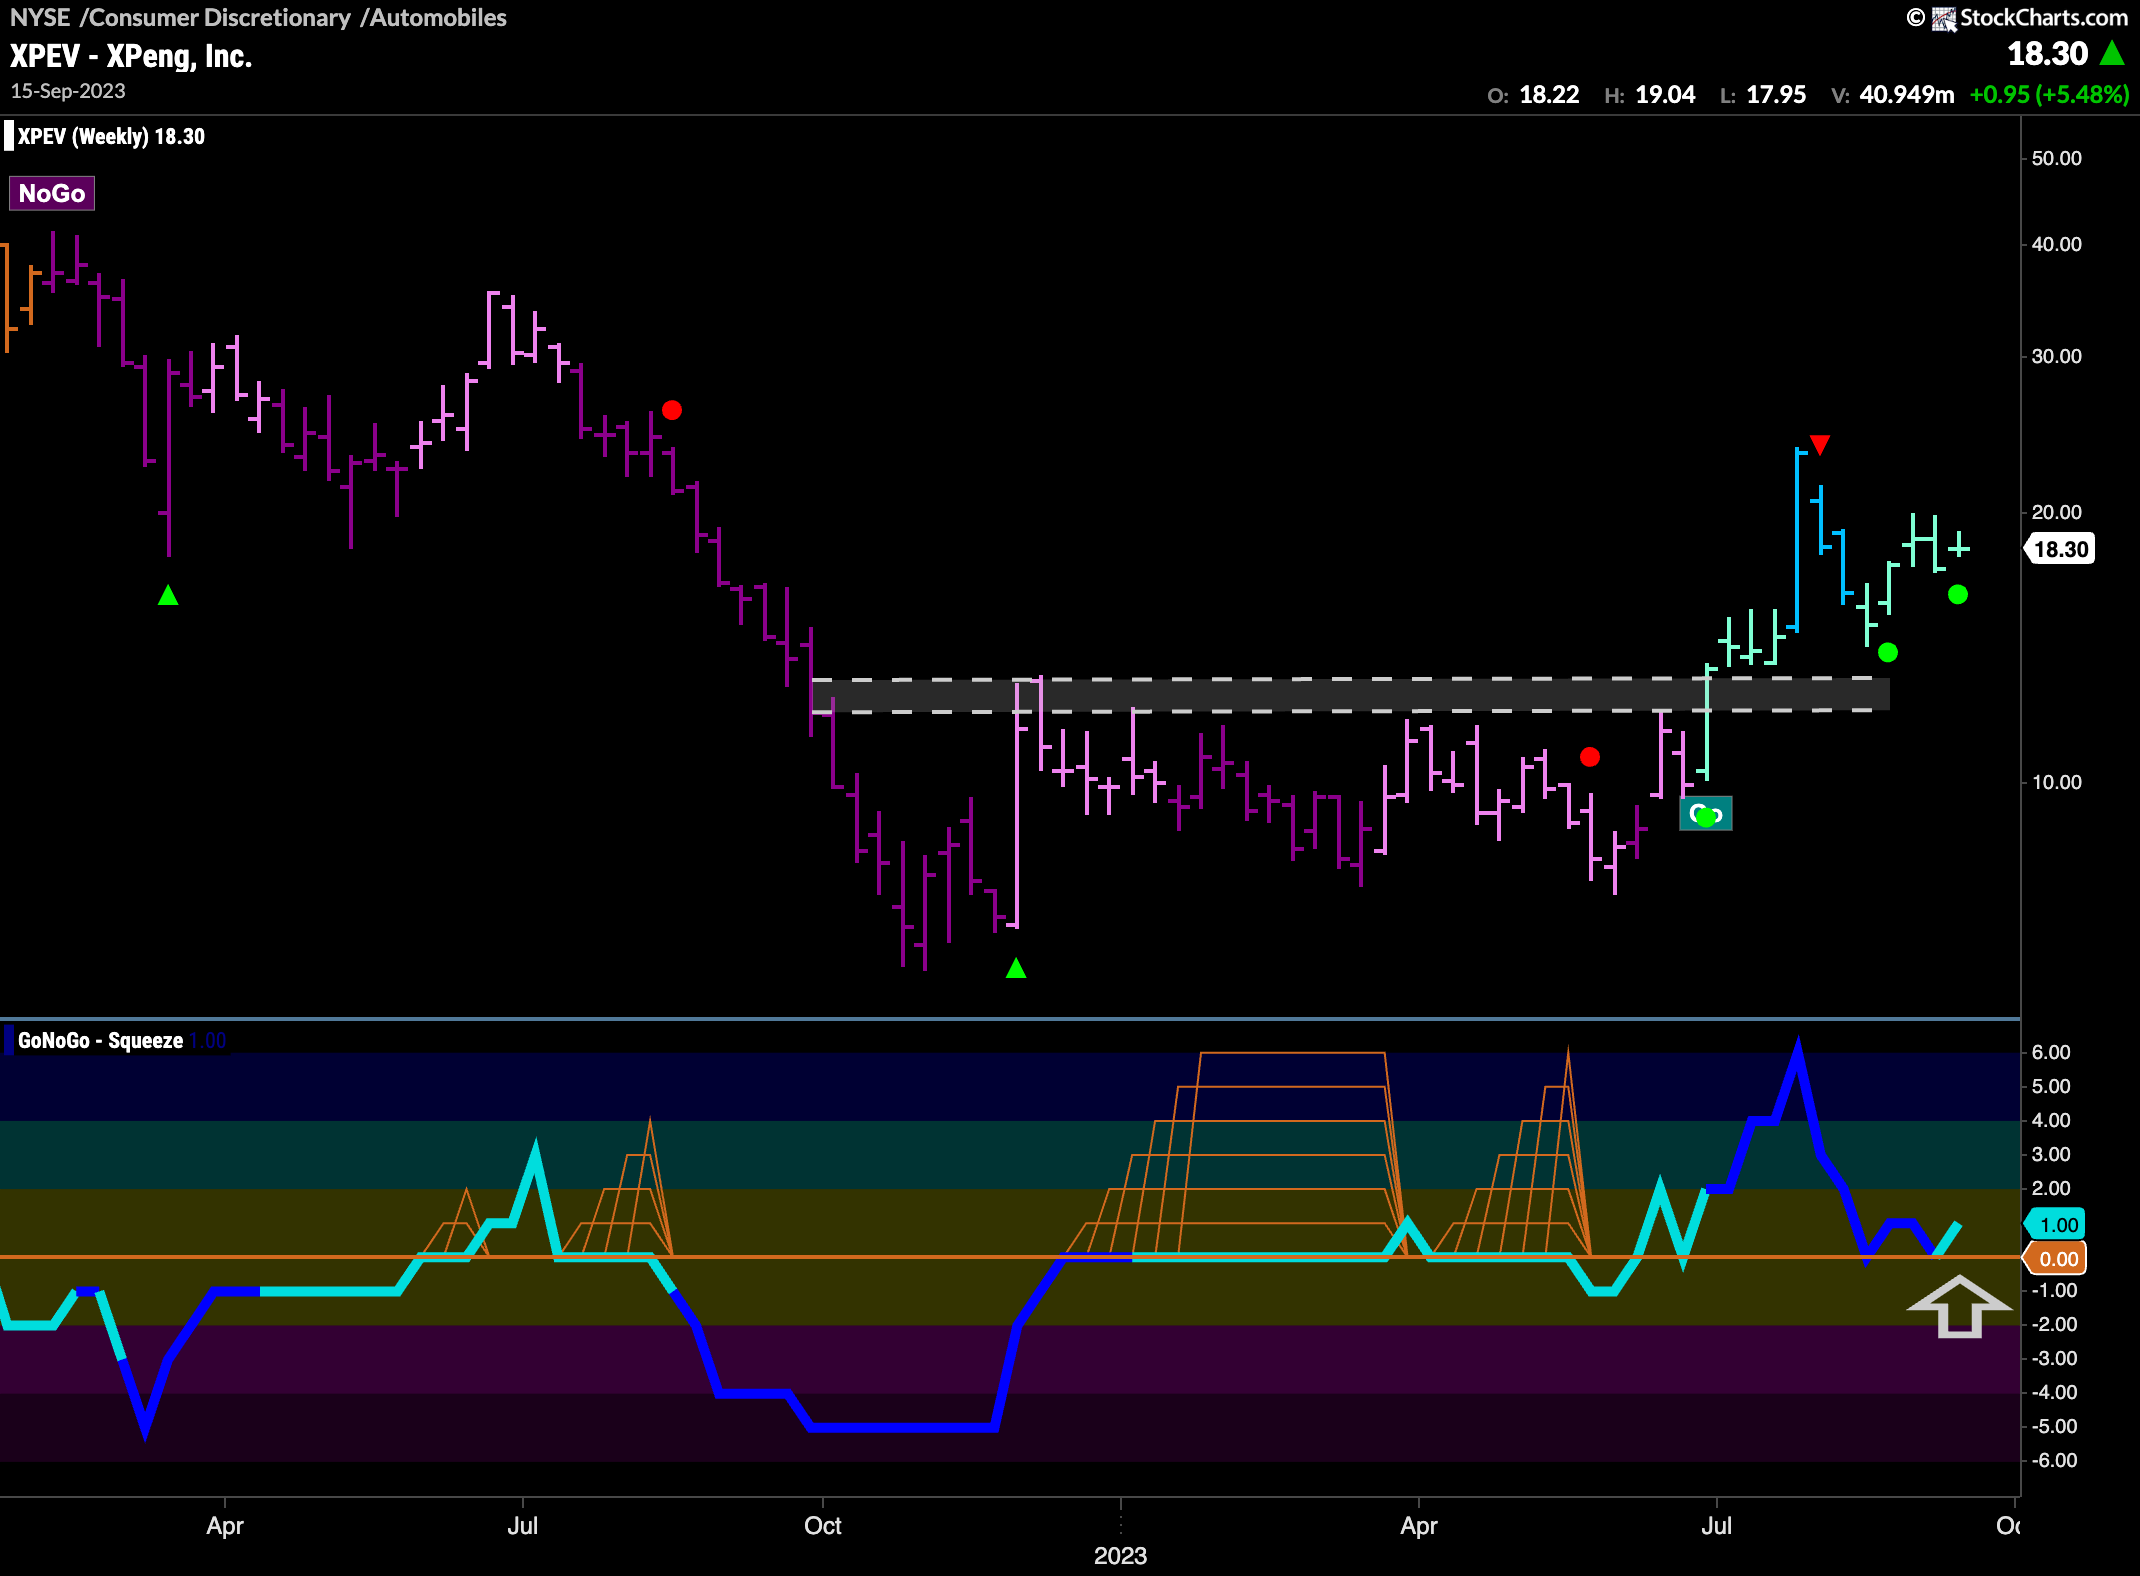
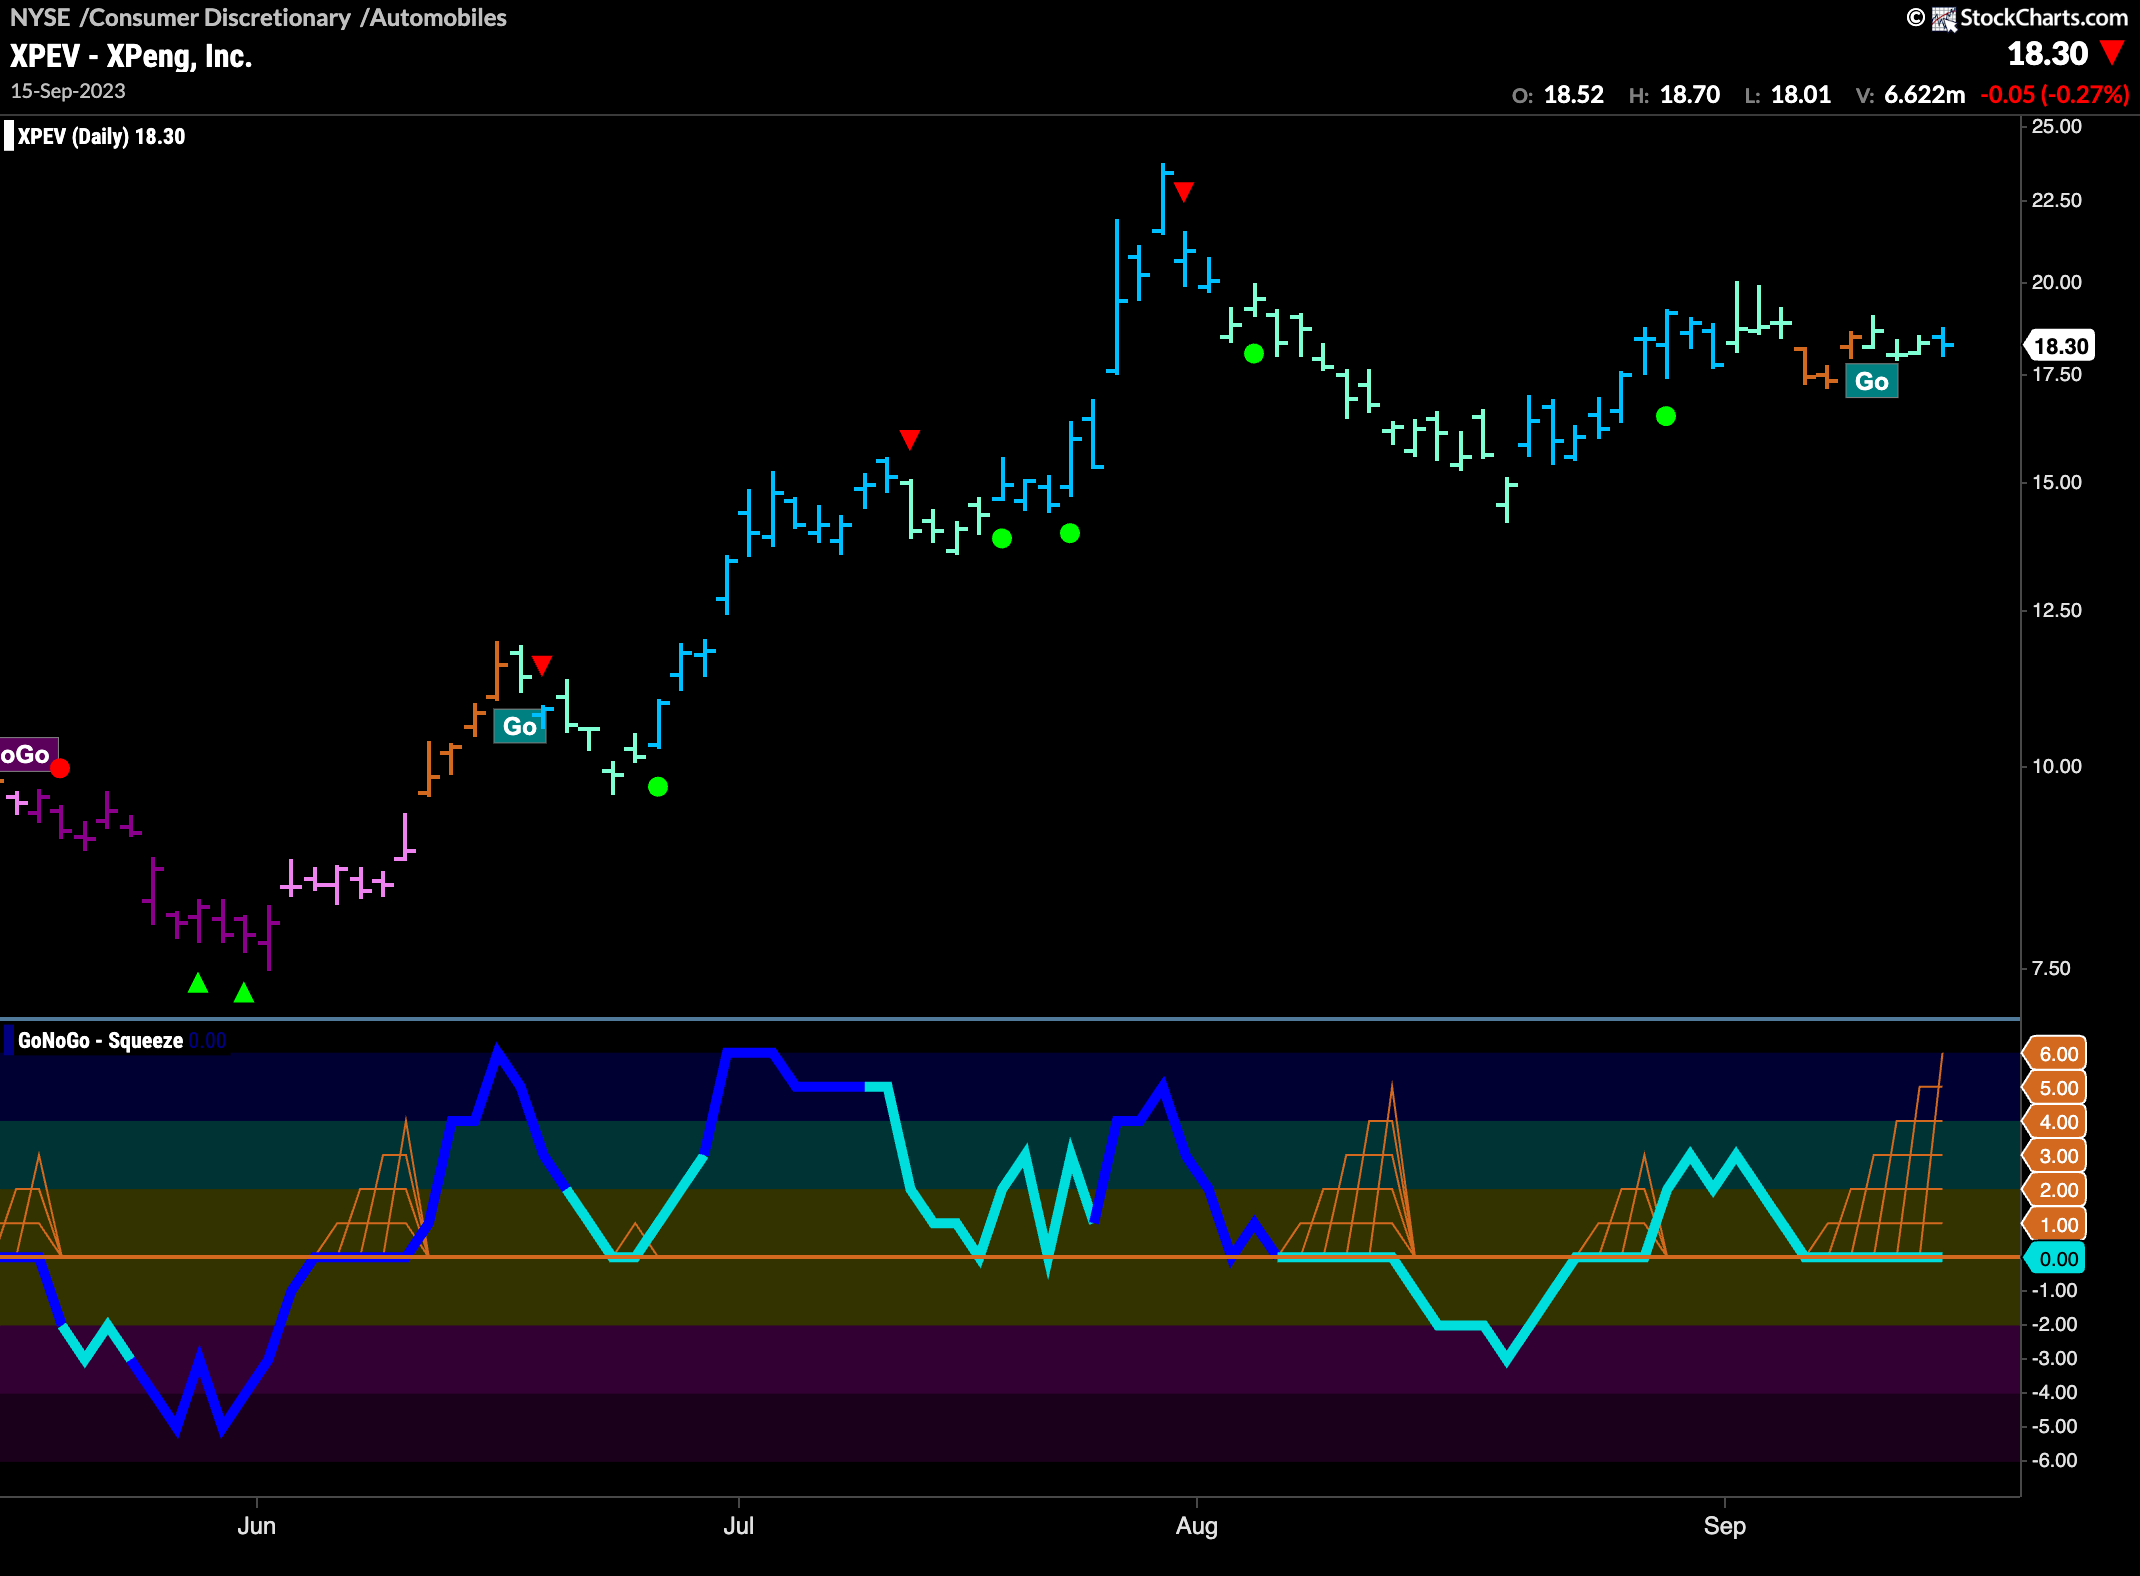
A peak at the GoNoGo Industry Subgroup RelMap for the discretionary sector showed me that it is the automobiles group that is helping drive performance relative to the larger index. $XPEV is a security in that space. The chart below shows that having hit a high over the summer we have moved mostly sideways since. That has caused the trend to weaken (aqua and even amber bars). GoNoGo Oscillator has fallen to the zero line where it has stayed, allowing the grid of GoNoGo Squeeze to climb to its Max. We will watch to see if this Squeeze gets broken into positive territory. If it does, we will look for the “Go” trend to continue and price to make an attempt at a new high.
The longer term chart shows that we may be in good shape. Price has broken above horizontal resistance and has successfully retested that level. GoNoGo Trend is painting aqua “Go” bars and the oscillator appears to be finding support at zero as we see Go Trend Continuation Icons (green circles) under the price bars. We will look to see if this gives price the push it needs to set a new higher high.
