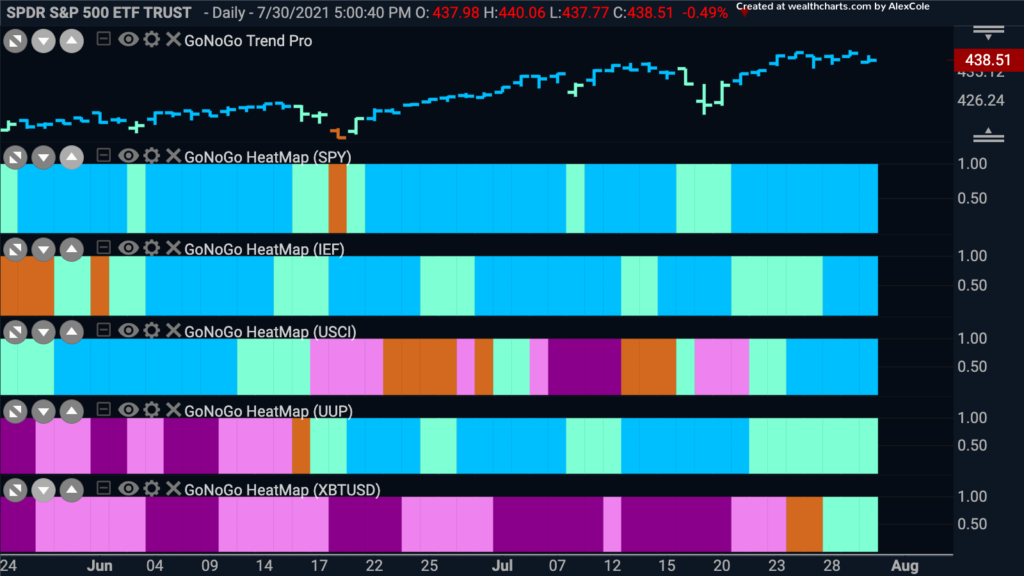
Well, well, well. All five asset classes are in a “Go” trend this week, a rare occurrence. After a lengthy “NoGo” correction which saw prices half from around $60,000 to $30,000 we are seeing enough bullish conditions being met for the GoNoGo Trend indicator to identify a “Go” trend on the worlds largest digital asses, Bitcoin. (5th panel). We also see the dollar remain in a “Go” trend although it has come back a bit of late and is painting paler aqua bars. As we’ll see, this relative strength of the dollar has had a disastrous effect on emerging markets. U.S. domestic equities, treasury bond prices and commodities are all painting strong blue “Go” bars this week.
Can the Dollar Dig In for More Gains?
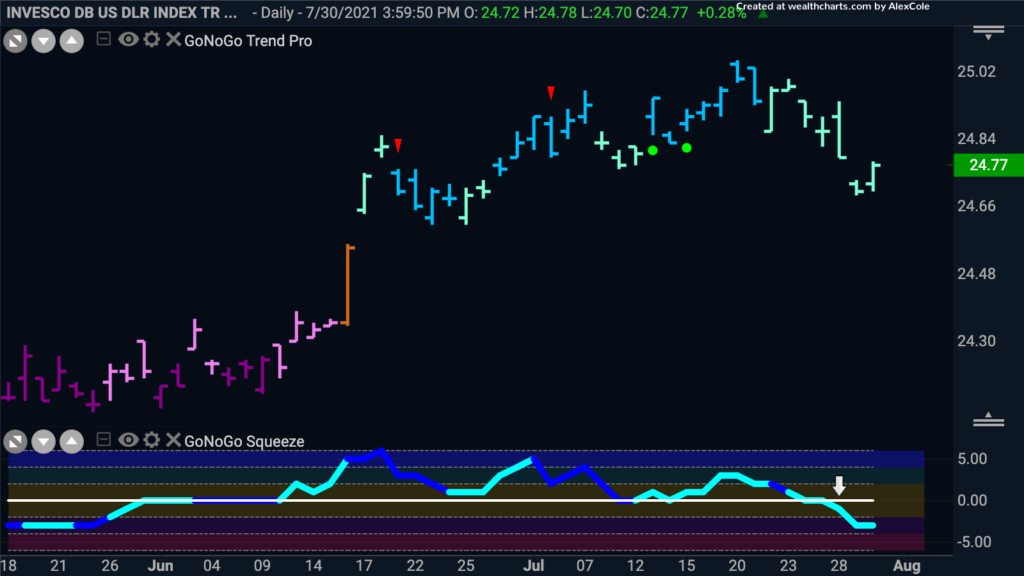
We have seen the “Go” trend take hold over the last month and set a series of higher highs and higher lows. This week saw price correct from the most recent high in a way that saw the GoNoGo Oscillator unable to find support at the zero line. While this is a concern, the GoNoGo Trend indicator is still showing the trend to be a “Go”. We will need to watch to see if price can find support here (especially as it is near levels that were support from the gap in mid June). Or, if the oscillator fails to get back above zero, will we see price head lower?
China Falls Into Price Chasm
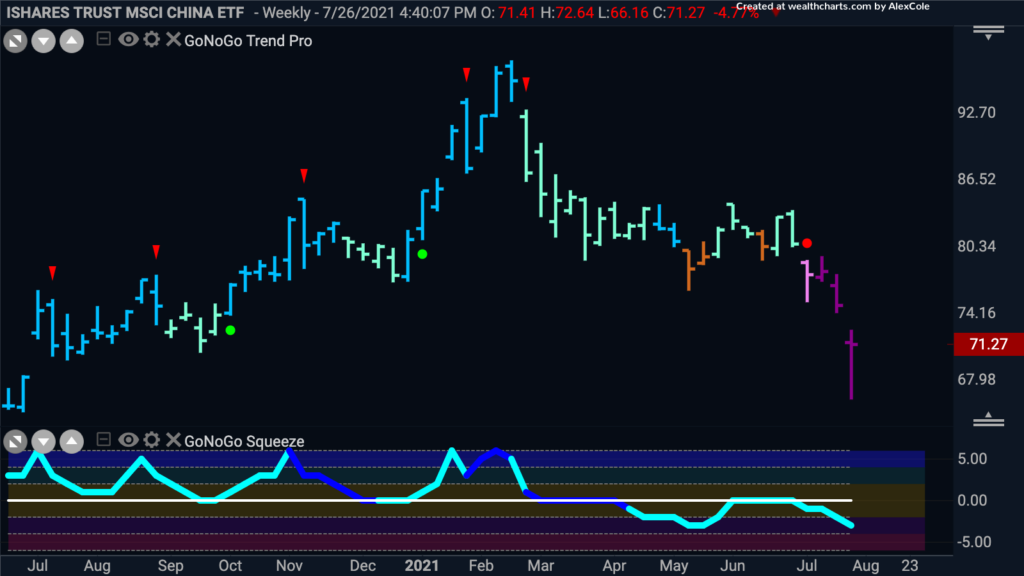
Below is the weekly GoNoGo Chart of MCHI, the MSCI China ETF. We can see that the long term trend has well and truly changed. First, in April the GoNoGo Oscillator was unable to hold the zero line as support and was rejected at that level from below. This coincided with the GoNoGo Trend being unable to maintain “Go” colors and finally start painting a “NoGo” trend. The relative strength of the dollar cannot have helped as a strong dollar acts as a headwind for emerging markets.
WYNN Not Winning
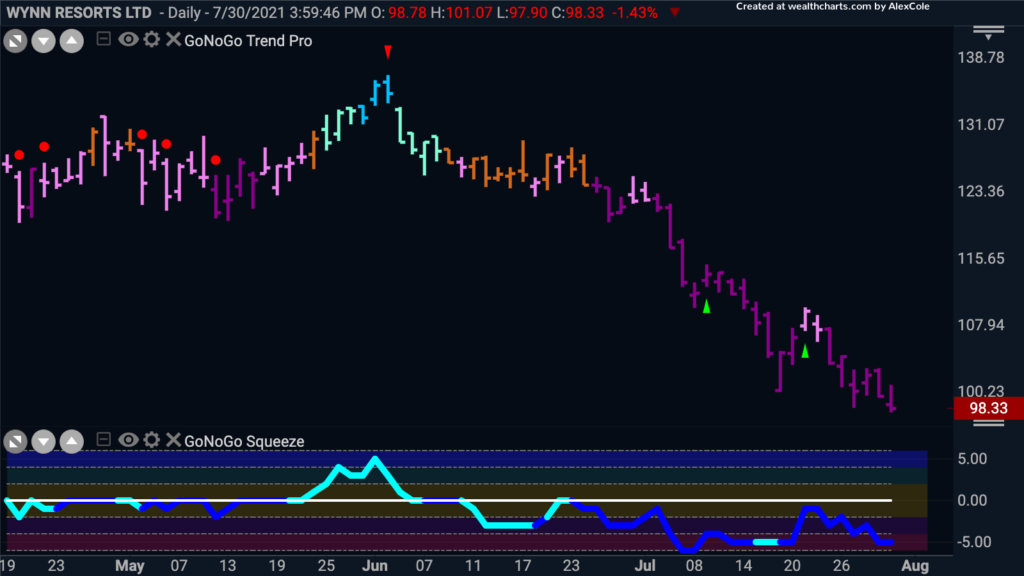
Wynn Resorts collects a majority of its revenues, up to 70% from its operations in Macau, China. As the bottom has fallen out of the Chinese stock market, WYNN stock has followed suit. The daily chart below shows price falling rapidly and the GoNoGo Oscillator finding resistance at the zero line and staying in negative territory on heavy volume. There seems to be no end in sight to the “NoGo” trend.
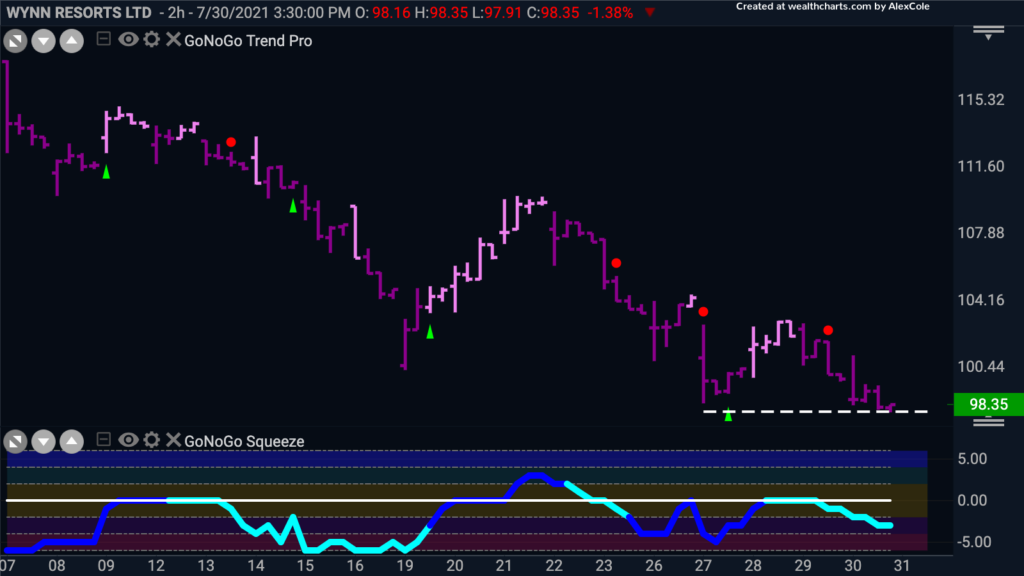
If we step down into a smaller time frame chart, in this case a 2hr GoNoGo Chart, we can look for possible entries to take advantage of the “NoGo” trend. We can see that every time the GoNoGo Oscillator has been turned away by the zero line and fallen back into negative territory we saw low risk NoGo Trend continuation red circles above price. We recently saw one and now price is at prior lows. We can look to see if it breaks below this level. If price pauses here, we may well see the GoNoGo Oscillator rally back to the zero line, in which case we can look to see if it is rejected again for a sign that the NoGo Trend is to continue.
Heavyweight Healthcare
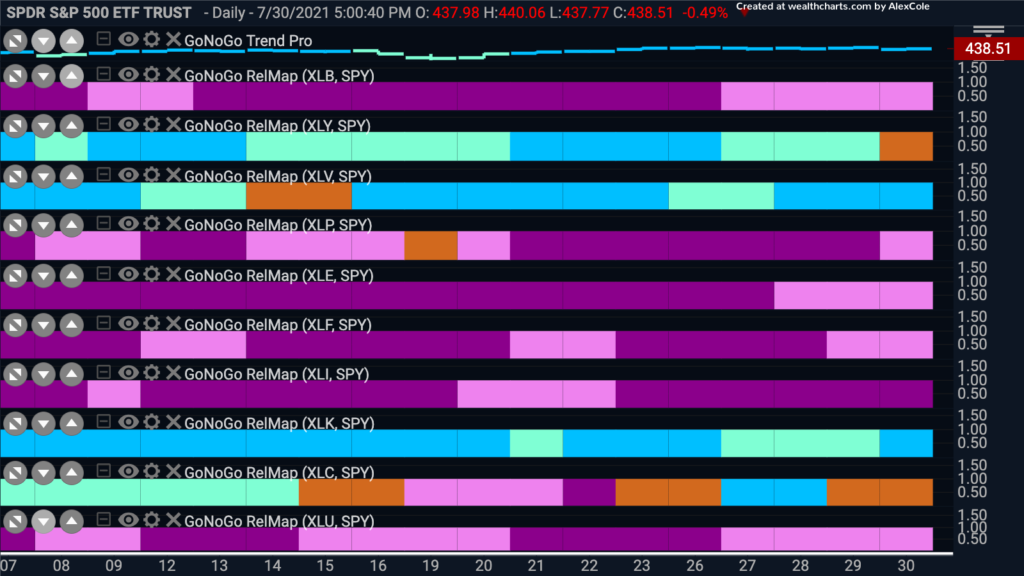
At the beginning of this issue of Flight Path, we mentioned that all five of the asset classes were in “Go” trends. That being said, we can turn to a GoNoGo Sector RelMap to see if there are opportunities to find those sectors that are outperforming relative to the broader index. If we look at the RelMap below, we can see that this leadership is currently coming from just a few sectors. While not in “NoGo” trends, communications and consumer discretionary have slipped into amber “Go Fish” bars, leaving technology ($XLK) and healthcare ($XLV) as the only two sectors in relative “Go” trends.
Counting on CVS to Catch Up
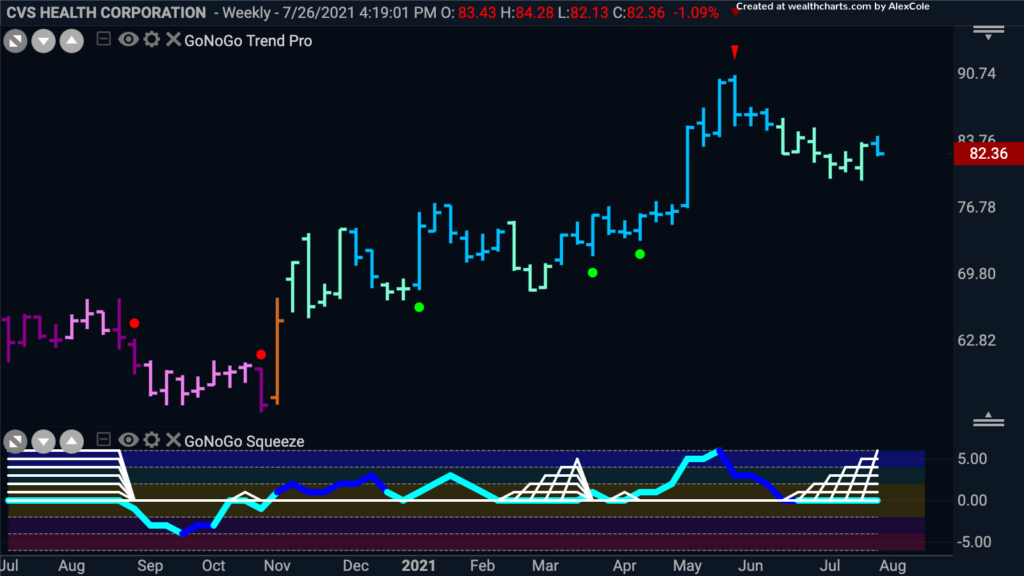
CVS is in a strong longterm “Go” trend. The chart below is the weekly chart of CVS prices with the GoNoGo Trend, GoNoGo Oscillator and GoNoGo Squeeze applied. Since rallying out of the post pandemic collapse last year, we see a series of higher highs and higher lows with the GoNoGo Oscillator finding support at the zero line. Currently, price has corrected to the extent that it has caused the GoNoGo Oscillator to ride the zero line allowing the climbing grid of the GoNoGo Squeeze to rise to extremes. All else being equal, we can expect the GoNoGo Oscillator to find support at the zero line and price to try to set a higher high.
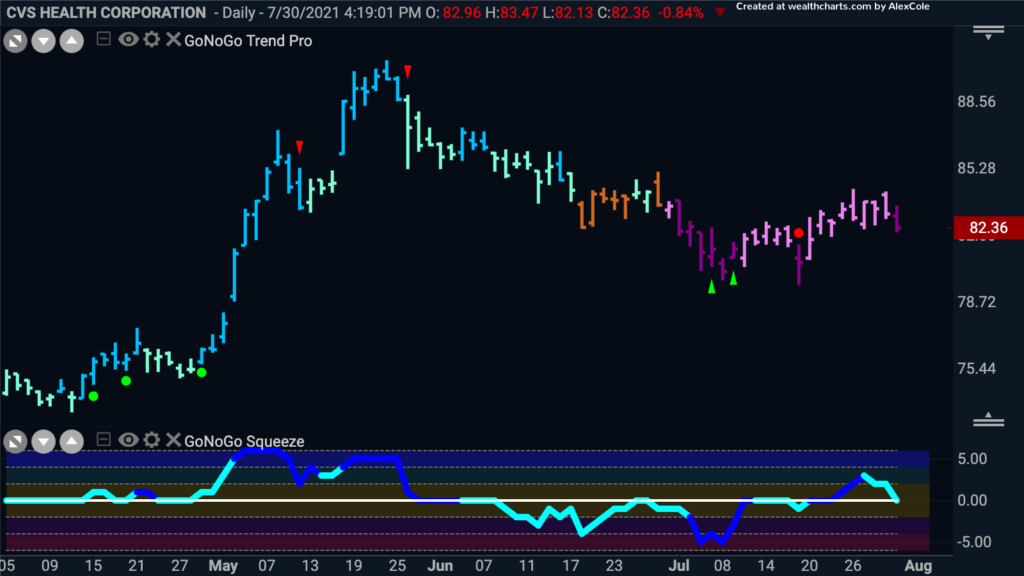
That being the case, we can look at the daily chart. The GoNoGo Trend is a “NoGo” as price has corrected heavily since the May highs. Recently though, the GoNoGo Oscillator has seen enough positive momentum to break above the zero line. Right now, it is testing the zero line from above. If it is able to find support here, we may see price rally further, and a potential change to a “Go” trend.
