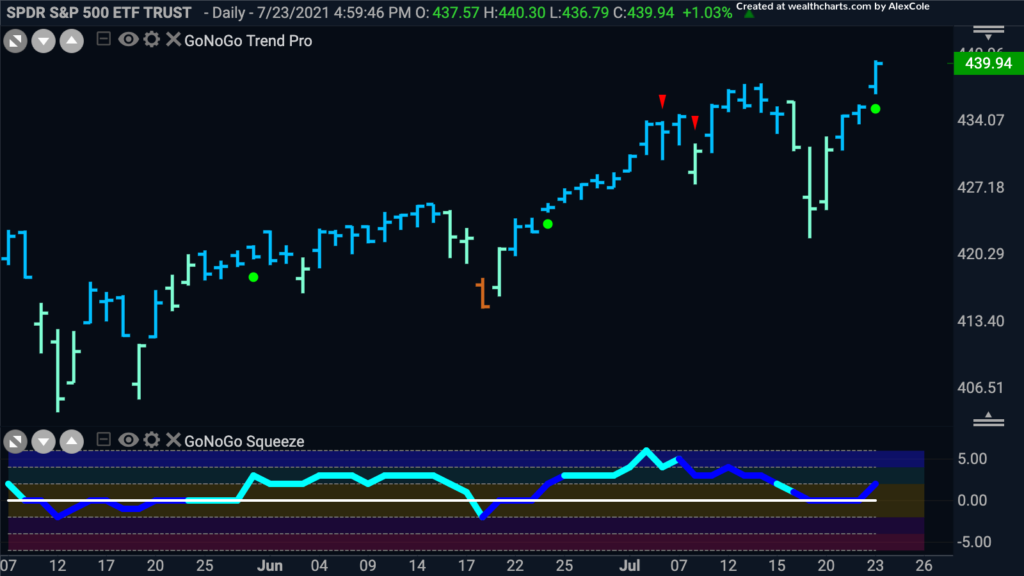
Incredibly, the S&P 500 made a new high this week. How many could have predicted the rally we had this week after the precipitous drop we saw on Monday. But that is indeed what happened. The GoNoGo Chart below shows that the GoNoGo Trend continues to be a “Go” and is painting strong blue bars. The GoNoGo Oscillator, which had been riding the zero line on heavy volume seems to have found support and as it rallied off the zero line we see a Go trend continuation green circle under the most recent price bar.
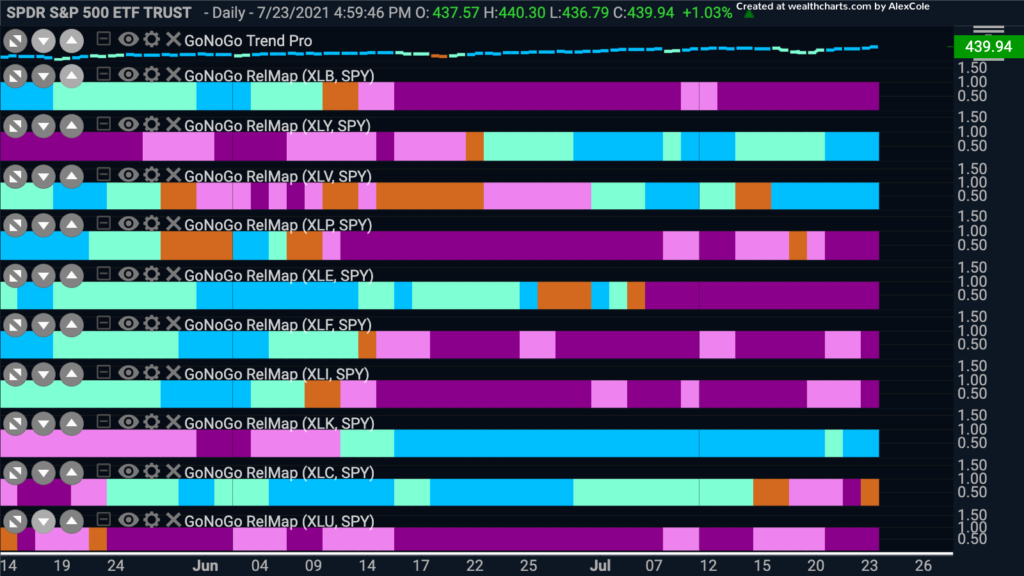
Sector Leaders Driving Gains
As the S&P 500 makes another high let’s take a look at the GoNoGo RelMap to see which sectors are driving gains. This week there are 3 sectors that are in relative “Go” trends. The discretionary, healthcare and technology sectors are in strong “Go” trends. Some analysts might be concerned that on a relative basis there is not broader leadership among the sectors. However, the charts tell us where the trends are and so we can look at the leaders and laggards for opportunities to generate alpha.
Discretionary Trend Continuation
The consumer discretionary sector rallied hard this week and on a relative basis we can see that the trend is a strong “Go” and that the GoNoGo Oscillator is riding the zero line on heavy volume. The chart below is a ratio chart of $XLY/$SPY which allows us to see the relative strength of the discretionary sector with the GoNoGo Trend and Oscillator applied. We will need to see the GoNoGo Oscillator find support at the zero line and rally into positive territory. If that happens then we may well see price make an attempt at a higher high.
Timing Tesla
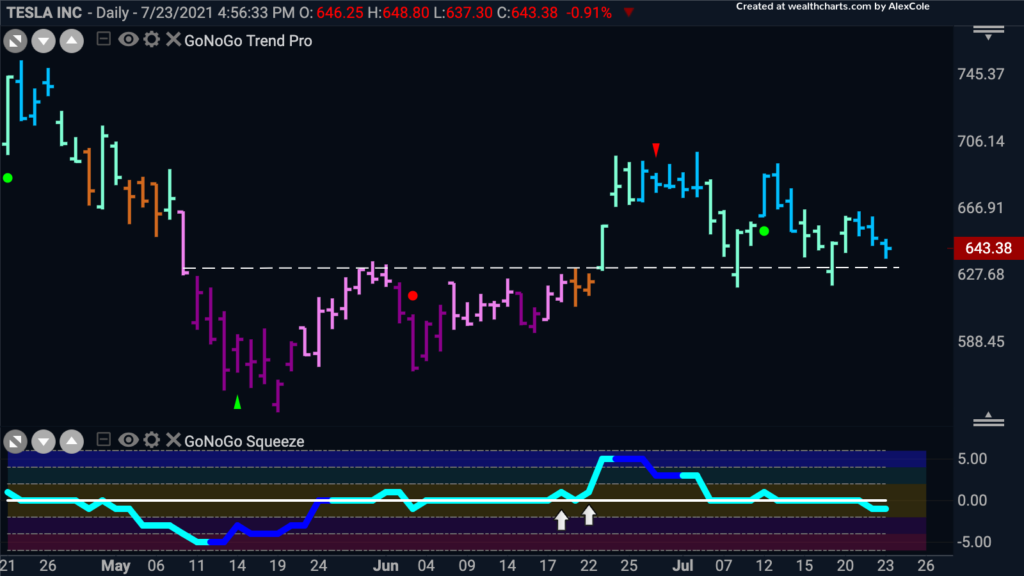
As a massive company in the discretionary sector, let’s take a look the GoNoGo chart of $TSLA to see if there is an opportunity for taking a position. The “Go” trend was identified toward the end of June but has struggled to make gains as price has moved sideways . We see the concept of polarity playing out in this chart as price seems to be finding support at levels that used to be resistance during the corrective price action of May and June.The GoNoGo Oscillator which helped suggest the upcoming “Go” trend when it broke above the zero line in mid June is now struggling with the zero line and has actually dipped into negative territory. For a rally in price, we will need to see the GoNoGo Oscillator back above the zero line, this would lead to a Go Trend Continuation green icon under price.
Technology to move higher?
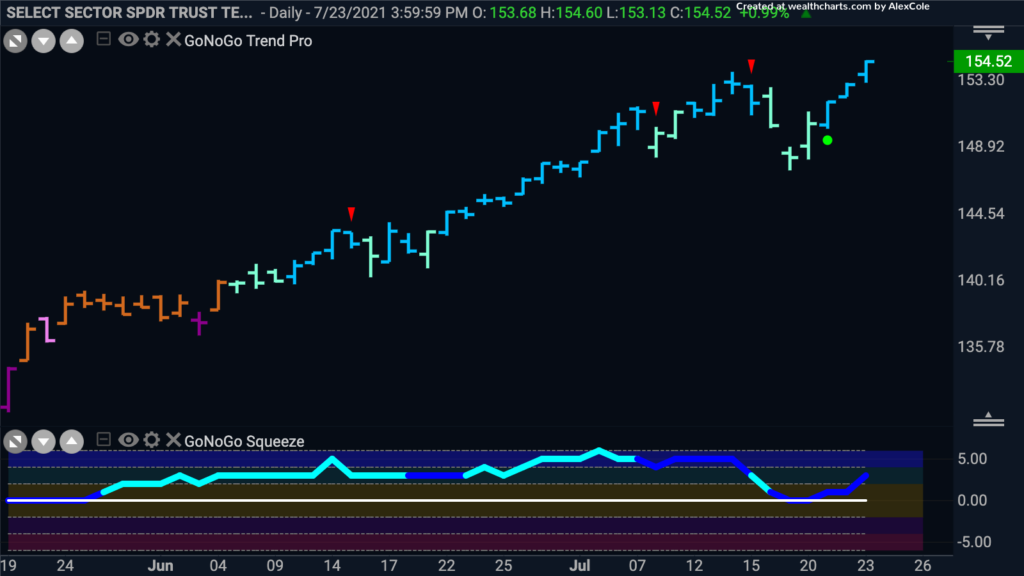
As we saw from the Sector RelMap, technology is also leading the S&P 500 higher. The GoNoGo chart below shows that the trend is a “Go” as price paints strong blue bars. If we look to the GoNoGo Oscillator we can see that it recently found support at the zero line on heavy volume that indicated prices would resume the movement higher. Price is at a new high and the GoNoGo Oscillator is in positive territory but not yet overbought suggesting there may be more room to run.
Apple on the Attack
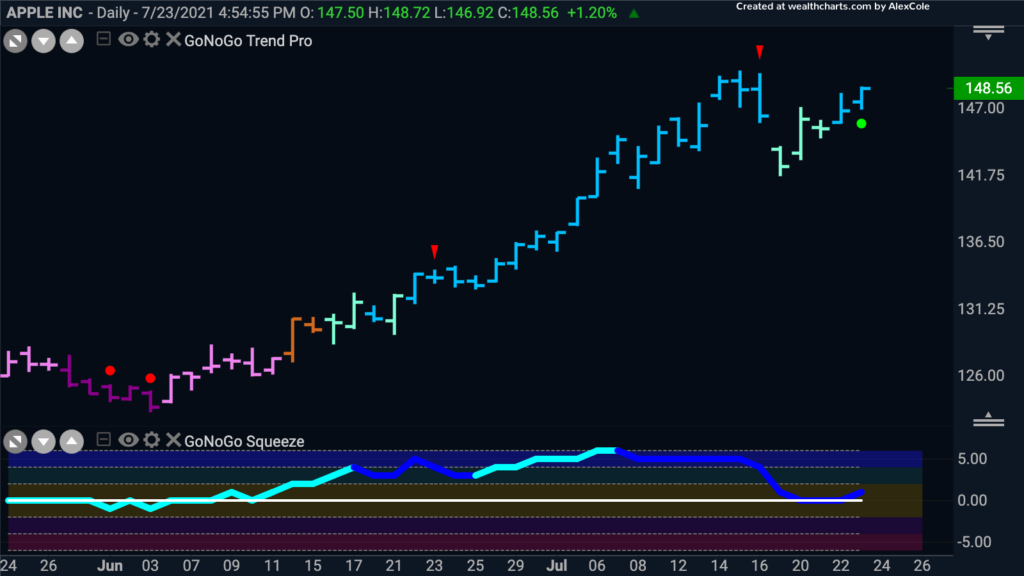
On first glance, it may seem that the GoNoGo chart of $AAPL is much like the $XLK chart above. There are however a few subtle differences. Price is not yet at a new high, and the GoNoGo Oscillator was stuck on the zero line for longer, only moving into positive territory with the current bar. If $AAPL is going to play catch up and fall in line with the discretionary sector we can look for price to set a new high in the next few days.
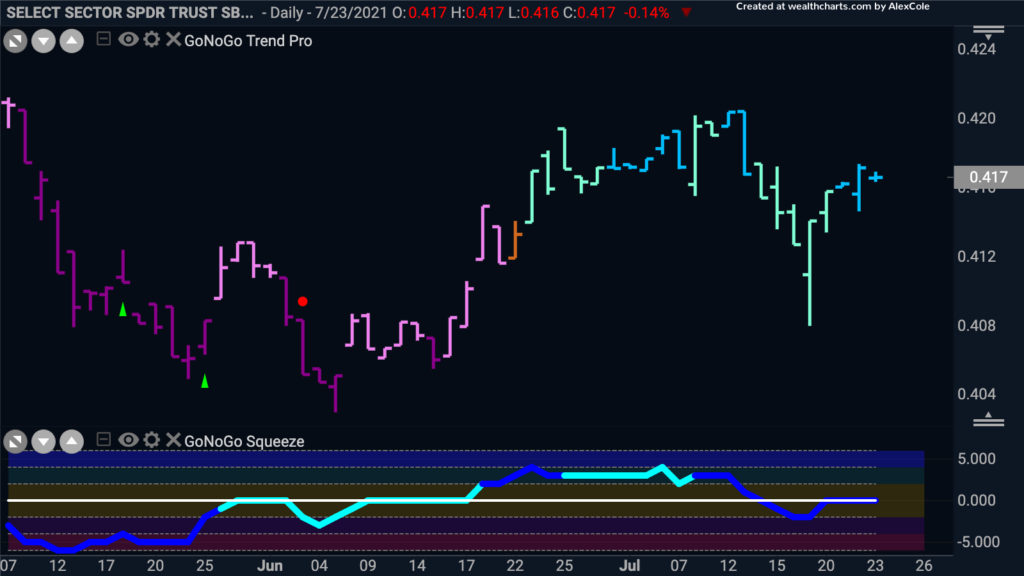
Materials Moving lower
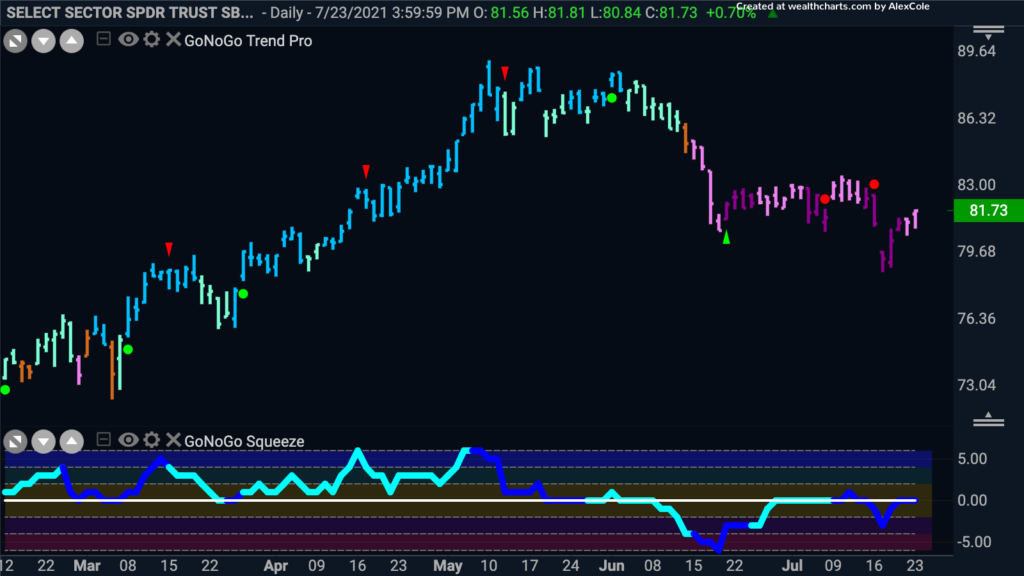
Countering the leadership displayed by the discretionary, technology and healthcare sectors, some of the sectors that are underperforming the broader market are the same sectors that had their moment in the sun when the re-opening of the economy was the theme of the moment. The chart below shows the materials sector, $XLB. The GoNoGo Trend identified a change in trend back in early June when the NoGo trend was identified. Since the first move lower the GoNoGo Oscillator has been below zero and finding resistance at that level. Currently, it is testing the zero line from below and we will look to see if it gets turned away again. If so, we could see another leg lower for the materials sector.
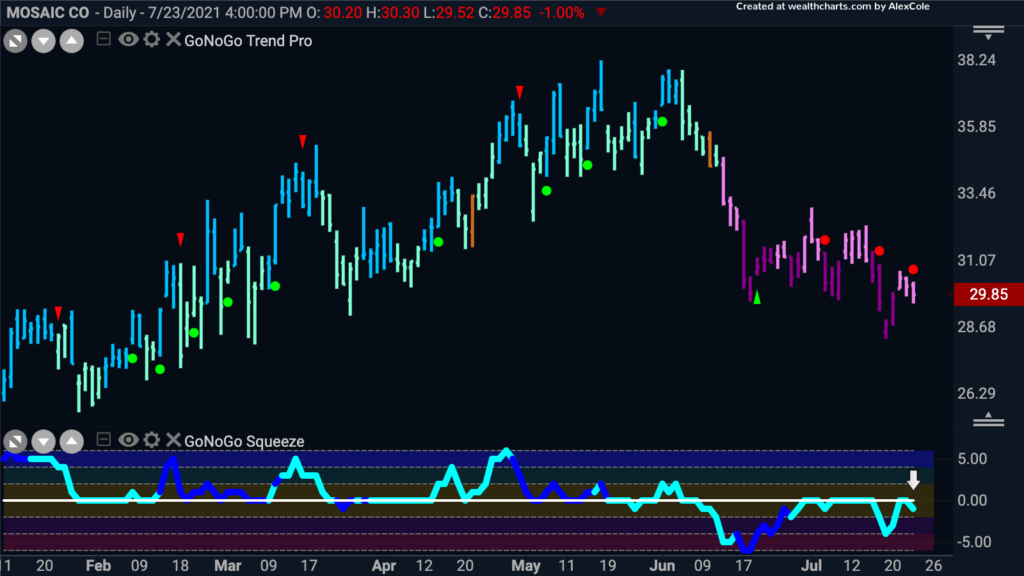
Mosaic to Melt down?
Mosaic is a producer and distributor of crop nutrient products and in the materials sector. If we are looking for a stock play to capitalize on the weakness of the sector let’s look at the chart below. The GoNoGo Trend is a “NoGo” and early this week price made a new low. The GoNoGo Oscillator has been below the zero line since the “NoGo” trend was flagged, and has provided several low risk entry opportunities to participate in the move. The most recent bar has triggered another NoGo trend continuation as the GoNoGo Oscillator has been turned away by the zero line from below. This could lead to a new leg down in price if the NoGo trend in price proves to be healthy.
