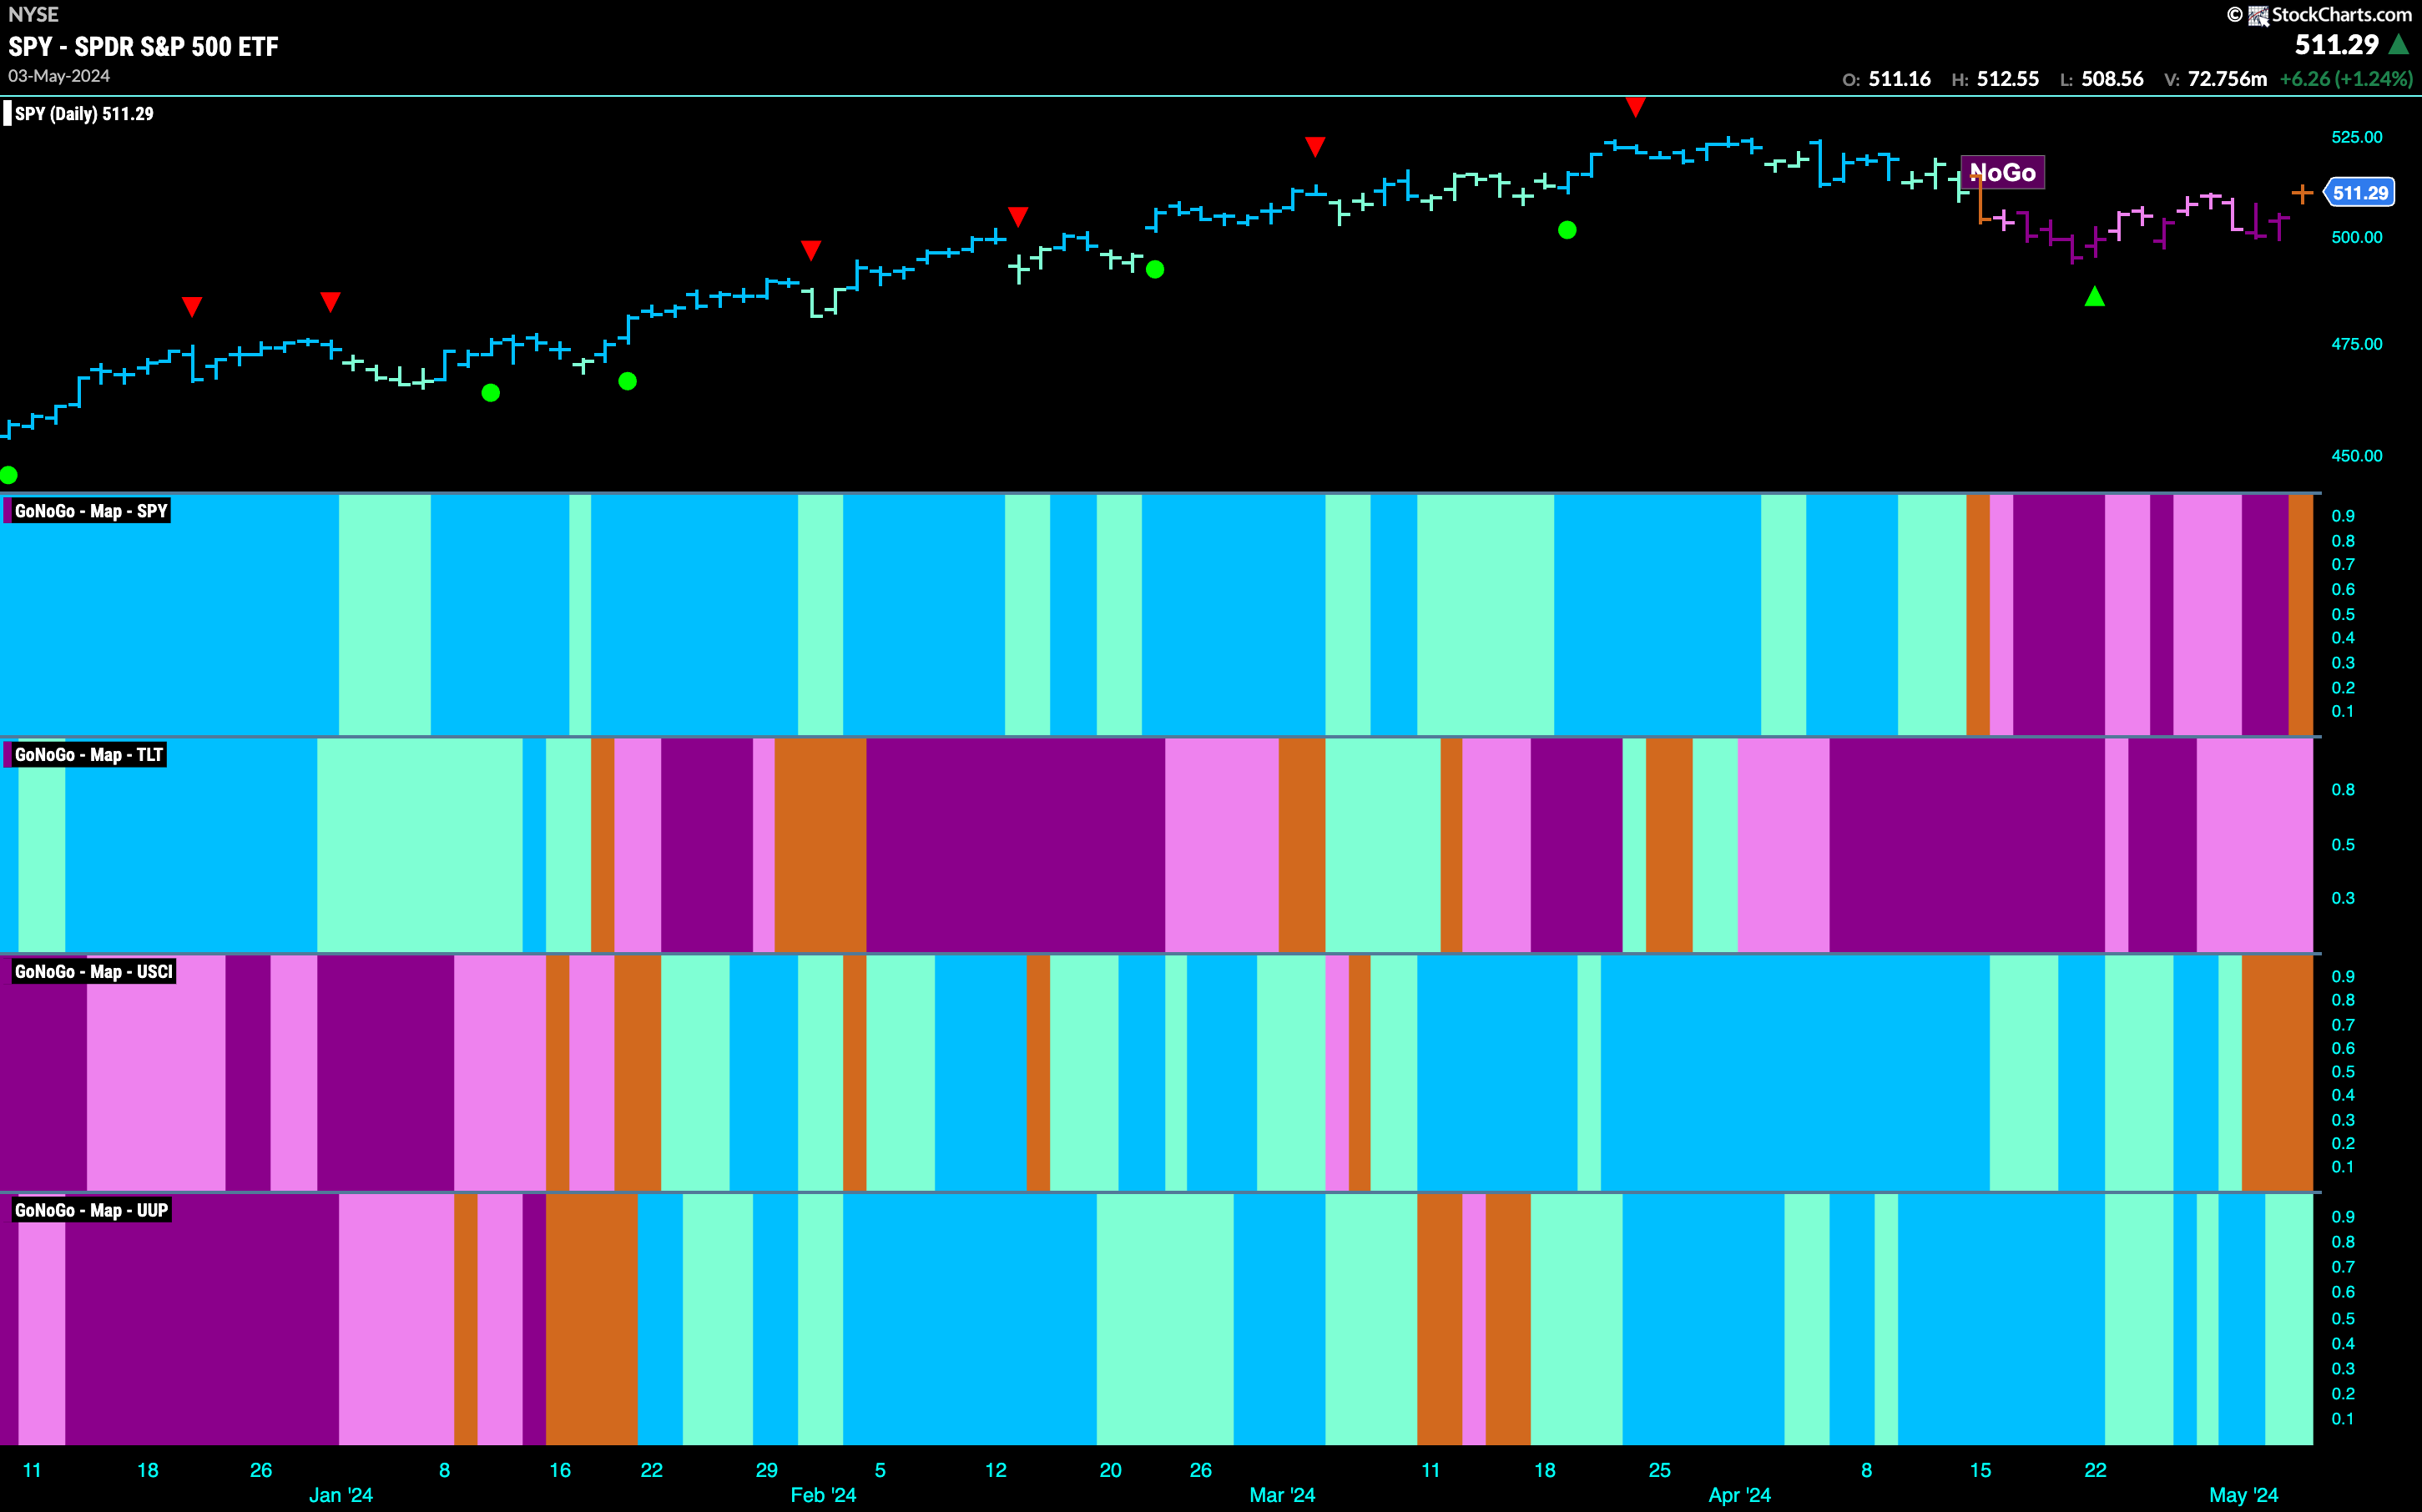
Good morning and welcome to this week’s Flight Path. The equity “NoGo” trend struggled this week as prices climbed from lows. We see an amber “Go Fish” bar as the market tries to understand the trend. GoNoGo Trend paints pink “NoGo” bars for treasury bond prices and commodity prices enter a period of uncertainty with consecutive amber “Go Fish” bars. The dollar, currently, is the only asset that is in a “Go” trend as we see the indicator painting weaker aqua bars. Lots of uncertainty this week!
Markets Uncertain of Equity Trend
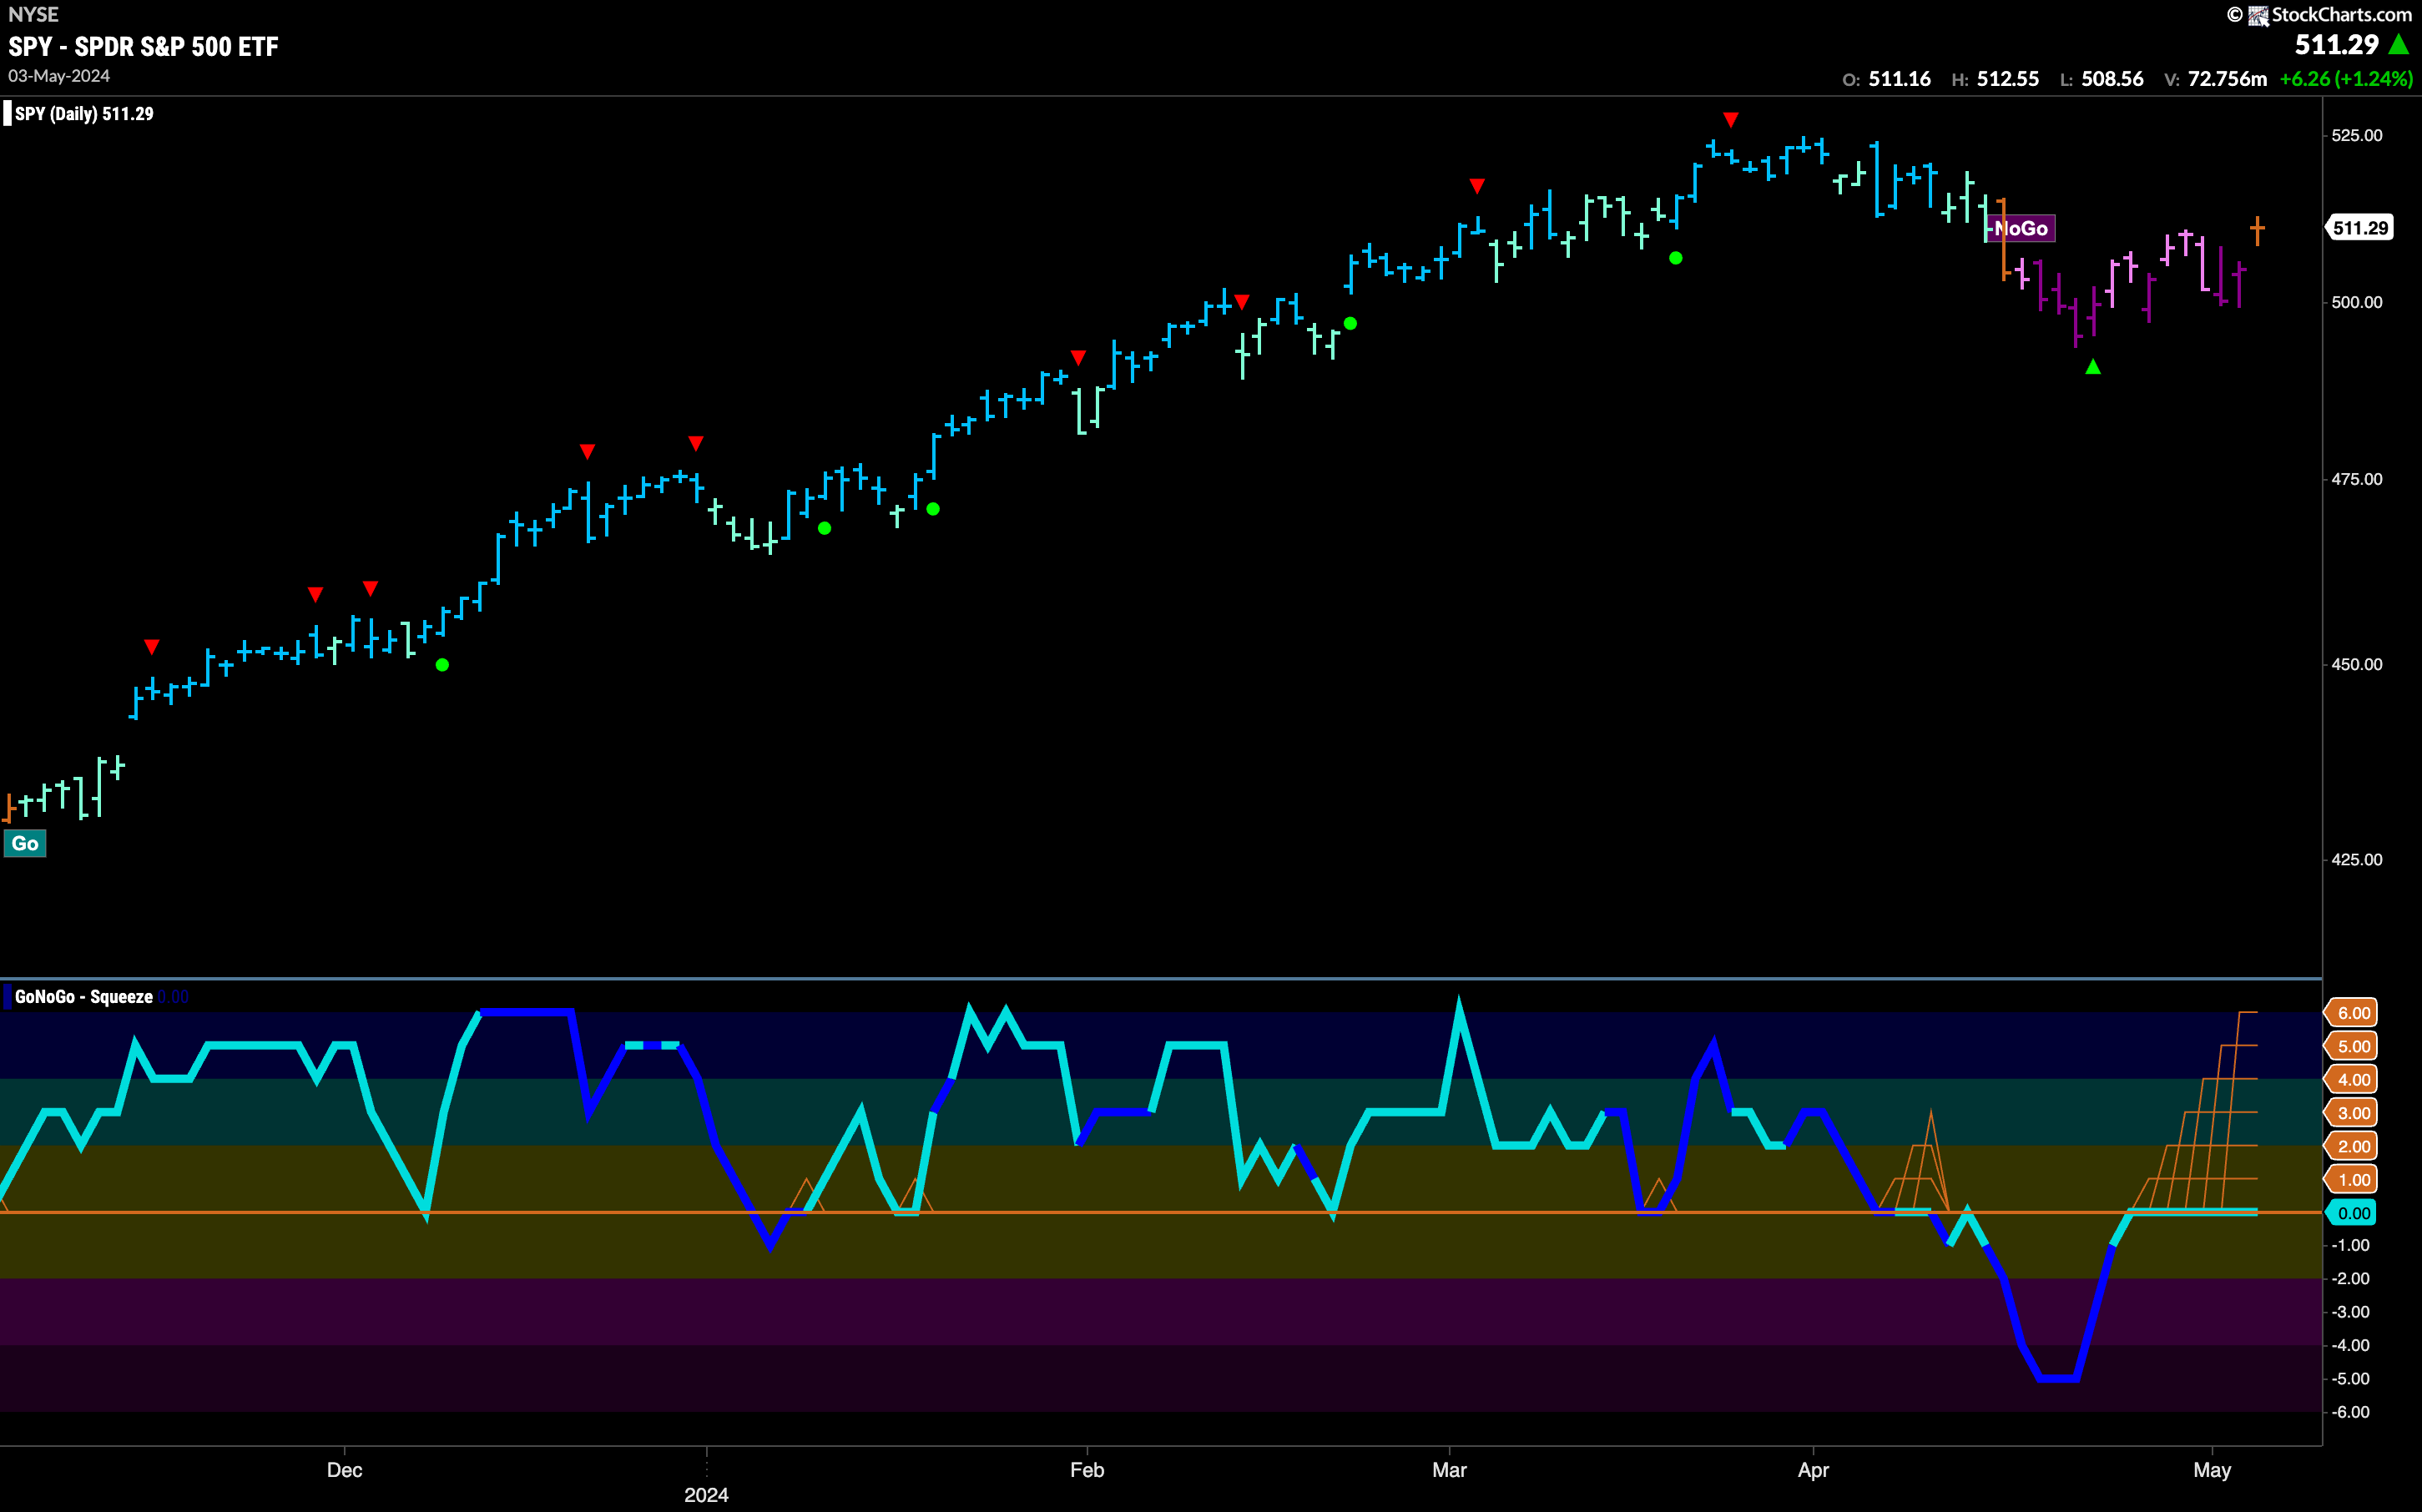
The “NoGo” trend gave way to an amber “Go Fish” bar at the end of the trading week. We know, that when the amber bar is painted it is because there are not enough criteria being met behind the scenes for the GoNoGo Trend indicator to identify a trend in either direction, Go or NoGo. Adding to the feeling of uncertainty is the candle itself. A doji candle is when the open and close price are the same or very close, and this is what we saw on Friday. There was no clear winner between the bulls and the bears. No surprise then, when we look at the oscillator panel we see the GoNoGo Oscillator riding the zero line and a Max GoNoGo Squeeze in effect. This is a visual representation of the tug of war between buyers and sellers at this level. We will watch closely to see in which direction the Squeeze is broken, as this will help us determine price direction.
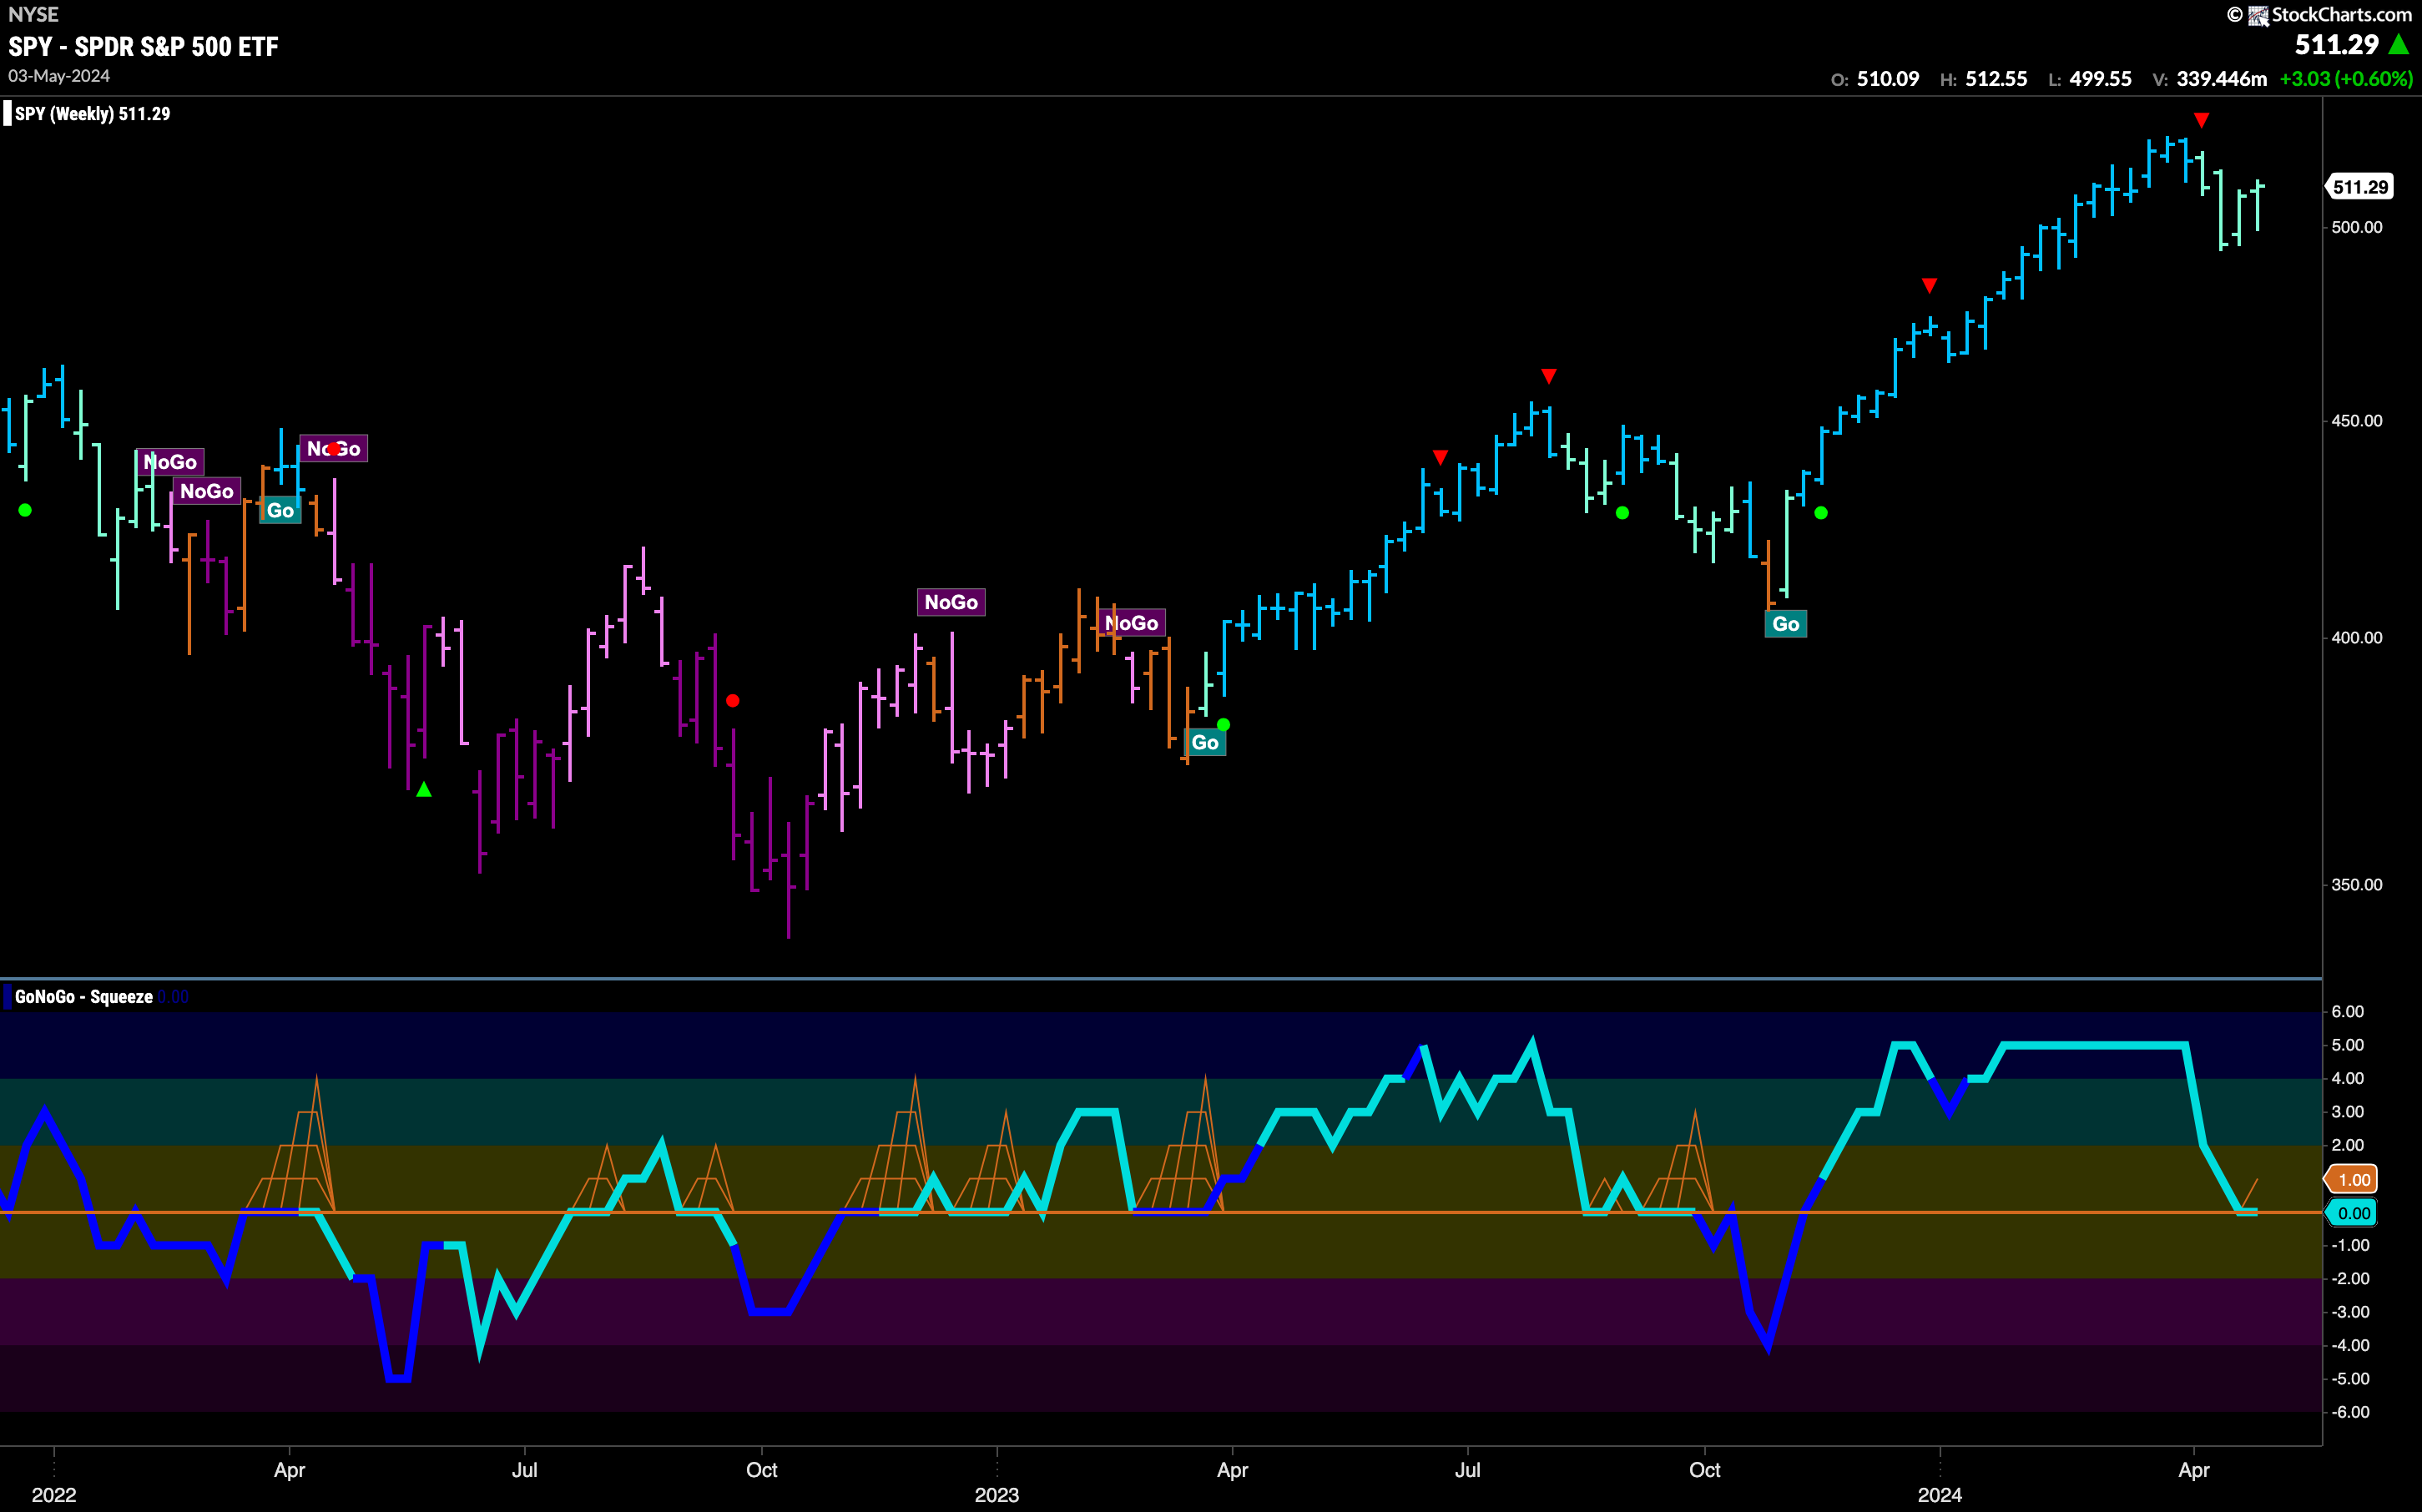
The larger weekly chart shows that we are at an inflection point here as well. We have seen a 4th consecutive weak aqua “Go” bar as price seems to have set a new higher low. GoNoGo Oscillator has crashed over the last month to test the zero line from above where we will watch to see if it finds support. If it does, we will see signs of trend continuation on the price chart. A break below the zero line would signal a more drawn out correction.
Rates Fall After Consolidation
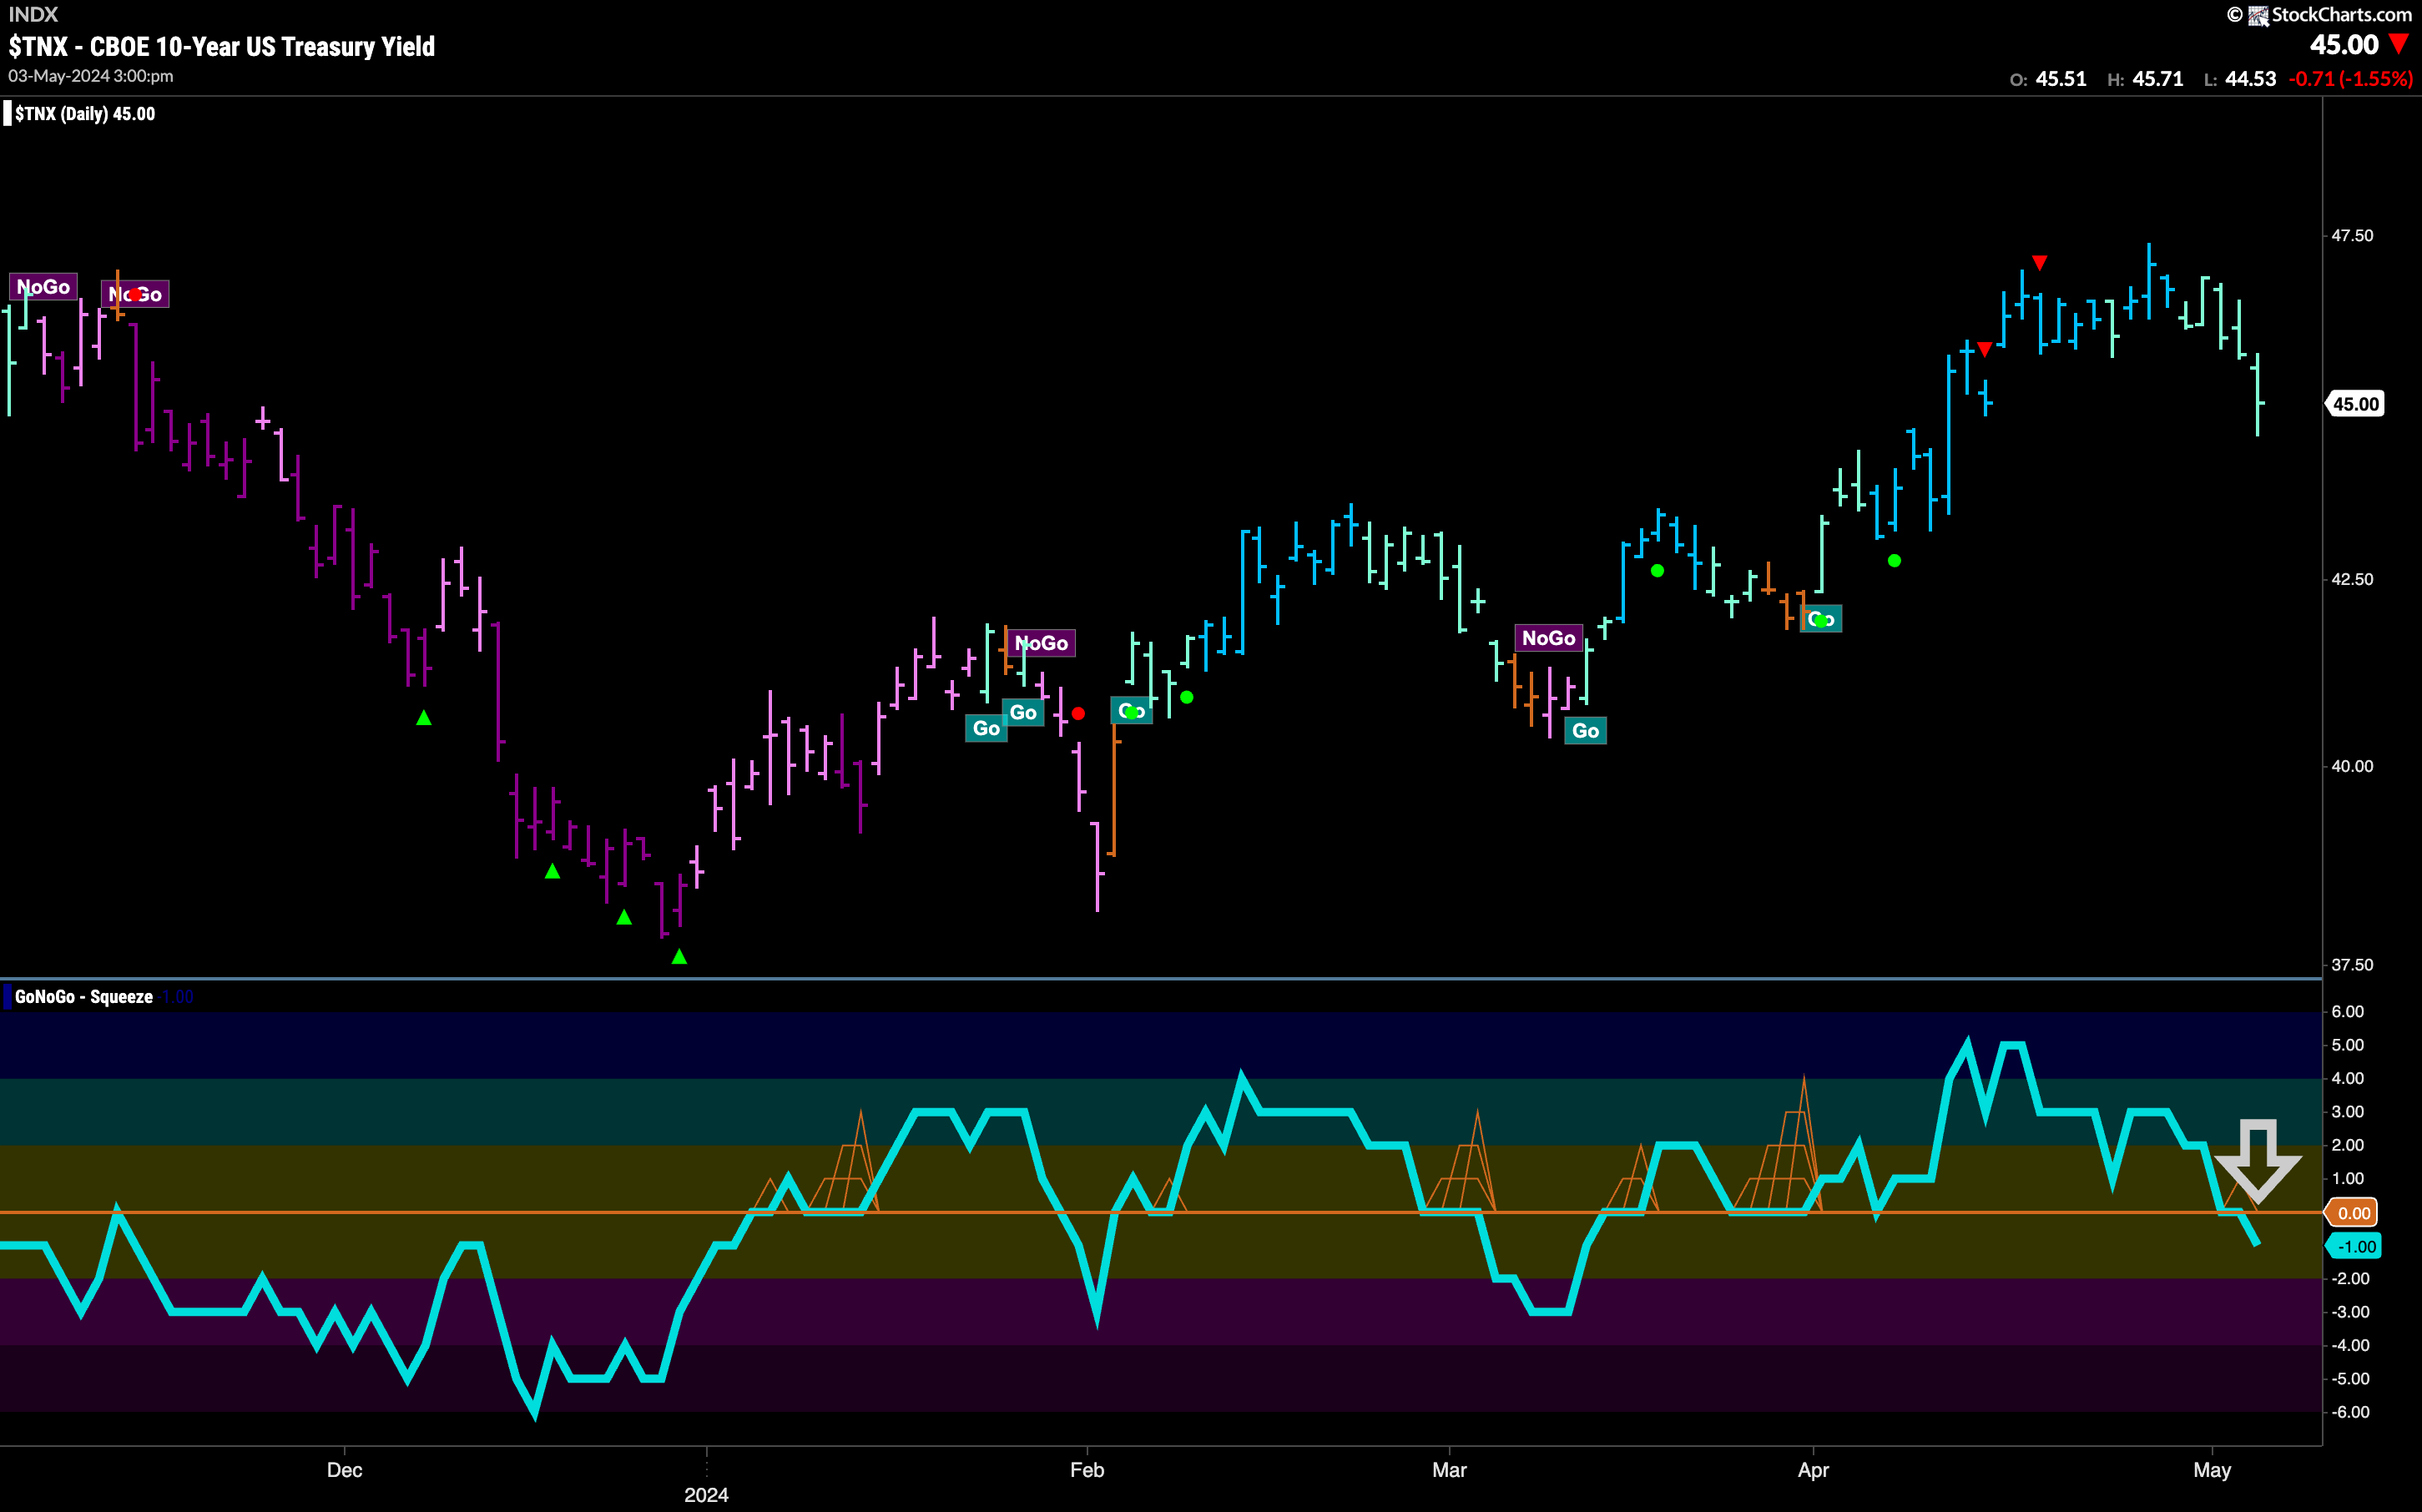
This entire week saw GoNoGo Trend paint weaker aqua “Go” bars as price fell from its most recent high. We turn our eye to the oscillator panel and see that GoNoGo Oscillator has failed to find support at that level. As it dips its nose into negative territory we can say that momentum is out of step with the “Go” trend and we will watch to see if it sinks further into negative territory. If it does, then we may see trend change above. A rally back to the zero line would likely allow the “Go” trend to continue in the short term.
Dollar Also Falls
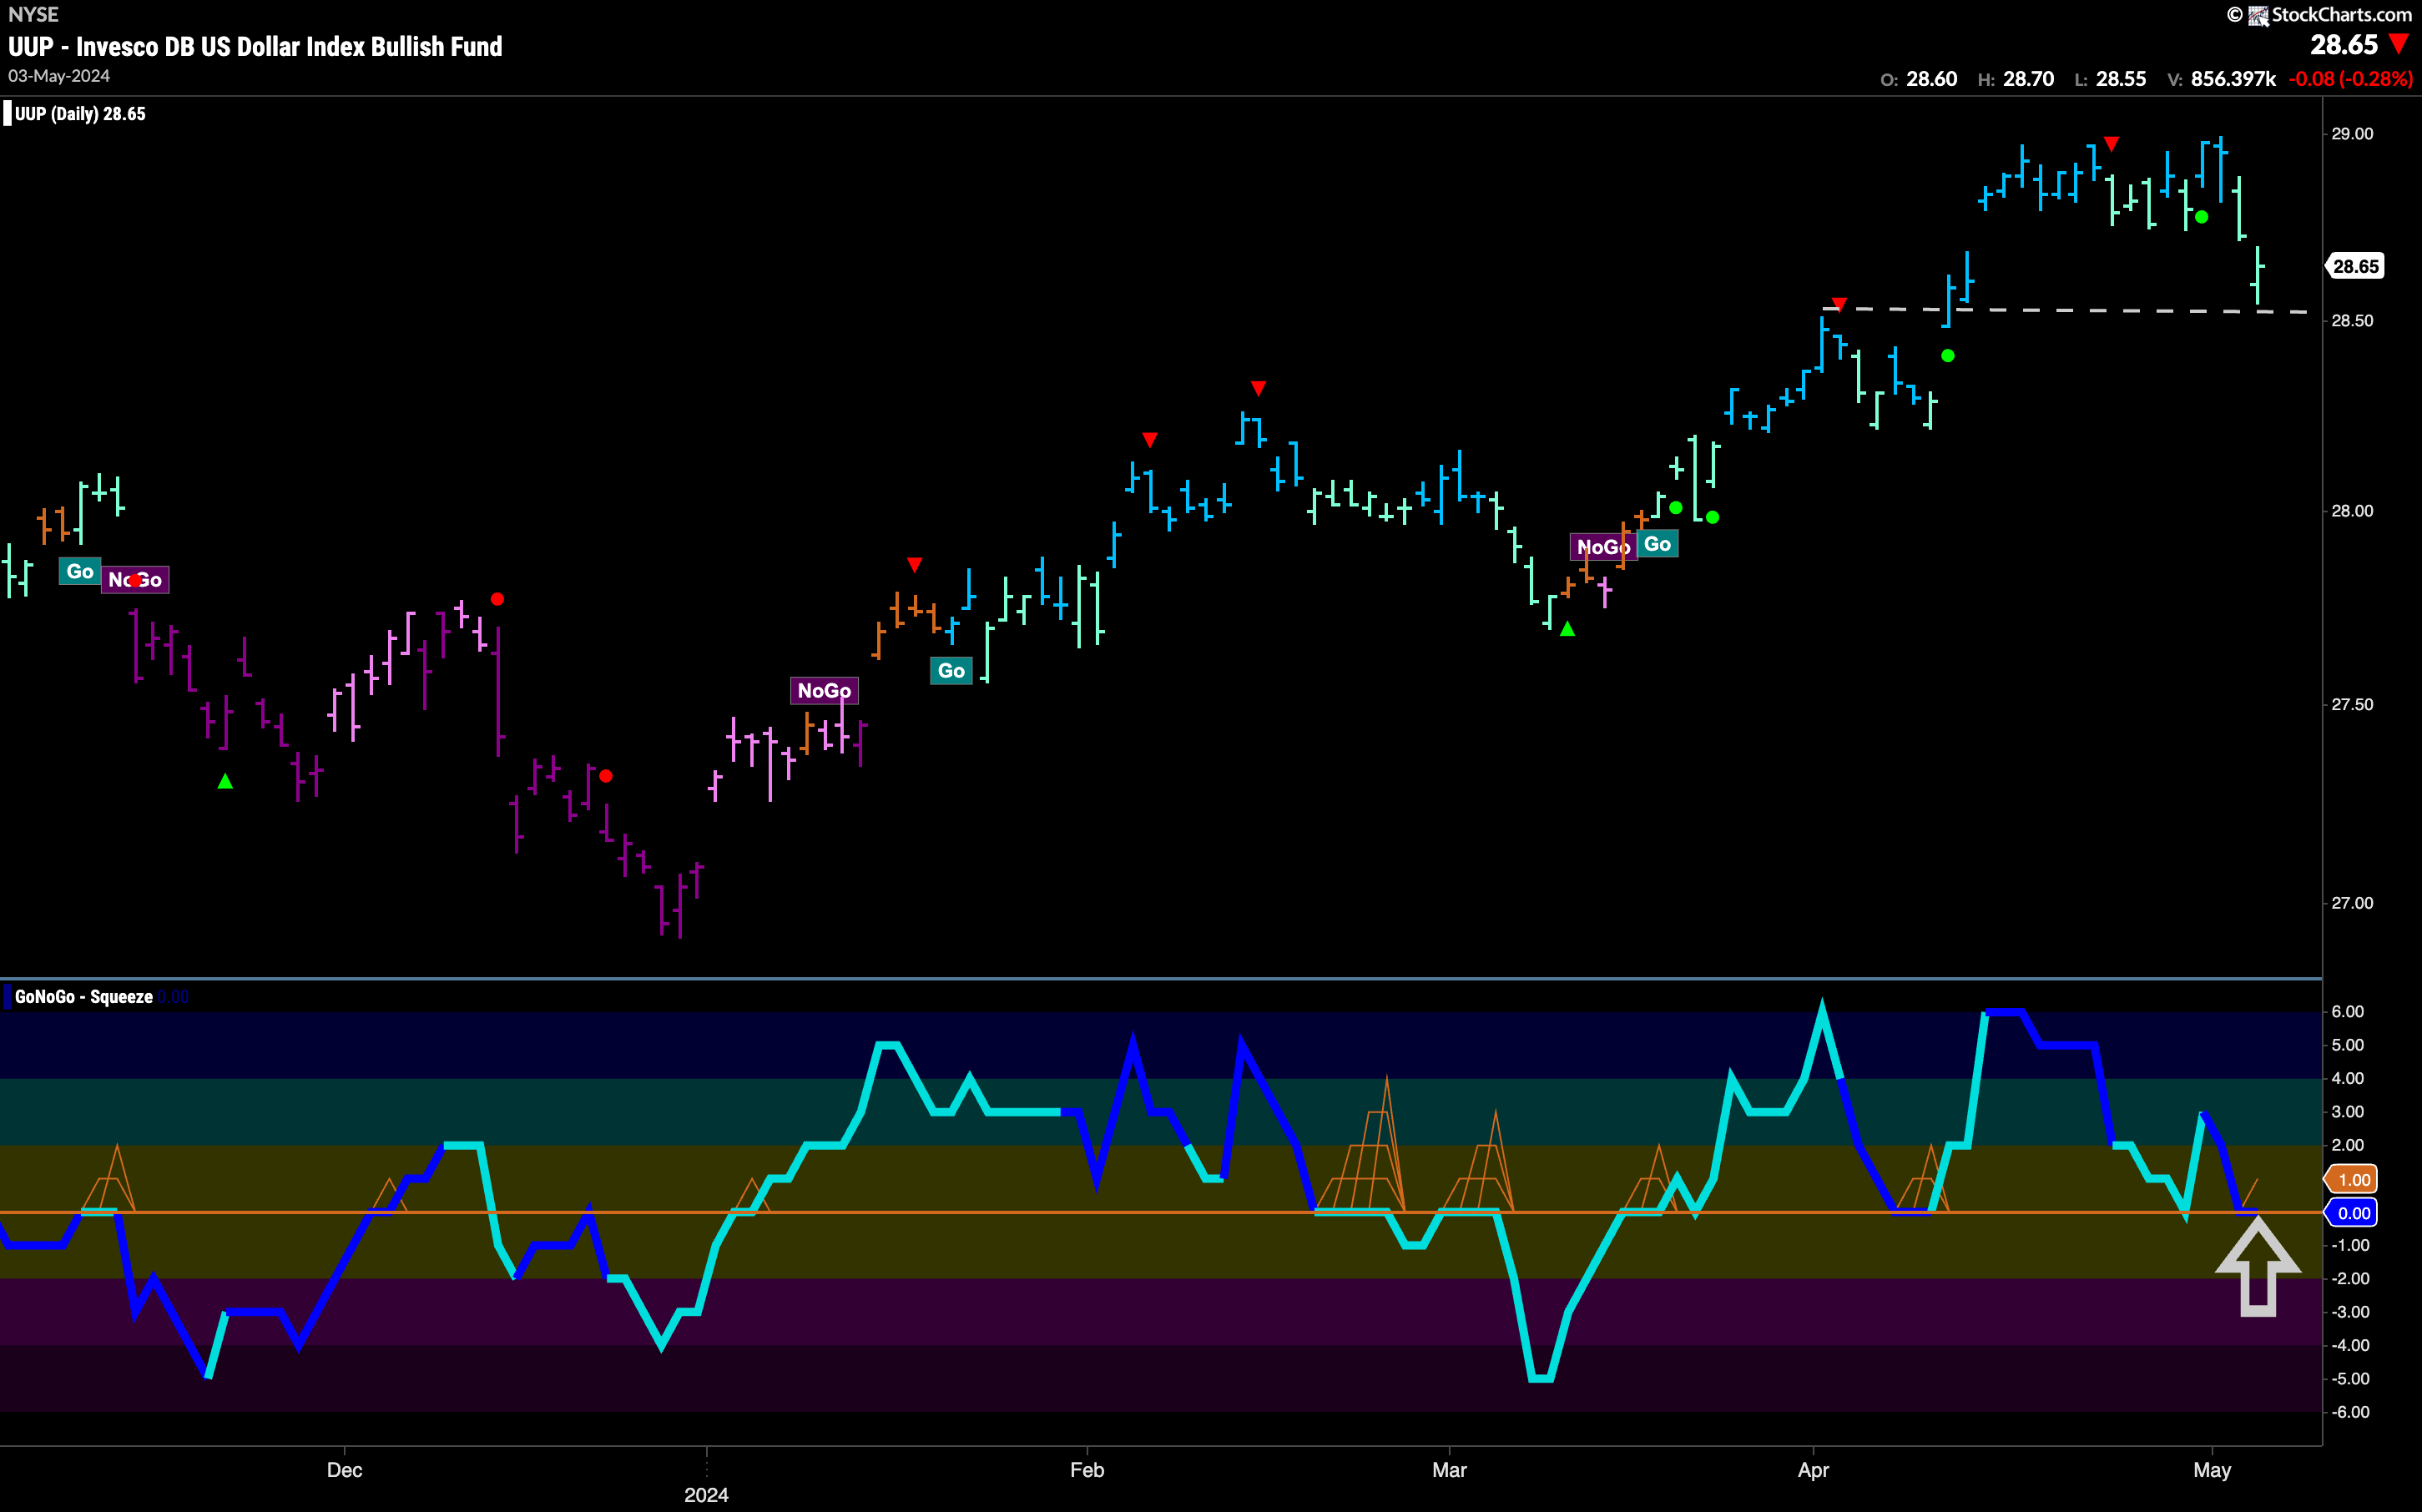
The dollar was able to remain in a “Go” trend but its trend status is precarious as well. After moving sideways for several weeks (not wholly surprising after the Go Countertrend Correction Red Arrow) we saw price fall sharply on Friday. We now will watch to see if support is found at this level. We can see that it is possible as price has fallen to prior highs. GoNoGo Oscillator has also fallen to retest the zero line on heavy volume. For the “Go” trend to continue, we will need to see the Oscillator rally back into positive territory.
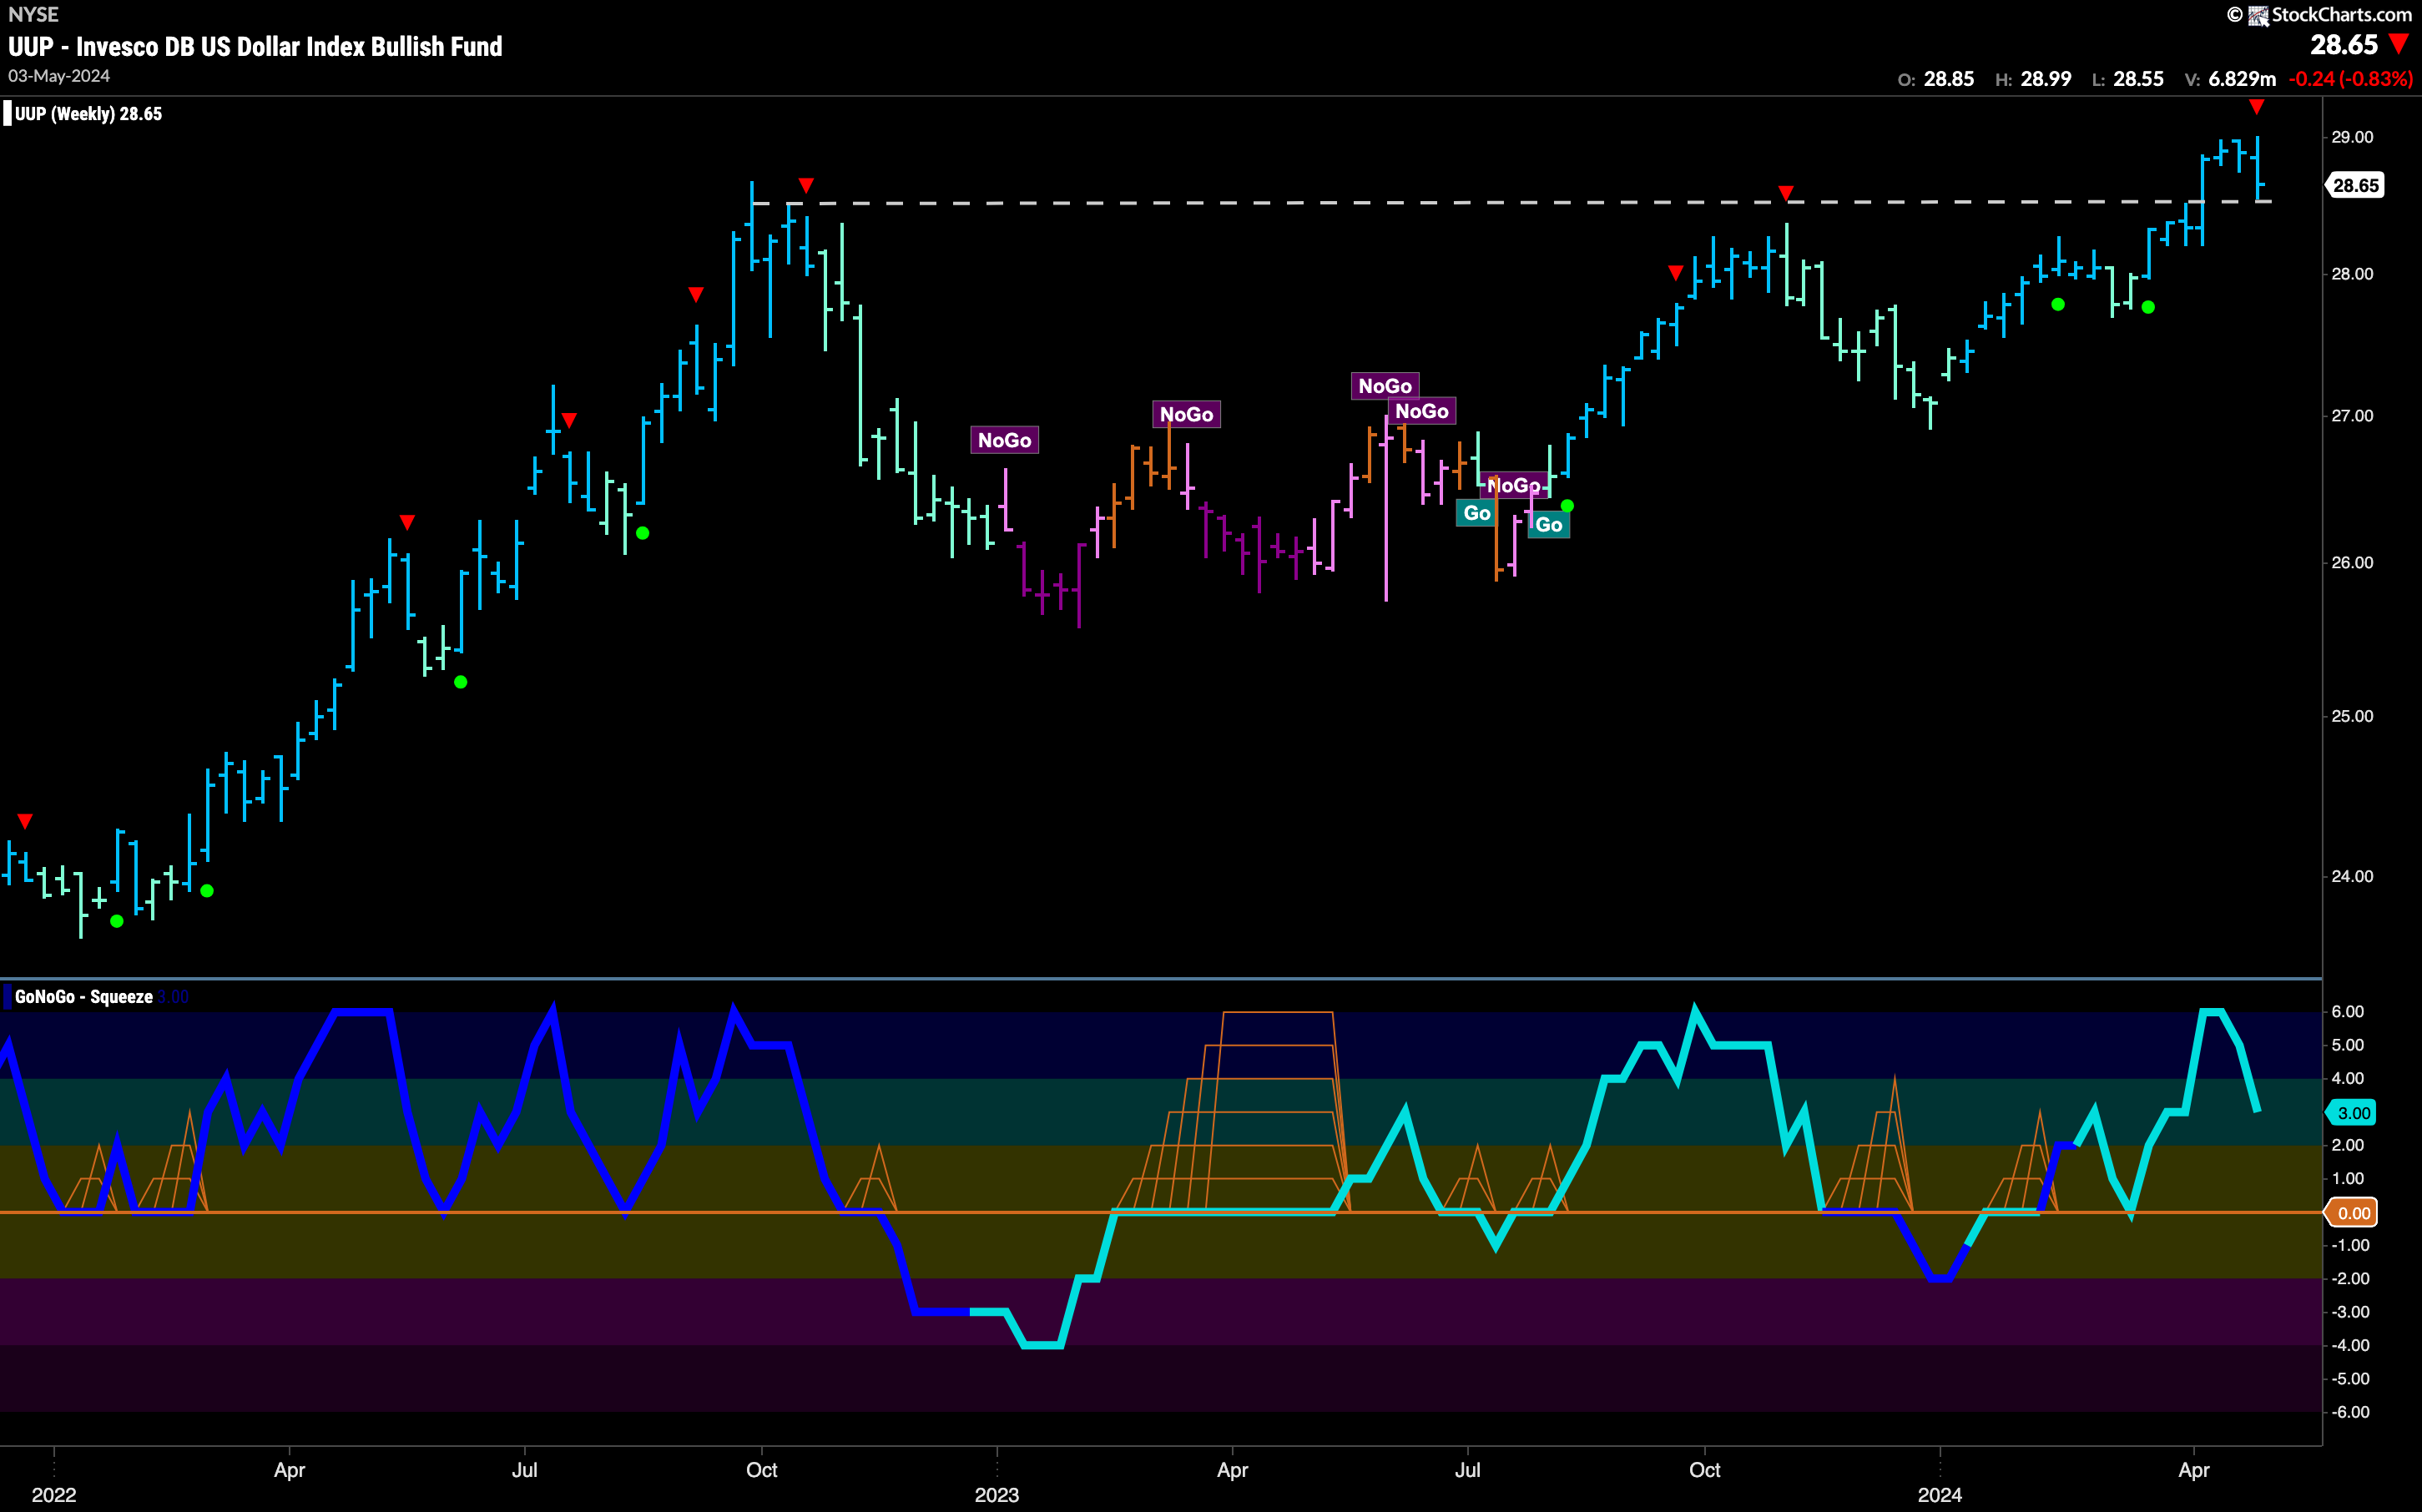
The weekly chart shows that we have clearly set a new higher high. The pull back on the daily chart hasn’t done too much structural damage here. We still see that GoNoGo Trend is painting strong blue “Go” bars and GoNoGo Oscillator is in positive territory but no longer overbought. On the price panel we do see a Go Countertrend Correction Icon which could signal a struggle for prices to go higher in the short term.
Oil Fell Fast
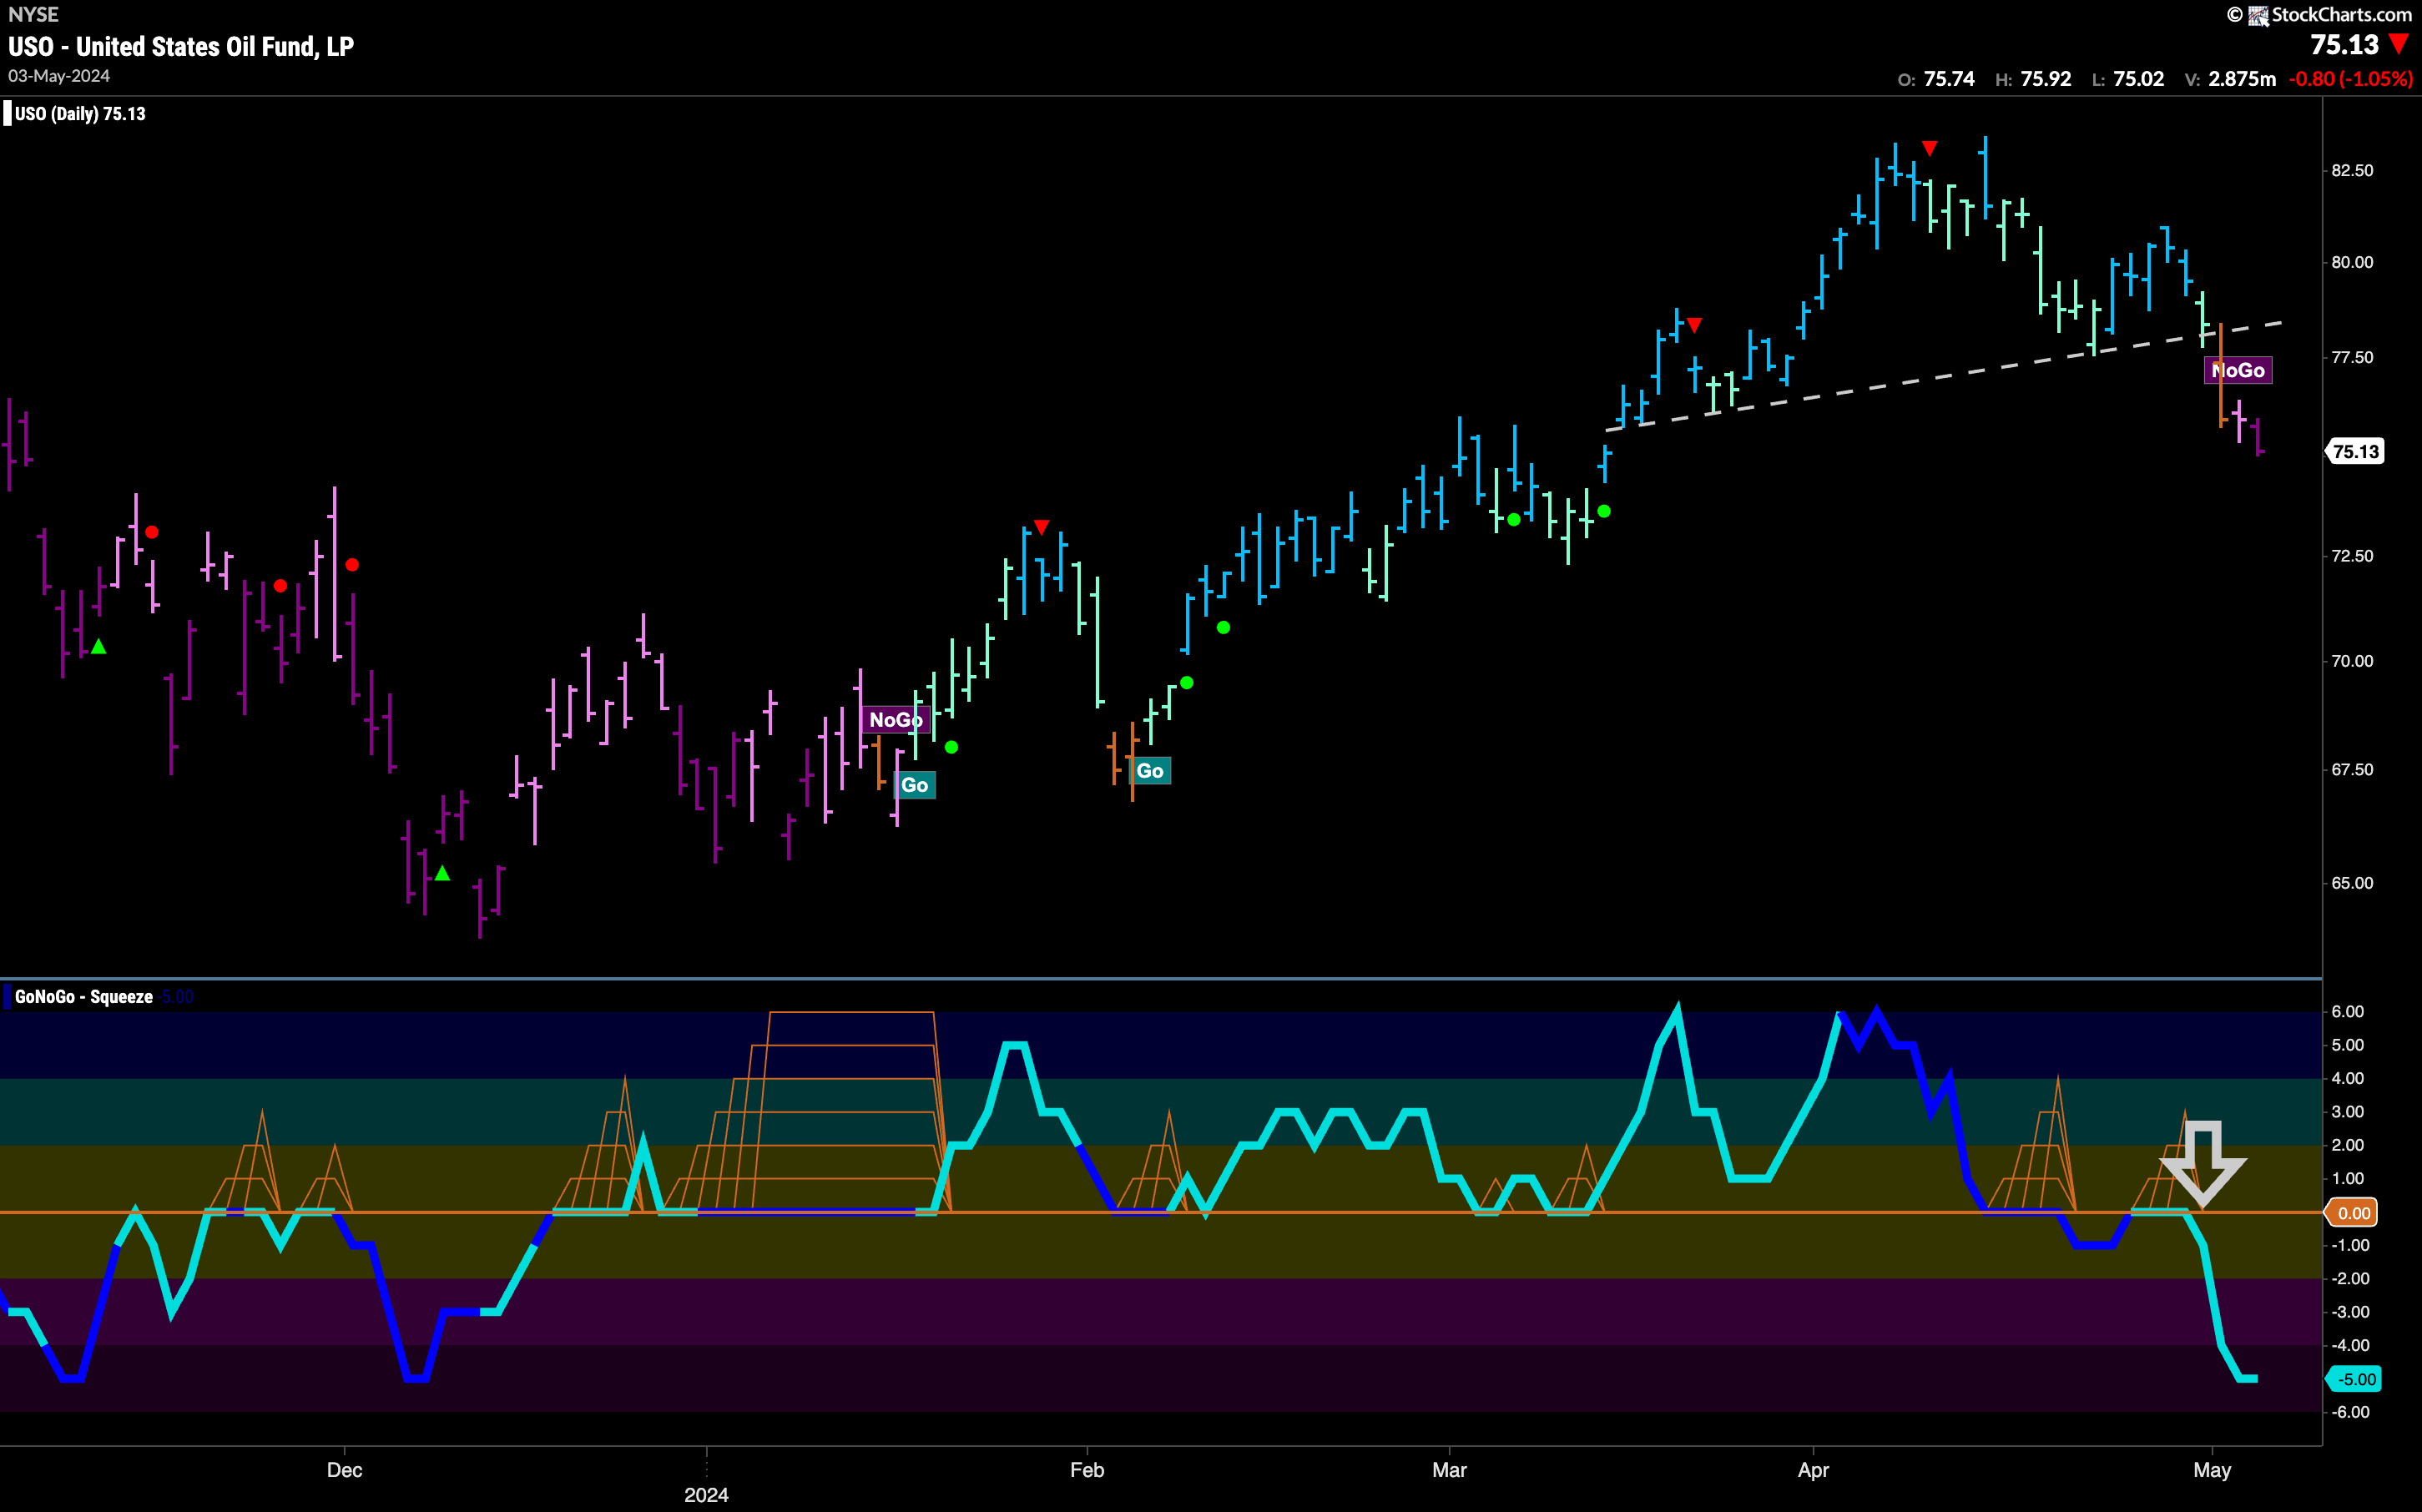
Oil prices fell fast after appearing to stabilize last week. Now we see what looks to be a head and shoulders pattern as price broke the rising neckline on an amber “Go Fish” bar as it fell out of its “Go” trend. Now, GoNoGo Trend paints a second “NoGo” bar and a stronger purple one at that. GoNoGo Oscillator has been strongly rejected at the zero line and has plummeted to oversold territory. We will look for price to take a pause perhaps but the “NoGo” trend is now in session.
Gold Continues to Weaken
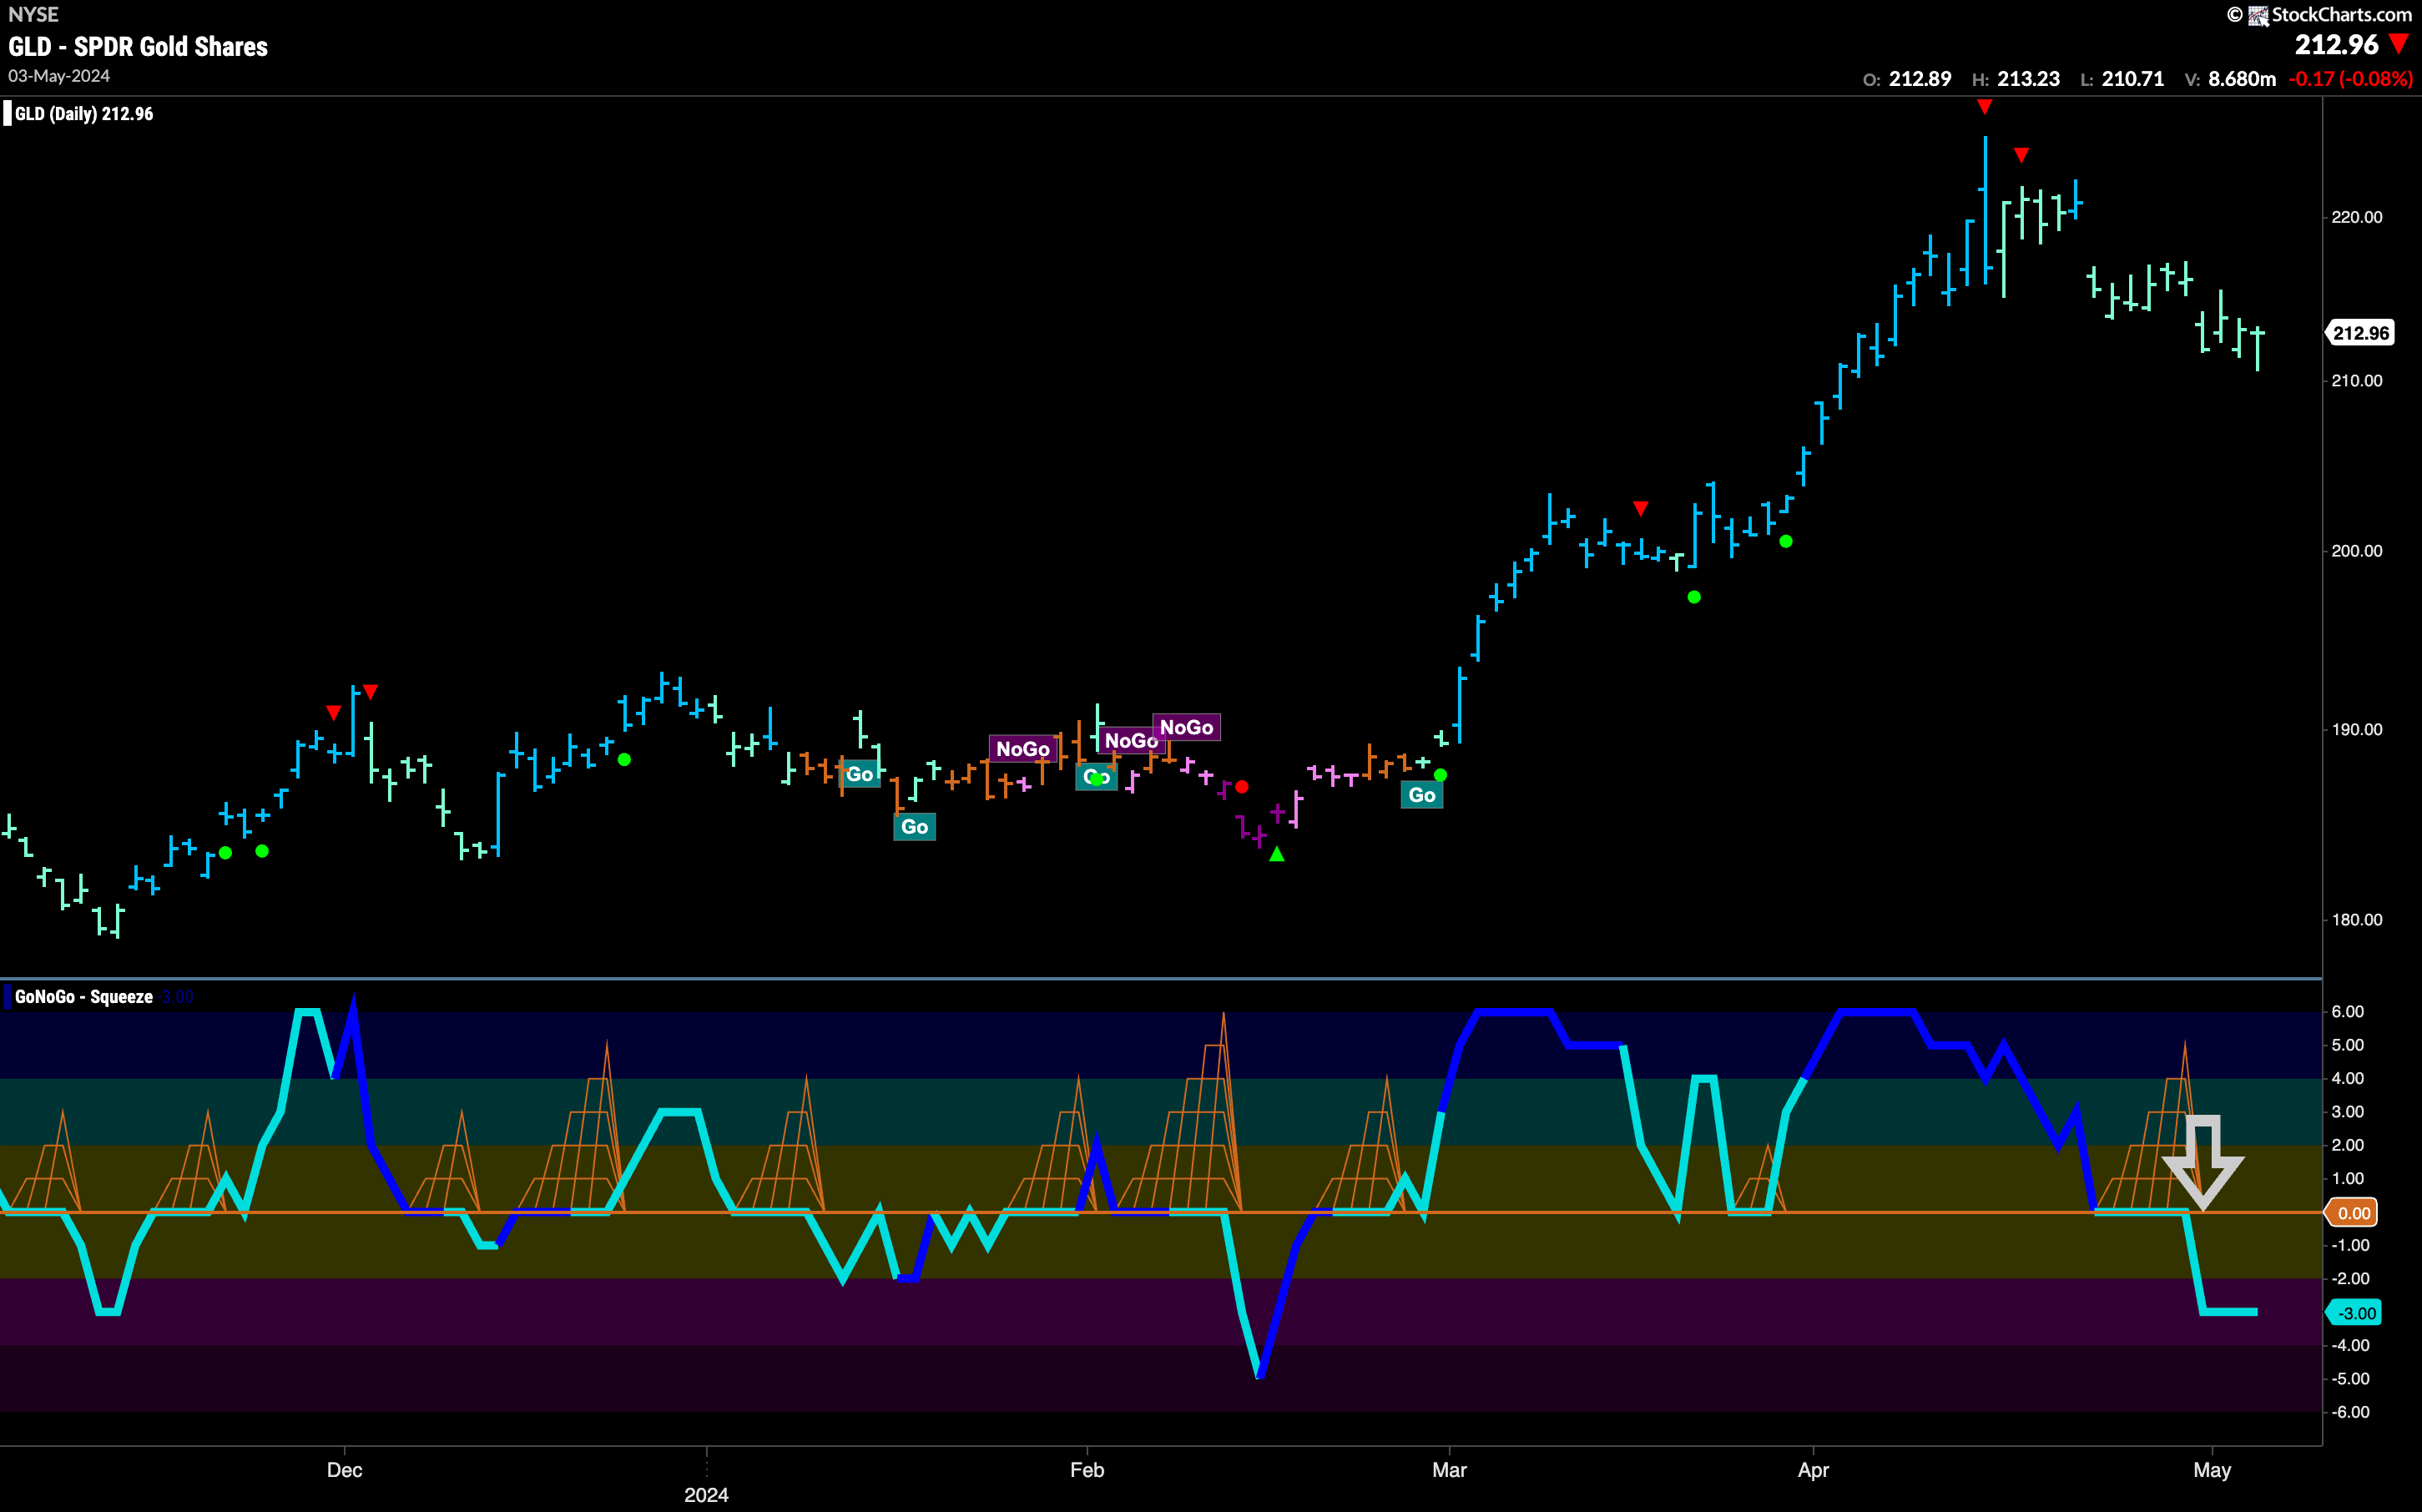
$GLD saw a second week dominated by an uninterrupted string of weaker aqua “Go” bars. The “Go” trend is hanging on by a thread on the daily chart. GoNoGo oscillator is in negative territory and stabilizing at a value of -3 after having broken out of a small GoNoGo Squeeze a few bars ago. At some point, price will have to find its feet or we will see a trend change in the upper panel.
The monthly chart shows that so far this month there has been no gains made on last month’s high price and in fact there has not been too much movement at all. We see that GoNoGo Oscillator is at an overbought extreme and so we will watch to see when the indicator falls back into neutral territory. That will give us a Go Countertrend Correction Icon (red arrow) on the price chart and we will expect price to struggle to go higher in the short term. Given the extrend of the recent rise, we will look for support above prior highs. 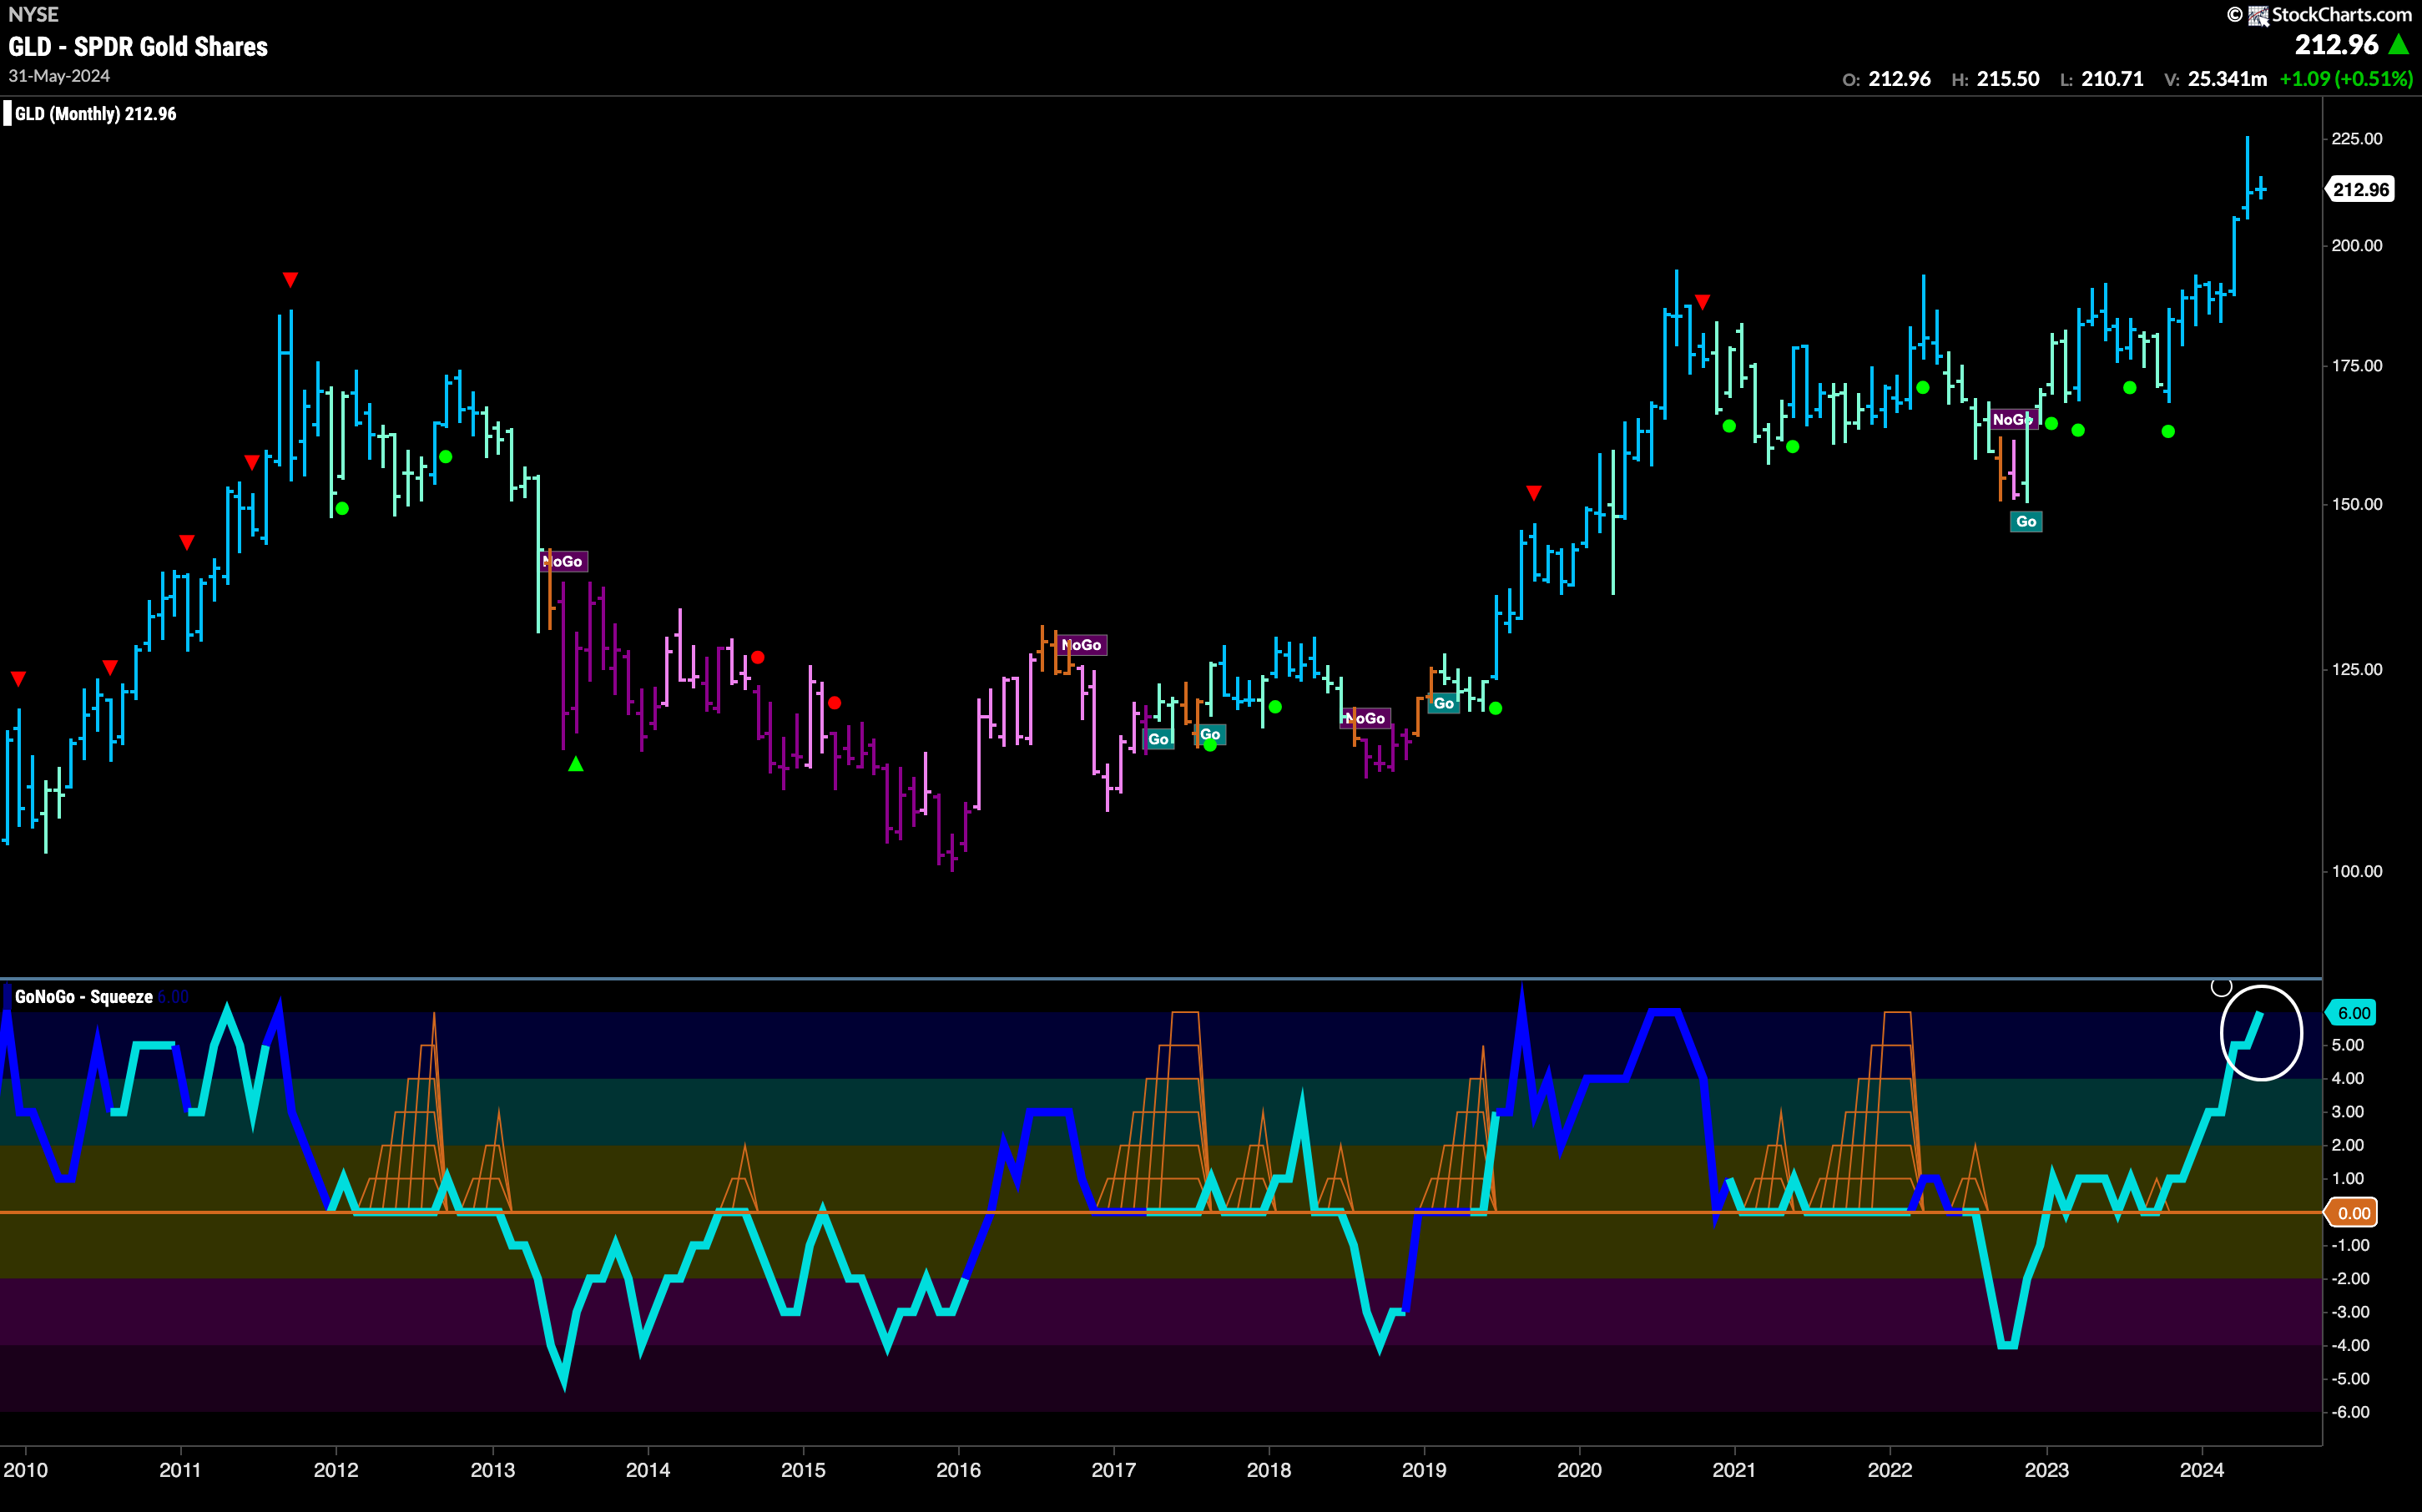
Sector RelMap
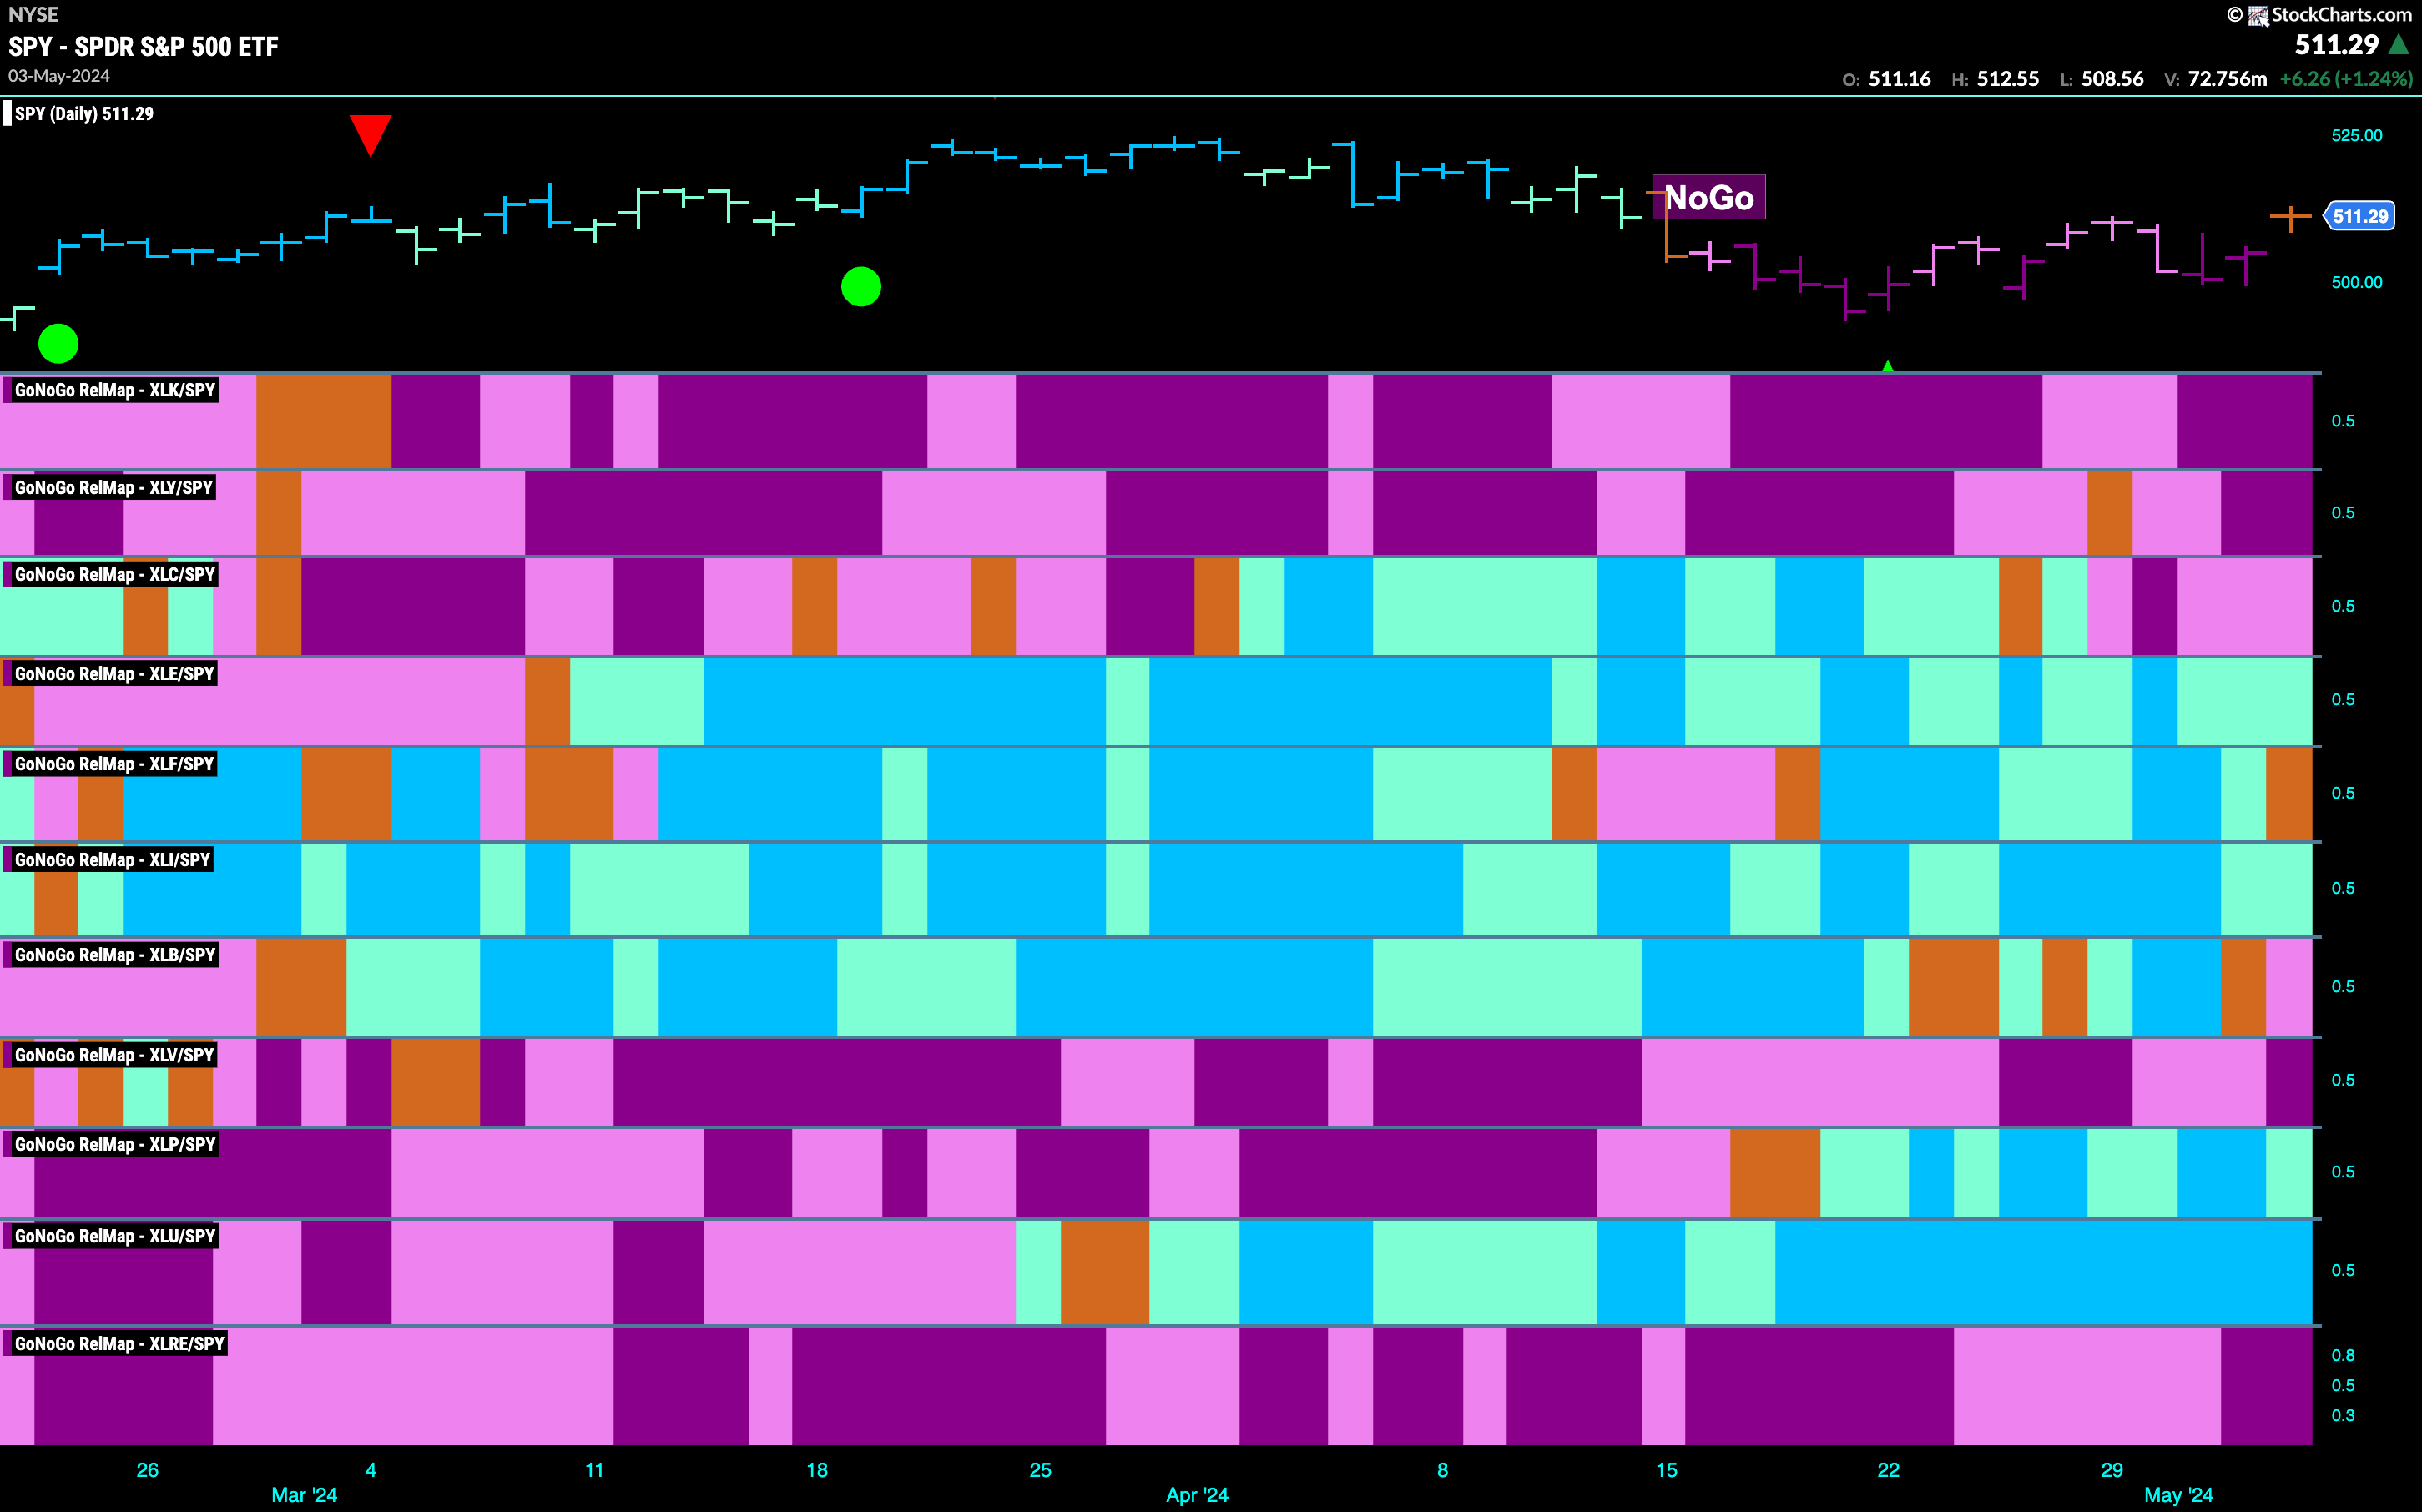
Below is the GoNoGo Sector RelMap. This GoNoGo RelMap applies the GoNoGo Trend to the relative strength ratios of the sectors to the base index. Looking at this map, we can quickly see where the relative outperformance is coming from as well as which sectors are lagging on a relative basis. 4 sectors are outperforming the base index this week. $XLE, $XLI, $XLP, and $XLU are painting relative “Go” bars.
Utilities Sub-Group RelMap
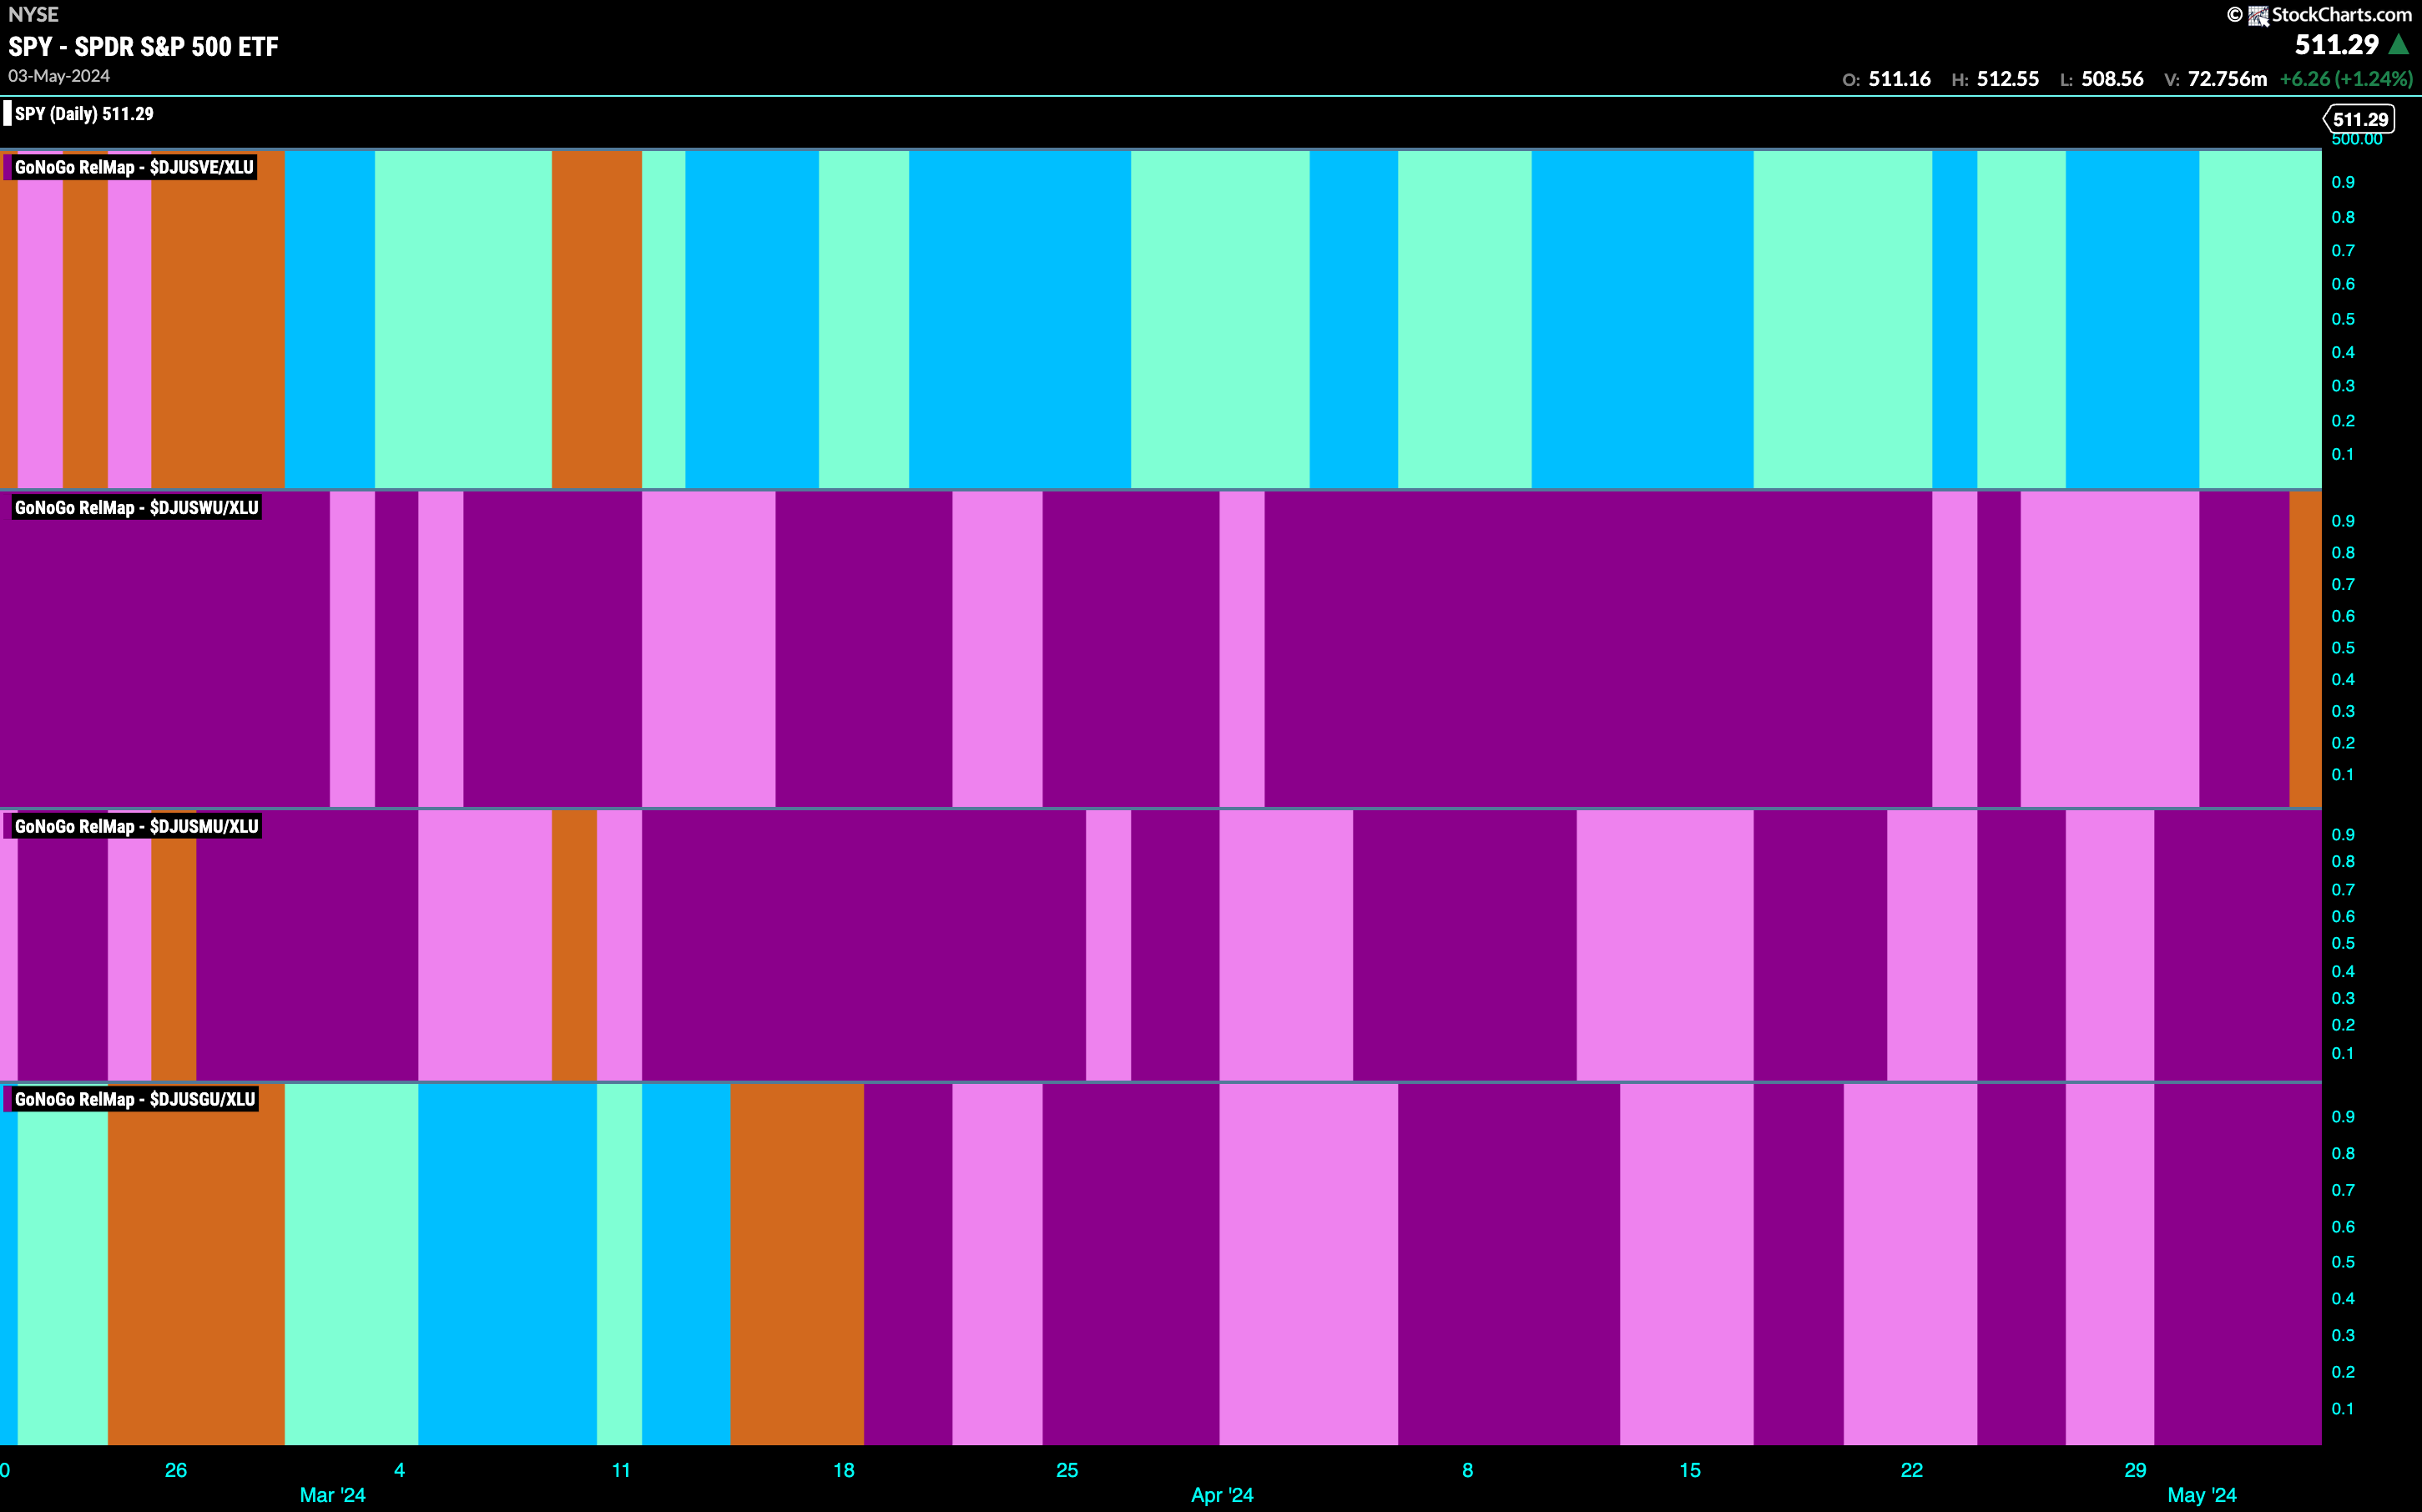
The GoNoGo Sector RelMap above shows that the defensive rotation continues this week. With now only 4 sectors outperforming on a relative basis to the larger index, it is only utilities that is in a strong blue relative “Go” trend. We will break down the sector below in the GoNoGo Sector Sub-group RelMap. We can see that so far the outperformance has come from the conventional energy space as we have noted in previous notes. We see a fleck of uncertainty in the water index however, as the long stranding “NoGo” has lost its grip. Perhaps that sub group is about to join the leadership party. No such signs from the lower two panels on this map (multi-utilities and gas distribution respectively).
$CEG Signals Trend Continuation
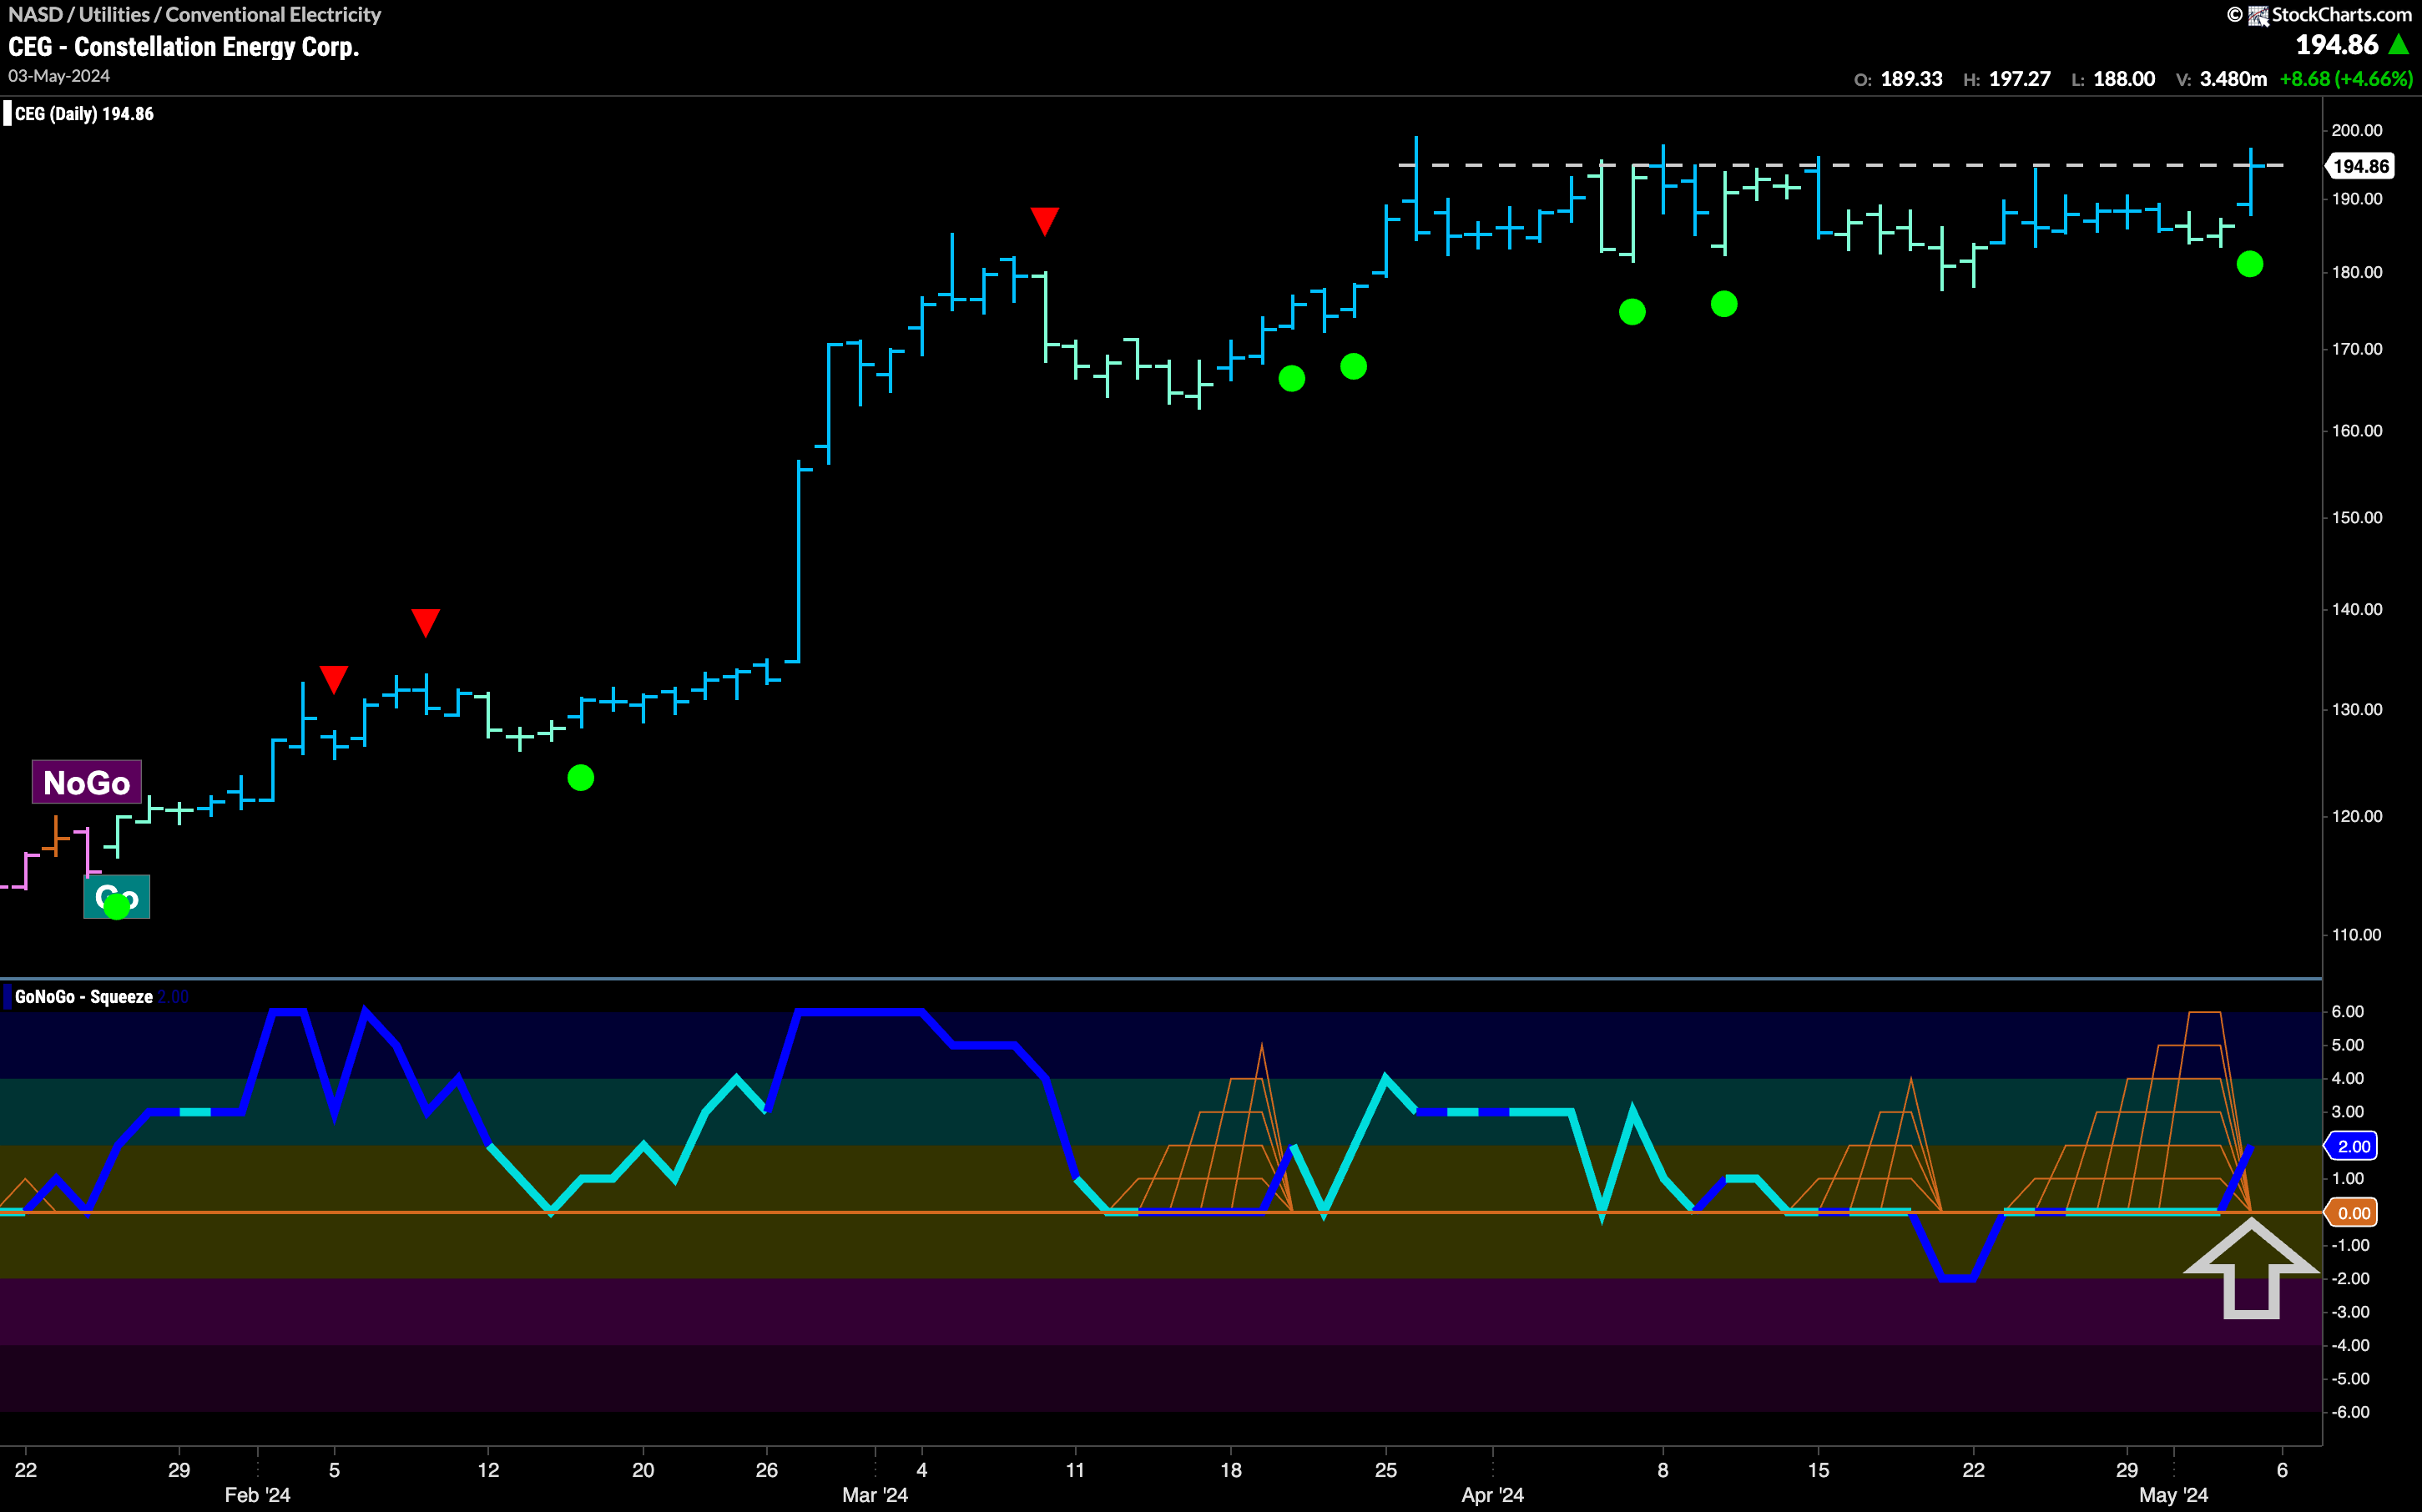
$CEG is a security in the strongly performing conventional energy space. It has signaled another Go Trend Continuation Icon (green circle) after a long period of sideways movement. We can see that during this extended period where it failed to make a higher high GoNoGo Oscillator primarily found support at the zero line. Most recently, we see that GoNoGo Oscillator has broken out of a Max GoNoGo Squeeze into positive territory and on heavy volume (darker blue line of oscillator). We will watch to see if this resurgent momentum in the direction of the underlying “Go” trend will give price the push it needs to finally set a new higher high.
$MSEX Flags New “Go” Trend
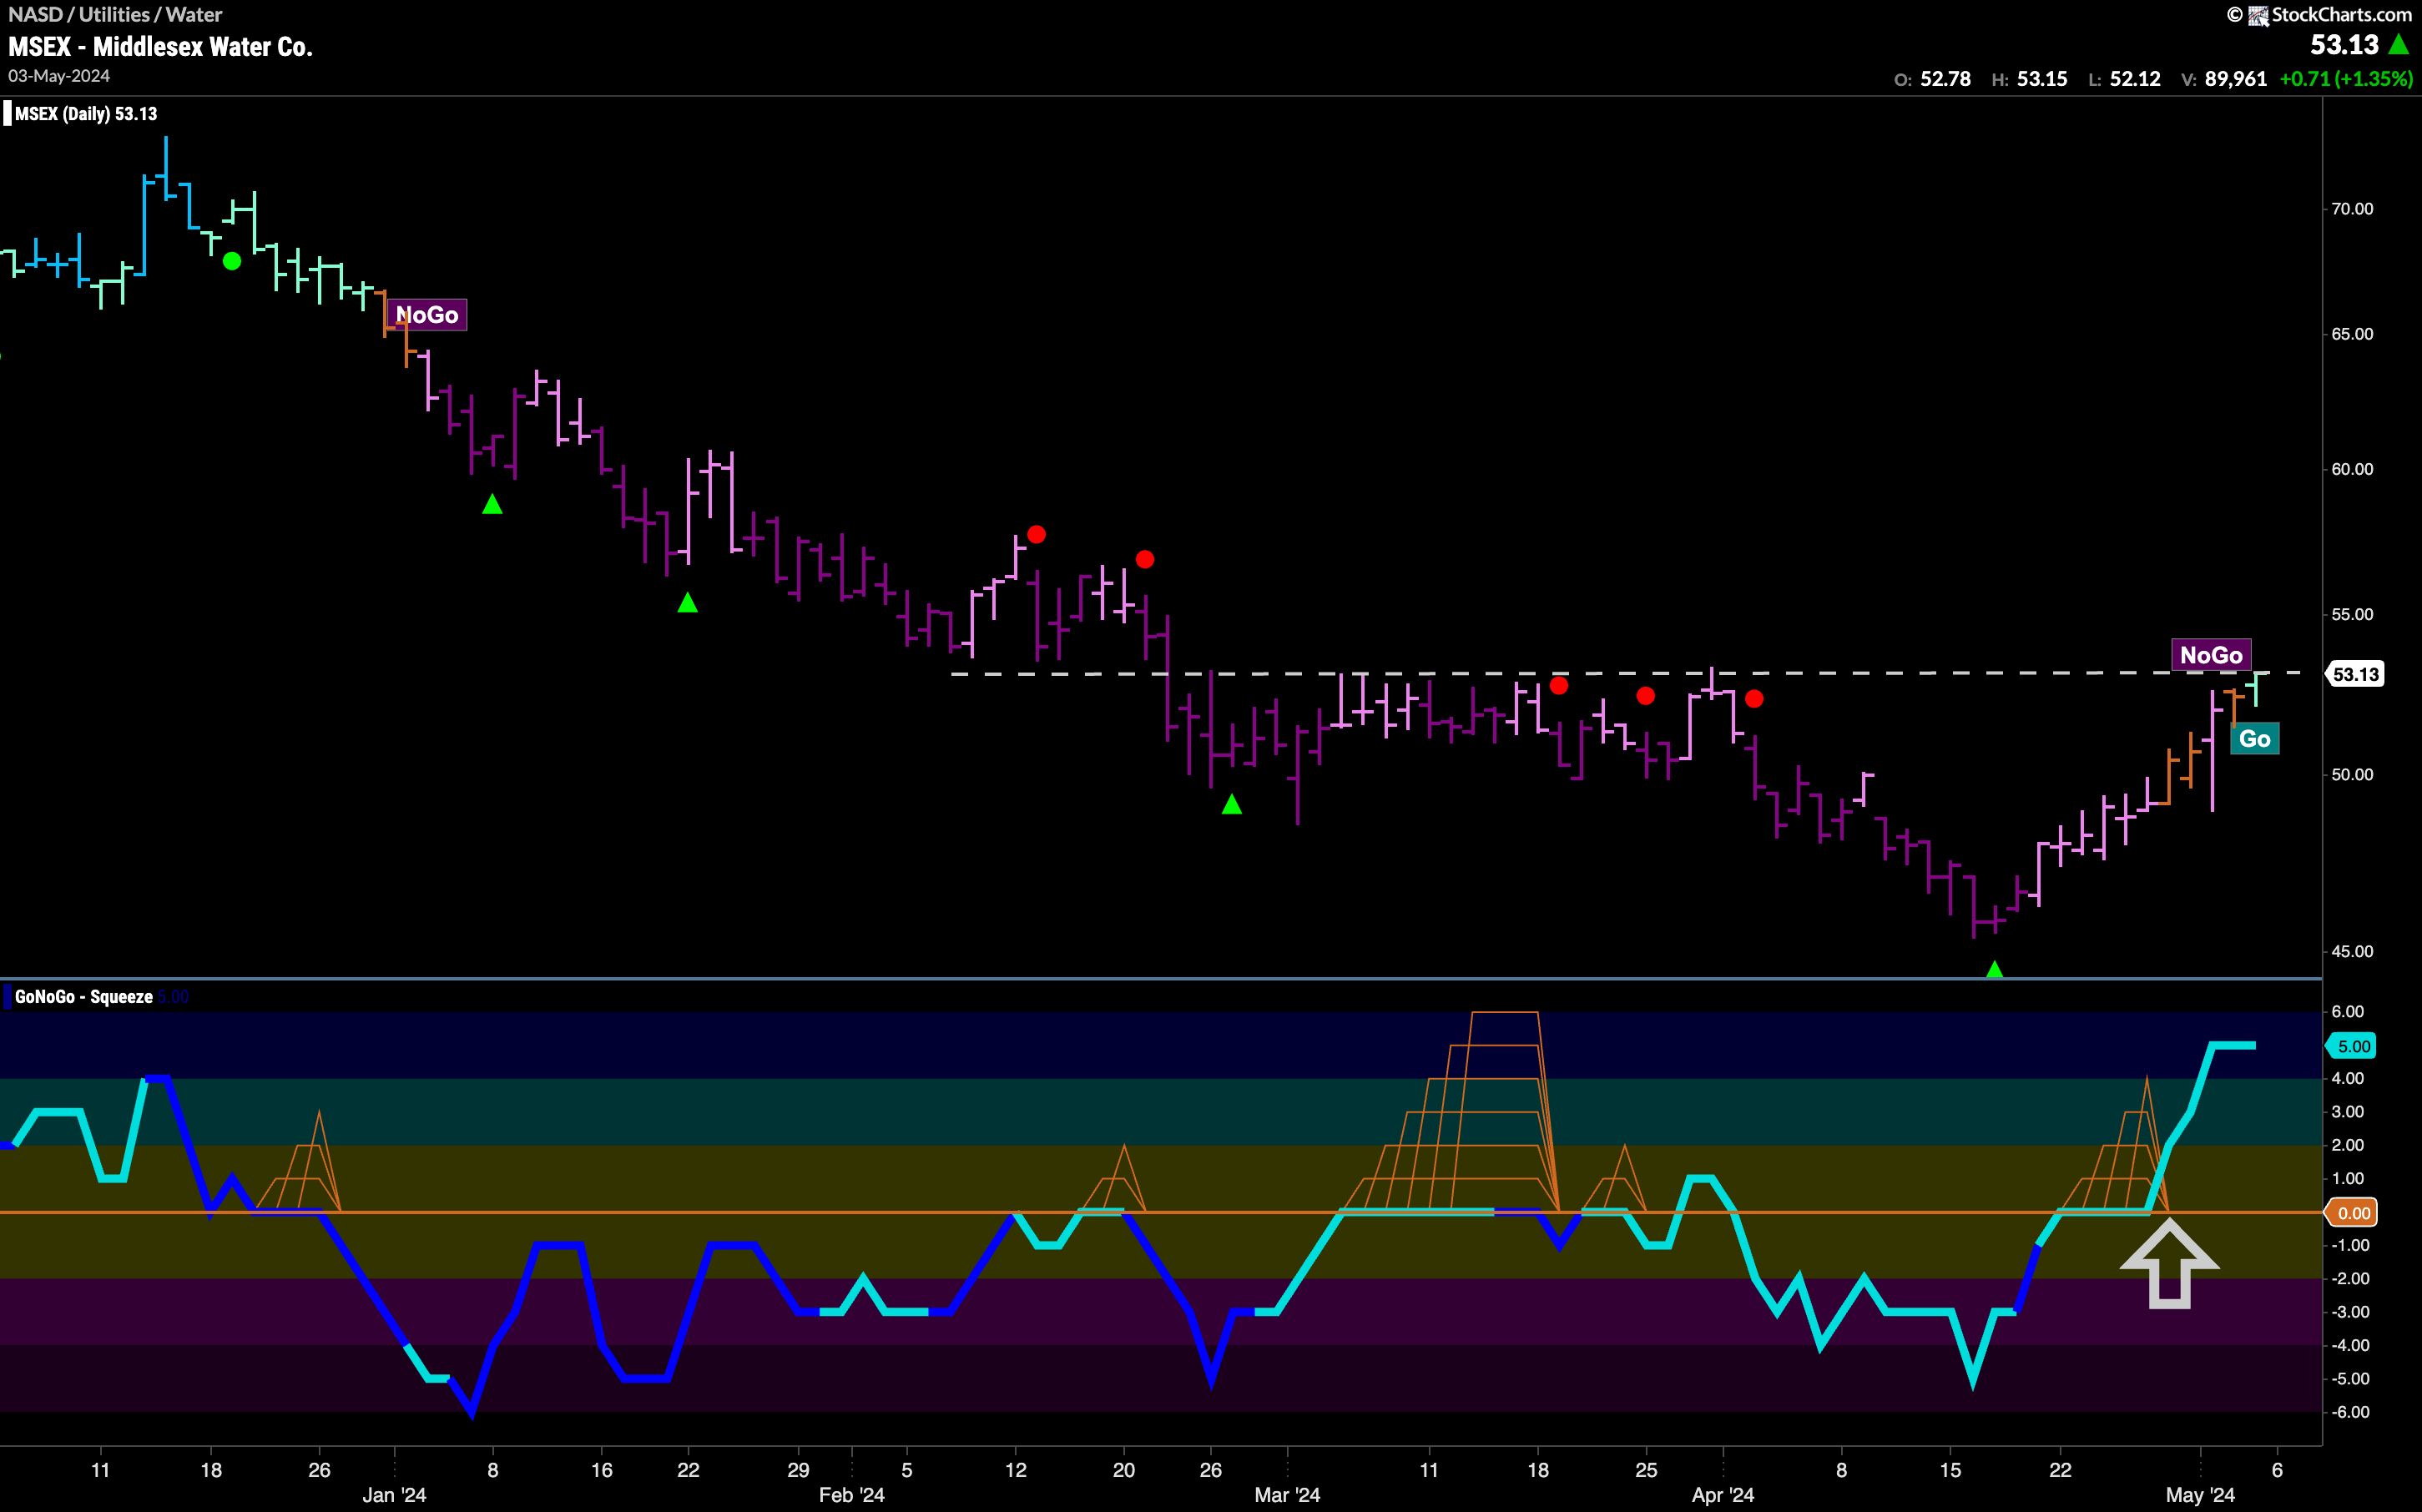
As the water index shows signs that it is emerging from its drawn out “NoGo” trend with a relative amber “Go Fish” bar (see utilities sub group map above), Middlesex Water Co. is one step ahead. GoNoGo Trend is painting a first aqua “Go” bar after several “Go Fish” bars interrupted the “NoGo”. We see that this trend shift to a “Go” is happening as price tries to break higher than horizontal level on the chart that we see has acted as both support and resistance in the past. GoNoGo Oscillator has broken out of a small GoNoGo Squeeze into and has raced into positive territory and now sits at a value of 5. We will watch to see if this burst of momentum has been enough to push price to new highs in this brand new “Go” trend.
