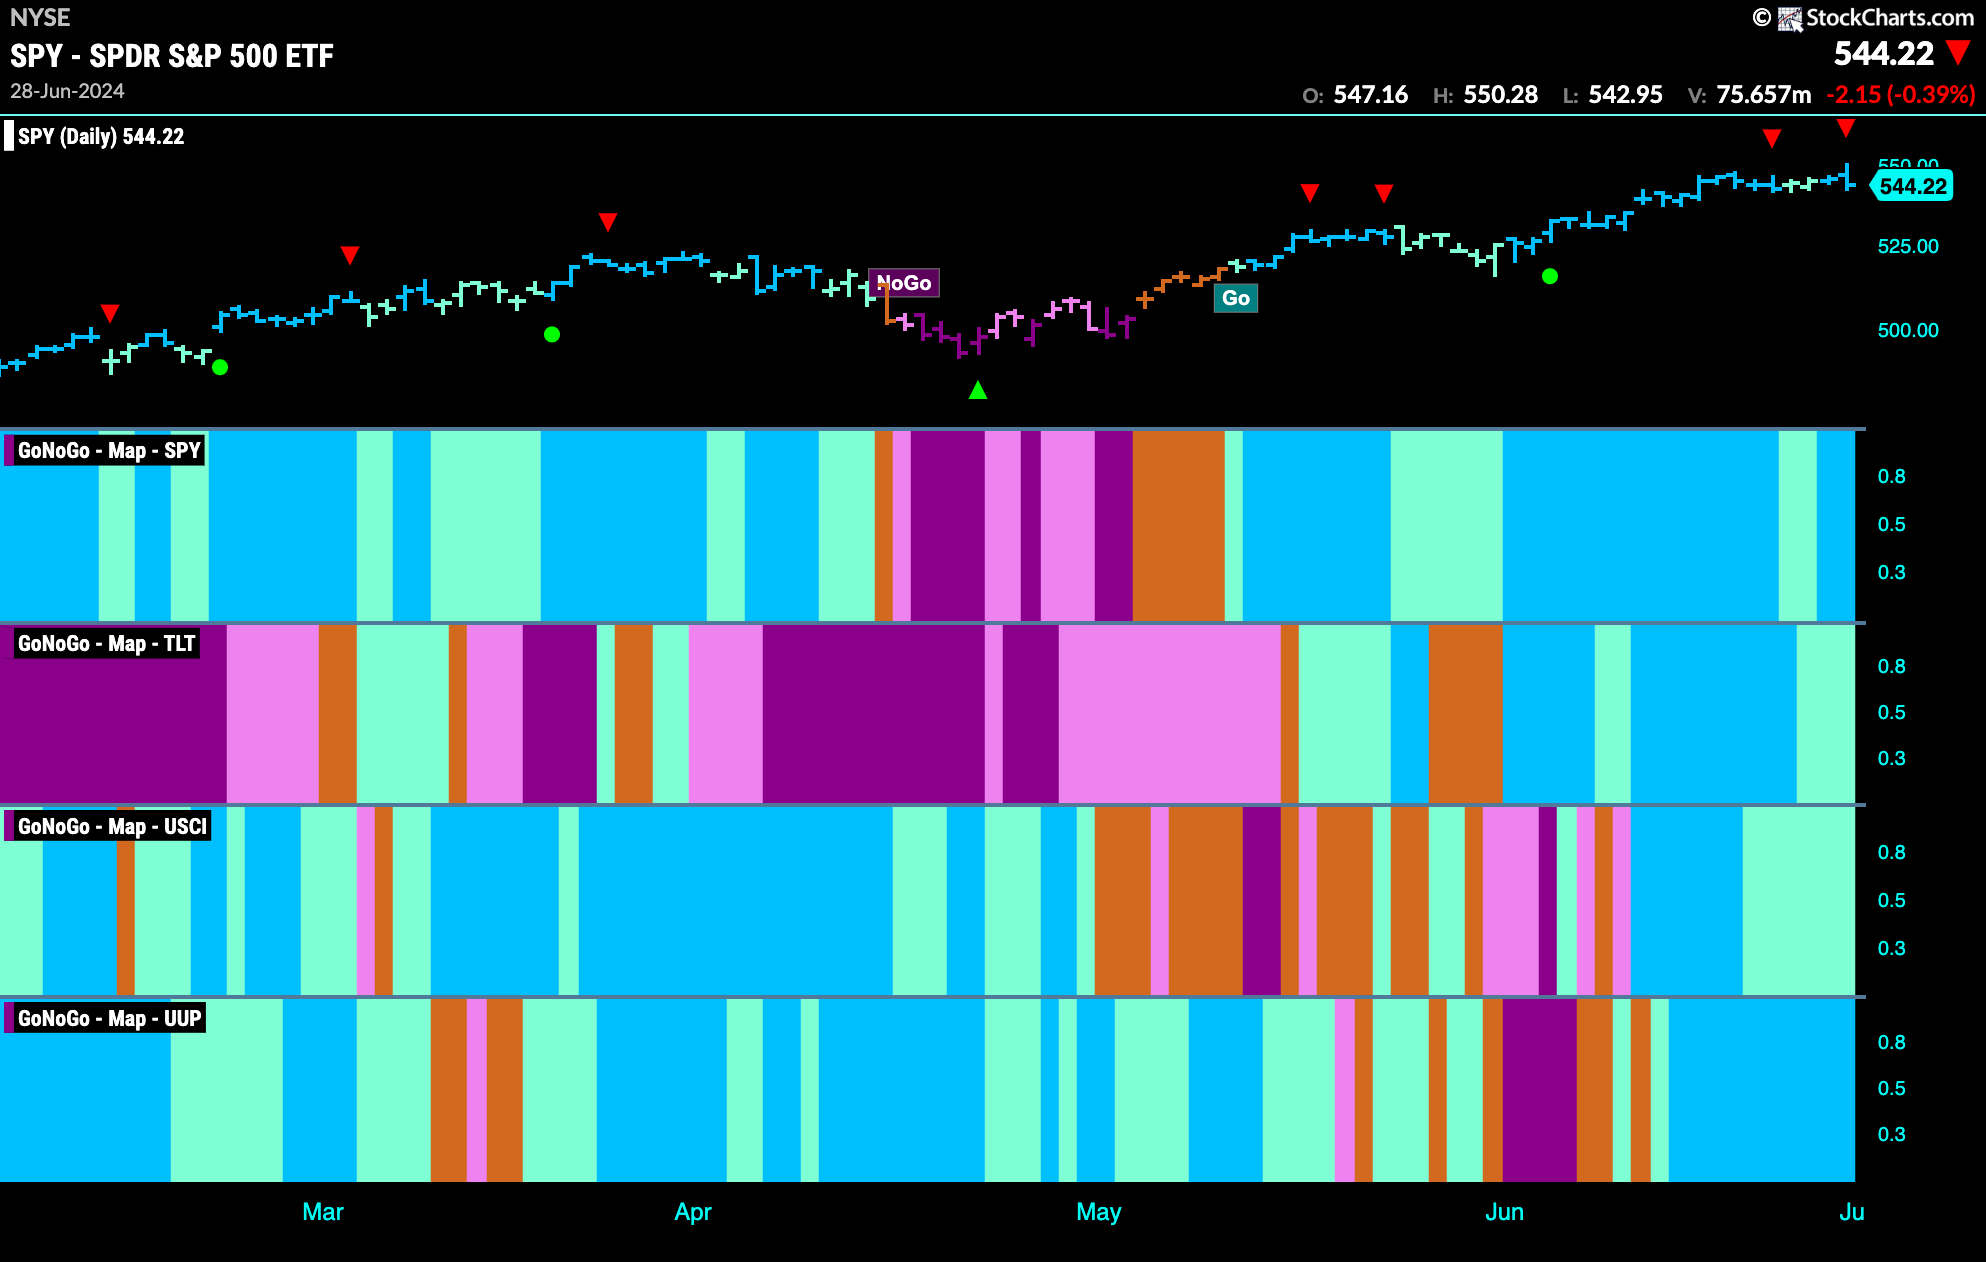
Good morning and welcome to this week’s Flight Path. “Go” bars were the order of the week again for U.S. equities and the end of the week saw a return to strong blue bars. Treasury bond prices also were able to maintain “Go” bars but ended the week showing weakness. U.S. commodity index painted a full week of weaker aqua “Go” bars while the dollar continued to show strength with strong blue bars.

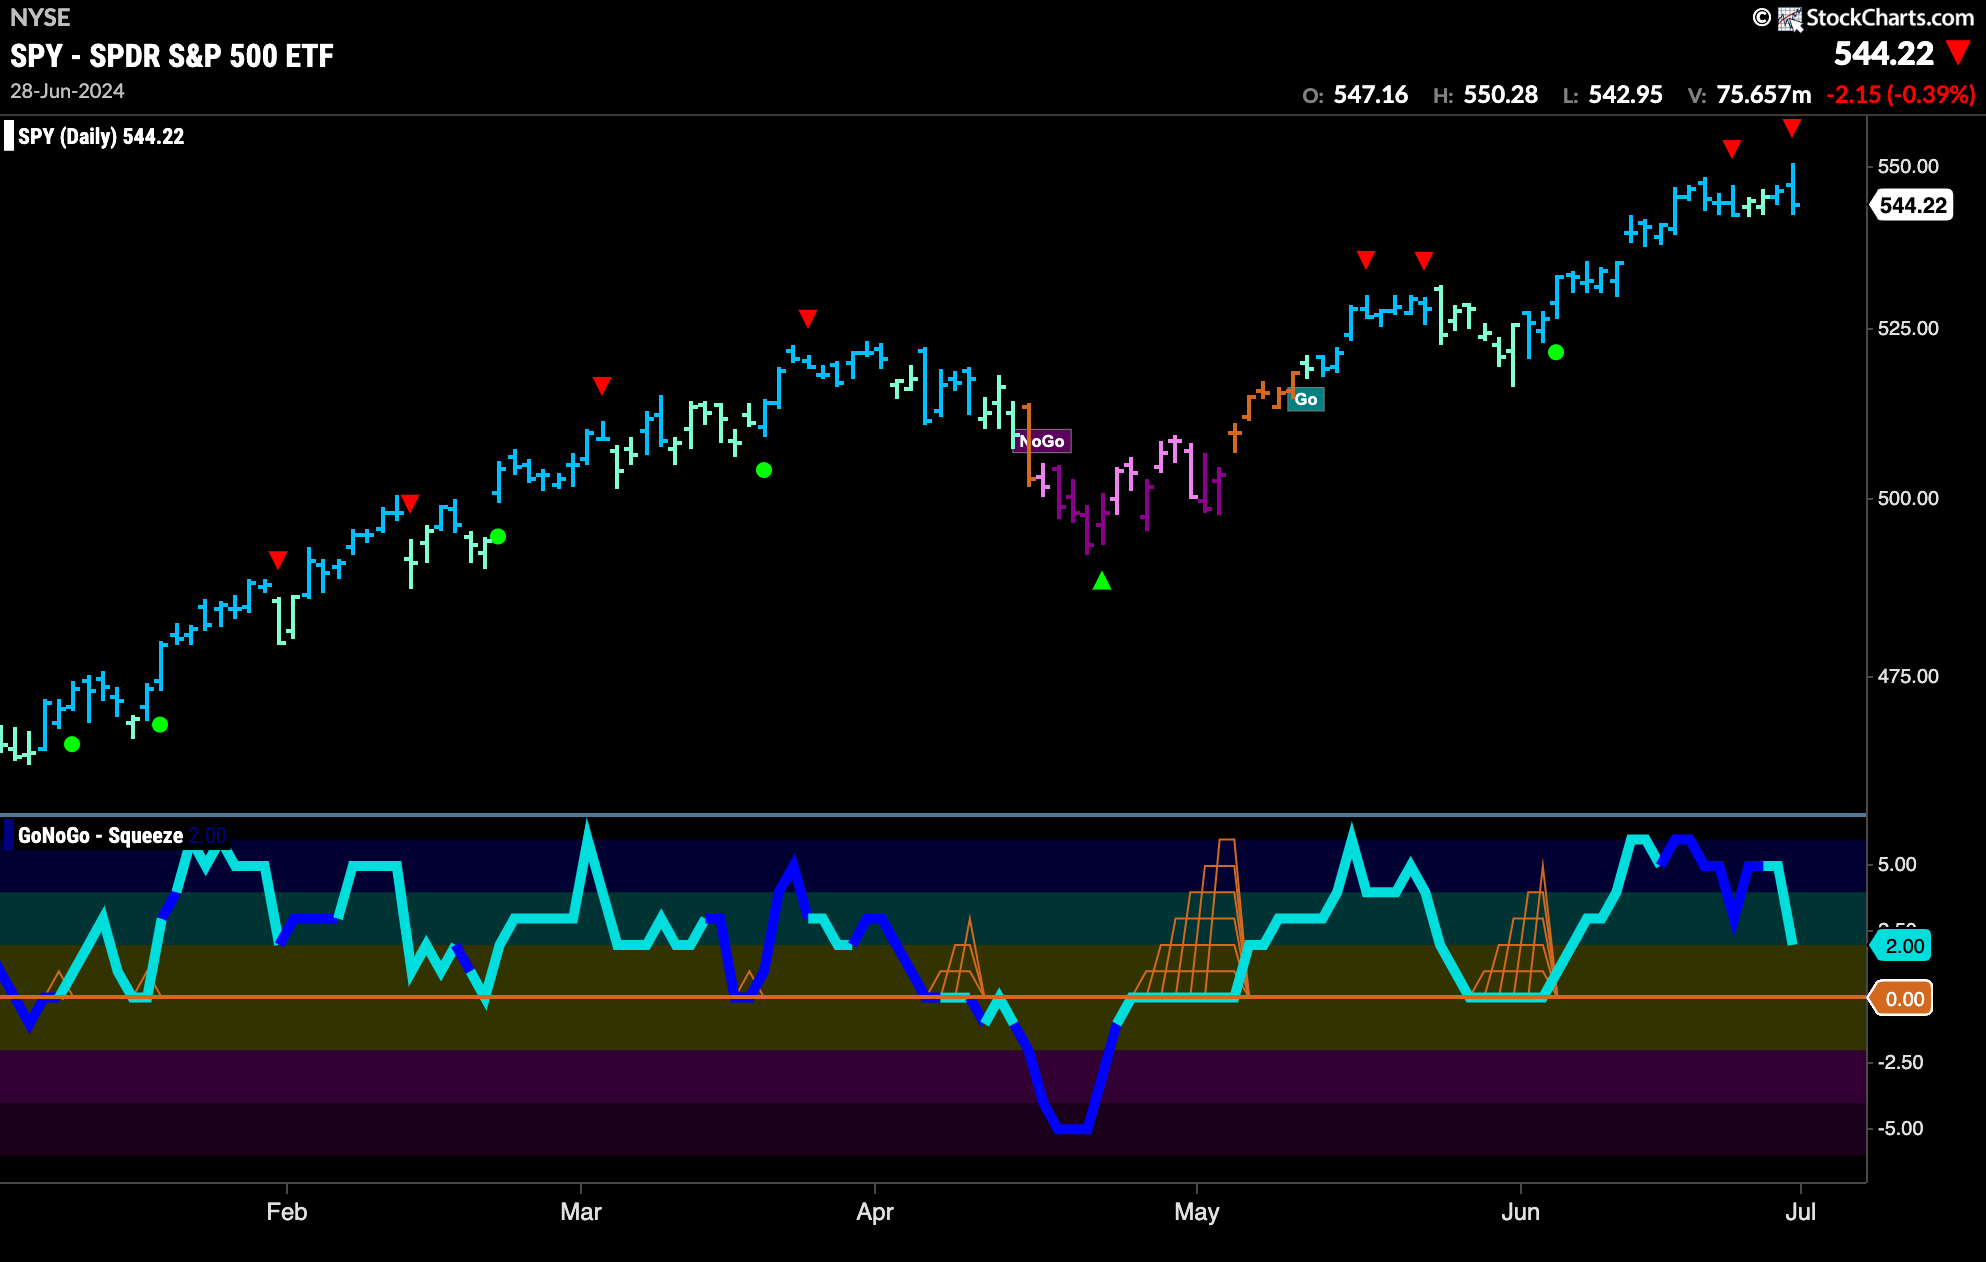
$SPY Remains in “Go” Trend but Struggles with New Highs
Price hit an intra week high again this week but we saw Friday close lower. GoNoGo Trend painted strong blue bars at the end of the week and so we know the trend remains strong. GoNoGo Oscillator has fallen from overbought territory and volume is light as it crashes toward the zero line. So, we have momentum waning but price holding on to trend. We will watch to see what happens as the oscillator gets to zero and we will look for it to find support if the trend is to remain healthy.
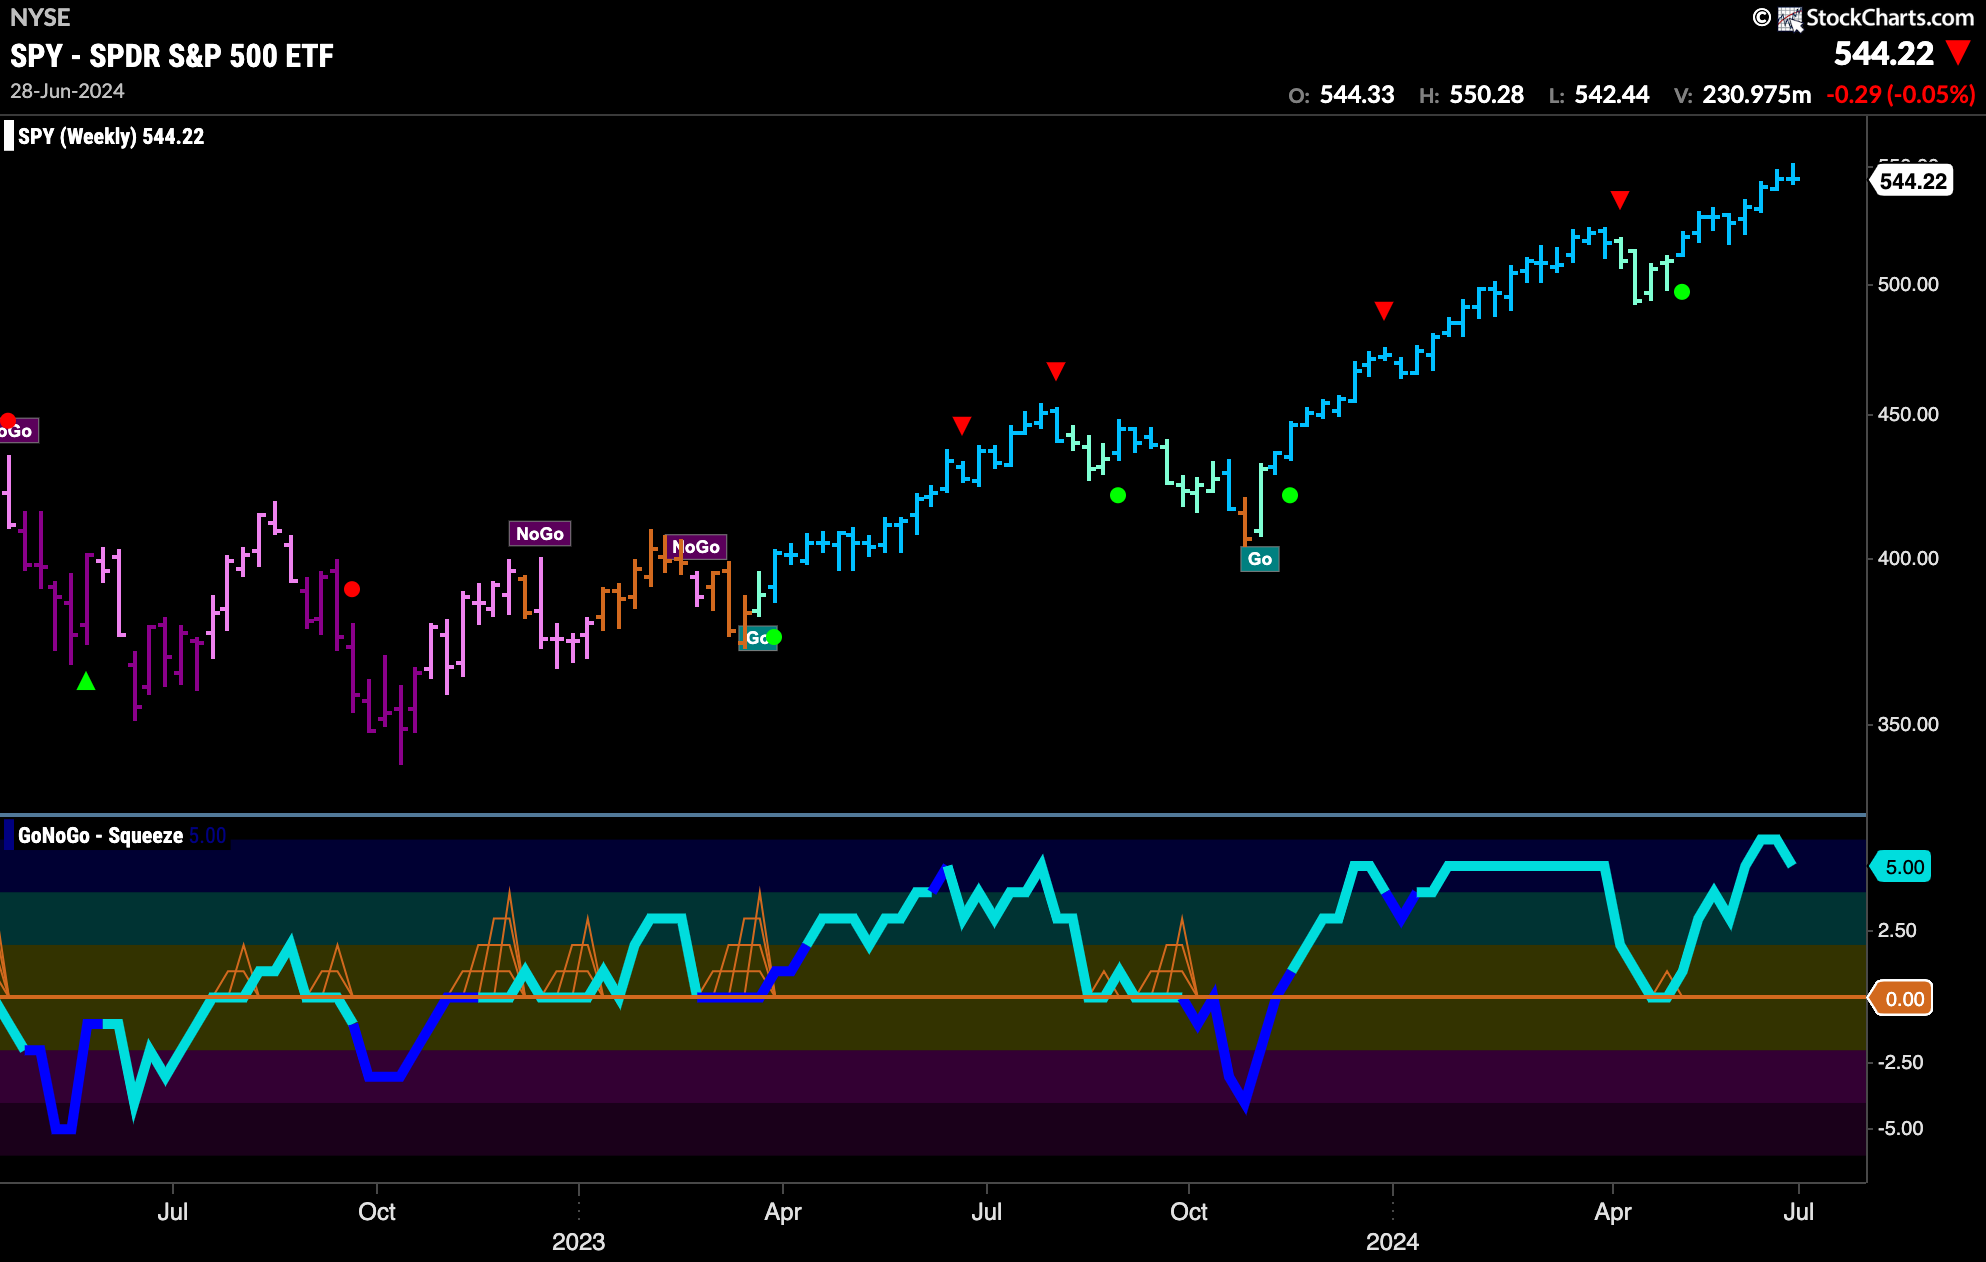
Price crept higher this week and we saw another strong blue “Go” bar which makes it 8 in a row. GoNoGo Oscillator has peaked but is still overbought at a value of 5. We will look to see if momentum continues to wane and if so we’ll see a Go Countertrend Correction Icon (red arrow) that will indicate a likely pause and a struggle for prices to go higher in the short term.
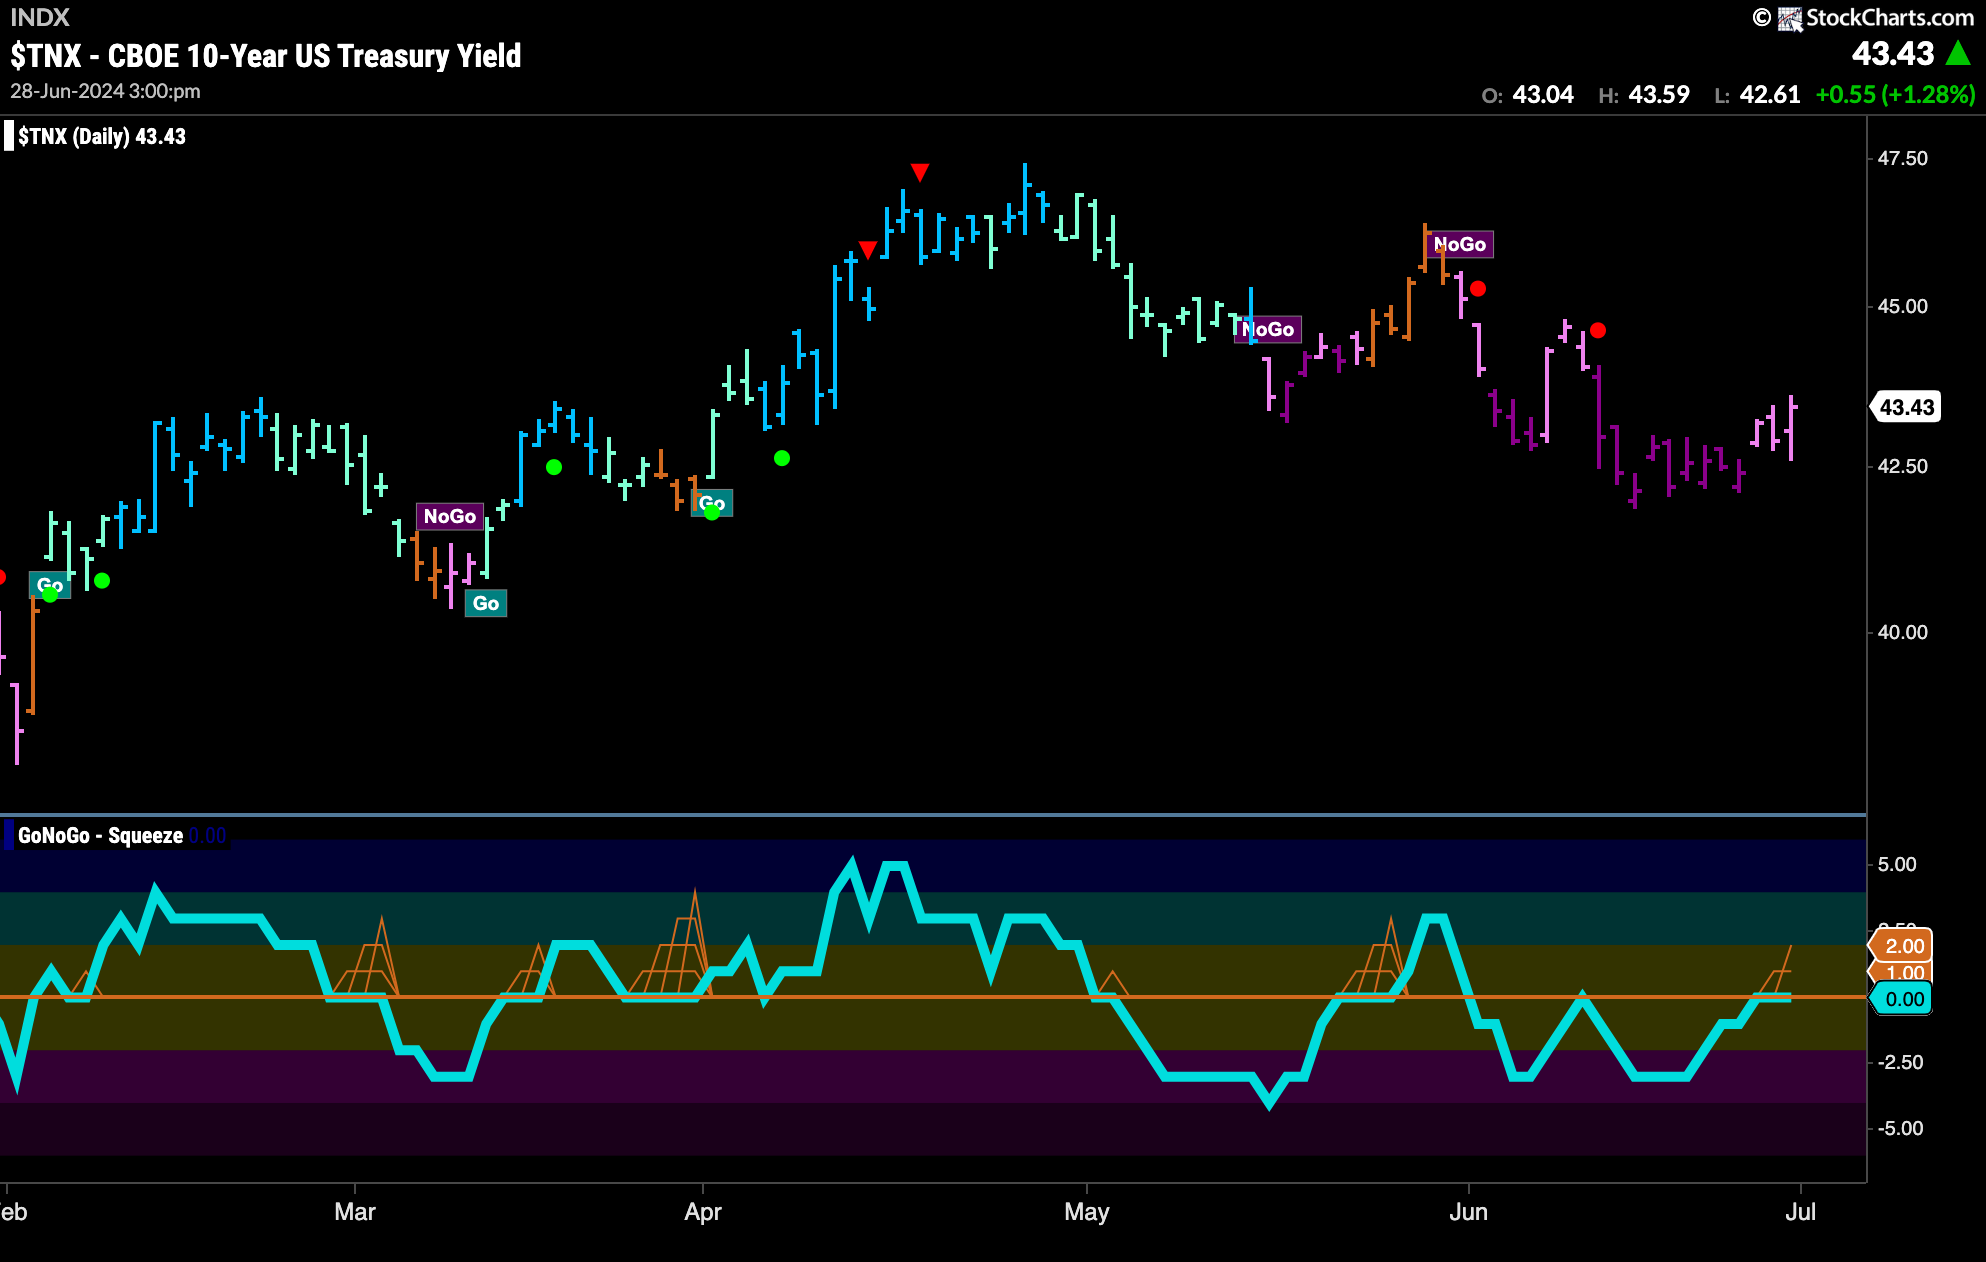
Treasury Rates Still in “NoGo” Trend but Paints Weaker Pink Bars
Treasury rates climbed this week after last week’s low and we see that GoNoGo Trend paints a few weaker pink bars. The weight of the evidence still points to a “NoGo” trend but we will watch to see if it holds this week. GoNoGo Oscillator has rallied and is testing the zero level from below. If it is rejected here, we will likely see a new leg down in price.
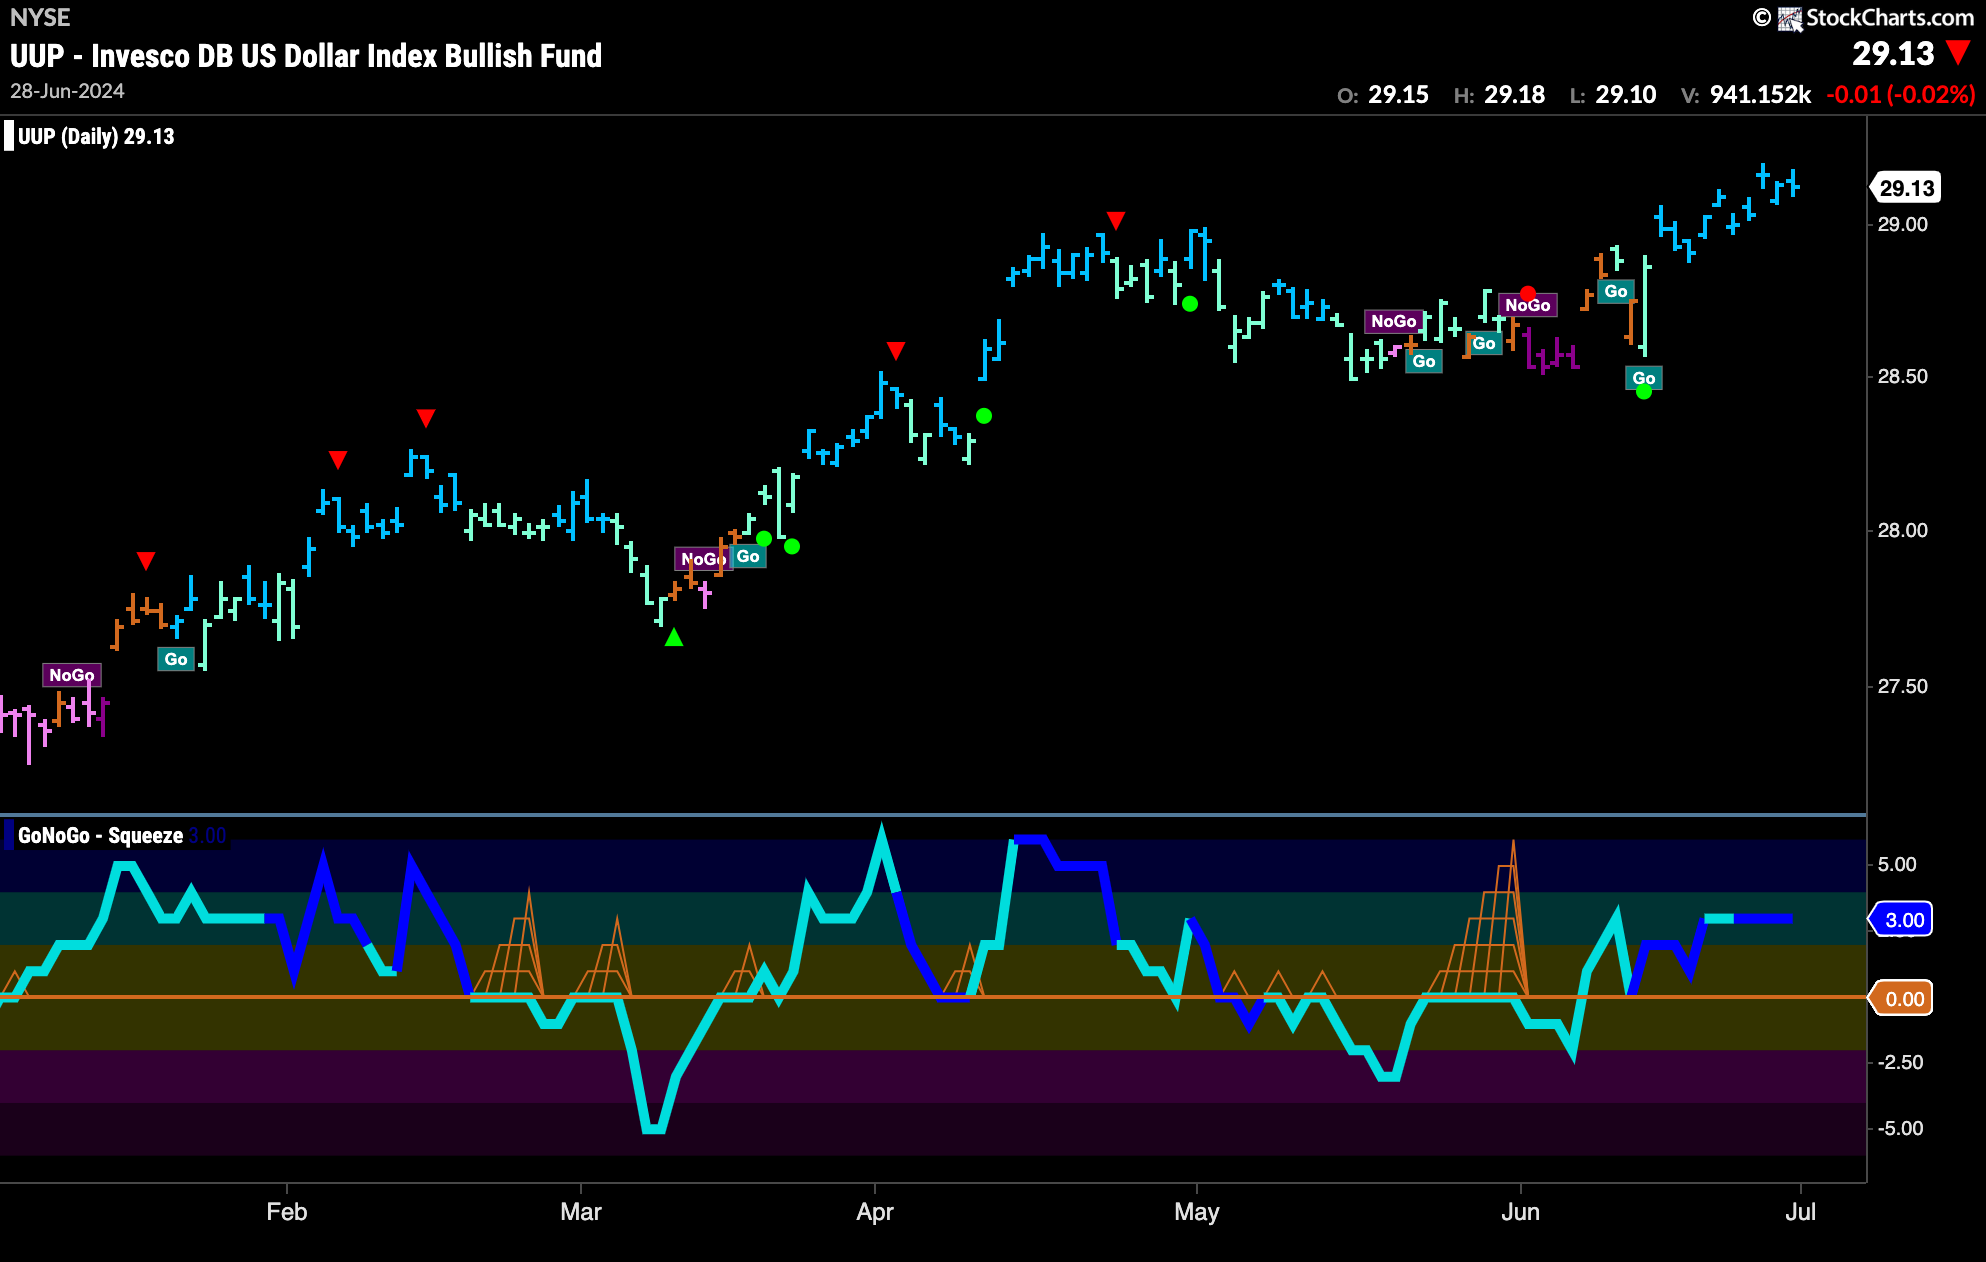
Dollar Sees Continued Strength as Price Makes New Highs
Price hit new highs this week and GoNoGo Trend painted a week of uninterrupted strong blue “Go” bars. We will look for price to consolidate at these levels using support from prior highs in May. GoNoGo Oscillator has flatlined at a value of 3 and so is in positive territory but not yet overbought. Volume is heavy.
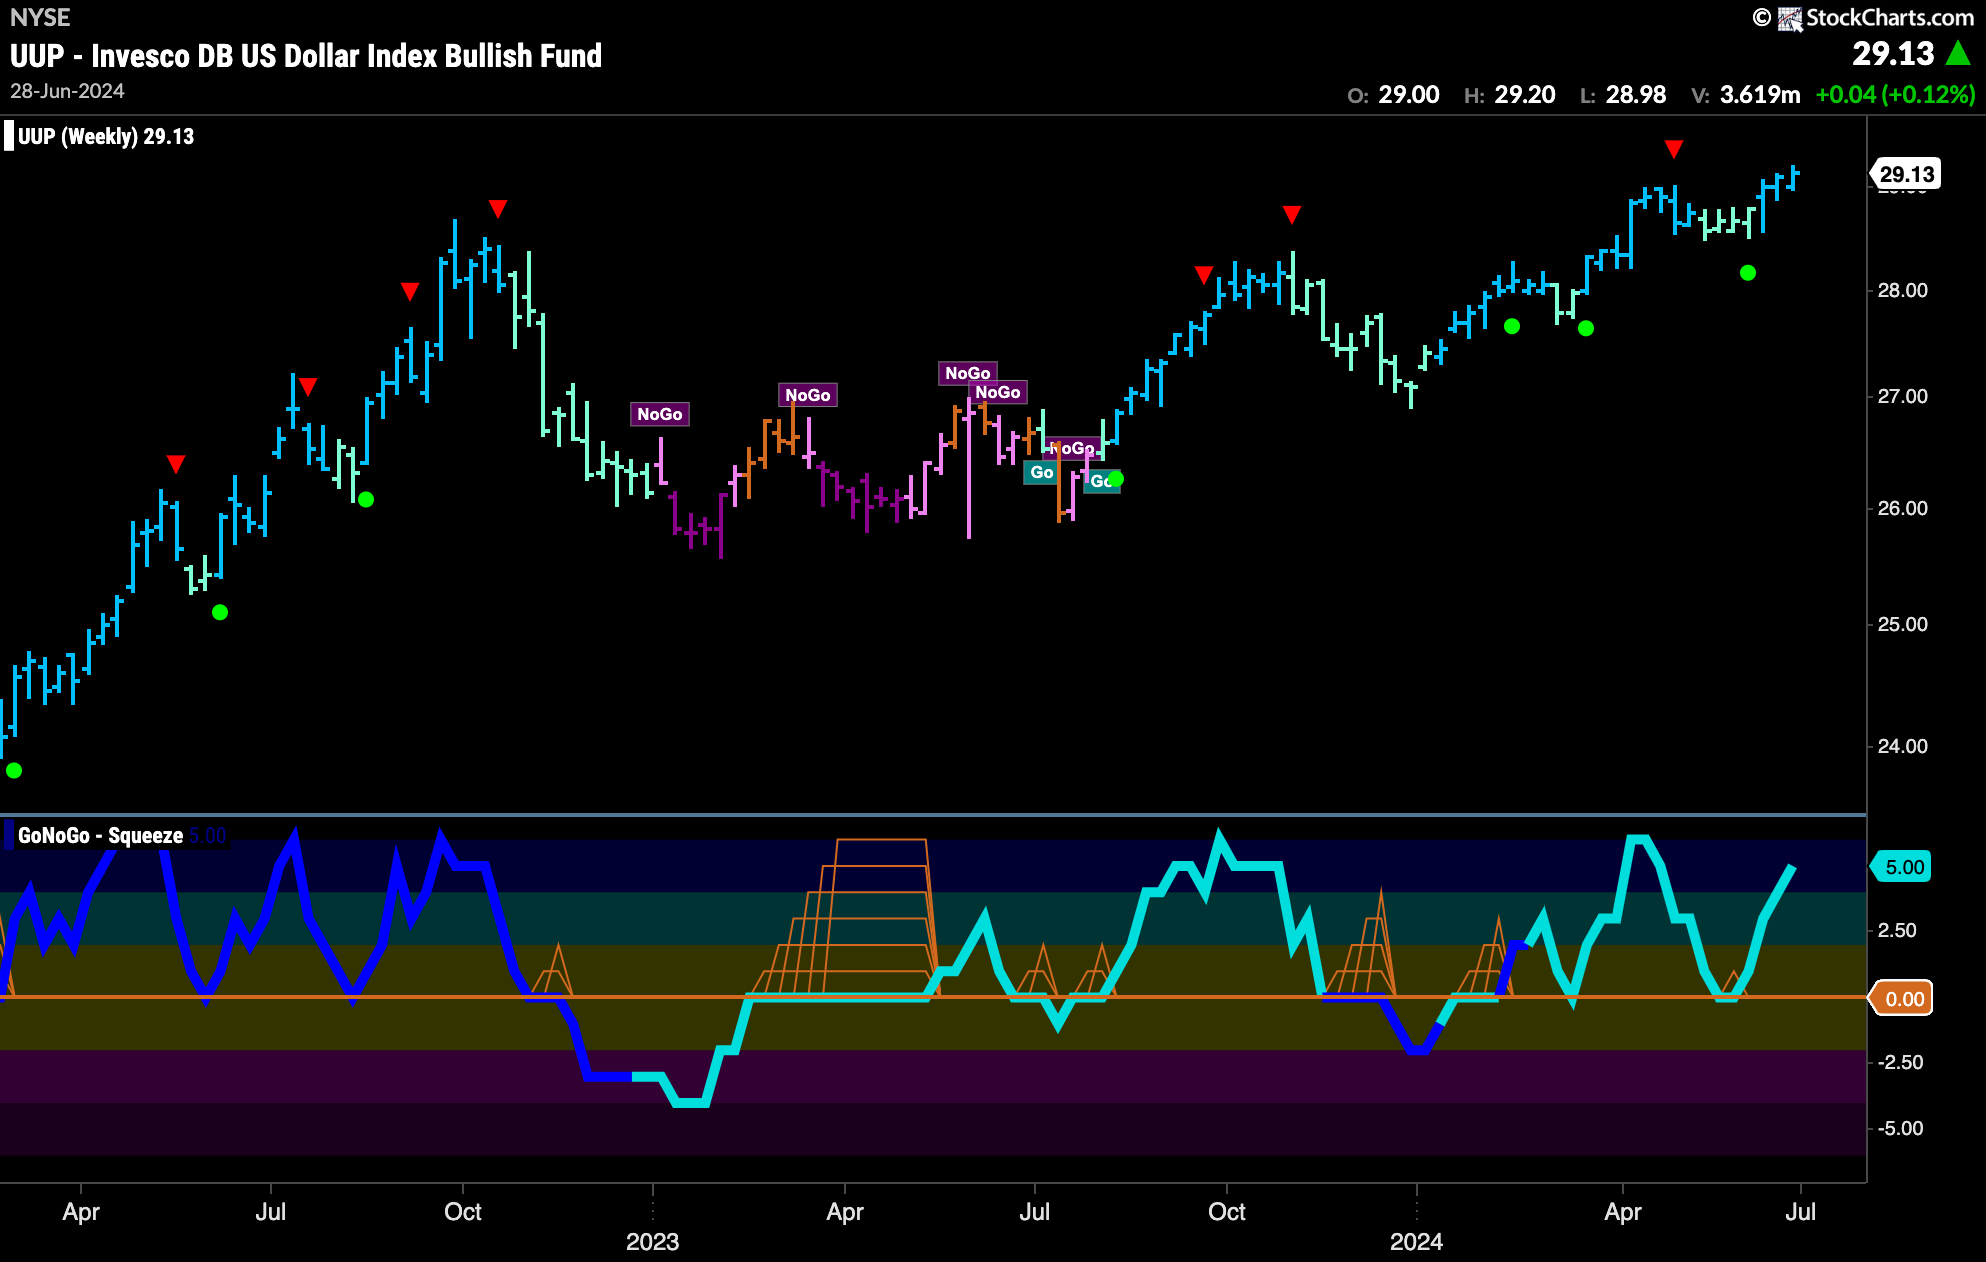
The weekly chart shows that we are seeing real strength in this longer term “Go” trend as GoNoGo Trend paints another strong blue bar at new highs. GoNoGo Oscillator is rising and is creeping into an overbought level at a value of 5.
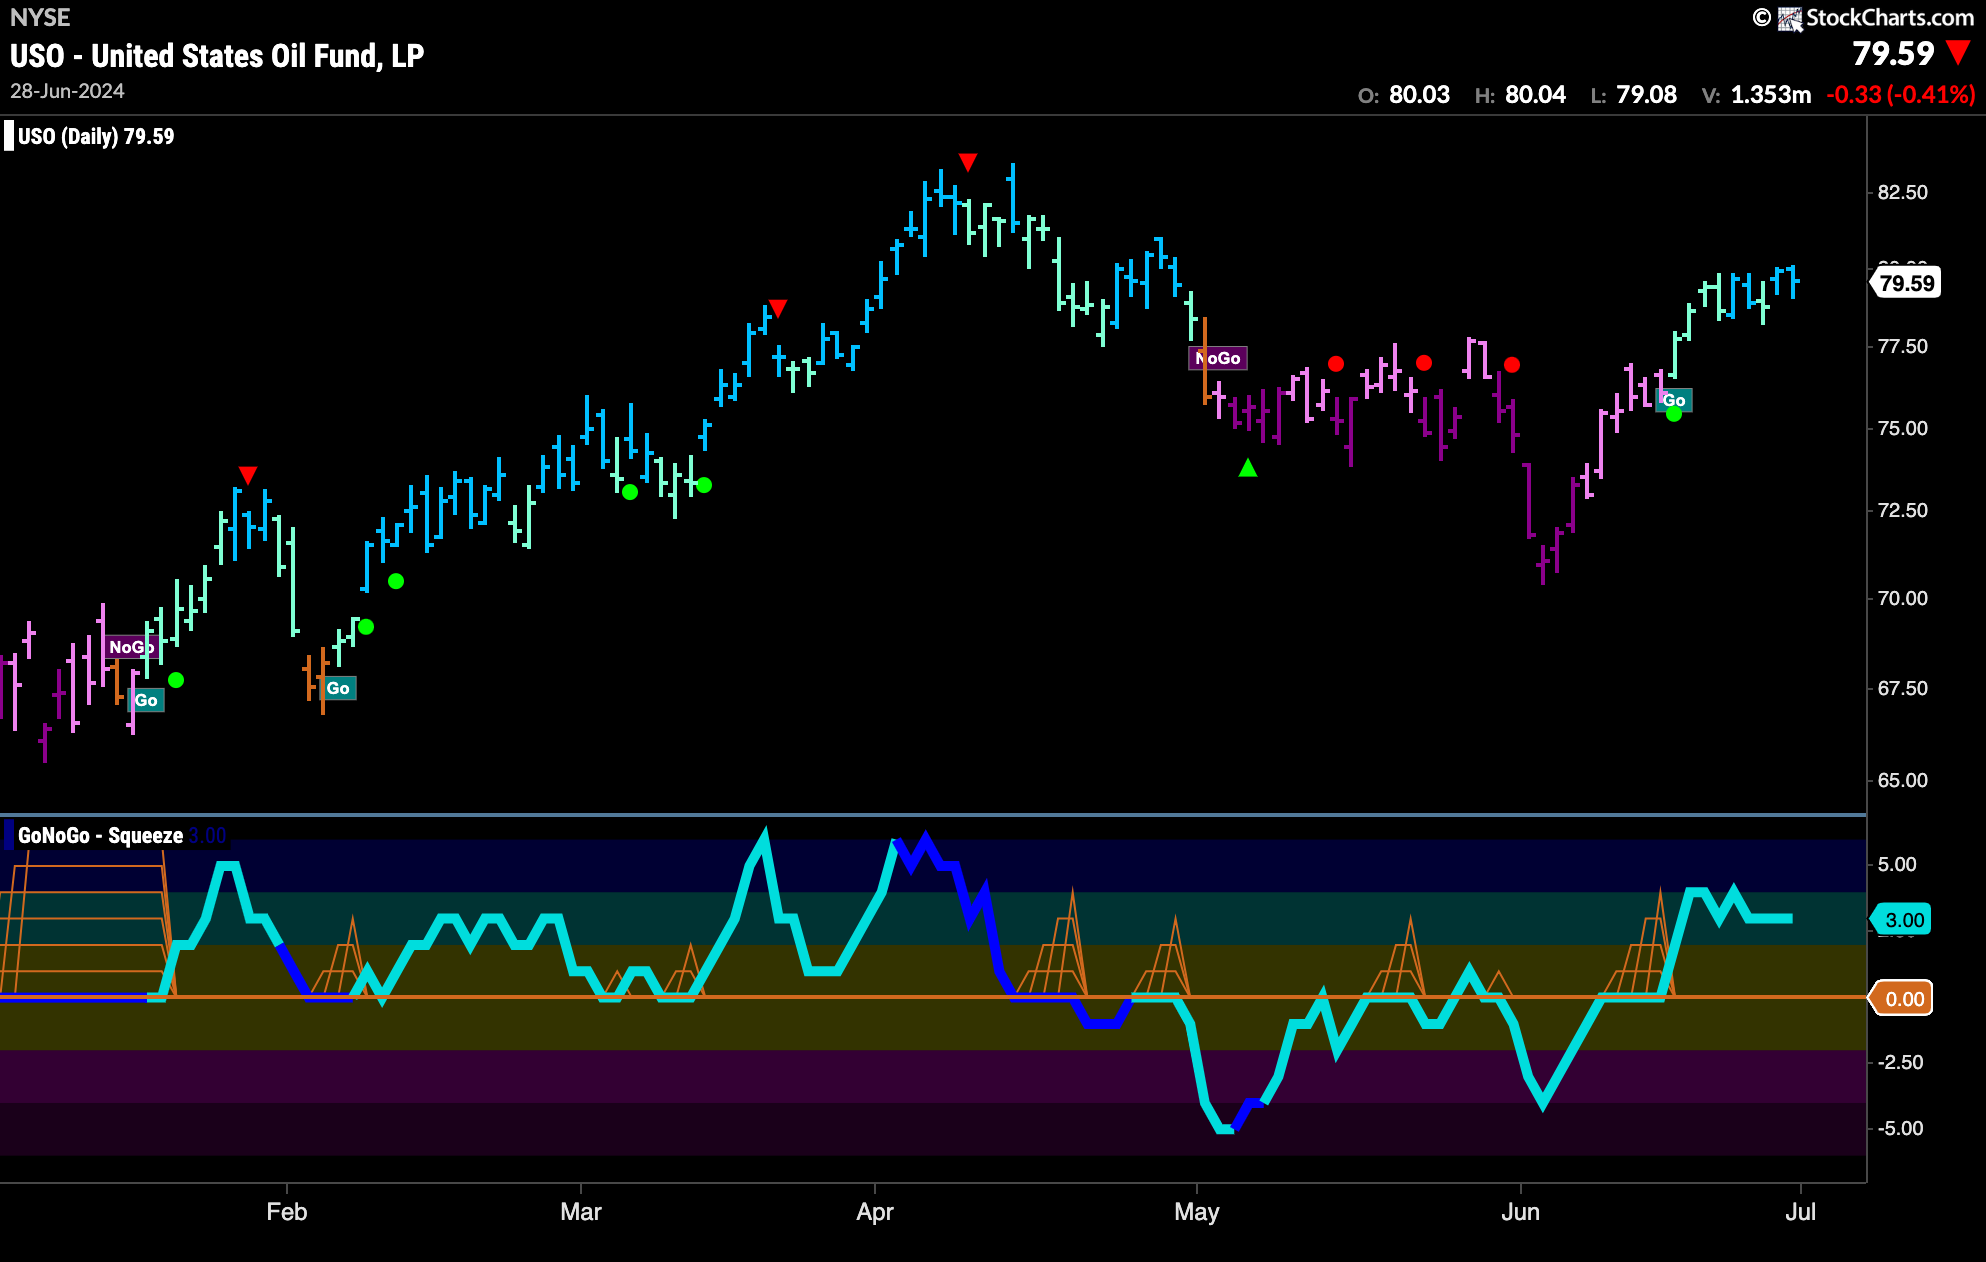
USO Consolidated its “Go” Trend this Week
GoNoGo Trend painted some stronger blue “Go” bars as price moved mostly sideways last week. We are still some way from the mid chart highs so there is perhaps some room to run. GoNoGo Oscillator is at a value of 3 and so is not yet oversold. With momentum confirming the direction of the underlying “Go” trend we will look to see if price can climb from here.
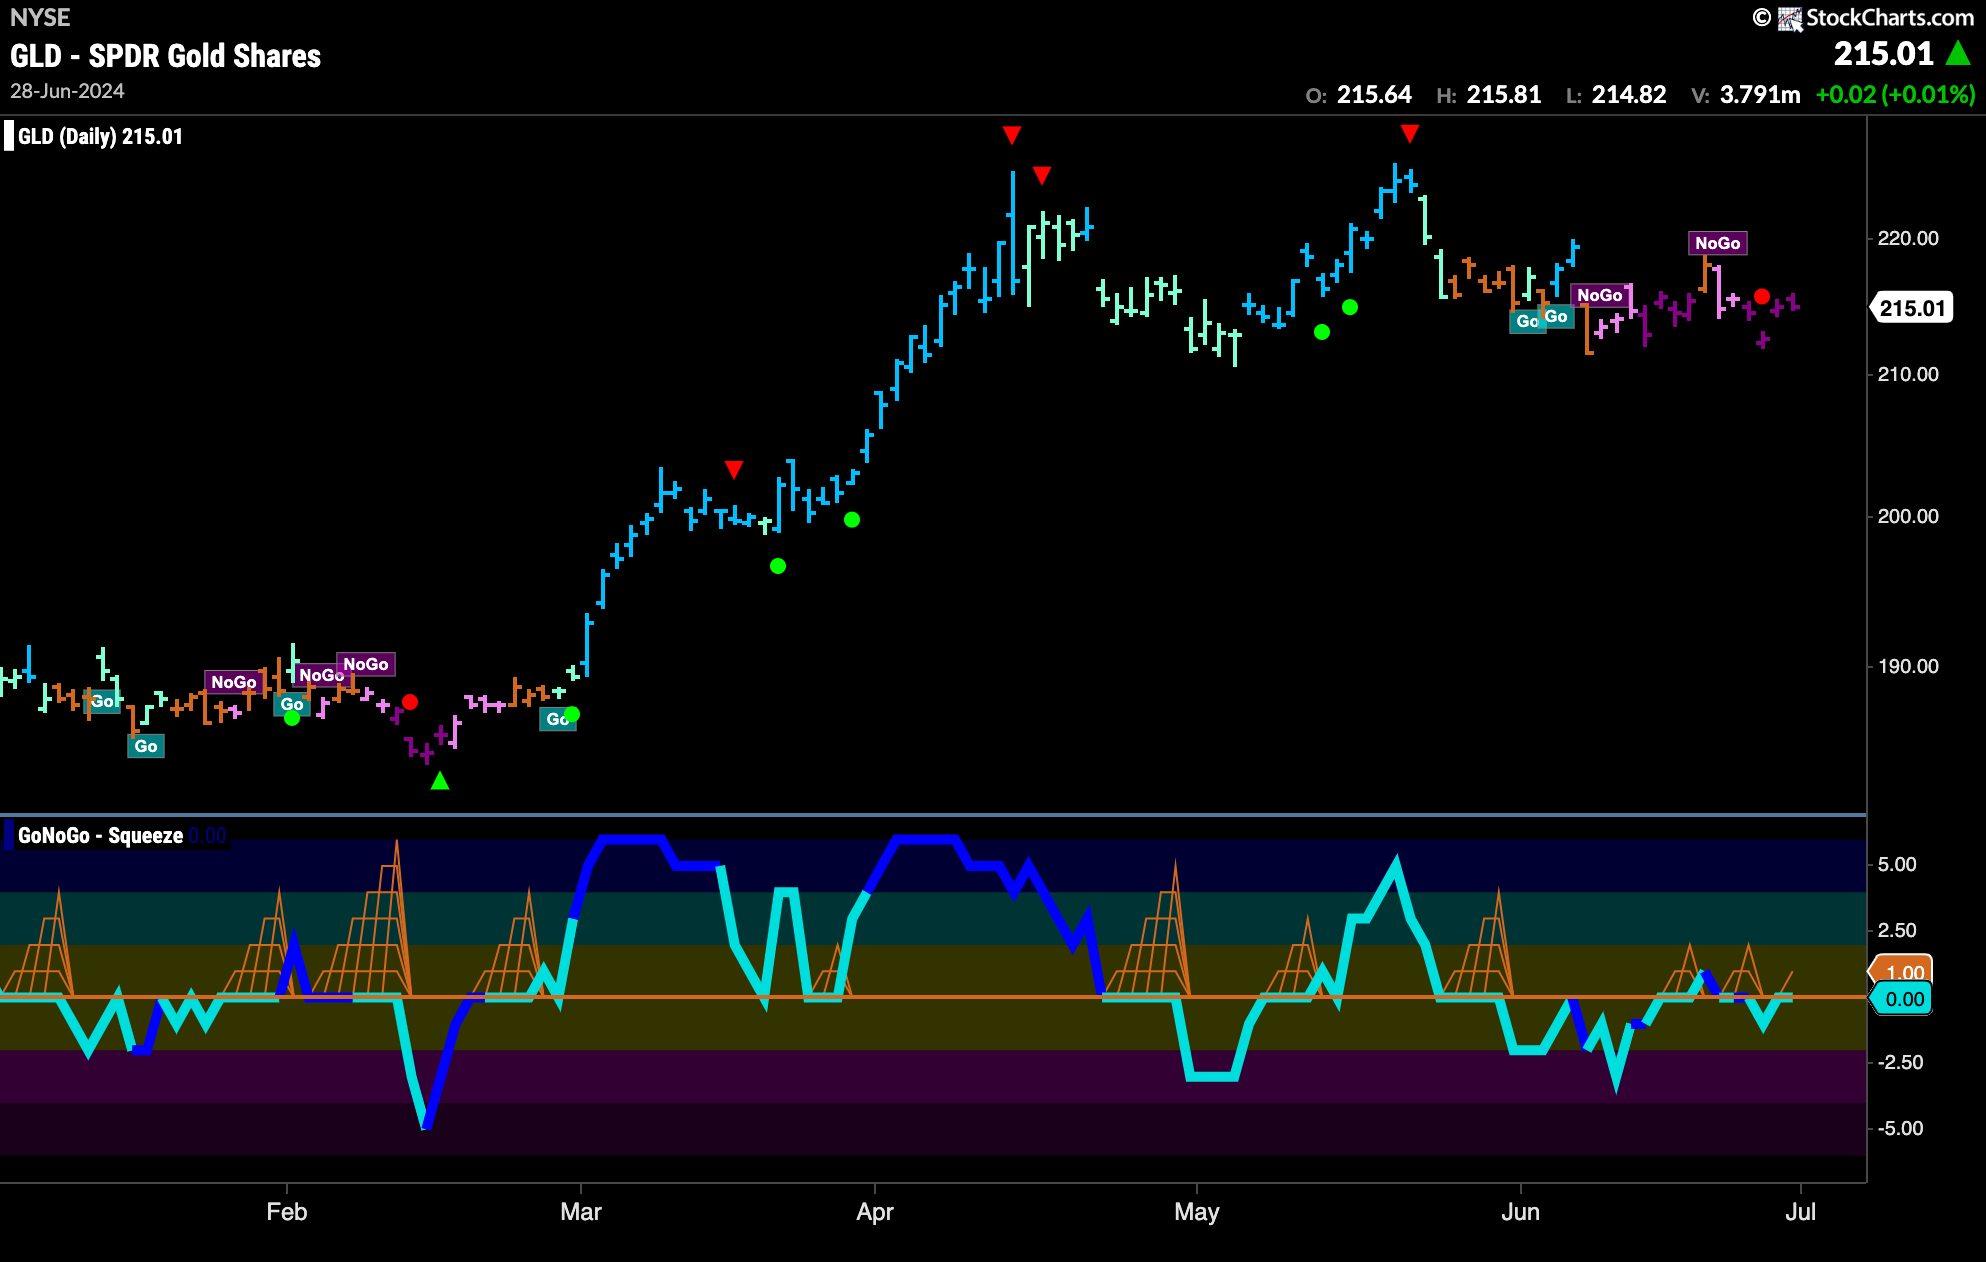
Gold Remains in “NoGo” Trend as Price Moves Sideways
The entire week was painted with “NoGo” bars and with the exception of Monday they were dark purple. We turn our eye to the oscillator panel and we can see that momentum has struggled to pick a direction. For several weeks, GoNoGo Oscillator has flipped above and below zero but has not strayed far from that level. When the market makes up its mind, that will help determine price’s next move.
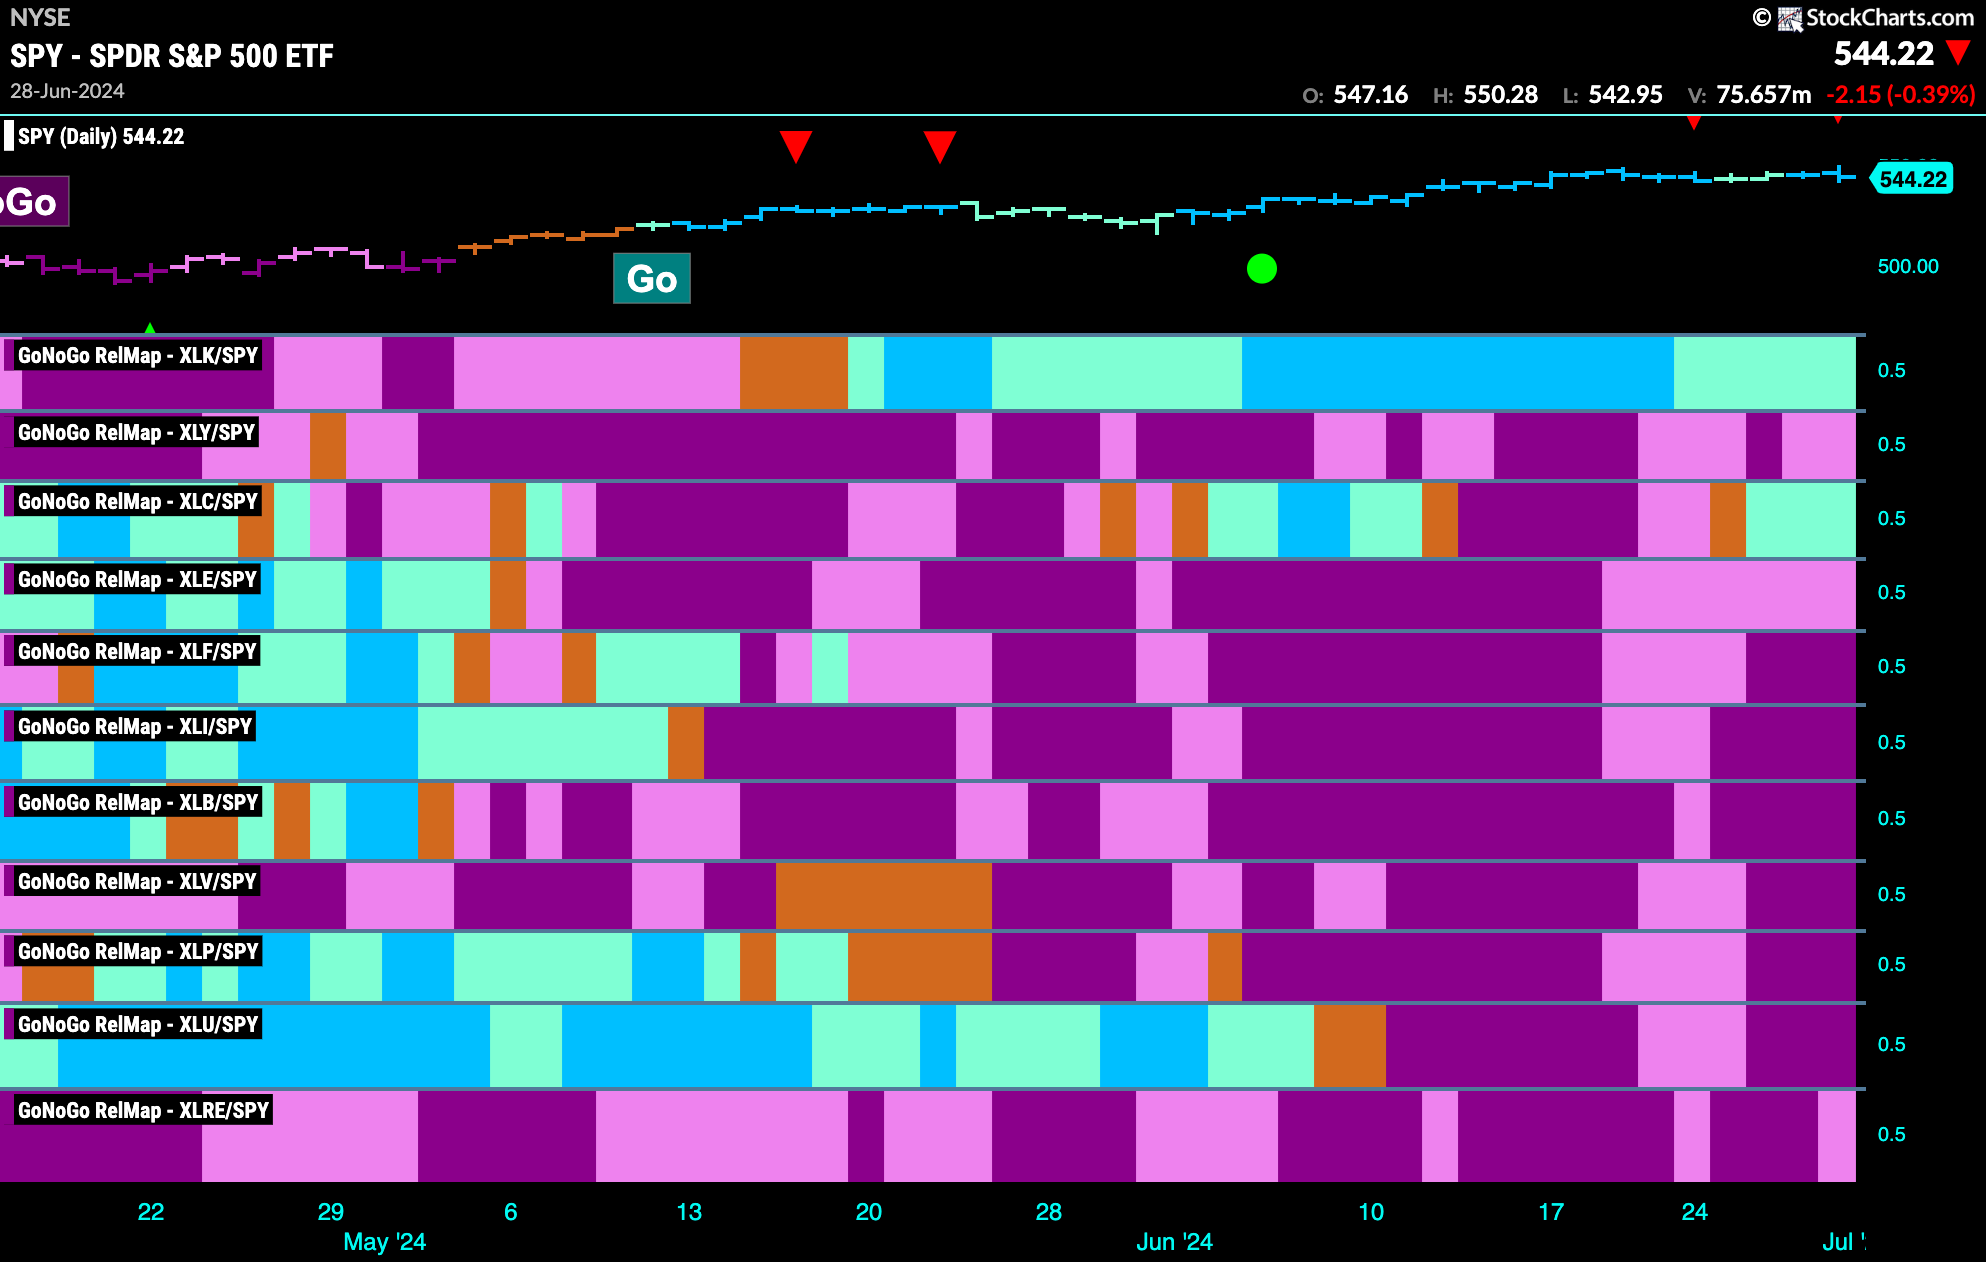
Sector RelMap
Below is the GoNoGo Sector RelMap. This GoNoGo RelMap applies the GoNoGo Trend to the relative strength ratios of the sectors to the base index. Looking at the map, we can see that only 2 sectors are outperforming the base index this week. $XLK, and $XLC are painting relative “Go” bars.
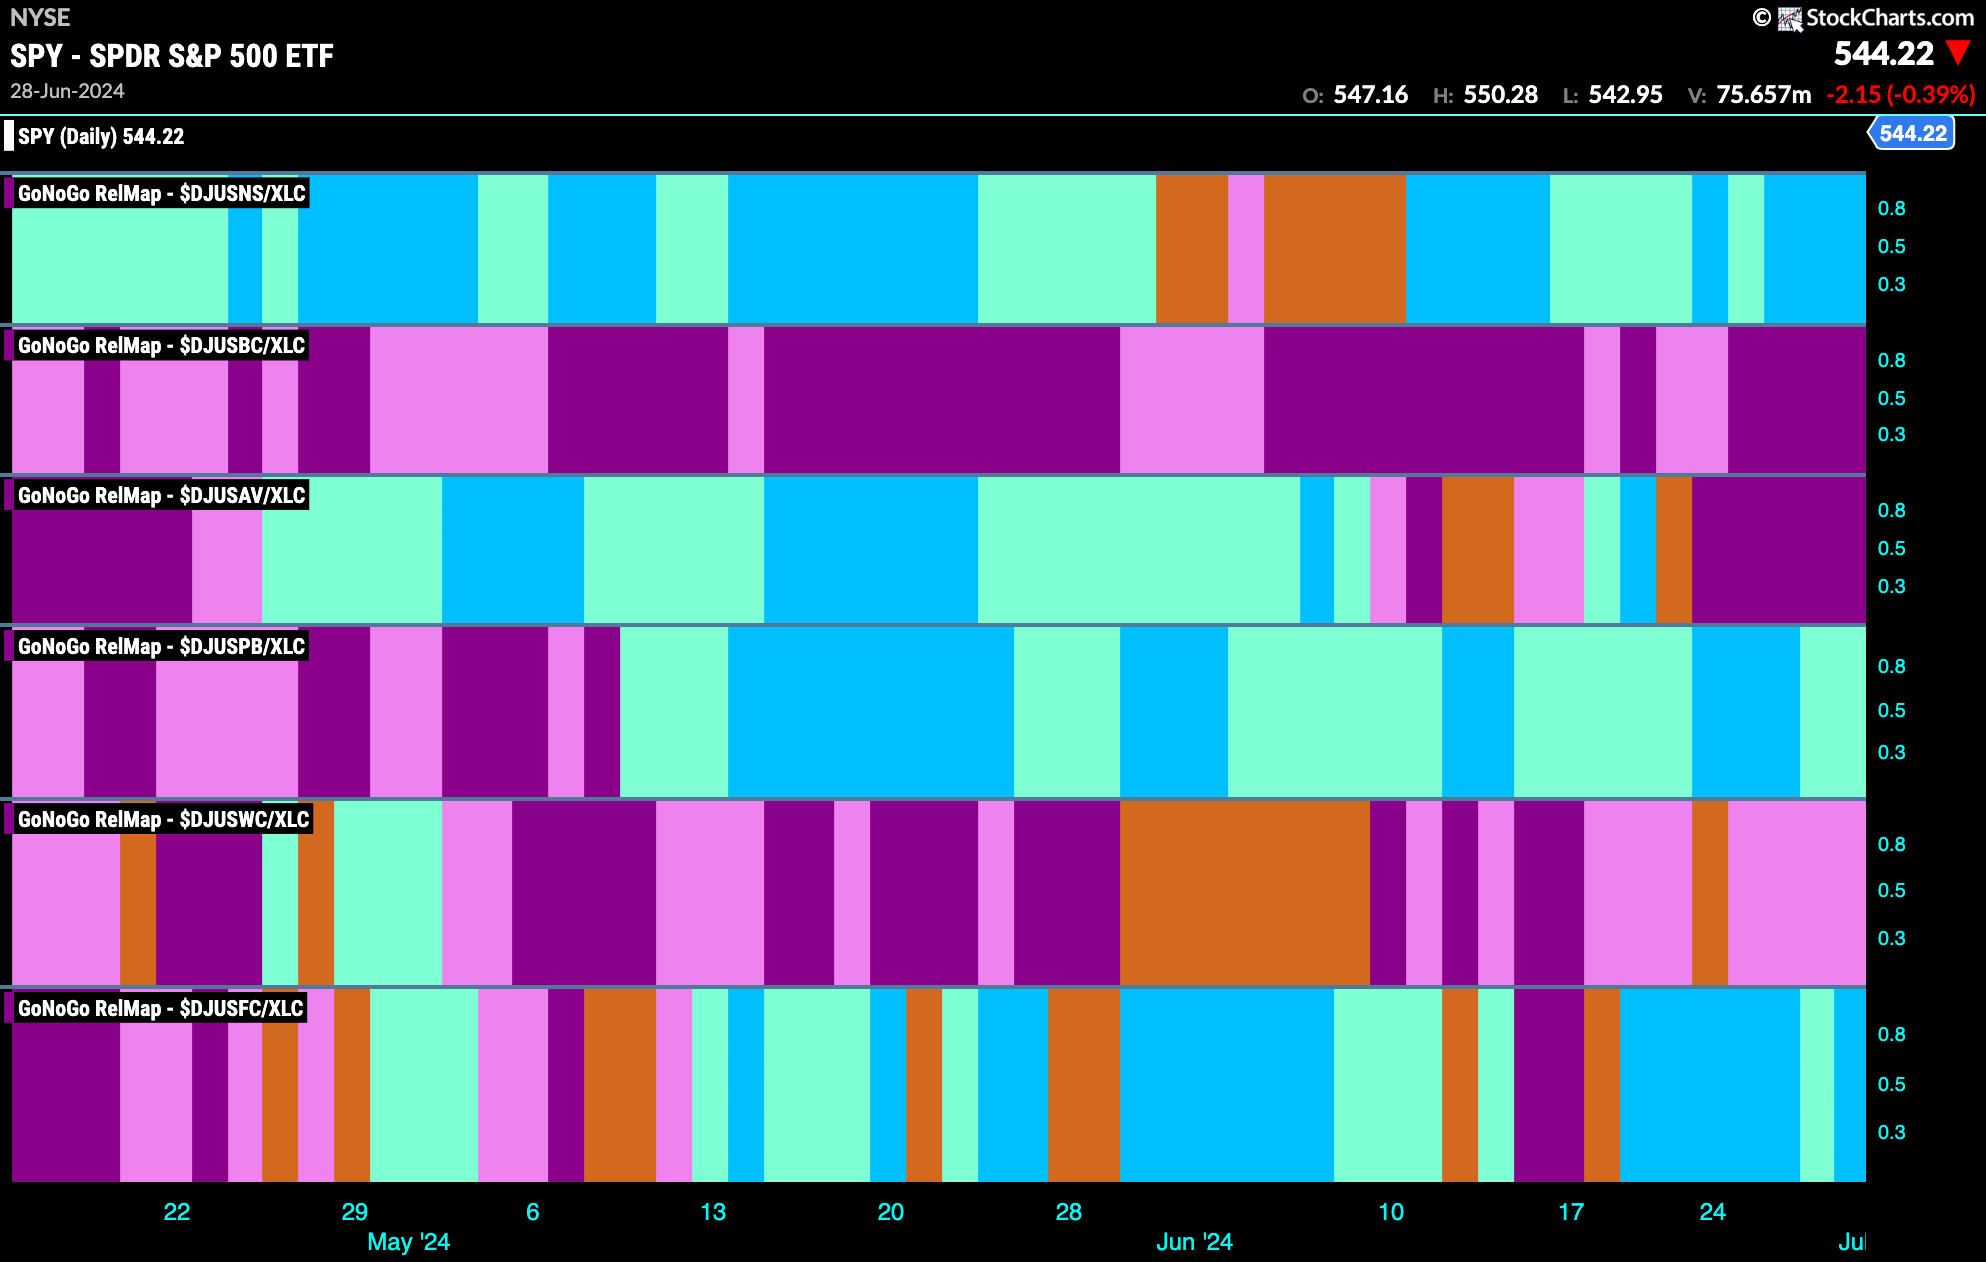
Communications Sub-Group RelMap
As we saw above, the communications sector has joined the technology sector and is painting relative “Go” bars. They are weak aqua “Go” bars but we can say that the sector is starting to outperform the $SPY on a relative basis. Below, we look at the sub groups of the communications sector to see what is driving that outperformance. 3 out of the 6 sub groups are in relative “Go” trends. In the top panel, we can see that the internet index continues to outperform.
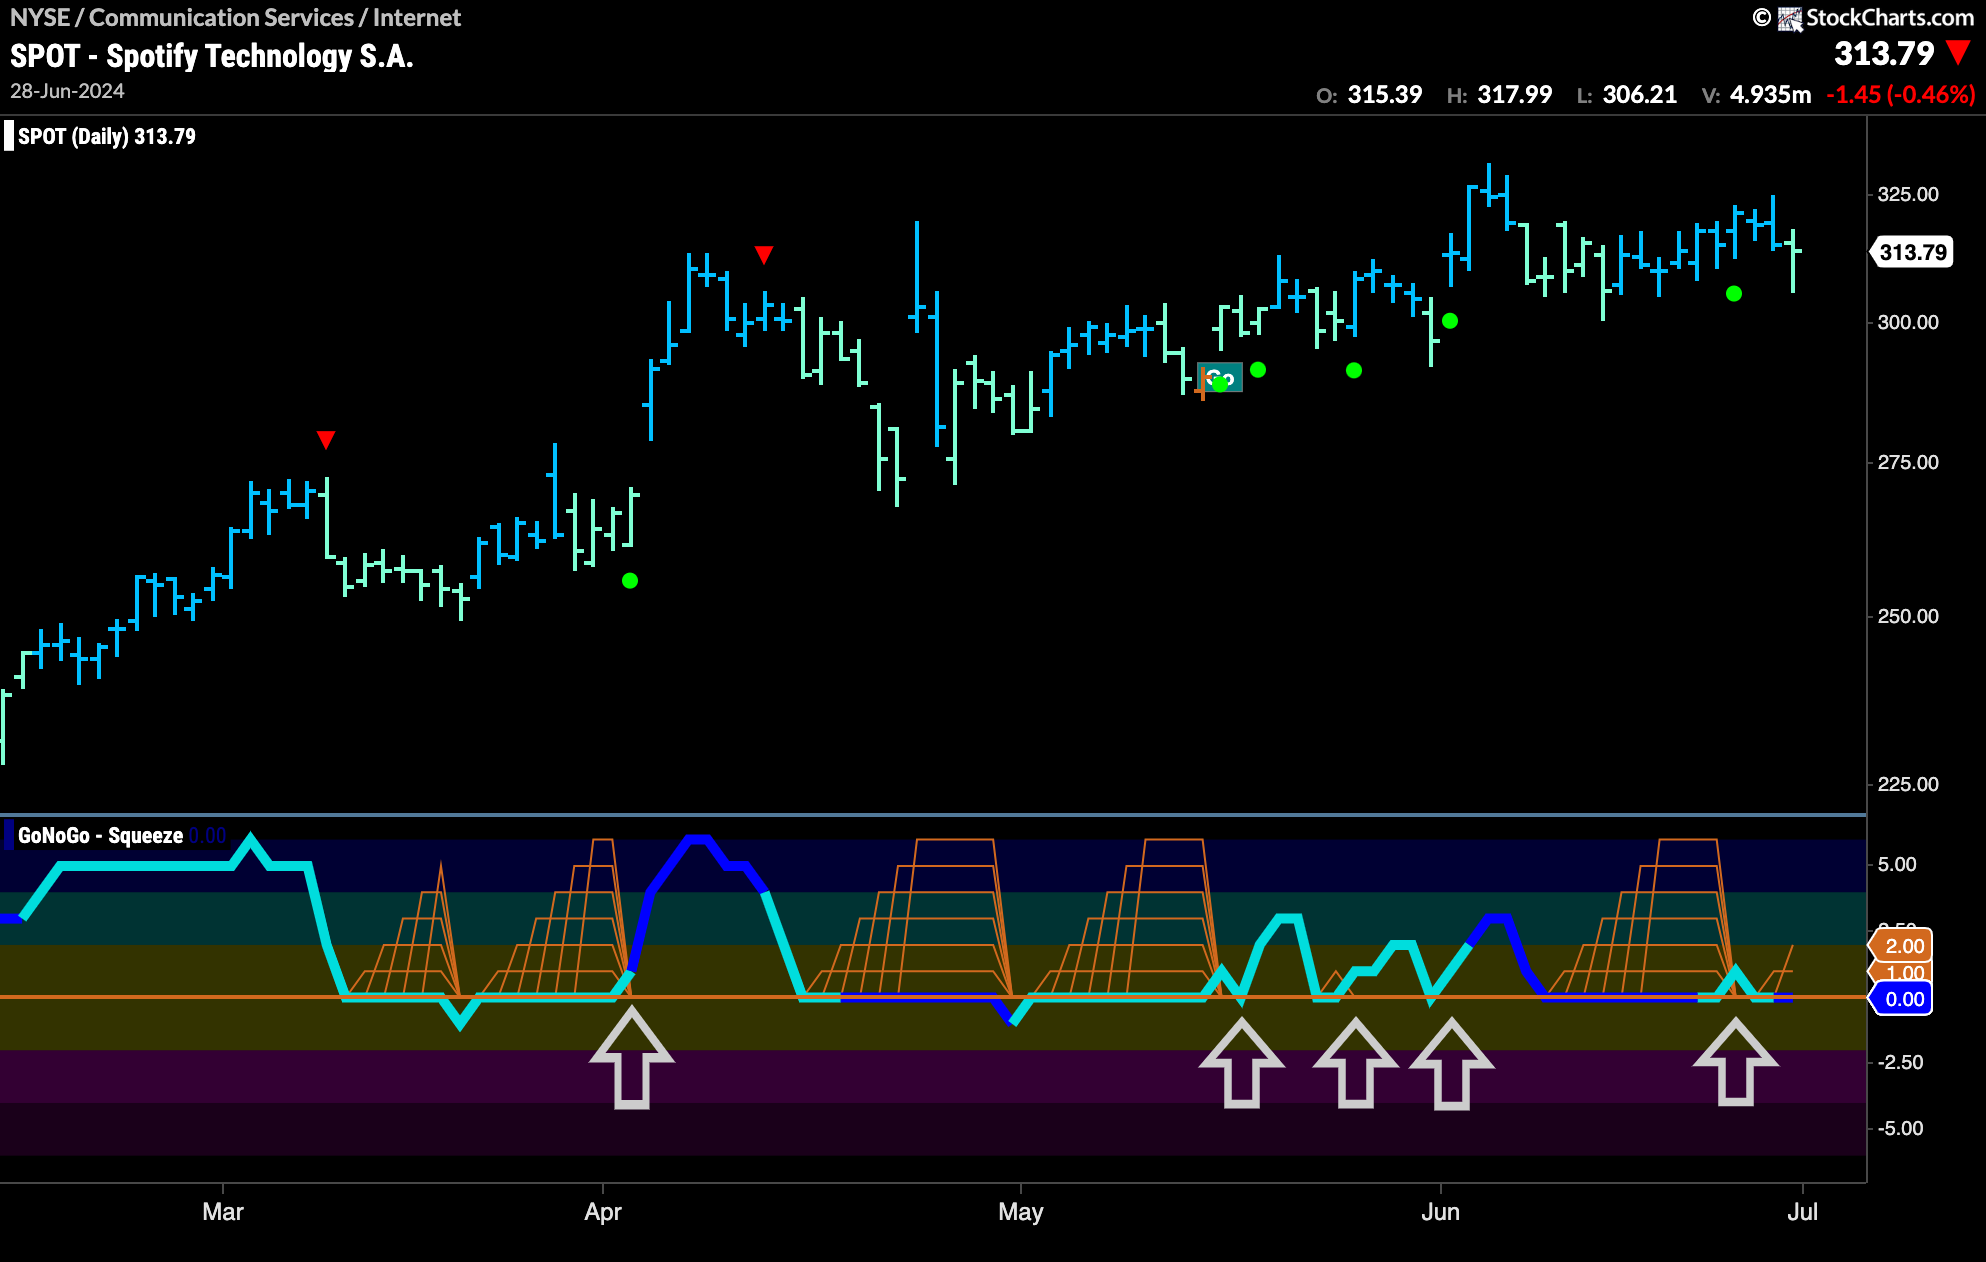
$SPOT Looking for Support in “Go” Trend
$SPOT has been in a “Go” trend for a long time. We can see that during the trend, GoNoGo Oscillator has been supported by the zero level. Each time it has fallen to that level it has found support. On several occasions, we have seen a Max GoNoGo Squeeze build. Each time, momentum has moved back into positive territory and the trend has continued. We are looking at a similar set up now. After a period of consolidation, GoNoGo Oscillator has broken out of a Max GoNoGo Squeeze having ridden the zero line for many bars. If the oscillator can rally back into positive territory we will look for price to set a new higher high.
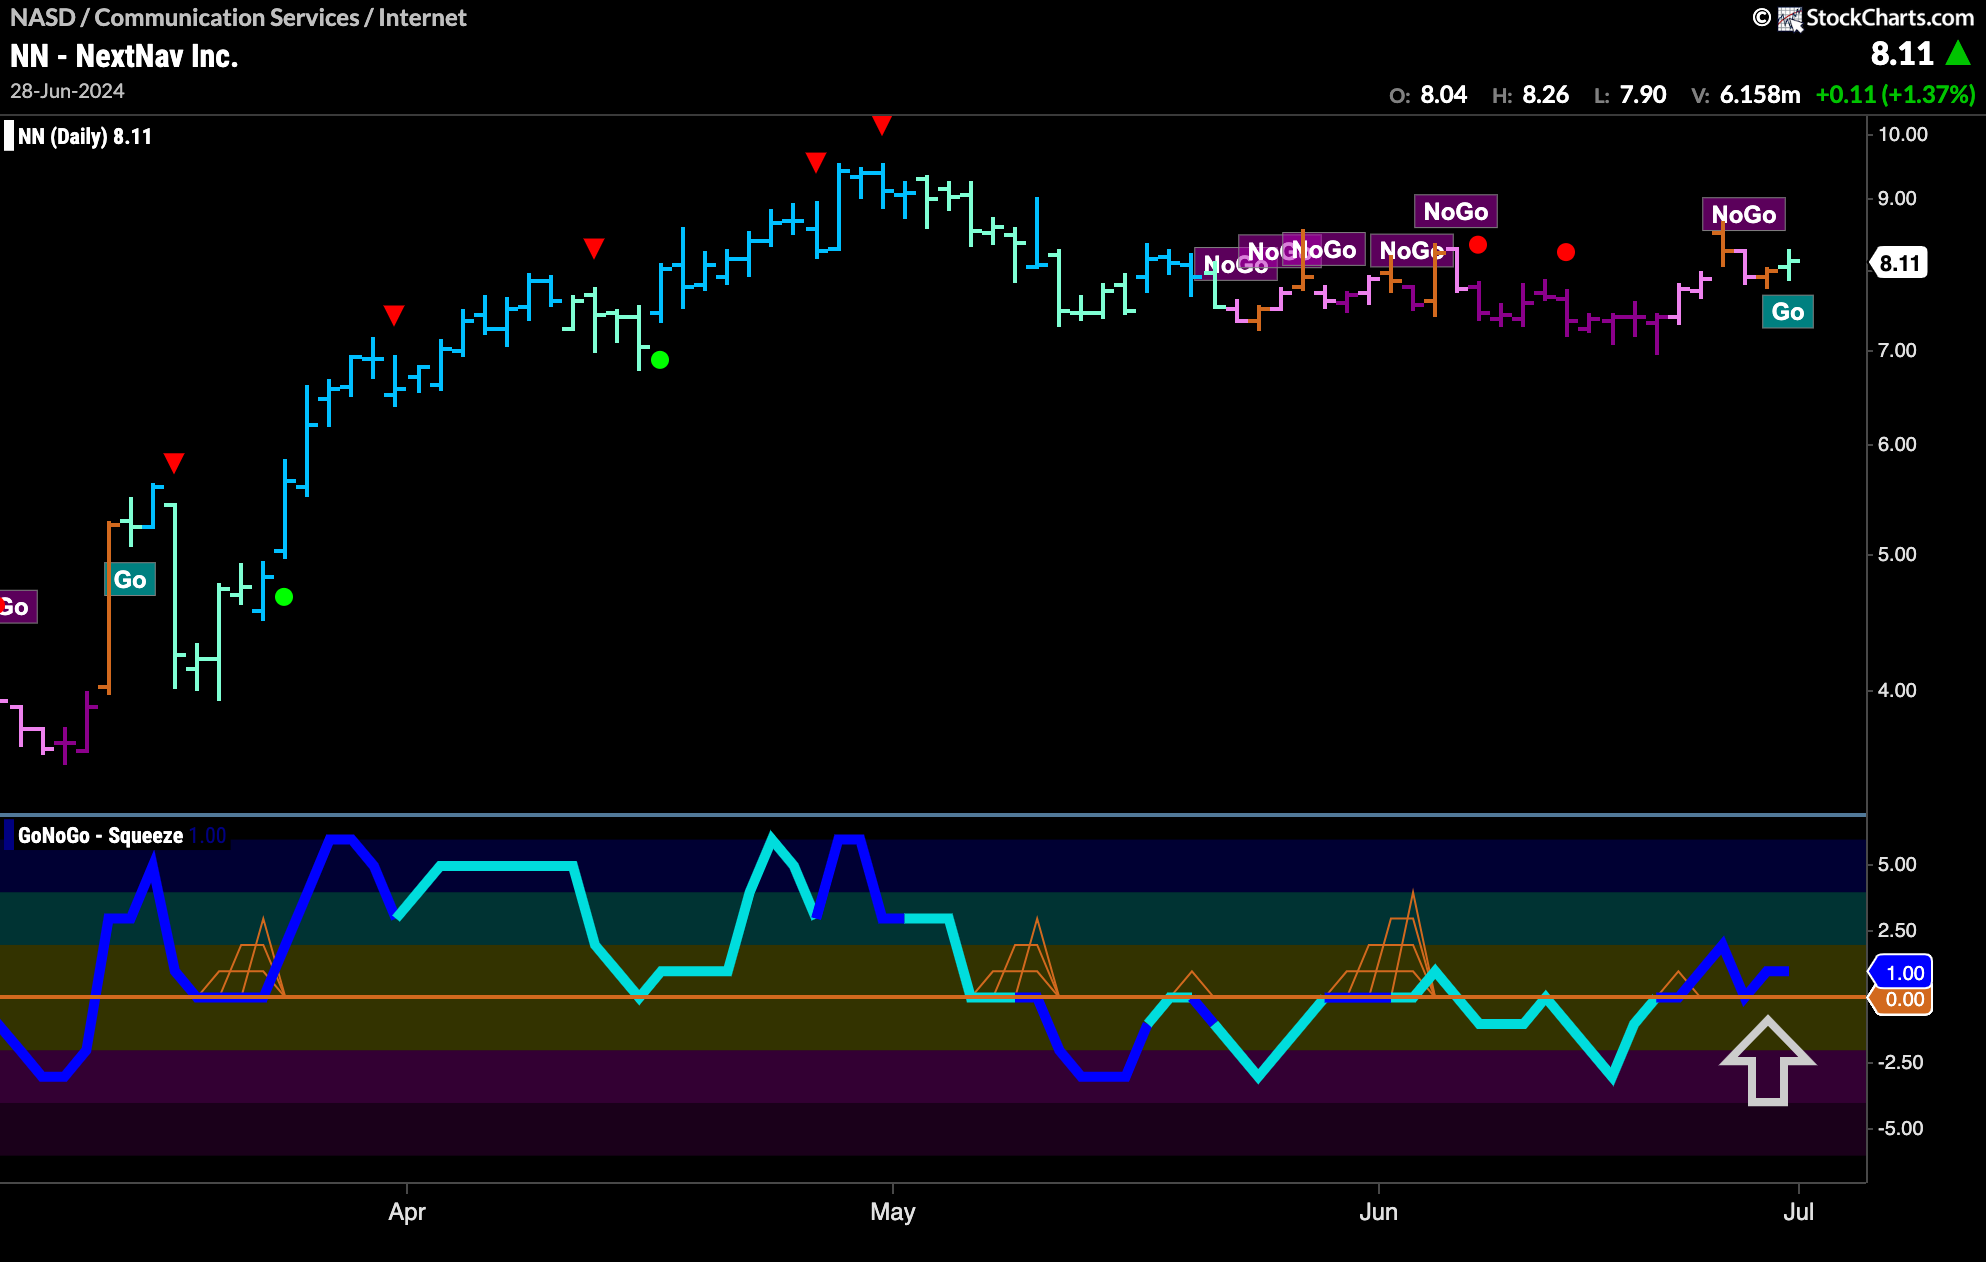
GoNoGo Trend Flags New “GO” for $NW
The price chart of $NW below shows that the weight of the evidence approach suggests trend change. Enough criteria are being hit in the background to allow the chart to paint a new aqua “Go” bar. If we turn our eye to the oscillator panel below we can see that momentum has started to find support at the zero level after having broken above that level several bars ago. Volume is heavy and we will look for price to move higher with momentum confirming the new “Go” trend in price.
